 Open Access Article
Creative Commons Attribution 3.0 Unported Licence
Continuous catalytic upgrading of ethanol to n-butanol and >C4 products over Cu/CeO2 catalysts in supercritical CO2†
James H.
Earley
a,
Richard A.
Bourne
a,
Michael J.
Watson
b and
Martyn
Poliakoff
*a
aSchool of Chemistry, The University of Nottingham, University Park, Nottingham, NG7 2RD, UK. E-mail: martyn.poliakoff@nottingham.ac.uk
bJohnson Matthey Technology Centre, POB 1, Belasis Ave, Billingham TS23 1LB, Cleveland, UK
First published on 9th March 2015
Abstract
n-Butanol (BuOH) often has superior properties as a bio-fuel compared to ethanol (EtOH). However finding sustainable sources of BuOH is proving difficult. In this paper, direct production of BuOH from EtOH is compared over custom-synthesized six Cu catalysts, supported on different solid acids. These catalysts were tested in a continuous flow supercritical CO2 (scCO2) reactor, and were found to catalyse the dehydrogenation, aldol condensation and hydrogenation steps of the so-called Guerbet reaction converting EtOH to BuOH. BuOH yields and selectivities were significantly different over the four catalysts. Cu on high surface area CeO2 showed the best activity for BuOH formation, with yields above 30% achieved with good selectivity. In addition high pressure CO2 is shown to have a positive effect on the reaction, possibly due to the redox cycle of Ce2O3 and CeO2.
Introduction
Interest in bio-fuels has increased considerably over recent years, particularly in view of concerns over climate change1 and energy security.2 One of the most common bio-fuels is EtOH which can be used as an additive to gasoline in unmodified gasoline engines,3 or in high concentrations in more specialist engines. However EtOH has a number of problems as a fuel, including its miscibility with water, corrosion, and low energy content per unit volume compared to gasoline.Therefore BuOH has advantages as a fuel, because it has a higher energy content than EtOH, lower water absorption and better miscibility with gasoline. Current gasoline engines need little or no modification to burn neat BuOH.4 Furthermore unlike EtOH, BuOH can be transported without major problems in current gasoline pipelines.
Industrially, BuOH is manufactured via the high pressure OXO process,5 where propylene is hydroformylated to butyraldehyde using syn-gas and a homogeneous rhodium catalyst; butyraldehyde is subsequently hydrogenated to BuOH. Alternatively BuOH can be produced from acetaldehyde via an aldol condensation, again followed by hydrogenation.6
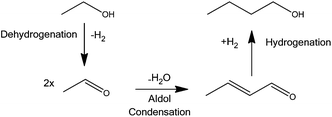
BuOH can also be produced from EtOH via a sequence of steps collectively known as the Guerbet reaction. This one-pot process involves conversion of a primary aliphatic alcohol into its β-alkylated dimeric alcohol with the loss of one equivalent of water via the aldol condensation and hydrogenation steps shown in Scheme 1. Koda et al. have used a homogeneous iridium catalyst in the presence of 1,7 octadiene and EtONa to promote the Guerbet reaction achieving turn over numbers (TONs) in excess of 1200 with 51% selectivity towards BuOH at 38% EtOH conversion.7 Recently Dowson et al. reported a range of ruthenium centred catalysts.8 In their system, a selectivity towards BuOH of 94% was achieved, but the conversion was only a little over 20%, with TONs only in the hundreds.8 The Guerbet reaction has also been demonstrated successfully in batch processes for a variety of different heterogeneous systems, including Li-exchanged Zeolites,9 MgO,10 Mg/Al mixed metal oxides11 and hydroxyapatites.12–14 Many of these systems, however, suffer from poor conversions or selectivities and require temperatures above 400 °C and long reaction times.15
This paper focuses on Cu catalysts and their use in the Guerbet reaction. In the dehydrogenation of EtOH over supported Cu catalysts, either EtOAc or acetaldehyde can be formed depending on the reaction conditions.16,17 In these systems the Cu catalysts show good stability and activity at temperatures above 400 °C.17,18 Cu has also been shown to successfully catalyse the hydrogenation of crotonaldehyde. In an attempt to synthesise BuOH, we have prepared catalysts by depositing Cu onto a range of supports capable of catalysing the aldol step. These include four acidic metal oxides (Al2O3, TiO2, silica/alumina SIRAL-40 from Sasol (Si/Al) and ZSM-5 zeolite) one high surface area (HSACeO2) and one regular surface area CeO2. In addition we have used supercritical CO2 (scCO2), as the reaction medium because scCO2 has been shown to improve selectivity and activity in several heterogeneously catalysed reactions, particularly in the present context, dehydrogenation,19 aldol condensation20 and hydrogenation.19,21
Experimental
Catalyst preparation
Cu(OAc)2 was mixed with water at 70 °C and small amounts of concentrated HNO3 were added in those cases where not all of Cu(OAc)2 dissolved. Sufficient catalyst support was then poured into the solution whilst stirring to give a final Cu loading of 10% by weight. 4 M K2CO3 was added until the solution had reached pH 9 and the suspension was then stirred for 1 h. The solid catalyst precursor was filtered under vacuum and washed with de-ionised water until the washings reached pH 7. The filtered solid was dried at 120 °C overnight and calcined in a furnace in air at 400 °C for 4 h.Catalyst characterisation
The catalysts were characterised using pXRD on a PANalytical X'pert Pro Multi-Purpose Diffractometer Fitted with a Cu Kα X-ray source at The University of Nottingham. Nitrogen physisorption measurements were performed on Micromeritics ASAP 2420 and Micromeritics Tristar 3000 instruments using the ASTM method D 4222-83 at Johnson Matthey Billingham. The surface area was calculated by the Brunauer–Emmett–Teller (BET) method. The samples were outgassed at 140 °C with a nitrogen purge for 1 hour prior to isotherm measurements. TPR measurements were taken at Johnson Matthey Billingham using an AMI 5200 Altamira instrument. Prior to loading the sample, the material was ground to a sieve fraction of 100–250 μm. 0.1 g of the sieved material was then loaded into a silica tube and the sample was then subjected to the following profile: firstly it was dried in 40 mL min−1 of argon at 140 °C for 1 hour, then cooled to room temperature. The ramp for the TPR was room temperature to 1000 °C at 10 °C min−1, held for 15 minutes and cooled to room temperature; the gas flow was 40 mL min−1 in 10% H2/Ar.Catalytic reactions
All experiments were carried out using a high pressure, automated continuous flow reactor with on-line GC analysis. The reactor, described in detail previously,20 is designed to record the effect on product yield of varying one reaction parameter (e.g. temperature, pressure, flow rate, etc.) at a time, (a diagram of the rig is included in the ESI†).In a typical experiment, a tubular reactor (156 mm long × 3.525 mm internal diameter) was filled with catalyst and sealed into the apparatus. The catalysts were then reduced for 1 hour in a 5% H2/N2 stream at 200 °C. After this, the reactor was cooled to 150 °C, the system pressure was set via the back pressure regulator, and the flows of EtOH and CO2 were initiated. For all experiments, the flow rates were 1 mL min−1 CO2 and 0.05 mL min−1 EtOH; this was consistent with an LHSV of 1.97 h−1. The temperature ramp for the catalytic reactions was 150–350 °C at 0.3 °C min−1.
The product stream was analysed with a Shimadzu GC-17A. The GC was fitted with a SPB-1701 column. Quantification was performed by integration of the peak areas; response factors and conversions were calculated by the internal normalisation method.22 Direct sampling utilising an inline sample loop downstream of the reactor before depressurisation ensured that all volatile materials analysed.
Yields conversions and selectivities were calculated as carbon yields, using the same method used by Ogo et al.15via the equation below where C wt is the% weight of carbon in the molecule.
Unfortunately turn over frequencies (TOFs) could not be calculated; due the bi-functional nature of the catalysts it is not possible to define exactly what constitutes an active site i.e. Cu surface area relating to the hydrogenation/dehydrogenation reactions or the support that is catalysing the aldol step. In addition, for the Cu/CeO2 catalysts, Cu surface area measurements could not be obtained because the standard procedure to measure Cu surface area is to use N2O frontal chromatography.23 This method cannot be used Cu/CeO2 catalysts as N2O is not only reduced by Cu but also by the CeO2 support.
Results and discussion
Catalyst characterisation
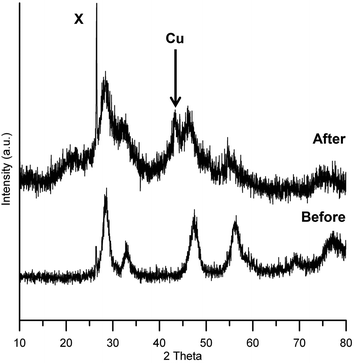
The pXRD patterns for Cu/HSACeO2 before and after reaction are shown in Fig. 1. The diffraction pattern for unreduced Cu/HSACeO2 shows peaks at 27, 46 and 56 2θ° corresponding to CeO2 phases; these are broad indicating that the support is amorphous. Although the unreduced catalyst is almost certainly present as CuO, no peaks assignable to CuO are detected in the pattern suggesting that the crystallites are small and highly dispersed. After reduction, the peaks of CeO2 become broader, possibly as a result some of the CeO2 having been reduced to Ce2O3 reducing the crystallinity of the support. Only one small peak at 43 2θ° can be assigned to a Cu metal phase, implying that, after reduction, the Cu crystallites have maintained their small size and good dispersion on the catalyst.The Cu/HSACeO2 had a comparatively large surface area and pore volume due to the nature of the CeO2 support. The BET surface area of the catalyst was 178.3 m2 g−1, the pore volume was [0.995 ads] cm3 g−1 0.13 cm3 g−1 and the average pore diameter 30 Å.
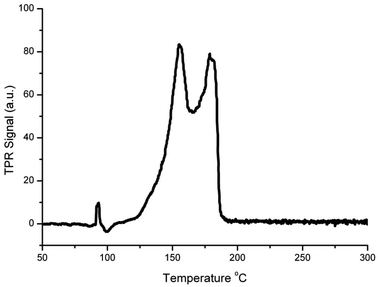
Fig. 2 shows the TPR profile of the Cu/HSACeO2 catalyst. Two peaks can be seen at 155 and 178 °C. In accordance with the previous literature,24,25 the peak at 155 °C is assigned to CuO interacting strongly with the CeO2 support and the peak at 178 °C to larger CuO particles with a weaker interaction with the CeO2.
BuOH production
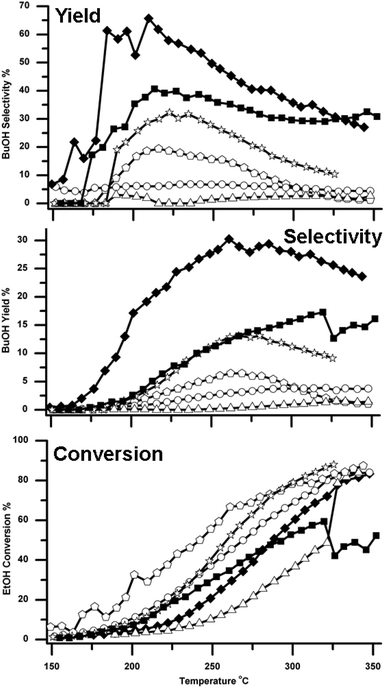
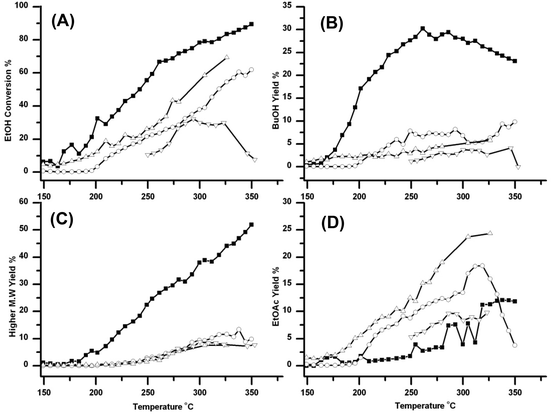
BuOH formation was observed over all six supported Cu catalysts. However the different catalysts showed significantly different selectivities and yields for BuOH, as shown in Fig. 3 and Table 1. It can be seen that both of the two CeO2 supported catalysts performed better than the other three catalysts. Cu supported on the high surface area CeO2 (Cu/HSACeO2) gave the best performance with 30% BuOH yield with a selectivity of 45%. This high yield was observed at 250 °C, a temperature low compared to those previously reported for reactions over MgO and hydroxyapatite catalysts.10,12,14 Over an MgO catalyst,10 the maximum BuOH yield achieved was 18% and this was only achieved at the high temperature of 450 °C. Using hydroxyapatite based catalysts in a flow system, Ogo et al. reported good selectivity towards BuOH of 86.4% at 300 °C; the EtOH conversion, however, was only 11.3%. Using a Cu-Mg/Al mixed metal oxide catalyst in a batch system at 260 °C for 100 hours Marcu et al. achieved BuOH formation with 80% selectivity; however EtOH conversion was again poor at 8%.26| Catalyst | Temperature | ||||||||
|---|---|---|---|---|---|---|---|---|---|
| 190 °C | 260 °C | 330 °C | |||||||
| Yield (%) | Conv (%) | Sel (%) | Yield (%) | Conv (%) | Sel (%) | Yield (%) | Conv (%) | Sel (%) | |
| a Yields, conversions and selectivities were calculated as carbon yields from GC data using the equations described in the Experimental section. | |||||||||
| Cu/Al 2 O 3 | 0 | 7 | 6 | 3 | 48 | 7 | 3 | 82 | 5 |
| Cu/ZSM-5 | 0 | 3 | 3 | 0 | 15 | 2 | 2 | 82 | 2 |
| Cu/CeO 2 | 2 | 5 | 27 | 13 | 39 | 35 | 14 | 47 | 31 |
| Cu/HSACeO 2 | 10 | 16 | 60 | 30 | 67 | 45 | 26 | 84 | 31 |
| Cu/TiO 2 | 1 | 6 | 19 | 13 | 53 | 25 | 9 | 9 | 10 |
| Cu/Si/Al | 1 | 3 | 9 | 6 | 30 | 14 | 2 | 78 | 2 |
In the Cu/HSACeO2 system here, high BuOH yields were maintained across the temperature range 200–350 °C. At 200 °C, the BuOH selectivity approached 70% whilst still giving a yield of ca. 20%. Good yields were also observed over the lower surface area CeO2 catalyst (Cu/CeO2), which gave 17% BuOH yield with a selectivity of 29% at 313 °C. In addition, over the Cu/TiO2 catalyst, significant BuOH formation was also observed, most notably with yields of around 13% at 270 °C.
Cu/CeO2 catalysts have been widely reported for use in the Water Gas Shift reaction to generate H2 and CO2 from H2O and CO.24,27 In these systems the Cu/CeO2 catalysts show good stability at high reaction temperatures (300–450 °C) in a H2 environment similar to the experiments presented here.28 At these temperatures other supported Cu catalysts have been shown to deactivate quickly due to Cu sintering, which is a major cause of Cu catalyst deactivation.29 There may be some stabilisation effects in the present system which may be why these Cu/CeO2 catalysts are so active across the temperature range of the reaction.
With the other three catalysts, the BuOH yields were much lower; over Cu/Al2O3, BuOH was formed with a maximum yield of only 4% at 300 °C and a selectivity of just 5%. Cu/Si/Al, gave a maximum n-BuOH yield of 6% with 12% selectivity at 270 °C. Cu/ZSM-5 was the poorest performing catalyst and gave a maximum yield of only 1%, coupled with the poorest EtOH conversion.
Formation of other products
Fig. 4 shows how the formation of other products varies over the six catalysts. These data are important because the relative yields of these products help rationalize the observed activity of these catalysts for the production of BuOH. The additional products include acetaldehyde, EtOAc, diethyl ether (DEE) and higher molecular weight >C4 products, see Fig. 4A–4H respectively.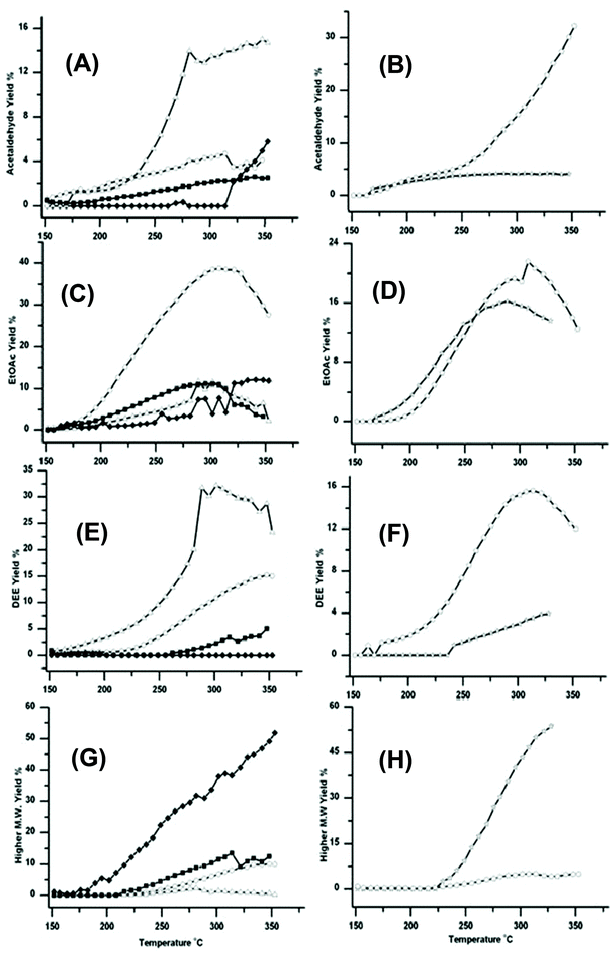 | ||
Fig. 4 Traces showing how the four catalysts gave very different yields for Acetaldehyde (A)/(B) EtOAc (C)/(D) DEE (E)/(F) and Higher molecular >C4 weight products (G)/(H). The traces are marked as in Fig. 1; ○ Cu/Al2O3, △ Cu/ZSM-5 SAR-80, ☆ Cu/TiO2, ![[pentagon open]](https://www.rsc.org/images/entities/char_e1c1.gif) Cu/Si/Al, ■ Cu/CeO2 and ◆ Cu/HSA CeO2. DEE formation was greatest over Cu/ZSM-5 and EtOAc greatest over Cu/Al2O3. However relatively large amounts of higher molecular weight products were formed over Cu/HSACeO2; these higher products are also potentially useful in fuels. Cu/Si/Al, ■ Cu/CeO2 and ◆ Cu/HSA CeO2. DEE formation was greatest over Cu/ZSM-5 and EtOAc greatest over Cu/Al2O3. However relatively large amounts of higher molecular weight products were formed over Cu/HSACeO2; these higher products are also potentially useful in fuels. | ||
Cu/ZSM-5 which gave the lowest yield of BuOH gives the highest yield of acetaldehyde and DEE. This suggests that (i) the ZSM-5 support was catalysing the dehydration of EtOH to DEE as has previously been reported,30 and (ii) ZSM-5 was relatively inefficient at catalysing the aldol step in the Guerbet reaction. Therefore any acetaldehyde formed in the first step is not reacting further to form crotonaldehyde and subsequently BuOH. The Cu/Al2O3 catalyst also gave rather low yields of BuOH, but it did give high yields of EtOAc and intermediate yields of DEE. This suggests that, over this catalyst, rather than catalysing the dehydrogenation to form acetaldehyde, the Cu/Al2O3 support was promoting the dehydrogenation to EtOAc. The dehydrogenation of EtOH to EtOAc, has been well documented in the literature for a variety of supported Cu catalysts.16 In addition to the formation of EtOAc the Al2O3 is also catalysing the competing reaction to form DEE, observed previously,31 but much less efficiently than Cu/ZSM-5.
The Cu/Si/Al catalyst led mainly to the formation of acetaldehyde, with a yield of 37% at 350 °C; there was also significant amounts of DEE and EtOAc formed. Again, the results suggest that this support has poor activity for catalysing the aldol condensation to crotonaldehyde.
The two CeO2 supported catalysts generate only modest yields of acetaldehyde, EtOAc and DEE, but the Cu/HSACeO2 catalyst produces significantly greater yields of higher molecular weight products (beyond C4 alcohols and esters), which are likely to be formed through multiple aldol condensations on the surface of the support. Production of these higher molecular weight products is not necessarily detrimental because, unlike EtOAc, DEE or acetaldehyde, they also have potential value in fuels.
The difference in activity between the two CeO2 supports can be attributed to the higher activity of the HSACeO2 support for catalysing the aldol step compared to the lower surface area CeO2 support. This difference is shown by the much higher yields of both BuOH and higher molecular weight products over the Cu/HSACeO2 support. This is possibly due to the amorphous nature of the HSACeO2 support leading to a greater number of acidic sites on the surface.
The Cu/TiO2 catalyst was particularly active for the formation of higher molecular weight products with <55% yield at 325 °C. In addition EtOAc formation was also observed. These observations are consistent with the work of Luo et al.32 who have studied the aldol reaction over Degussa® P25 TiO2 and observed large amounts of chain propagation beyond crotonaldehyde through further aldol condensations.
Effect of CO2 on formation of BuOH
All of the experiments described above were carried out in the presence of high pressure CO2. Under such circumstances, one question always arises. What, if any, is the role of the CO2 in the reaction? In order to answer this question, the reaction was run in the absence of CO2 at atmospheric pressure, 30 and 100 bar, with the pressure being generated using the back pressure regulator. Fig. 5 summarises these results. From the Figure it can be seen that (i) reasonable EtOH conversion occurs at atmospheric pressure in the absence of CO2 but the conversion drops dramatically as the pressure increases. This is quite surprising because, at constant mass flow of EtOH, the residence time will increase with pressure. (ii) The highest conversion is obtained in the presence of CO2, and a pressure of CO2 has an effect on the product distribution. (iii) Relatively little BuOH is formed in the absence of CO2. (iv) Pressure has little effect on the formation of higher esters, but the yield increases dramatically in the presence of CO2 and (v) in the absence of CO2 there is a relatively high yield of EtOAc at atmospheric pressure over the catalyst. This yield drops substantially as the pressure is increased; however 100 bar of CO2 has little further effect on yield of EtOAc.In addition to the experiments performed in the absence of CO2, the effect of the pressure of CO2 was investigated (the results are shown in the ESI Fig. 2†). The pressure of CO2 appears to have little effect on the reaction with yields and selectivities for n-BuOH similar at all of the pressures tested; 70, 100 and 180 bar. 100 bar is the most active system pressure with the best EtOH conversion and BuOH yield. Pressure and temperature will affect the density of the system and therefore the solvating properties of CO2 towards both products and reactants. Pressure is also likely to affect the equilibrium of the reaction; higher pressure should favour the aldol condensation reaction due to Le Chatelier's principle, although this appears to have had a small effect in this case.
The effect of CO2 has not been investigated further by us but the high rate of aldol condensation in the presence of CO2 could be due to CO2 and H2O forming H2CO3 and enhancing the acidity of the catalyst. In addition, the interaction of CO2 with CeO2 has been well documented in the literature,33 because CO2 has been shown to re-oxidise CeO2−x at low temperatures; this is of great importance catalytically, as oxygen from the bulk of CeO2 can migrate onto the supported metal particle and oxidise adsorbed species on the metal.34 Thermodynamically the reaction, Ce2O3 + CO2 → 2 CeO2 + CO, is favourable at 25 °C. Sharma et al.35 demonstrated this phenomenon using a Pd/CeO2 catalyst with pulsed flow experiments at 350 °C. By alternating pulses of CO and CO2 they showed that CO is produced when CO2 is pulsed over reduced CeO2. Staudt et al.36 studied well-defined CeO2−x films, supported on Cu (111) under UHV conditions, using resonant photoelectron spectroscopy to monitor the change in oxidation state of the CeO2 surface as a function of CO2 exposure and temperature. They discovered that oxidation of CeO2−x by CO2 occurs, (i) at room temperature, (ii) without any supported metal co-catalysts and (iii) in the absence of surface hydroxyl groups or water.
This suggests that CO2 may indeed be playing an active role in the generation of aldol products (BuOH and higher molecular weight esters) in the EtOH + Cu/HSACeO2 experiments, particularly because these products are formed in only trace amounts the absence of CO2 in the reaction mixture. Therefore it is quite possible that CO2 is regenerating the Ce4+ species which are lost both during catalyst reduction and by reaction with the H2 that is generated in the dehydrogenation step, particularly because Ce4+ is active in the aldol condensation.37 The pXRD pattern of the Cu/HSACeO2 catalyst after reduction (Fig. 1) shows that it has become more amorphous in nature, consistent with the formation of Ce2O3 phases formed as a result of the hydrogen treatment.38 Barteau et al. reduced CeO2 in pure hydrogen at 400 °C and observed large amounts of Ce3+ using XPS.39 Le Normand et al. showed using X-ray absorption spectroscopy that during CeO2 reduction the amount of Ce3+ species formed was proportional to the surface area. The larger surface area CeO2 the higher the amount of reduction to Ce2O3. Addition of Cu to CeO2 is shown to reduce the redox potential of both Cu and CeO2.40 This has been exploited for water gas shift catalysis. Using Cu/CeO2 catalysts a complex relationship between Cu and the oxygen vacancies on ceria have been observed, this produces a catalyst that is much more active at lower temperatures.27
Conclusions
In this paper, the continuous upgrading of EtOH to BuOH and higher esters has been demonstrated with better results both in terms of conversion and selectivity than in most of the recently reported batch or continuous reactions. The results presented here are probably the consequence of the increased activity of a Cu/HSACeO2 catalyst for the aldol condensation step in the reaction sequence known as the Guerbet reaction. In addition, the presence of CO2 has a positive effect on the outcome of the reaction, possibly by enhancing surface acidity but more probably by re-oxidising the Ce without affecting the Cu. A secondary factor may be the smaller crystallite size of the Cu particles on the high surface area catalyst with a corresponding decreased tendency to sinter at higher temperatures. A more detailed engineering analysis would be required to decide whether high pressures of CO2 could be cost effective in a large scale commercial process to upgrade EtOH, but it is worth noting that fermentation to produce EtOH involves the co-production of CO2. Overall the significance of this work is that it demonstrates that relatively high yields of BuOH can be obtained by upgrading EtOH using comparatively simple and uncomplicated catalysts.Acknowledgements
We thank Johnson Matthey, the EPSRC and the University of Nottingham for funding. We would also like to thank Mark Guyler, Richard Wilson and Peter Fields for their technical support at the University of Nottingham. We thank Michelle Gillespie at the Johnson Matthey for her help in catalyst synthesis and in the TPR and BET measurements.References
- L. Ryan, F. Convery and S. Ferreira, Energy Policy, 2006, 34, 3184–3194 CrossRef PubMed.
- A. Demirbas, Energy Convers. Manage., 2009, 50, 2239–2249 CrossRef CAS PubMed.
- T. W. Patzek, Crit. Rev. Plant Sci., 2004, 23, 519–567 CrossRef CAS.
- P. Dürre, Biotechnol. J., 2007, 2, 1525–1534 CrossRef PubMed.
- E. Billig and D. R. Bryant, in Kirk-Othmer Encyclopedia of Chemical Technology, John Wiley & Sons, Inc., 2000 Search PubMed.
- A. T. Nielsen and W. J. Houlihan, Org. React., 1968, 1, 1–438 Search PubMed.
- K. Koda, T. Matsu-ura, Y. Obora and Y. Ishii, Chem. Lett., 2009, 38, 838–839 CrossRef CAS.
- G. R. M. Dowson, M. F. Haddow, J. Lee, R. L. Wingad and D. F. Wass, Angew. Chem., Int. Ed., 2013, 52, 9005–9008 CrossRef CAS PubMed.
- C. Yang and Z. Y. Meng, J. Catal., 1993, 142, 37–44 CrossRef CAS.
- A. S. Ndou, N. Plint and N. J. Coville, Appl. Catal., A, 2003, 251, 337–345 CrossRef CAS.
- S. Ordóñez, E. Díaz, M. León and L. Faba, Catal. Today, 2011, 167, 71–76 CrossRef PubMed.
- T. Tsuchida, S. Sakuma, T. Takeguchi and W. Ueda, Ind. Eng. Chem. Res., 2006, 45, 8634–8642 CrossRef CAS.
- T. Tsuchida, J. Kubo, T. Yoshioka, S. Sakuma, T. Takeguchi and W. Ueda, J. Catal., 2008, 259, 183–189 CrossRef CAS PubMed.
- S. Ogo, A. Onda and K. Yanagisawa, Appl. Catal., A, 2011, 402, 188–195 CrossRef CAS PubMed.
- S. Ogo, A. Onda, Y. Iwasa, K. Hara, A. Fukuoka and K. Yanagisawa, J. Catal., 2012, 296, 24–30 CrossRef CAS PubMed.
- S. W. Colley, J. Tabatabaei, K. C. Waugh and M. A. Wood, J. Catal., 2005, 236, 21–33 CrossRef CAS PubMed.
- F.-W. Chang, H.-C. Yang, L. S. Roselin and W.-Y. Kuo, Appl. Catal., A, 2006, 304, 30–39 CrossRef CAS PubMed.
- E. Santacesaria, G. Carotenuto, R. Tesser and M. Di Serio, Chem. Eng. J., 2012, 179, 209–220 CrossRef CAS PubMed.
- J. R. Hyde, P. Licence, D. Carter and M. Poliakoff, Appl. Catal., A, 2001, 222, 119–131 CrossRef CAS.
- J. G. Stevens, R. A. Bourne and M. Poliakoff, Green Chem., 2009, 11, 409–416 RSC.
- M. G. Hitzler, F. R. Smail, S. K. Ross and M. Poliakoff, Org. Process Res. Dev., 1998, 2, 137–146 CrossRef CAS.
- R. L. Grob and E. F. Barry, Modern practice of gas chromatography, Wiley. com, 2004 Search PubMed.
- G. C. Chinchen, C. M. Hay, H. D. Vandervell and K. C. Waugh, J. Catal., 1987, 103, 79–86 CrossRef CAS.
- X.-c. Zheng, X.-l. Zhang, X.-y. Wang and S.-h. Wu, React. Kinet. Catal. Lett., 2007, 92, 195–203 CrossRef CAS.
- L. Kundakovic and M. Flytzani-Stephanopoulos, J. Catal., 1998, 179, 203–221 CrossRef CAS.
- I.-C. Marcu, D. Tichit, F. Fajula and N. Tanchoux, Catal. Today, 2009, 147, 231–238 CrossRef CAS PubMed.
- X. Wang, J. A. Rodriguez, J. C. Hanson, D. Gamarra, A. Martínez-Arias and M. Fernández-García, J. Phys. Chem. B, 2005, 110, 428–434 CrossRef PubMed.
- X. Qi and M. Flytzani-Stephanopoulos, Ind. Eng. Chem. Res., 2004, 43, 3055–3062 CrossRef CAS.
- M. Twigg and M. Spencer, Top. Catal., 2003, 22, 191–203 CrossRef CAS.
- I. Takahara, M. Saito, M. Inaba and K. Murata, Catal. Lett., 2005, 105, 249–252 CrossRef CAS PubMed.
- S. Golay, R. Doepper and A. Renken, Appl. Catal., A, 1998, 172, 97–106 CrossRef CAS.
- S. Luo and J. Falconer, Catal. Lett., 1999, 57, 89–93 CrossRef CAS.
- C. Li, Y. Sakata, T. Arai, K. Domen, K.-i. Maruya and T. Onishi, J. Chem. Soc., Faraday Trans. 1, 1989, 85, 929–943 RSC.
- C. Bozo, N. Guilhaume and J.-M. Herrmann, J. Catal., 2001, 203, 393–406 CrossRef CAS.
- S. Sharma, S. Hilaire, J. M. Vohs, R. J. Gorte and H. W. Jen, J. Catal., 2000, 190, 199–204 CrossRef CAS.
- T. Staudt, Y. Lykhach, N. Tsud, T. Skála, K. C. Prince, V. Matolín and J. Libuda, J. Catal., 2010, 275, 181–185 CrossRef CAS PubMed.
- M. I. Zaki, M. A. Hasan and L. Pasupulety, Langmuir, 2001, 17, 768–774 CrossRef CAS.
- P. Bera, S. Mitra, S. Sampath and M. S. Hegde, Chem. Commun., 2001, 927–928 RSC.
- H. Idriss, C. Diagne, J. P. Hindermann, A. Kiennemann and M. A. Barteau, J. Catal., 1995, 155, 219–237 CrossRef CAS.
- J. El Fallah, S. Boujana, H. Dexpert, A. Kiennemann, J. Majerus, O. Touret, F. Villain and F. Le Normand, J. Phys. Chem., 1994, 98, 5522–5533 CrossRef CAS.
Footnote |
| † Electronic supplementary information (ESI) available. See DOI: 10.1039/c4gc00219a |
| This journal is © The Royal Society of Chemistry 2015 |

