
 Open Access Article
 This Open Access Article is licensed under a
 Creative Commons Attribution 3.0 Unported Licence
Anti-PEG antibodies enriched in the protein corona of PEGylated nanocarriers impact the cell uptake†
Mareike F. S.
Deuker
a,
Volker
Mailänder
ba,
Svenja
Morsbach
 *a and
Katharina
Landfester
a
*a and
Katharina
Landfester
a
aMax Planck Institute for Polymer Research, Ackermannweg 10, 55128 Mainz, Germany. E-mail: morsbachs@mpip-mainz.mpg.de
bDepartment of Dermatology, University Medical Center of the Johannes Gutenberg-University Mainz, Langenbeckstrasse 1, 55131 Mainz, Germany
First published on 4th August 2023
Abstract
Poly(ethylene glycol) (PEG) is the gold standard used to reduce unspecific protein adsorption and prolong nanocarrier circulation time. However, this stealth effect could be counteracted by the increasing prevalence of anti-PEG antibodies in the bloodstream. Up to now, the presence of anti-PEG antibodies in the protein corona and their effect on cell uptake has not been investigated yet. Our results showed a high concentration and prevalence of anti-PEG antibodies in the German population. PEGylated nanocarriers exhibited a higher level of anti-PEG antibodies in the protein corona compared to non-PEGylated, which lead to higher uptake in macrophages. Consequently, the anti-PEG antibodies in the protein corona could mitigate the stealth effect of PEG, leading to accelerated blood clearance and unwanted side effects.
New conceptsIn our study, we report for the first time on anti-PEG antibody quantification in the protein corona of nanocarriers. The prevalence of antibodies directed against PEG among the general population has been reported before, as well as the accelerated blood clearance of PEGylated nanomedicines. However, it was not yet clear whether these antibodies are indeed enriched on nanocarrier surfaces and how their presence correlates with cellular uptake. With our findings, we verify the assumption that nanocarrier-associated anti-PEG antibodies contribute to enhanced uptake in macrophage cell lines and, thus, induce effects opposite to the original intention of PEGylation. |
Introduction
Many materials in biomedical applications use poly(ethylene glycol) (PEG).1 Attaching PEG chains to a biopharmaceutical agent – so-called “PEGylation” – is an important approach to improve the agent's pharmacokinetics and pharmacodynamics.2 PEGylation can increase water solubility and stability, decrease enzymatic degradation, reduce immunogenicity, and extend the blood circulation half-life.3 Additionally, PEG reduces unspecific protein adsorption on nanocarriers (NCs) and prolongs their circulation time by adsorption of specific apolipoproteins like apolipoprotein A1 or clusterin.4 This is known as the “stealth effect”.4,5 However, in some cases it was observed that PEGylation resulted in an enrichment of opsonins such as immunoglobulins, promoting unspecific cell uptake.6 This could be related to PEG-binding antibodies.7 These anti-PEG antibodies could bind to PEGylated NCs, leading to increased uptake in macrophages and therefore counteract the stealth effect. Thus, it is important to determine the prevalence of anti-PEG antibodies in the blood plasma, investigate the interaction of the antibodies with NCs, and monitor the influence on cell uptake.In 1983, Richter et al. first reported the potential immunogenicity of PEG itself.8 They observed anti-PEG antibodies (mainly IgM isotype) in approximately 0.2% of healthy blood donors, which at that time was considered to be of no clinical significance and therefore probably did not interfere with the clinical use of PEGylated therapeutics.9 Later on, various research groups observed that administering repeated doses of PEGylated NCs led to accelerated blood clearance and weakened efficacy of PEGylated therapeutics.10 In contrast to most antidrug antibodies, anti-PEG IgG and IgM antibodies were observed in both PEGylated therapeutics-treated patients and healthy (treatment-naïve) individuals.
In 2016, Chen et al. reported pre-existing anti-PEG antibodies in healthy Han Chinese and found that 44.3% of participants tested positive for anti-PEG IgG and IgM antibodies.11 Additionally, a recent study by Huckaby et al. characterized the anti-PEG antibody structure in complexes with PEG chains by X-ray crystallography.12 They demonstrated how antibodies could bind highly flexible repeating structures like PEG between two anti-PEG Fab fragments in an open ring-like sub-structure, whereby the PEG backbone is likely to be captured and stabilized via van der Waals interactions. They reported the PEG size of the PEG epitope to consist of roughly ∼16 repeating units, suggesting that the molecular weight of a PEG chain would have to be >700 g mol−1 to be able to interact with the antibodies.
The presence of anti-PEG antibodies correlates with the reduced efficacy of PEGylated therapeutics in clinical trials. Doxil, a formulation of PEGylated liposomes containing doxorubicin, caused immediate hypersensitivity reactions in some patients after the first injection.13 An acute severe allergic reaction to pegnivacogin, a PEGylated aptamer, was observed exclusively in those patients with pre-existing anti-PEG antibodies and was associated with complement activation and tryptase release.14 In animal models, repeated injection of PEGylated liposomes induced anti-PEG IgM formation and enhanced clearance of a second dose.15 Recently, in rare cases, severe allergy-like reactions occurred after the administration of the Pfizer-BioNTech or Moderna COVID-19 vaccines.16 The vaccines contain mRNA loaded into lipid nanoparticles (LNP), which are stabilized by PEGylated lipids. These PEGylated lipids could possibly play a role in triggering anaphylaxis. Recent studies investigated the anti-PEG antibody levels before and after administering the COVID-19 vaccines. They observed a boost in the antibody level, but the anti-PEG antibodies did not negatively affect the immune response to following doses of the vaccines.17,18
As mentioned above, PEGylation is an important approach to stabilize and prolong the circulation time of colloidal NCs. As soon as NCs enter the bloodstream, the NC surface interacts with proteins to form the so-called “protein corona”, depending on the physico-chemical properties of the material. The protein corona is the biological coating of the NC that creates its biological identity as recognized by cells.19,20 The presence of PEG strongly determines the composition of the protein corona of PEGylated NCs. It decreases unspecific protein adsorption and enriches stealth proteins like clusterin, which in combination reduces cellular uptake in macrophages.4,21 However, anti-PEG antibodies could potentially become enriched in the protein corona of PEGylated NCs depending on their presence in blood plasma, and induce unwanted side effects as described earlier. Accordingly, anti-PEG antibodies in the protein corona are likely to be an important factor for the fate of the NCs.22
Regardless of the potentially serious consequences of circulating anti-PEG antibodies, their impact on the effect of NC therapeutics and related side effects remains uncertain up to now. Based on the currently available literature, it can be assumed that observed effects originated in the association of anti-PEG antibodies with PEGylated nanocarriers, but their presence in the protein corona was not investigated so far. Therefore, we analyzed the prevalence of anti-PEG related antibodies in healthy individuals, determined their concentration in the protein corona of PEGylated NCs, and studied their influence on cellular uptake. Finally, we show that anti-PEG antibody levels should definitely be considered for nanocarrier-based drug delivery. This is necessary to develop a successful nanocarrier-based therapy in the future.
Results and discussion
In this study, we investigated the relevance of anti-PEG antibodies for the design of NCs. As a first step, we screened 500 plasma samples obtained from healthy blood donors. We analyzed the plasma samples regarding their anti-PEG IgG and IgM prevalence and concentration using an enzyme-linked immunosorbent assay (ELISA) and compared our results with previous results from other studies taken from different populations. Further, we used individual and pooled plasma samples with varying concentrations of anti-PEG IgG for protein corona formation on silica nanocapsules (SiNCs) with varying degrees of PEGylation. We determined the protein corona composition and anti-PEG IgG concentration in the corona via LC–MS, Pierce assay, and ELISA. Furthermore, we monitored the impact of the IgG present in the protein corona on cell interactions in RAW 264.7 (mouse) and THP-1 (human) macrophages by analyzing the cellular uptake of PEGylated NCs with varying amounts of adsorbed anti-PEG antibodies. Fig. 1 displays a schematic overview of the performed experiments.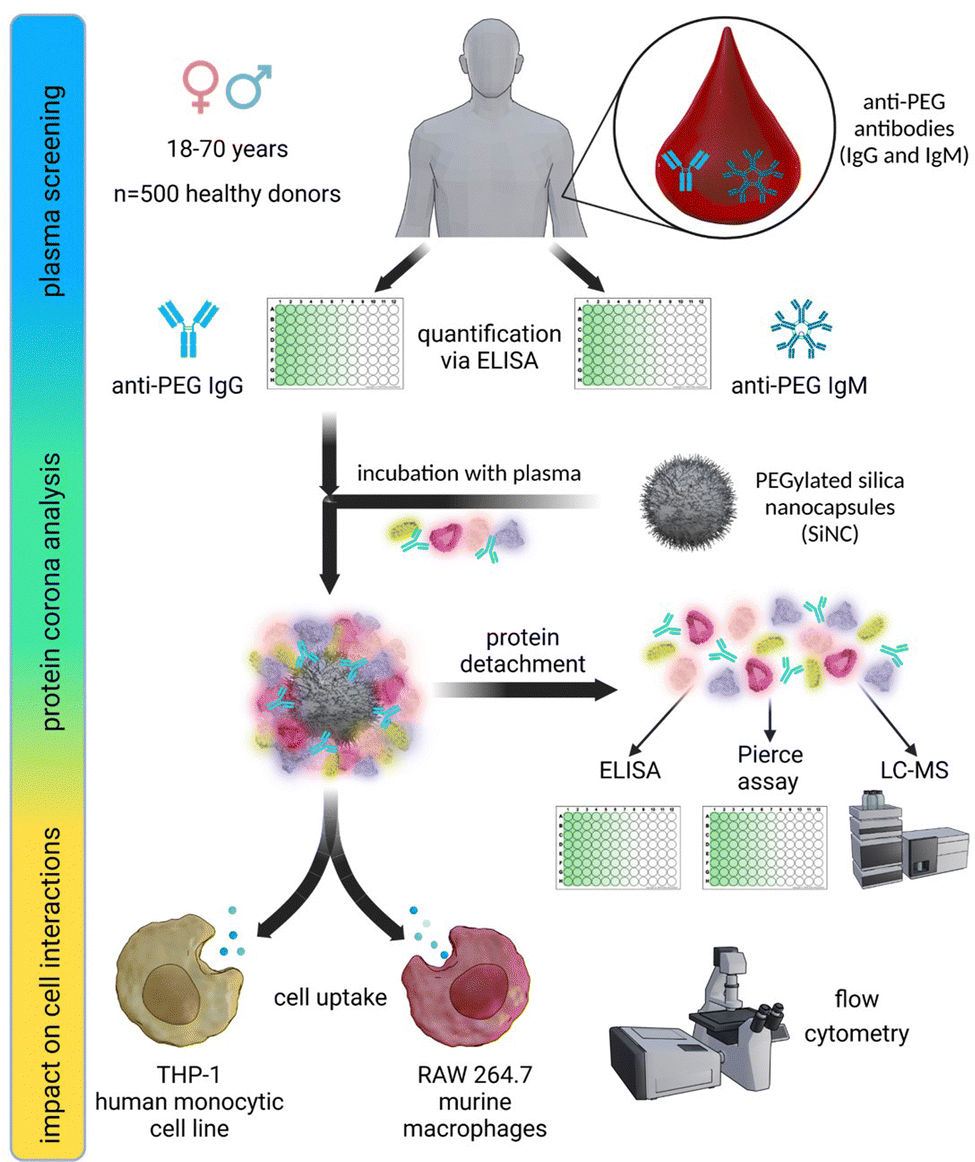 | ||
| Fig. 1 Overview of the experiment design: (1) anti-PEG antibody (IgG + IgM) plasma screening among 500 healthy individuals using ELISA. (2) Determination of anti-PEG IgG enrichment in the protein corona of PEGylated SiNCs. (3) Monitoring the impact on cell interactions with RAW 264.7 (mouse) and THP-1 (human) macrophages depending on IgG presence in the protein corona of PEGylated SiNCs. | ||
As mentioned, an increasing number of studies report pre-existing anti-PEG antibodies in Chinese and North American populations.7,11,23 Against this background, we performed a plasma screening to evaluate the prevalence of anti-PEG antibodies among the German population. To this end, we received 500 plasma samples from healthy blood donors, representing the plasma source we typically use for protein corona studies. The samples were chosen randomly and collected together with information about the donor's age (year of birth) and gender. It is important to note that the plasma samples were collected in 2019 before PEGylated Covid-19 vaccines were approved and applied. We analyzed the anti-PEG antibody prevalence and concentration in plasma samples using a modified ELISA test.11 In the assay, anti-PEG antibodies in the plasma samples bound to poly(ethylene glycol) diamine immobilized on the plates.
An enzyme-linked secondary antibody then specifically detected anti-human IgG or IgM antibodies. Additionally, we performed a competition assay to confirm that anti-PEG antibodies specifically bind to PEG and did not randomly adsorb on the plates. For the competition assay, free PEG was added to the plasma samples to compete with the immobilized PEG chains. This reduced the number of detectable antibodies. Consequently, the sample was considered positive for anti-PEG antibodies if the color reaction was reduced by at least 35% compared to the reading without the addition of free PEG. The relative concentrations of anti-PEG IgG or IgM antibodies in the plasma samples were determined by comparison to standard curves obtained from a serial dilution of chimeric anti-PEG antibodies c3.3-IgG or cAGP4-IgM.24Fig. 2 shows the schematic setup of the ELISA protocol and the corresponding results of the plasma screening. As indicated in Fig. 2(b), anti-PEG antibodies were present in the majority of the samples with minor differences between male and female donors. 81.8% of the female donors were positive for anti-PEG IgG, and 55.1% were positive for anti-PEG IgM. The male donors showed a slightly lower prevalence of 74.4% for anti-PEG IgG and 54.1% for anti-PEG IgM. Overall, 48.8% of all donors were positive for both IgG and IgM, and in only 16.6% no anti-PEG antibodies could be detected. This means that in ∼83% of all donor samples anti-PEG antibodies were found. In general, anti-PEG IgG was more prevalent than IgM, while both followed a similar trend, as shown in Fig. 2(c). The prevalence of anti-PEG IgG and IgM is shown depending on donor age. Samples were grouped into 10 years time intervals and groups of <20 and >60 years of age. Here, it can be seen that anti-PEG prevalence roughly followed a linear trend and decreased with increasing age for both immunoglobulin isotypes.
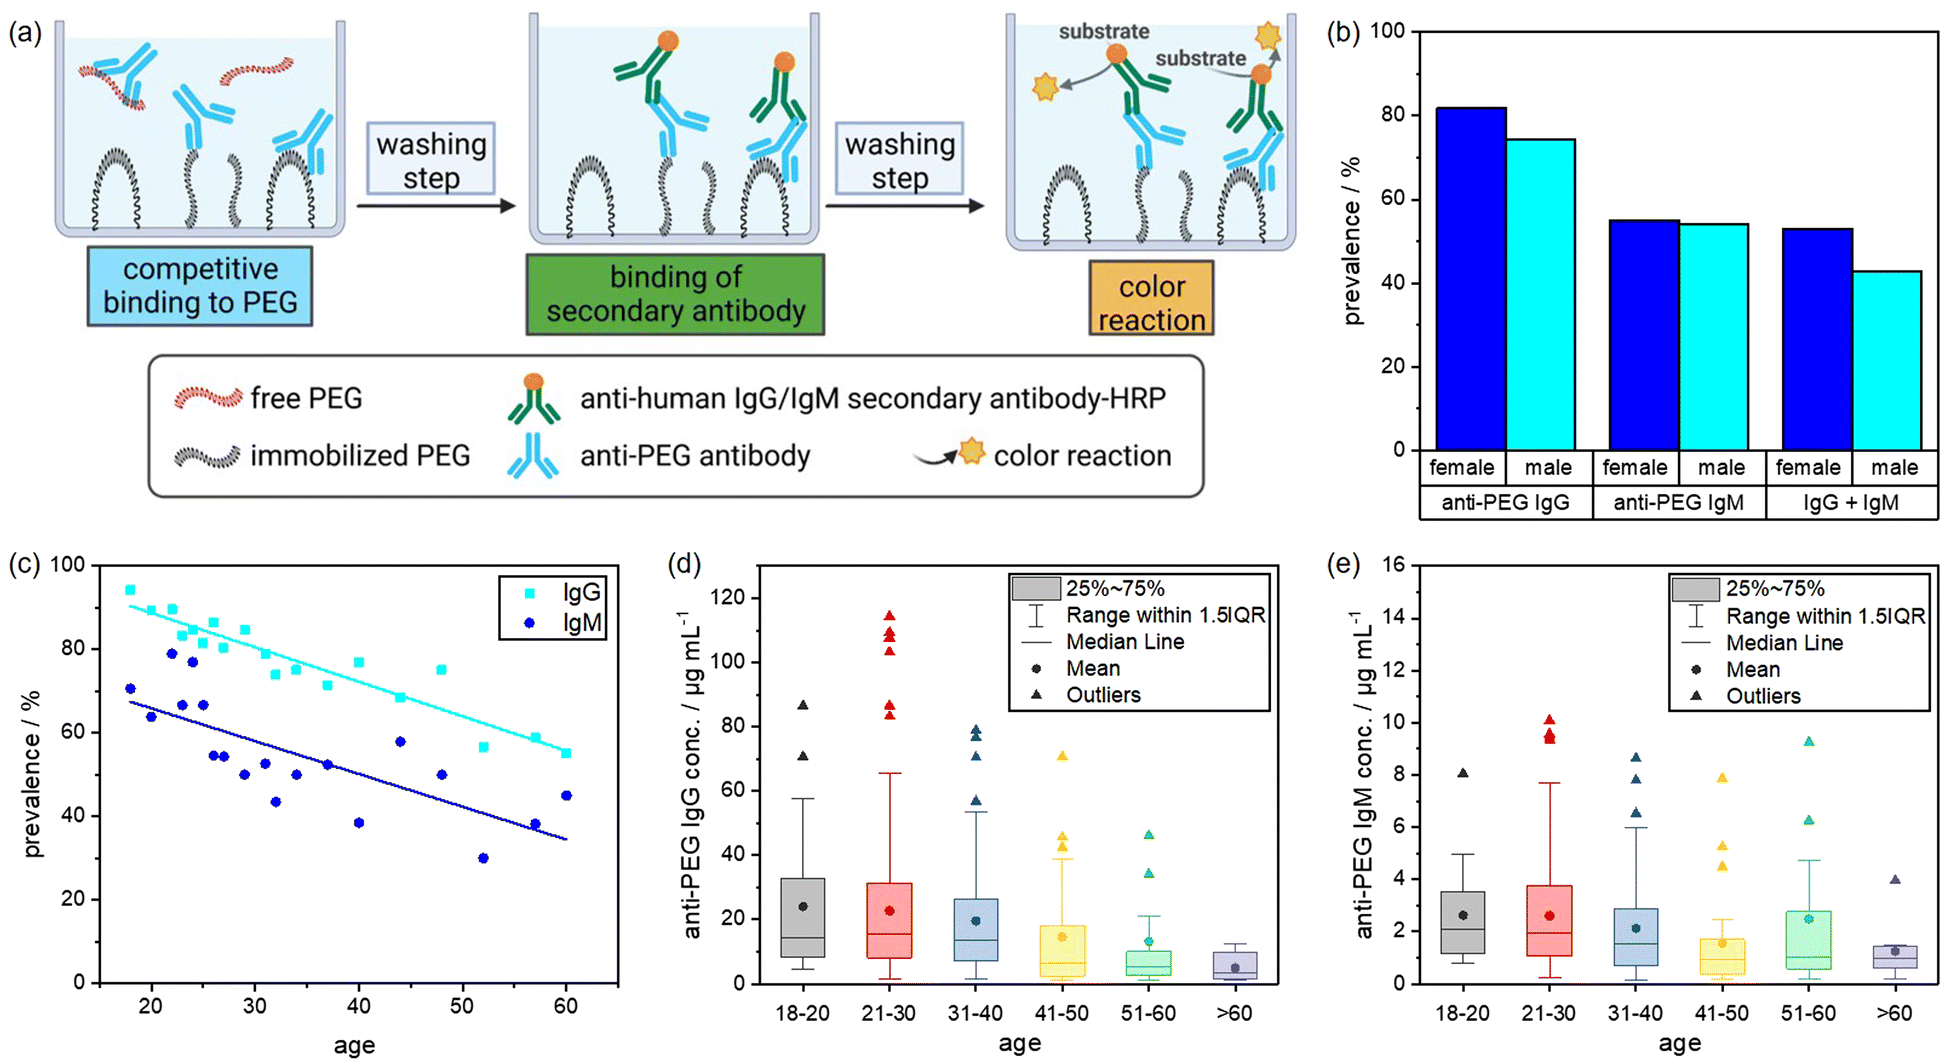 | ||
| Fig. 2 Plasma screening to analyze anti-PEG antibody prevalence and concentration in a sample of the German population (n = 500). (a) Schematic setup of the ELISA test. (b) Prevalence of anti-PEG IgG and IgM antibodies (blue: female, cyan: male samples). (c) Prevalence distribution depending on age (cyan: IgG, blue: IgM), the line indicates the linear regression. (d) Concentration of anti-PEG IgG antibodies in age groups. (e) Concentration of anti-PEG IgM antibodies in age groups. Differences in average concentrations shown in (d) and (e) are not statistically significant due to outliers in the high concentration range. | ||
As already shown, anti-PEG IgG occurred in a higher concentration than IgM in all age groups. Fig. 2(d) and (e) display the anti-PEG IgG and IgM concentrations. Both immunoglobulin isotypes varied the most and showed the highest absolute concentrations in the age group between 21–30 years. The outliers and mean values of antibody concentration slightly decreased with increasing age, more prominently for anti-PEG IgG than for IgM. More details on the plasma screening including the anti-PEG IgG and IgM concentration of all samples and the age distribution can be found in the (Fig. S1, ESI†).
These results agree with findings from previous studies. Chen et al. reported anti-PEG IgG and IgM antibodies in 44.3% of healthy donors, and Yang et al. found detectable anti-PEG antibodies in as much as 72% of the samples (18% IgG, 25% IgM, and 30% both).11,23 Here, it is also important to compare the results with regard to the thresholds of minimum ELISA sensitivity among the different studies. Chen et al. reported LOQs of 0.3 μg mL−1 for IgG and 0.1 μg mL−1 for IgM. Yang et al. investigated their samples using different minimum cutoff values of either 0.5 or 0.1 μg mL−1 for both classes. In our experiments, LOQ was determined to be 0.5 μg mL−1 for IgG and 0.05 μg mL−1 for IgM. Notably, for anti-PEG IgM there were no samples with a concentration between 0.05–0.1 μg mL−1. Thus, the detection sensitivity applied to our experiments to obtain results in terms of prevalence (% positive samples) was comparable to the previously mentioned studies.
One reason for the high prevalence throughout the population might be the abundance of PEG in everyday products such as cosmetics and processed food.25 Casual exposure to PEG compounds may induce anti-PEG antibodies.26 The higher prevalence of anti-PEG antibodies in younger individuals might be due to the more widespread use of PEG in convenience products and cosmetics in recent years and changes in general consumer behavior. Additionally, a diminished immune response in older individuals could play a role.27
A few studies exist that discuss the binding behavior of anti-PEG antibodies. The cross-reactivity of anti-PEG antibodies to other polymers with a C–C–O backbone or the specific binding to the PEG backbone versus the end-group were analyzed by a competitive ELISA.28,29 Additionally, X-ray crystallography studies offer insight into the structural basis of PEG recognition by the anti-PEG antibody.12,30,31 A correlation between PEG molecular weight and anti-PEG IgG binding was analyzed by determining the EC50 values by applying ELISA.11
We performed microscale thermophoresis (MST) measurements to quantify the strength of the interaction between anti-PEG antibodies and free (not surface-immobilized) PEG. The technique is based on a temperature-induced fluorescence change of a labeled target as a function of the concentration of a non-fluorescent ligand.32 We used FITC-conjugated mPEG (methoxy-terminated PEG) as a target. Varying the PEG chain length gave us an insight into how the chain length influences the binding affinity to anti-PEG IgG, represented by the dissociation constant (Kd). As a negative control, we used FITC-conjugated dextran. Due to limited amounts of anti-PEG IgG, we also had to limit the number of performed measurements, which is not ideal and results in larger errors than usually reported for this method. Nevertheless, the measurements still yield valuable information to compare with our findings and literature data.
The obtained results are listed in Table 1 and the corresponding binding curves are shown in Fig. S2 and S3 (ESI†). The binding of anti-PEG IgG to mPEG with a molecular weight of 10![[thin space (1/6-em)]](https://www.rsc.org/images/entities/char_2009.gif) 000 or 20000 g mol−1 yielded the lowest Kd values (24–44 nM), which indicates the highest binding affinity. The difference between the two Kd values is not significant, but for lower PEG molecular weights the obtained Kd values were considerably higher. This means that binding strength decreased with decreasing PEG chain length. As expected, no binding could be observed in the negative control. These results indicate a strong and specific binding of anti-PEG IgG to mPEG and agree with previous studies. Chen et al. analyzed the binding of anti-PEG IgG to immobilized mPEG ranging in size from 30000 g mol−1 to 2000 g mol−1 and observed better binding (characterized by EC50 values) for longer chains of mPEG.11 Additionally, the same group investigated the binding of bispecific PEG engagers to mPEG5k with MST. They observed a strong binding with a Kd value of 7.6 nM.33 Furthermore, Huckaby et al. reported that the PEG size of the PEG antigen epitope consists of roughly ∼16 repeating units, suggesting that the molecular weight of a PEG chain would have to be >700 g mol−1 to be able to interact with the antibodies.12 This agrees with our results indicating that a certain chain length is necessary for sufficient binding and a longer PEG chain leads to stronger binding of anti-PEG antibodies.
000 or 20000 g mol−1 yielded the lowest Kd values (24–44 nM), which indicates the highest binding affinity. The difference between the two Kd values is not significant, but for lower PEG molecular weights the obtained Kd values were considerably higher. This means that binding strength decreased with decreasing PEG chain length. As expected, no binding could be observed in the negative control. These results indicate a strong and specific binding of anti-PEG IgG to mPEG and agree with previous studies. Chen et al. analyzed the binding of anti-PEG IgG to immobilized mPEG ranging in size from 30000 g mol−1 to 2000 g mol−1 and observed better binding (characterized by EC50 values) for longer chains of mPEG.11 Additionally, the same group investigated the binding of bispecific PEG engagers to mPEG5k with MST. They observed a strong binding with a Kd value of 7.6 nM.33 Furthermore, Huckaby et al. reported that the PEG size of the PEG antigen epitope consists of roughly ∼16 repeating units, suggesting that the molecular weight of a PEG chain would have to be >700 g mol−1 to be able to interact with the antibodies.12 This agrees with our results indicating that a certain chain length is necessary for sufficient binding and a longer PEG chain leads to stronger binding of anti-PEG antibodies.
| Target | Polymer molecular weight/g mol−1 | K d /nM |
|---|---|---|
| a K d values are mean ± S.D. from several measurements (except for mPEG2k where n = 1 and error of fit is given instead). Details see ESI. | ||
| mPEG20k-FITC | 20000 |
44 ± 25 |
| mPEG10k-FITC | 10000 |
24 ± 12 |
| mPEG5k-FITC | 5000 | 249 ± 51 |
| mPEG2k-FITC | 2000 | 2690 ± 946 |
| dextran-FITC (neg. control) | 10000 |
No binding |
PEGylation is widely used and an important approach to both stabilize and prolong the circulation time of NCs. Due to the high abundance of anti-PEG antibodies in the plasma, they could potentially become enriched in the protein corona of PEGylated NCs and induce unwanted side effects as described earlier. To study the antibody presence in the protein corona, silica nanocarriers (SiNCs) were synthesized and PEGylated using the non-covalent PEG-based surfactant Lutensol®.34Table 2 shows the physico-chemical characterization data for all NC samples investigated in this study. Additionally transmission electron microscopy (TEM) micrographs are displayed in Fig. S4 (ESI†). The PEG chain molecular weights varied between ∼1000–4000 g mol−1. We chose these particular chain lengths as they are typical ones used for nanocarrier functionalization (2000–3000 g mol−1), yielding an ideal steric stabilization. For example, the currently applied COVID-19 vaccines exhibit PEG chains of this length.16
| SiNC-CTMA-Cl | SiNC PEG n = 25 medium | SiNC PEG n = 50 low | SiNC PEG n = 50 medium | SiNC PEG n = 50 high | SiNC PEG n = 80 medium | |
|---|---|---|---|---|---|---|
| Surfactant | Cetyltrimethylammonium-chloride (CTMA-Cl) | Lutensol® AT25 | Lutensol® AT50 | Lutensol® AT50 | Lutensol® AT50 | Lutensol® AT80 |
| n(Lutensol®)/mol | - | 2.85 × 10⁻⁵ | 1.42 × 10⁻⁵ | 2.85 × 10⁻⁵ | 5.70 × 10⁻⁵ | 2.85 × 10⁻⁵ |
| M w PEG/g mol−1 | - | 1230 | 2460 | 2460 | 2460 | 3940 |
| D h (PDI)/nm | 262 ± 65 (0.13) | 231 ± 39 (0.14) | 153 ± 3 (0.11) | 212 ± 47 (0.25) | 164 ± 8 (0.23) | 207 ± 34 (0.35) |
| Zeta potential/mV | +13 ± 1 | −2 ± 1 | −5 ± 1 | −7 ± 1 | −9 ± 1 | −7 ± 1 |
The NC size (hydrodynamic diameter) was determined from dynamic light scattering (DLS) and ranges between 148 and 212 nm for all NCs. The zeta potential is related to the net surface charge of the NCs. As expected, the zeta potential for all PEGylated SiNCs was slightly negative, while SiNCs with CTMA-Cl exhibited a positive zeta potential. We prepared the protein corona using undiluted pooled human plasma and determined the anti-PEG antibody level in this plasma batch by ELISA. The detected anti-PEG IgG concentration was 9.6 ± 0.8 μg mL−1, which corresponds to 0.06% of the total immunoglobulins found in this plasma batch (Table S2, ESI†). We analyzed the protein corona using different methods to establish the overall protein concentration by Pierce assay and the detailed protein composition in the protein corona by LC–MS. The percentage of total immunoglobulins was then converted into immunoglobulin concentration based on the Pierce assay. As before, ELISA was used to measure the anti-PEG IgG concentration in the protein corona samples. Fig. 3 shows the corresponding results of the protein corona analysis. The list of TOP25 identified proteins in the protein corona is shown in Fig. S5 (ESI†). For a more detailed comparison, the fraction of anti-PEG IgG antibodies of the total immunoglobulin concentration is displayed in Fig. 3(b). The overall determined protein amount was similar for all PEGylated SiNCs, as expected from the general effect of PEGylation, while SiNC-CTMA-Cl showed a significantly higher amount of adsorbed proteins.
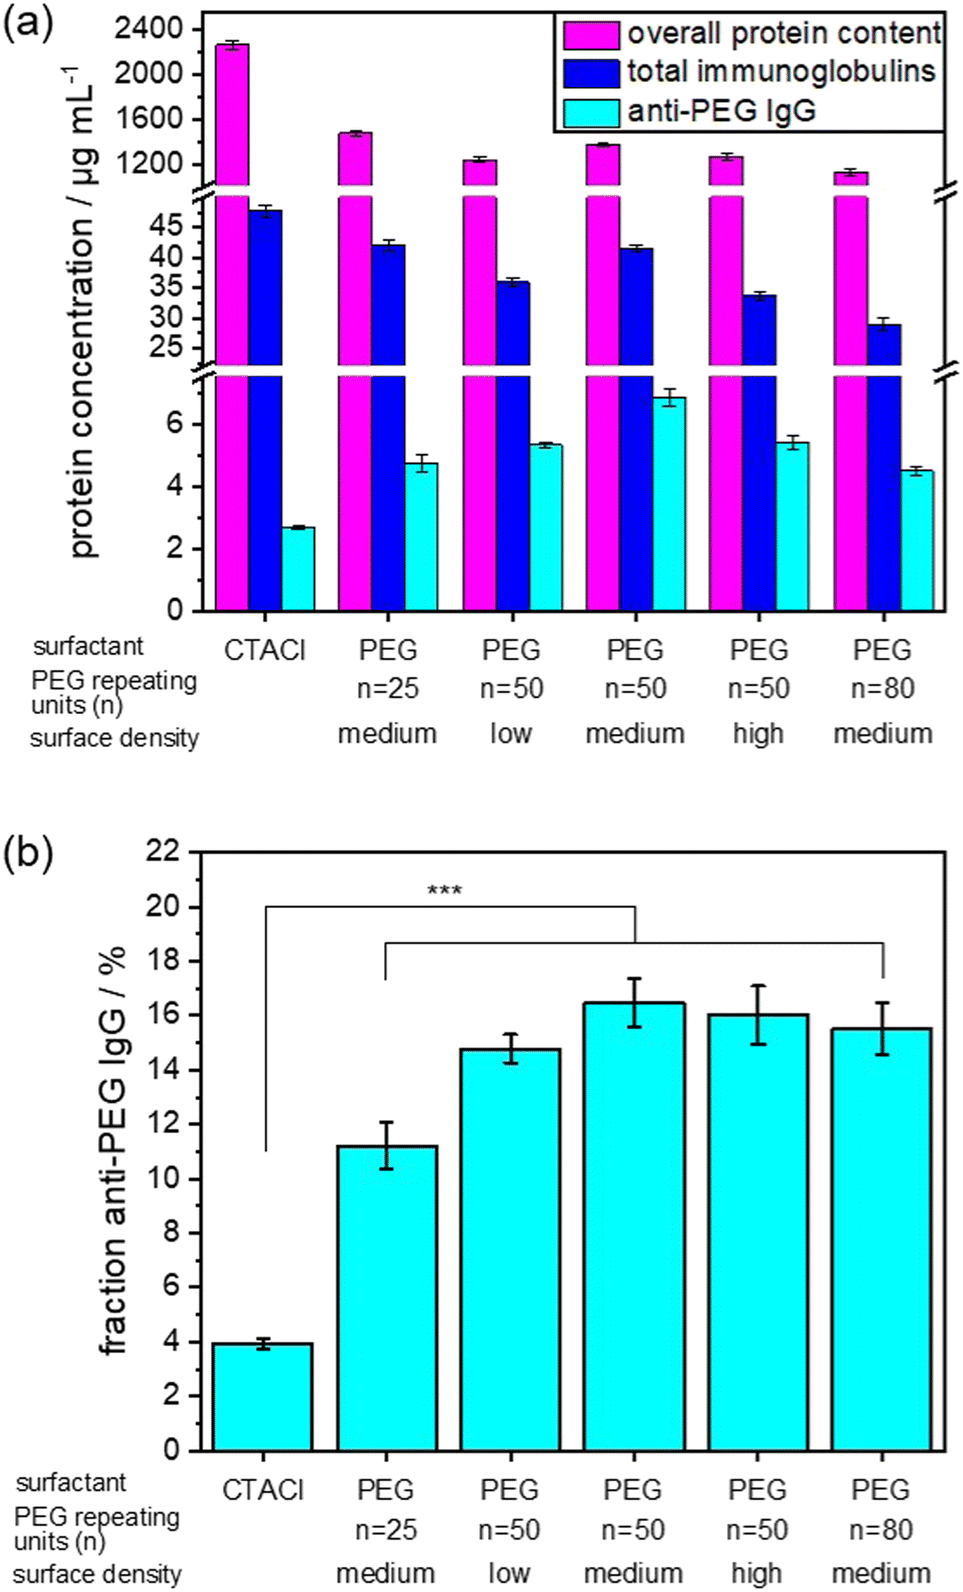 | ||
| Fig. 3 Investigation of anti-PEG IgG presence in the protein corona. Values are mean values with a standard deviation of three replicates. (a) Protein concentration in the protein corona depending on the presence of PEG on the NC surface, for a normalized NC surface area of 0.05 m2 per sample. Purple: overall protein concentration of all plasma proteins as analyzed by a Pierce assay, blue: total immunoglobulin concentration as analyzed with LC–MS (percentage of total proteins converted to concentration based on Pierce assay), cyan: anti-PEG IgG concentration analyzed by ELISA. (b) Fraction of anti-PEG IgG concentration compared to the total concentration of immunoglobulin. The analysis of variance (ANOVA) one-way test was used for statistical analysis yielding ***p < 0.001, corresponding to the difference between CTMA-Cl and PEG-stabilized NCs. | ||
Additionally, we detected a slightly higher concentration of immunoglobulins in the protein corona of CTMA-Cl stabilized NCs. In contrast, PEGylated NCs exhibited the highest concentration and fraction of anti-PEG IgG in the protein corona.
We observed no significant difference in anti-PEG IgG fraction in the protein corona derived from NCs with a PEG chain length of n = 50 or n = 80 PEG repeating units and a medium or high surface density. In contrast, a lower surface density of PEG led to a slight decrease of the anti-PEG IgG fraction in the protein corona. This was even more noticeable when a shorter PEG chain length (n = 25 repeating units) was present on the NC surface. This trend agrees with the determined binding affinities as mentioned before, which increased with longer PEG chains. In general, anti-PEG IgG is enriched in the protein corona of PEGylated NCs compared to non-PEGylated NCs or human plasma. Our results indicate that a certain density and chain length was necessary for a “saturation” of the protein corona with anti-PEG antibodies. Afterwards, higher density or longer chain length did not lead to increased binding of anti-PEG antibodies. Interestingly, even the CTMA-Cl NCs showed a slight enrichment of anti-PEG IgG compared to plasma levels. It is not clear what the reason for this enrichment is, but might be related to the charge of the NCs. It is known that especially charged surfaces induce interactions with immunoglobulins, but so far this effect was not investigated on the level of specific antibodies.35,36
PEGylation in general often leads to a decrease of unspecific protein adsorption and enrichment of stealth proteins like clusterin, which in combination helps to reduce unspecific cellular uptake.4 The results of the protein corona analysis revealed that anti-PEG IgG became enriched in the protein corona of PEGylated NCs, which was not yet reported for any NC system. We monitored the cellular uptake in RAW 264.7 (murine) and THP-1 (human) macrophages of PEGylated NCs with varying amounts of adsorbed anti-PEG antibodies to further investigate the consequences of anti-PEG antibodies in the protein corona. To do this, we chose SiNCs with a medium PEG chain length (n = 50) and density. Plasma samples from the plasma screening were selected and pooled to obtain plasma batches with systematically pre-determined anti-PEG IgG concentrations. We pooled five plasma samples each with a resulting low (<0.5 μg mL−1), medium (9.6 μg mL−1), and high (110.5 μg mL−1) anti-PEG IgG concentration.
We used these pooled plasma samples to form the protein corona with a varied presence of anti-PEG IgG together with a sample containing the protein corona formed from pure anti-PEG IgG as a positive control (Fig. 4(a)). For anti-PEG IgG a protein concentration roughly equivalent to the “high” anti-PEG IgG concentration (120 μg mL−1) was chosen for incubation. After protein corona formation, the NCs were incubated with both macrophage cell lines and we investigated their cellular uptake in terms of percent of fluorescence positive cells (Fig. 4(b) and (c)) and median fluorescence intensity (MFI) (Fig. S6, ESI†). The results from the MFI measurement show a trend similar to the fluorescence positive cells although not as noticeable. It is important to note that median fluorescence intensity was plotted for evaluation as mean fluorescence intensity is much more affected by few highly fluorescent cells, which can be misleading especially for cells with generally low uptake.
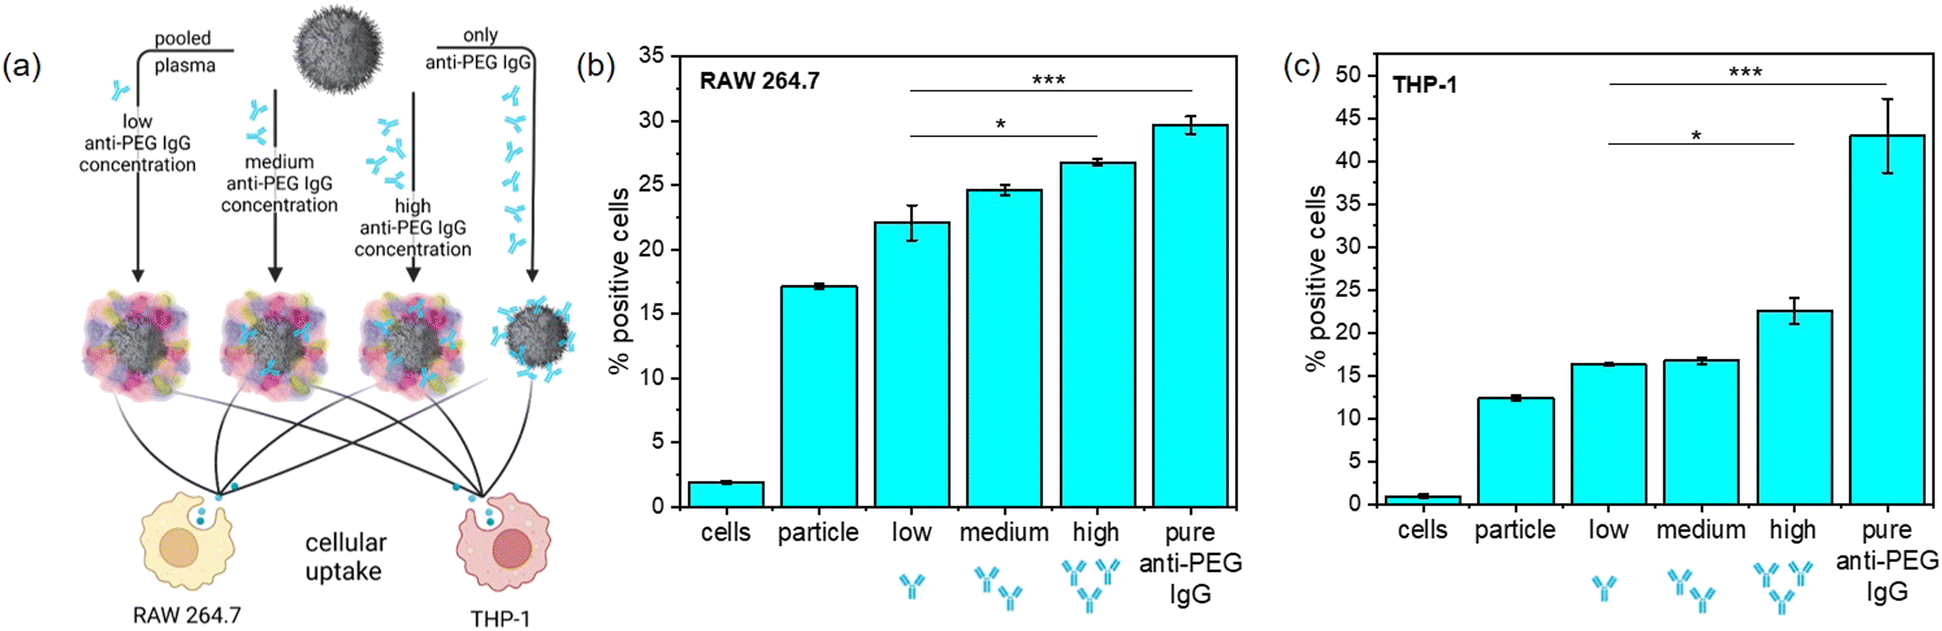 | ||
| Fig. 4 Cellular uptake of SiNCs coated with proteins including an increasing concentration of anti-PEG IgG. (a) Schematic overview of the experimental scheme. (b) Uptake in murine RAW264.7 macrophages, displayed in % of fluorescence positive cells. (c) Uptake in human THP-1 macrophages, displayed in % of fluorescence positive cells. For the negative control, only cells without any addition of NCs were measured. Values are mean values with standard deviation of three biological replicates. The analysis of variance (ANOVA) two-way test was used for statistical analysis yielding *p < 0.05, ***p < 0.001, corresponding to the individual types of protein corona. | ||
In RAW 264.7 macrophages, the cellular uptake steadily increased with increasing anti-PEG IgG concentration in the protein corona, referring to the fraction of fluorescence positive cells. In particular, the uptake of NCs with only anti-PEG IgG in the protein corona was significantly higher than those NCs with very little anti-PEG IgG present. The general uptake in human THP-1 macrophages was similar to RAW 264.7. The uptake of NCs with pooled plasma containing different concentrations of anti-PEG IgG displayed only a very slight increase with anti-PEG IgG concentration; whereas the uptake doubled when the protein corona was formed only from anti-PEG IgG. These results are in good agreement with the generally increased uptake in macrophages of NCs with a high concentration of immunoglobulins in the protein corona. It is known that IgG enrichment in the protein corona can lead to significantly increased uptake in macrophages via Fc-receptor-mediated endocytosis.37
Therefore, we performed Fc-receptor blocking experiments to evaluate this uptake mechanism. Anti-CD16, anti-CD32, and/or anti-CD64 were added before incubation of cells with NCs (Fig. S7, ESI†). The receptors CD16/32 (binding aggregated IgG with low affinity for the ligand38) and CD64 (binding monomeric IgG with high affinity for the ligand39) were either blocked individually or all three were blocked at the same time. In RAW 264.7 macrophages, blocking all Fc-receptors led to significantly lower uptake of NCs with high anti-PEG IgG concentration or only anti-PEG IgG in the protein corona. In THP-1 cells, the uptake after blocking was slightly decreased, especially when CD64 was blocked. This agrees with previous studies including Fc blocking in THP-1 cells, highlighting that human macrophages are more complex than mouse macrophages and various different uptake mechanisms are probably involved.37 Further investigations together with the examination of other human cell lines and in vivo experiments will be necessary in the future to evaluate the uptake mechanisms.
In general, IgG acts as an opsonin, meaning when present in the corona it promotes the internalization of NCs into phagocyting cells.40 Accordingly, our observed increased uptake in macrophages might not be anti-PEG antibody specific, but a general result of an increased presence of immunoglobulins in the protein corona. Due to sensitivity reasons, we were not able to analyze the presence of IgM in the protein corona and its consequences for cellular uptake. However, we expect a similar trend but with generally lower concentrations. Many studies reported that anti-PEG antibodies can be elicited by PEGylated drugs or drug delivery systems and are therefore likely to be responsible for accelerated blood clearance.41–43 This described anti-PEG antibody response was found to be predominately IgM related for empty PEGylated liposomes and IgG related for PEGylated proteins or lipid nanocarriers with encapsulated nucleotides.44–46 Both antibody classes can efficiently activate the complement system via different pathways and subsequently promote phagocytosis and clearance.15,47 As already mentioned, rare cases of anaphylaxis following COVID-19 vaccine administration have been reported.48 In contrast to complement system activation, anaphylaxis is usually IgE-mediated.49 Zhou et al. recently developed a bead assay to determine anti-PEG IgG, IgM, and IgE.50 They reported PEGylated drug-associated anaphylaxis was due to specific anti-PEG IgE-mediated type 1 hypersensitivity. Due to the low concentration of anti-PEG IgE in the plasma and the limitation of the ELISA setup, it has not been possible to analyze anti-PEG IgE concentration so far. In future, it would be extremely interesting to examine also IgE plasma levels and evaluate the interaction of IgE with PEGylated nanocarriers.
Following our results, the existence of anti-PEG antibodies in the bloodstream needs to be considered when designing NCs. Their presence in the protein corona of PEGylated NCs may well mitigate the stealth effect of PEG, leading to higher uptake in macrophages and additionally inducing unwanted side effects as mentioned above.
The composition of the protein corona depends on various factors – primarily the physico-chemical properties of the NCs. Many researchers attempt to control the composition of the proteins adsorbed to NCs to prevent clearance by immune cells.51 To obtain further insight into the role of anti-PEG antibodies and generalize their effect, additional PEGylated and unPEGylated NC systems need to be investigated. Due to the high concentration of anti-PEG antibodies in the bloodstream, they might also accumulate non-specifically in the protein corona. Thus, it is also of great interest to explore more widely, which antibody types are found among the immunoglobulins in the protein corona.
Conclusions
In this study, we have shown the interaction of anti-PEG antibodies with PEGylated nanocarriers. Our understanding and knowledge about the prevalence of anti-PEG antibodies in the bloodstream, in the protein corona, and their importance for the uptake of nanocarriers into cells is crucial for further investigation.We have determined the prevalence of anti-PEG antibodies in the German population to be 83% positive for either anti-PEG IgG or IgM. Interestingly, the prevalence inversely correlated with age. This high prevalence might well be due to casual exposure to PEG compounds in everyday products.
Due to the high prevalence of anti-PEG antibodies in the plasma samples, we investigated their concentration in the protein corona of nanocarriers with varying degrees of PEGylation. Anti-PEG antibodies were indeed enriched in the protein corona of PEGylated nanocarriers with increasing PEG chain length and surface density, as could be expected from previous reports about accelerated blood clearance of PEGylated compounds. This agrees well with the binding affinities of the antibodies to unbound PEG as determined by microscale thermophoresis. As anti-PEG quantities increased in the corona, an enhanced cell uptake in mouse and human macrophages was detected.
In general, PEGylation is widely used and an important approach to stabilize and prolong the circulation time of nanocarriers. However, anti-PEG antibodies can accumulate in the protein corona of PEGylated nanocarriers and promote their uptake. Thus, the stealth effect of PEG is diminished.
According to our results, it is important to monitor anti-PEG antibody prevalence in the bloodstream and account for their existence in patients’ blood when designing new nanocarrier-based therapies.
Various strategies could be envisaged to minimize the impact of anti-PEG antibodies in the protein corona. On the one hand, finding alternatives to PEG in terms of polymer functionalization could be a promising approach. On the other hand, one strategy could be to find solutions that do not require PEGylation or functionalization with other polymers and create stealth behavior in other ways (e.g. protein precoating).
Our findings have significant implications regarding the use and design of nanomedicines and contribute to further our understanding of nano-bio interactions.
Author contributions
Mareike F. S. Deuker: data curation, formal analysis, investigation, methodology, validation, visualization, writing – original draft. Volker Mailänder: supervision, methodology. Svenja Morsbach: conceptualization, methodology, project administration, writing – review & editing, supervision. Katharina Landfester: conceptualization, supervision, funding acquisition, writing – review & editing.Conflicts of interest
There are no conflicts to declare.Acknowledgements
The authors wish to thank S. Schuhmacher for graphical assistance, as well as K. Klein and S. Jiang for nanocarrier synthesis. R. da Costa Marques is acknowledged for the LC–MS analysis. This research work was supported by a grant of the Deutsche Forschungsgemeinschaft (DFG) by the CRC1066 (“Nanodimensional polymeric therapeutics for tumor therapy”). Open Access funding provided by the Max Planck Society.Notes and references
- K. Knop, R. Hoogenboom, D. Fischer and U. S. Schubert, Angew. Chem., Int. Ed., 2010, 49, 6288–6308 CrossRef CAS PubMed.
- M. D. Howard, M. Jay, T. D. Dziubla and X. Lu, J. Biomed. Nanotechnol., 2008, 4, 133–148 CrossRef CAS.
- F. M. Veronese and G. Pasut, Drug Discovery Today, 2005, 10, 1451–1458 CrossRef CAS PubMed.
- S. Schottler, G. Becker, S. Winzen, T. Steinbach, K. Mohr, K. Landfester, V. Mailander and F. R. Wurm, Nat. Nanotechnol., 2016, 11, 372–377 CrossRef PubMed.
- X. Zhang, H. Wang, Z. Ma and B. Wu, Expert Opin. Drug Metab. Toxicol., 2014, 10, 1691–1702 CrossRef CAS PubMed.
- D. Pozzi, V. Colapicchioni, G. Caracciolo, S. Piovesana, A. L. Capriotti, S. Palchetti, S. De Grossi, A. Riccioli, H. Amenitsch and A. Lagana, Nanoscale, 2014, 6, 2782–2792 RSC.
- L. Hong, Z. Wang, X. Wei, J. Shi and C. Li, J Pharmacol. Toxicol. Methods, 2020, 102, 106678 CrossRef CAS PubMed.
- A. W. Richter and E. Akerblom, Int. Arch. Allergy Appl. Immunol., 1983, 70, 124–131 CrossRef CAS PubMed.
- A. W. Richter and E. Akerblom, Int. Arch. Allergy Appl. Immunol., 1984, 74, 36–39 CrossRef CAS PubMed.
- P. Laverman, M. G. Carstens, O. C. Boerman, E. T. M. Dams, W. J. G. Oyen, N. van Rooijen, F. H. M. Corstens and G. Storm, J. Pharmacol. Exp. Ther., 2001, 298, 607–612 CAS.
- B. M. Chen, Y. C. Su, C. J. Chang, P. A. Burnouf, K. H. Chuang, C. H. Chen, T. L. Cheng, Y. T. Chen, J. Y. Wu and S. R. Roffler, Anal. Chem., 2016, 88, 10661–10666 CrossRef CAS PubMed.
- J. T. Huckaby, T. M. Jacobs, Z. Li, R. J. Perna, A. Wang, N. I. Nicely and S. K. Lai, Commun. Chem., 2020, 3, 124 CrossRef CAS PubMed.
- A. Chanan-Khan, J. Szebeni, S. Savay, L. Liebes, N. M. Rafique, C. R. Alving and F. M. Muggia, Ann. Oncol., 2003, 14, 1430–1437 CrossRef CAS PubMed.
- T. J. Povsic, M. G. Lawrence, A. M. Lincoff, R. Mehran, C. P. Rusconi, S. L. Zelenkofske, Z. Huang, J. Sailstad, P. W. Armstrong, P. G. Steg, C. Bode, R. C. Becker, J. H. Alexander, N. F. Adkinson, A. I. Levinson and R.-P. Investigators, J. Allergy Clin. Immunol., 2016, 138, 1712–1715 CrossRef CAS PubMed.
- J. J. Verhoef, J. F. Carpenter, T. J. Anchordoquy and H. Schellekens, Drug Discovery Today, 2014, 19, 1945–1952 CrossRef CAS PubMed.
- S. M. Moghimi, Mol. Ther., 2021, 29, 898–900 CrossRef CAS PubMed.
- Y. Bavli, B. M. Chen, G. Gross, A. Hershko, K. Turjeman, S. Roffler and Y. Barenholz, J. Controlled Release, 2023, 354, 316–322 CrossRef CAS PubMed.
- Y. Ju, W. S. Lee, E. H. Pilkington, H. G. Kelly, S. Li, K. J. Selva, K. M. Wragg, K. Subbarao, T. H. O. Nguyen, L. C. Rowntree, L. F. Allen, K. Bond, D. A. Williamson, N. P. Truong, M. Plebanski, K. Kedzierska, S. Mahanty, A. W. Chung, F. Caruso, A. K. Wheatley, J. A. Juno and S. J. Kent, ACS Nano, 2022, 16, 11769–11780 CrossRef CAS PubMed.
- I. Lynch, A. Salvati and K. A. Dawson, Nat. Nanotechnol., 2009, 4, 546–547 CrossRef CAS PubMed.
- S. Tenzer, D. Docter, S. Rosfa, A. Wlodarski, J. Kuharev, A. Rekik, S. K. Knauer, C. Bantz, T. Nawroth, C. Bier, J. Sirirattanapan, W. Mann, L. Treuel, R. Zellner, M. Maskos, H. Schild and R. H. Stauber, ACS Nano, 2011, 5, 7155–7167 CrossRef CAS PubMed.
- X. Zhang, H. Wang, Z. Ma and B. Wu, Expert Opin. Drug Metab. Toxicol., 2014, 10, 1691–1702 CrossRef CAS PubMed.
- P. Grenier, I. M. O. Viana, E. M. Lima and N. Bertrand, J. Controlled Release, 2018, 287, 121–131 CrossRef CAS PubMed.
- Q. Yang, T. M. Jacobs, J. D. McCallen, D. T. Moore, J. T. Huckaby, J. N. Edelstein and S. K. Lai, Anal. Chem., 2016, 88, 11804–11812 CrossRef CAS PubMed.
- T. L. Cheng, C. M. Cheng, B. M. Chen, D. A. Tsao, K. H. Chuang, S. W. Hsiao, Y. H. Lin and S. R. Roffler, Bioconjugate Chem., 2005, 16, 1225–1231 CrossRef CAS PubMed.
- C. Fruijtier-Polloth, Toxicology, 2005, 214, 1–38 CrossRef PubMed.
- N. J. Ganson, T. J. Povsic, B. A. Sullenger, J. H. Alexander, S. L. Zelenkofske, J. M. Sailstad, C. P. Rusconi and M. S. Hershfield, J. Allergy Clin. Immunol., 2016, 137, 1610–1613.e7 CrossRef CAS PubMed.
- P. J. Linton and K. Dorshkind, Nat. Immunol., 2004, 5, 133–139 CrossRef CAS PubMed.
- J. McCallen, J. Prybylski, Q. Yang and S. K. Lai, ACS Biomater. Sci. Eng., 2017, 3, 1605–1615 CrossRef CAS PubMed.
- M. R. Sherman, L. D. Williams, M. A. Sobczyk, S. J. Michaels and M. G. P. Saifer, Bioconjugate Chem., 2012, 23, 485–499 CrossRef CAS PubMed.
- M. T. Nguyen, Y. C. Shih, M. H. Lin, S. R. Roffler, C. Y. Hsiao, T. L. Cheng, W. W. Lin, E. C. Lin, Y. J. Jong, C. Y. Chang and Y. C. Su, Commun. Chem., 2022, 5, 88 CrossRef CAS PubMed.
- C. C. Lee, Y. C. Su, T. P. Ko, L. L. Lin, C. Y. Yang, S. S. Chang, S. R. Roffler and A. H. Wang, J. Biomed. Sci., 2020, 27, 12 CrossRef CAS PubMed.
- A. J. Gupta, S. Duhr and P. Baaske, Encyclopedia of Biophysics, 2018, ch. 10063-1, pp.1–5 DOI:10.1007/978-3-642-35943-9_10063-1.
- Y. C. Su, P. A. Burnouf, K. H. Chuang, B. M. Chen, T. L. Cheng and S. R. Roffler, Nat. Commun., 2017, 8, 15507 CrossRef CAS PubMed.
- S. Jiang, D. Prozeller, J. Pereira, J. Simon, S. Han, S. Wirsching, M. Fichter, M. Mottola, I. Lieberwirth, S. Morsbach, V. Mailander, S. Gehring, D. Crespy and K. Landfester, Nanoscale, 2020, 12, 2626–2637 RSC.
- D. Prozeller, C. Rosenauer, S. Morsbach and K. Landfester, Biointerphases, 2020, 15, 031009 CrossRef CAS PubMed.
- C. Zhou, J.-M. Friedt, A. Angelova, K.-H. Choi, W. Laureyn, F. Frederix, L. A. Francis, A. Campitelli, Y. Engelborghs and G. Borghs, Langmuir, 2004, 20, 5870–5878 CrossRef CAS PubMed.
- D. Prozeller, J. Pereira, J. Simon, V. Mailander, S. Morsbach and K. Landfester, Adv. Sci., 2019, 6, 1802199 CrossRef PubMed.
- P. D. Benech, K. Sastry, R. R. Iyer, Q. G. Eichbaum, D. P. Raveh and R. A. Ezekowitz, J. Exp. Med., 1992, 176, 1115–1123 CrossRef CAS PubMed.
- R. C. van Schie and M. E. Wilson, Clin. Diagn. Lab. Immunol., 2000, 7, 676–681 CrossRef CAS PubMed.
- H. H. Gustafson, D. Holt-Casper, D. W. Grainger and H. Ghandehari, Nano Today, 2015, 10, 487–510 CrossRef CAS PubMed.
- H. Ma, K. Shiraishi, T. Minowa, K. Kawano, M. Yokoyama, Y. Hattori and Y. Maitani, Pharm. Res., 2010, 27, 296–302 CrossRef CAS PubMed.
- C. Li, J. Cao, Y. Wang, X. Zhao, C. Deng, N. Wei, J. Yang and J. Cui, J. Pharm. Sci., 2012, 101, 3864–3876 CrossRef CAS PubMed.
- R. Saadati, S. Dadashzadeh, Z. Abbasian and H. Soleimanjahi, Pharm. Res., 2013, 30, 985–995 CrossRef CAS PubMed.
- X. Wang, T. Ishida and H. Kiwada, J. Controlled Release, 2007, 119, 236–244 CrossRef CAS PubMed.
- T. Ishida, M. Ichihara, X. Wang, K. Yamamoto, J. Kimura, E. Majima and H. Kiwada, J. Controlled Release, 2006, 112, 15–25 CrossRef CAS PubMed.
- K. Shiraishi, M. Hamano, H. Ma, K. Kawano, Y. Maitani, T. Aoshi, K. J. Ishii and M. Yokoyama, J. Controlled Release, 2013, 165, 183–190 CrossRef CAS PubMed.
- Q. Yang and S. K. Lai, Wiley Interdiscip. Rev.: Nanomed. Nanobiotechnol., 2015, 7, 655–677 CAS.
- H. Freire Haddad, J. A. Burke, E. A. Scott and G. A. Ameer, Regener. Eng. Transl. Med., 2022, 8, 32–42 CrossRef CAS PubMed.
- B. Bröker, C. Schütt and B. Fleischer, Grundwissen Immunol., 2019, 115–141 Search PubMed.
- Z. H. Zhou, C. A. Stone Jr., B. Jakubovic, E. J. Phillips, G. Sussman, J. Park, U. Hoang, S. L. Kirshner, R. Levin and S. Kozlowski, J. Allergy Clin. Immunol.: Pract., 2021, 9, 1731–1733.e3 CAS.
- F. Giulimondi, E. Vulpis, L. Digiacomo, M. V. Giuli, A. Mancusi, A. L. Capriotti, A. Lagana, A. Cerrato, R. Zenezini Chiozzi, C. Nicoletti, H. Amenitsch, F. Cardarelli, L. Masuelli, R. Bei, I. Screpanti, D. Pozzi, A. Zingoni, S. Checquolo and G. Caracciolo, ACS Nano, 2022, 16, 2088–2100 CrossRef CAS PubMed.
Footnote |
| † Electronic supplementary information (ESI) available: Experimental Section, additional plasma screening data, MST parameters and data, LC–MS data, additional cell uptake data, Fc blocking experiments. See DOI: https://doi.org/10.1039/d3nh00198a |
| This journal is © The Royal Society of Chemistry 2023 |