
 Open Access Article
 This Open Access Article is licensed under a Creative Commons Attribution-Non Commercial 3.0 Unported Licence
Aerosol presence reduces the diurnal temperature range: an interval when the COVID-19 pandemic reduced aerosols revealing the effect on climate†
Shijie
Hu
a,
Dashan
Wang
 *a,
Jie
Wu
a,
Lihong
Zhou
a,
Xu
Feng
b,
Tzung-May
Fu
a,
Xin
Yang
a,
Alan D.
Ziegler
c and
Zhenzhong
Zeng
*a
*a,
Jie
Wu
a,
Lihong
Zhou
a,
Xu
Feng
b,
Tzung-May
Fu
a,
Xin
Yang
a,
Alan D.
Ziegler
c and
Zhenzhong
Zeng
*a
aSchool of Environmental Science and Engineering, Southern University of Science and Technology, Shenzhen, China. E-mail: zzeng@princeton.edu; wangds6@sustech.edu.cn
bDepartment of Atmospheric and Oceanic Sciences, School of Physics, Peking University, Beijing, China
cFaculty of Fisheries and Aquatic Resources, Mae Jo University, Chiang Mai, Thailand
First published on 15th June 2021
Abstract
The immense reduction in aerosol levels during the COVID-19 pandemic provides an opportunity to reveal how atmospheric chemistry is regulating our climate, among which the effect of aerosols on climate is a phenomenon of great interest but still in hot debate. The Intergovernmental Panel on Climate Change (IPCC) has continually identified the effect of aerosols on climate to have the largest uncertainty among the factors contributing to global climate change. Several studies indicate an inverse relationship between aerosol presence in the atmosphere and the diurnal surface air temperature range (DTR). Herein, we test this relationship by analyzing the DTR values from in situ weather station records for periods before and during the COVID-19 epidemic in China where aerosol levels have substantially reduced, compared with the climatological mean levels for a 19 year period. Our analyses find that DTRs from February to June during the COVID-19 pandemic are greater than 3 standard deviations above the climatological mean DTR. This anomaly has never occurred before in the 21st century and is at least in part associated with the observed reduction in aerosols.
Environmental significanceThe outbreak of the COVID-19 pandemic and the concomitant lockdown, which leads to a reduction in aerosols, enable us to test the relationship between aerosol presence in the atmosphere and the diurnal temperature range (DTR). Our analyses find that DTRs from February to June during the COVID-19 pandemic are greater than 3 standard deviations above the climatological mean. This anomaly that has never occurred before in the 21st century is, at least in part, associated with the observed reduction in aerosols. We believe this is a pilot study to examine the inverse relationship between aerosol presence and the DTR. The work will offer important findings to address the decades-long debates over the role of aerosols in contributing to climate variations and change. |
In 2020, many countries went into lockdown during the COVID-19 pandemic. Among them, China was the first one beginning with the lockdown in Wuhan, Hubei from January 23. To curb the spread of the virus, the Chinese government imposed heavy restrictions on various economic activities including motor vehicle traffic throughout the nation. Restrictions peaked in February and continued till June, but with some restrictions lifted gradually. Those restrictions have led to a remarkable reduction in the emission of primary air pollutants, which has recently been widely reported.6–10 For example, nitrogen dioxide (NO2) concentrations have decreased exceptionally in China as a result of the lockdown.6,7 Concentrations of particulate matter 2.5 μm in diameter (PM2.5) have also declined, particularly in northern China.7 Furthermore, aerosol optical depth (AOD) has reduced remarkably across the country during the lockdown period (February to June in 2020); a drastic drop in AOD occurred in Eastern China and the Sichuan Basin (Fig. 1). The national mean AOD change during the lockdown is −0.0682 (95% confidence interval [−0.0749 –0.0616]; p <0.01) compared with the 19 year period climatology pattern during February to June of 2001–2019, nearly double the change from July 2019 to January 2020 before the lockdown period (−0.0345; 95% confidence interval [−0.0389 –0.0300]; p <0.01).
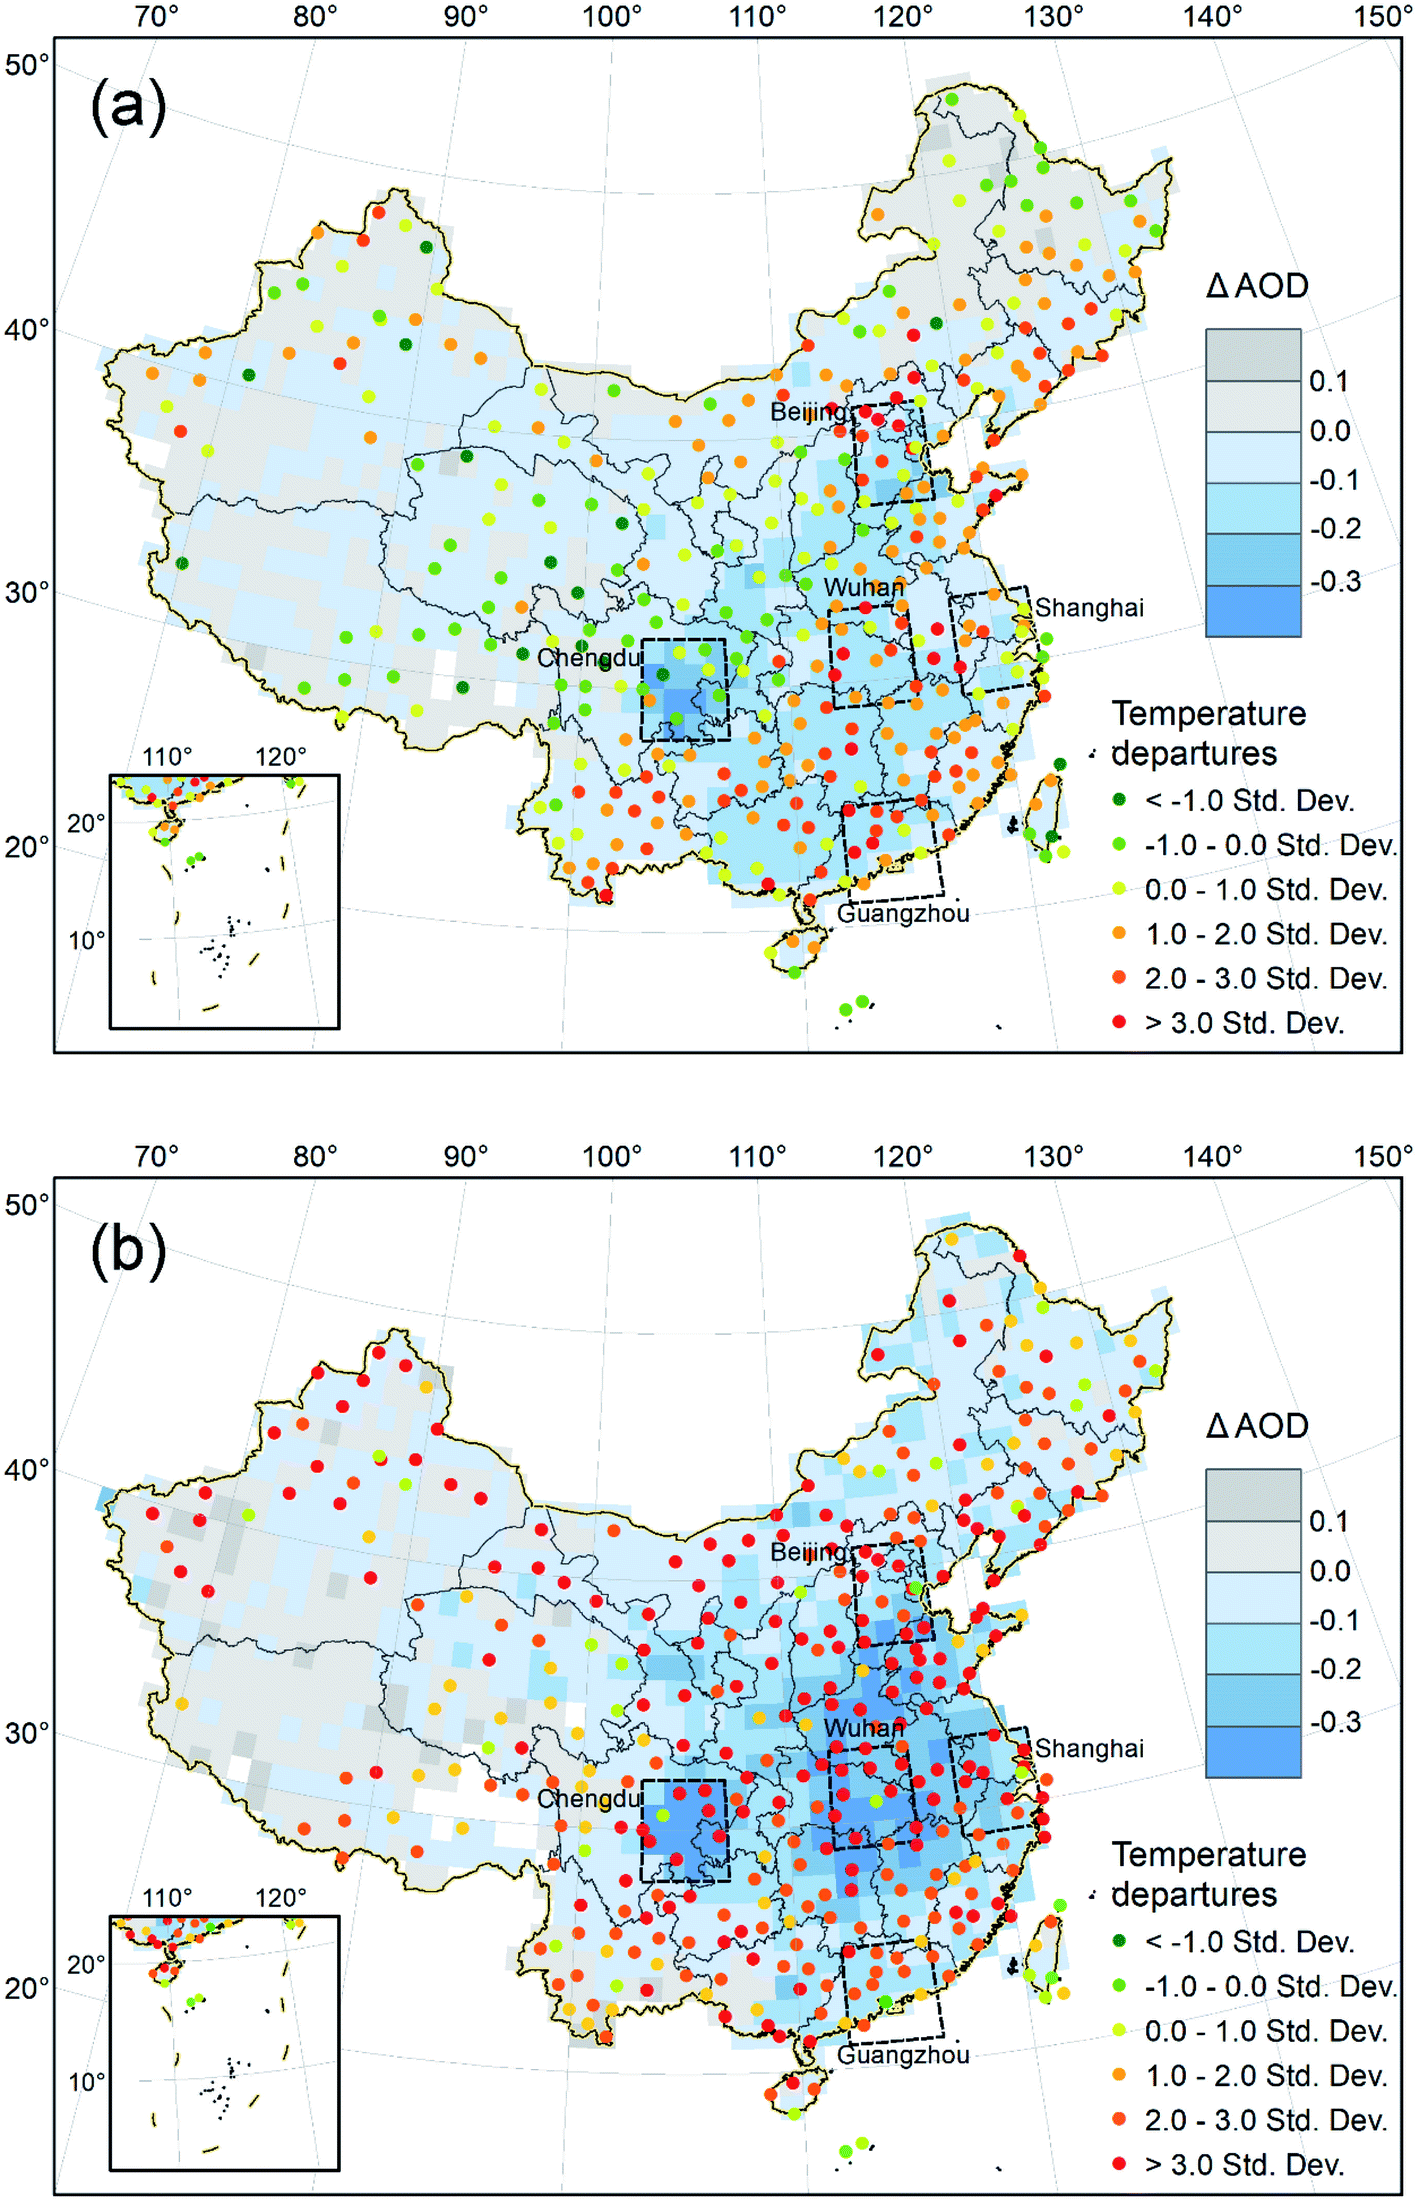 | ||
| Fig. 1 Spatial pattern of mean AOD changes during the period from July 2019 to January 2020 (a), and the period from February to June 2020 (b) compared with the climatology pattern of the preceding 19 years in China (shades); standard deviation departures of average DTRs during the two periods from the climatological values at weather stations (dots). Regional analyses were conducted in the 4° × 4° regions around Beijing, Chengdu, Wuhan, Shanghai, and Guangzhou. AOD data were derived from the MODIS-Terra MOD08 M3 v6.1 dataset.22 | ||
To test the general hypothesis that the reduction of aerosol increases the diurnal temperature range, we compared DTR values for every month before and during the lockdown period, July 2019 to June 2020, with those for the 19 year period extending from July 2000 to June 2019. We collected maximum and minimum temperature data of all weather stations over China from the Global Summary of the Day (GSOD) dataset.11 A month is treated as missing for a station if it missed five or more days in that month. Stations with more than two missing months were excluded from the analysis. There are 361 stations with valid observation throughout the period 2000–2020 after strict data quality controls. Almost all stations show higher DTRs during the lockdown period compared with the climatological mean levels during the preceding 19 years (Fig. 1b). The proportion of stations with DTR departures larger than 3 standard deviations and between 2 and 3 standard deviations is 44.1% and 32.1%, respectively. Moreover, stations with more than 3 standard deviations are more likely to be found in areas with decreased aerosol concentrations. In contrast before the lockdown period, 74.0% stations show DTR departures between −1 to 2 standard deviations (Fig. 1a).
At the national scale, monthly mean DTRs in February, March, April, May, and June of 2020 are all significantly higher than the values for business-as-usual years 2001–2019 (Student's t-test, p <0.05; Fig. 2a). DTRs in all these five months during the COVID-19 pandemic are greater than 3 standard deviations above the climatological mean DTR—an anomaly that has never occurred before in the 21st century. In April 2020 for example, the DTR of 13.74 °C is 2.01 °C higher than the climatological mean value for the month (11.73 °C) and 1.28 °C higher than the historical maximum value (12.46 °C). In contrast, monthly mean DTRs in the seven months before the COVID-19 pandemic generally fall in the climatological range except for December 2019 (Fig. 2a).
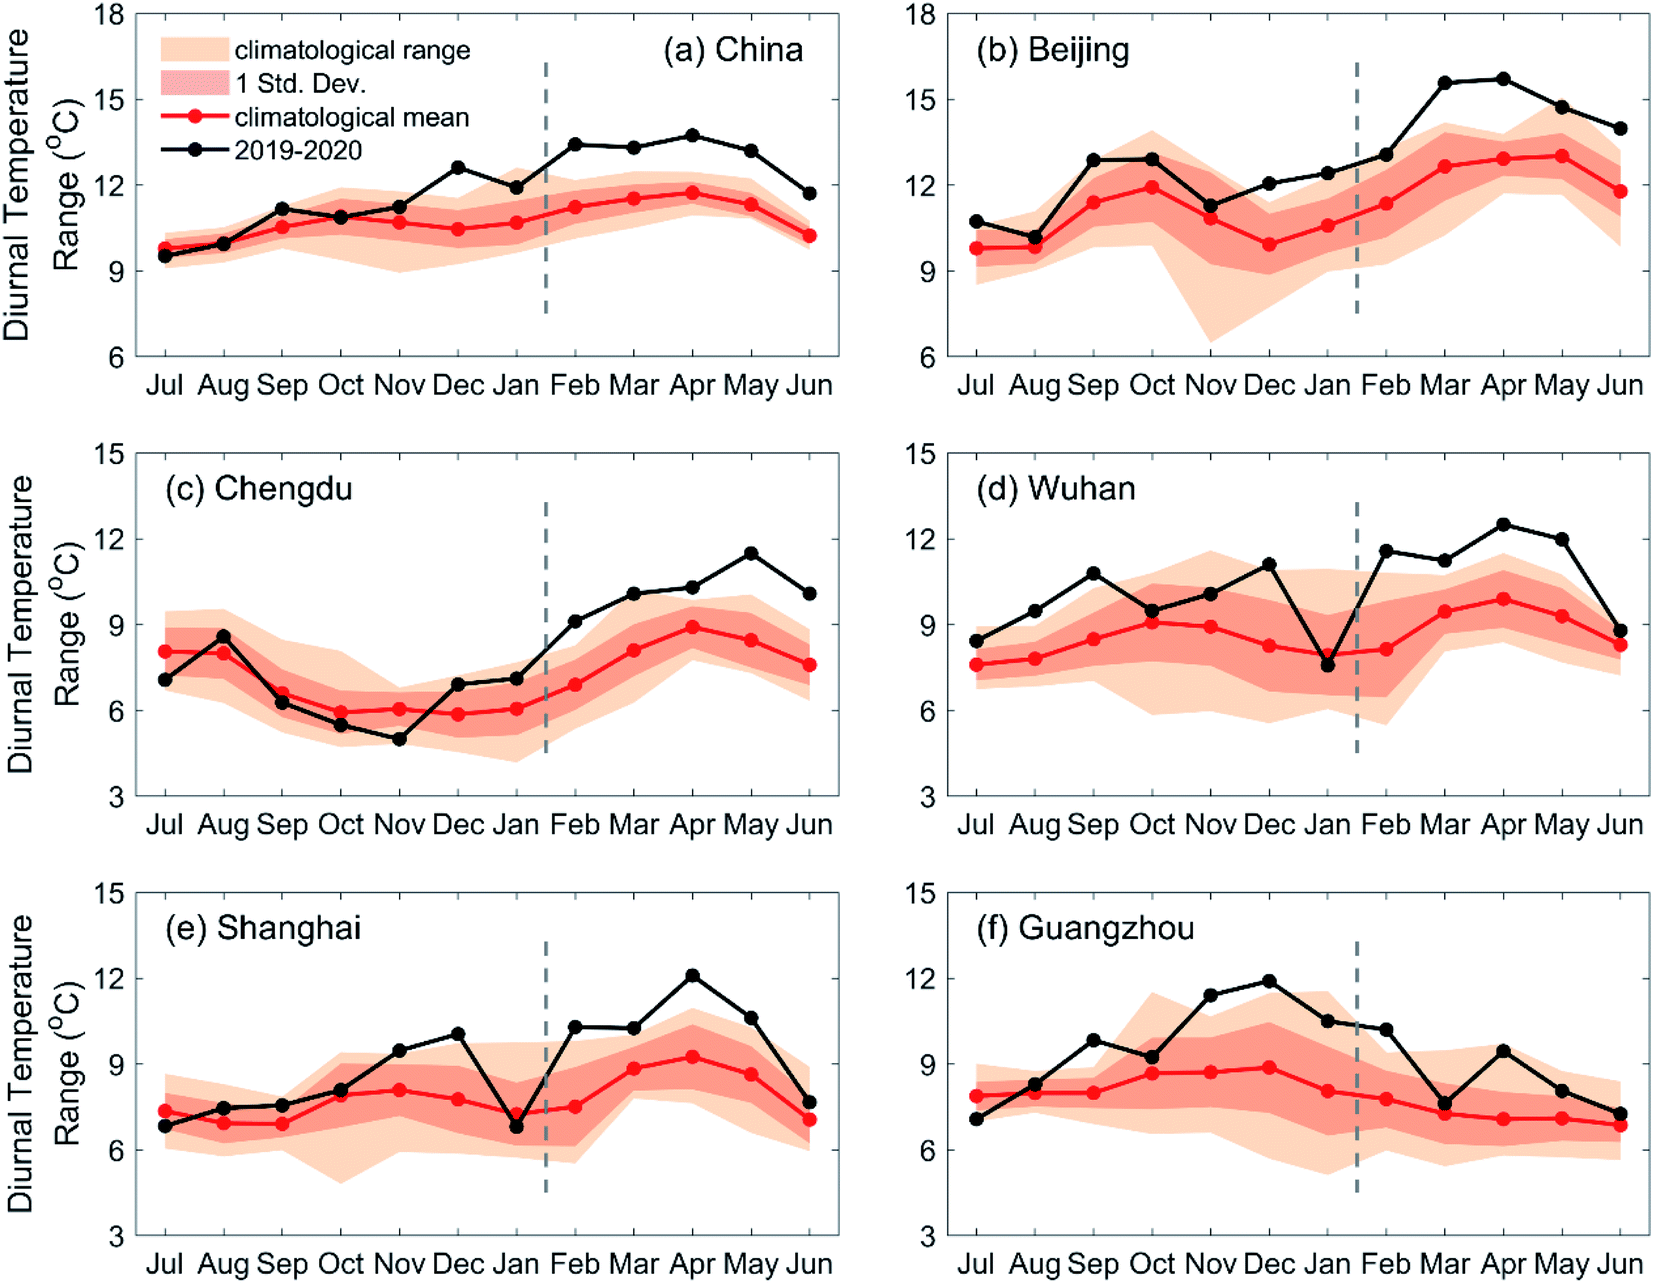 | ||
| Fig. 2 Comparison of diurnal temperature ranges (DTRs) from 2000–2019 climatology data and those for every month from July 2019 to June 2020 before and during the COVID-19 pandemic in China (a) and the five regions (b–f). The mean, 1 standard deviation range, and minimum–maximum range of the climatology data extending from July 2000 to June 2019 are represented as red line, dark shadow, and light shadow, respectively. The mean DTRs from July 2019 to June 2020 are represented as black lines. | ||
DTRs from February to June of 2020 are larger than the climatological mean values over all the five regions, but the magnitude of departures varies distinctly (Fig. 2b–f). In Beijing and Chengdu regions, DTRs in all five months during the lockdown period are 2 to 4 standard deviations greater than the climatological mean with just a few exceptions (Fig. 2b and c). By contrast, DTRs in Wuhan and Shanghai regions exhibit an obvious increment by 2 to 3 standard deviations from February to May of 2020, before a sharp drop to the previous level in June (Fig. 2d and e). The reason could be attributed to the removal of restrictions when the pandemic gradually came under control. In addition, DTRs from July 2019 to January 2020 in the above four regions generally show no obvious departure compared with the climatological range (Fig. 2b–e). Different from the other four regions, the Guangzhou region partially resumed economic activities in late February, and only a relatively weak decrease of AOD was observed during the lockdown period. As a result, the DTRs from March to June of 2020 in the Guangzhou region fall in the historical range of the preceding 19 years (Fig. 2f).
The possible relationship between the monthly DTR anomaly and the AOD anomaly is investigated before and during the lockdown period (Fig. 3). The inverse relationship between AOD reduction and the DTR increment generally held true in almost all months, though their sensitivity varies among regions. Moreover, the anomalies of DTR and AOD are larger during the COVID-19 pandemic than those before the lockdown period with a few exceptions. Besides, the DTR anomaly could arise from a number of factors such as the inter-annual variability of climatological conditions and atmospheric circulation, which may also impact other meteorological fields. Three other variables, namely, precipitation, wind speed and dew point temperature are examined by using the GSOD dataset. However, the national mean values of the three variables from February to June of 2020 fall in the historical range of the preceding 19 years (Fig. 4), implying that the changes of climatological variation may not be the main drivers of the substantially increased DTR during the COVID-19 pandemic.
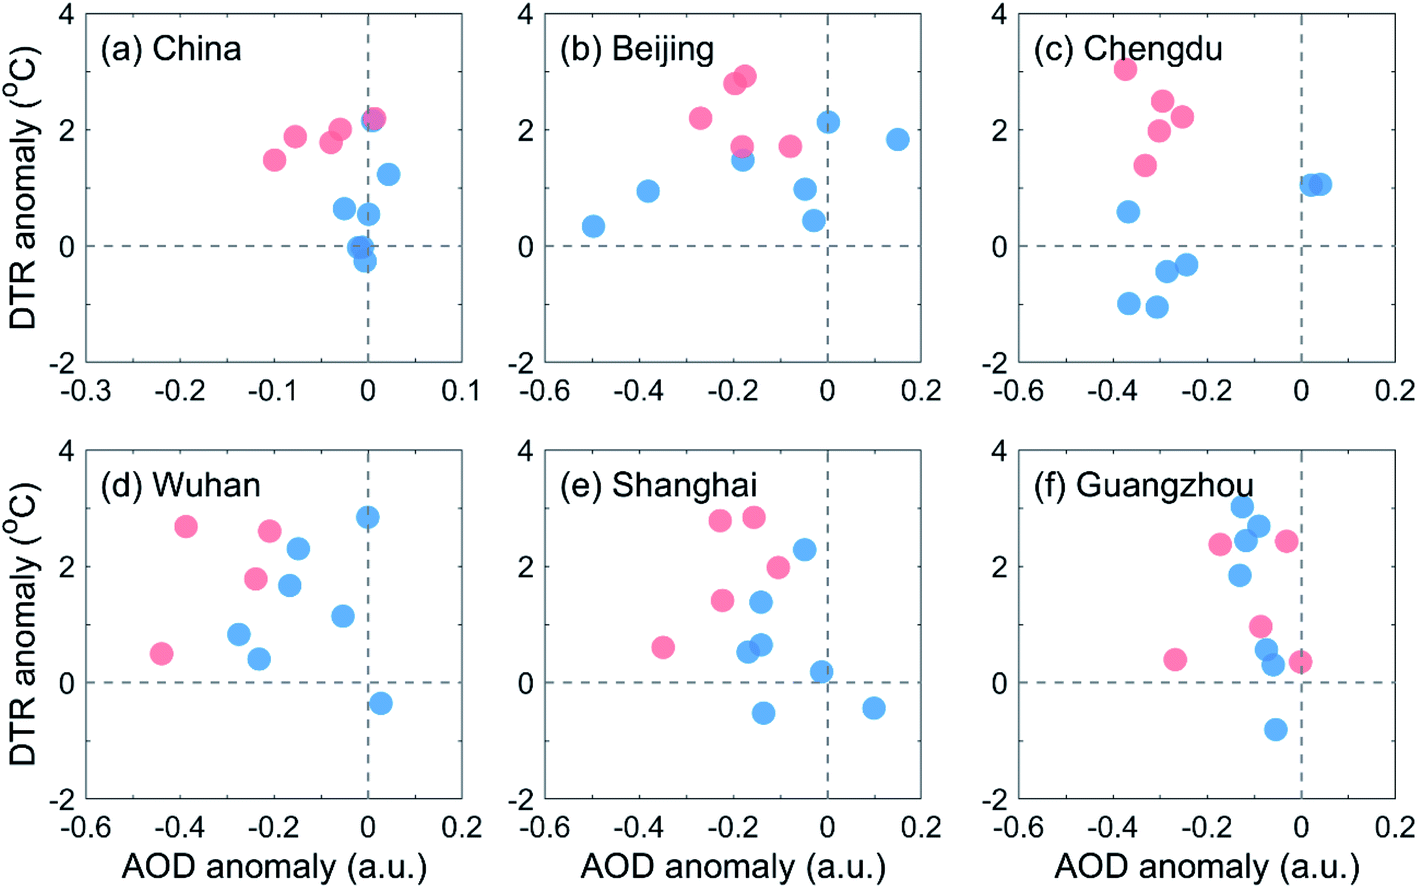 | ||
| Fig. 3 Scatterplot for the monthly mean DTR anomaly with the corresponding AOD anomaly during July 2019 to January 2020 (blue) and during February to June 2020 (red) from the 2000–2019 climatological values in China (a) and the five regions (b–f). | ||
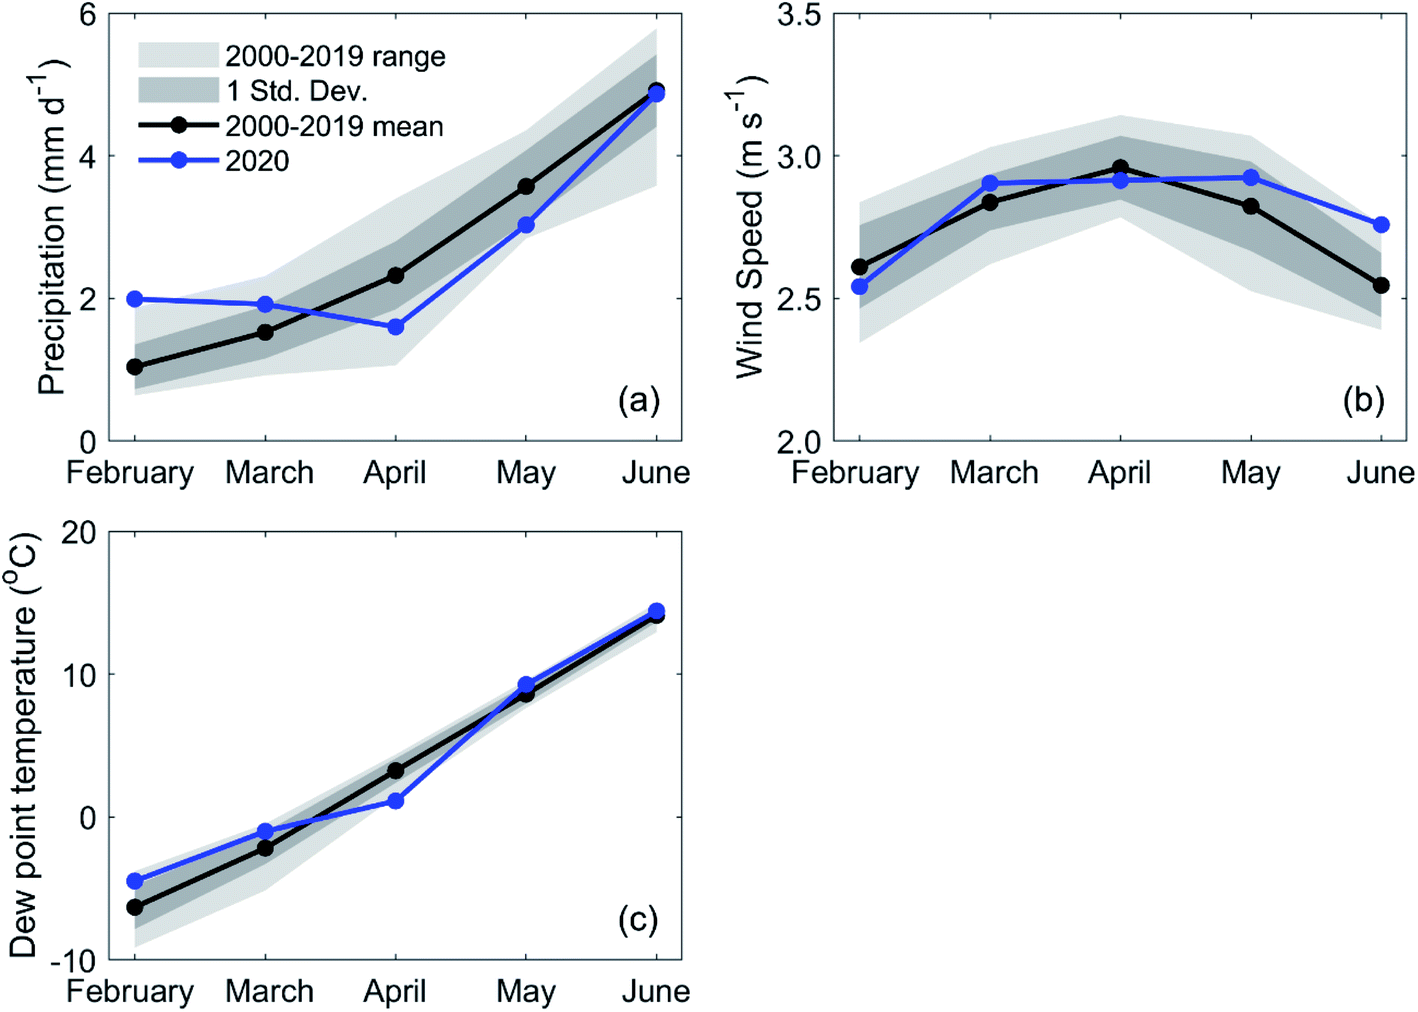 | ||
| Fig. 4 Comparison of precipitation (a), wind speed (b) and dew point temperature (c) from 2001–2019 climatology data and those for every month from February to June during the COVID-19 pandemic in China. The mean, 1 standard deviation range, and minimum–maximum range of the 2000–2019 climatology data are represented as black lines, dark shadows, and light shadows, respectively. The mean values of 2020 are represented as blue lines. | ||
We further examine the role of aerosol reduction in the changes of radiation and DTR by employing the WRF-GC model.12,13 The simulation is performed during February 2020 forced by the anthropogenic emissions during the COVID-19 pandemic compared with a control run at the emission level of 201914,15 (for details refer to the ESI†). The differences of radiation fluxes between the two experiments are investigated over China and the five regions, and then the temperature perturbations due to the change of radiation are estimated.16 The results show that the pandemic-related reduction of AOD has a significant influence on the radiation fluxes, resulting in an increase of the DTR by 0.37–0.70 °C in the five regions. The experiments confirm the important role of the pandemic-related AOD reductions in the DTR, suggesting that the AOD changes are partially responsible for the observed DTR anomaly, though the magnitude of the model estimated temperature change is lower than the observed DTR departures. This discrepancy could originate in the complex mechanisms in aerosol–cloud interactions, the uncertainties in model parameterizations, and the effect of weather variability.17,18 Nonetheless, both the observed large departures of the DTR and the model simulated radiation perturbations indicate a significant change in the climatic forcing effect of aerosols, whose concentration levels were reduced during the COVID-19 pandemic.
Aerosols scatter sunlight during daytime and therefore exert a cooling effect on the land surface,1,2,19 implying that the observed decrease of the aerosol concentration level plays a disproportionate role in weakening the day-time cooling effect. Aerosols also reduce the DTR by increasing low-level cloudiness,20,21 which enhances the reflection of short-wave radiation in the daytime20 and re-emits long-wave radiation back to the Earth's surface at night, preserving the nighttime surface temperature.21 Thus, theoretically, a reduction in aerosol levels should warm the daytime temperature and cool the nighttime temperature, an effect that is validated by the observed increasing DTR during the COVID-19 pandemic (Fig. 2 and 3).
Our findings suggest that the COVID-19 pandemic has resulted in a substantial increase in the diurnal temperature range in China that has extended from February to June of 2020. We argue that the increase is, at least in part, associated with the observed reduction in aerosols (indicated by NO2, PM2.5, and AOD data). This result is important for debates over the role of aerosols in contributing to climate variations and change.3–5 Additional in-depth analyses combining observations and climate models for this period of lockdown are needed to reduce the uncertainty in understanding relevant aerosol–climate interactions.1,2
Author contributions
Zhenzhong Zeng designed the project. Shijie Hu, Dashan Wang and Jie Wu performed the analyses. All the authors wrote the paper.Conflicts of interest
The authors declare that they have no conflict of interest.Acknowledgements
This study was supported by the National Natural Science Foundation of China (no. 42071022; 42001321) and the start-up fund provided by Southern University of Science and Technology (no. 29/Y01296122). We thank the U.S. National Oceanic and Atmospheric Administration (NOAA) for providing in situ measurements of surface air temperature dataset, and the U.S. National Aeronautics and Space Administration (NASA) for providing the satellite-observed aerosol optical depth dataset.References
- O. Boucher, et al., Climate change 2013: the physical science basis: Working Group I contribution to the fifth assessment report of the Intergovernmental Panel on Climate Change, Cambridge University Press, Cambridge, United Kingdom, 2014, pp. 595–620 Search PubMed.
- P. Forster, et al., Climate change 2007: the physical science basis: contribution of Working Group I to the Fourth Assessment Report of the Intergovernmental Panel on Climate Change, Cambridge University Press, Cambridge, United Kingdom, 2008, pp. 153–171 Search PubMed.
- P. M. Forster and S. Solomon, Observations of a “weekend effect” in diurnal temperature range, Proc. Natl. Acad. Sci. U. S. A., 2003, 100, 11225–11230 CrossRef CAS PubMed.
- Q. You, S. Kang, W.-A. Flügel, A. Sanchez-Lorenzo, Y. Yan, Y. Xu and J. Huang, Does a weekend effect in diurnal temperature range exist in the eastern and central Tibetan Plateau?, Environ. Res. Lett., 2009, 4, 045202 CrossRef.
- Y. Huang, R. E. Dickinson and W. L. Chameides, Impact of aerosol indirect effect on surface temperature over East Asia, Proc. Natl. Acad. Sci. U. S. A., 2006, 103, 4371–4376 CrossRef CAS PubMed.
- M. Bauwens, et al., Impact of Coronavirus Outbreak on NO2 Pollution Assessed Using TROPOMI and OMI Observations, Geophys. Res. Lett., 2020, 47, GL087978 CrossRef PubMed.
- X. Shi and G. P. Brasseur, The Response in Air Quality to the Reduction of Chinese Economic Activities During the COVID-19 Outbreak, Geophys. Res. Lett., 2020, 47, GL088070 Search PubMed.
- X. Huang, et al., Enhanced secondary pollution offset reduction of primary emissions during COVID-19 lockdown in China, Natl. Sci. Rev., 2020, 8, nwaa137 CrossRef.
- T. Le, Y. Wang, L. Liu, J. Yang, Y. L. Yung, G. Li and J. H. Seinfeld, Unexpected air pollution with marked emission reductions during the COVID-19 outbreak in China, Science, 2020, 369, 702–706 CrossRef CAS PubMed.
- M. Filonchyk, V. Hurynovich, H. Yan, A. Gusev and N. Shpilevskaya, Impact assessment of COVID-19 on variations of SO2, NO2, CO and AOD over East China, Aerosol Air Qual. Res., 2020, 20, 1530–1540 CrossRef CAS.
- NOAA 2020 Global Surface Summary of the Day – GSOD Online, https://data.noaa.gov/dataset/dataset/global-surface-summary-of-the-day-gsod Search PubMed.
- H. Lin, et al., WRF-GC (v1.0): online coupling of WRF (v3.9.1.1) and GEOS-Chem (v12.2.1) for regional atmospheric chemistry modeling – Part 1: Description of the one-way model, Geosci. Model Dev., 2020, 13, 3241–3265 CrossRef.
- X. Feng, et al., WRF-GC (v2.0): online two-way coupling of WRF (v3.9.1.1) and GEOS-Chem (v12.7.2) for modeling regional atmospheric chemistry-meteorology interactions, Geosci. Model Dev., 2021, 14(6), 3741–3768 CrossRef.
- B. Zheng, et al., Trends in China's anthropogenic emissions since 2010 as the consequence of clean air actions, Atmos. Chem. Phys., 2018, 18, 14095–14111 CrossRef CAS.
- B. Zheng, Q. Zhang, G. Geng, Q. Shi, Y. Lei and K. He, Changes in China’s anthropogenic emissions during the COVID-19 pandemic, Earth System Science Data Discussions, 2020 DOI:10.5194/essd-2020-355 , in review..
- Z. Zeng, et al., Climate mitigation from vegetation biophysical feedbacks during the past three decades, Nat. Clim. Change, 2017, 7, 432–436 CrossRef.
- Y. Ming, et al., Assessing the influence of COVID-19 on the shortwave radiative fluxes over the East Asian Marginal Seas, Geophys. Res. Lett., 2021, 48, GL091699 CrossRef.
- N. Wang, et al., Air quality during COVID-19 lockdown in the Yangtze River Delta and the Pearl River Delta: Two different responsive mechanisms to emission reductions in China, Environ. Sci. Technol., 2021, 55, 5721–5730 CrossRef CAS.
- A. Ångström, On the Atmospheric Transmission of Sun Radiation and on Dust in the Air, Geografiska Annaler, 1929, 11, 156–166 Search PubMed.
- B. A. Albrecht, Aerosols, Cloud Microphysics, and Fractional Cloudiness, Science, 1989, 245, 1227–1230 CrossRef CAS.
- J. Hansen, M. Sato and R. Ruedy, Long-term changes of the diurnal temperature cycle: implications about mechanisms of global climate change, Atmos. Res., 1995, 37, 175–209 CrossRef.
- NASA 2020 Combined Dark Target and Deep Blue AOD at 0.55 micron for land and ocean Online, https://atmosphere-imager.gsfc.nasa.gov/products/monthly Search PubMed.
Footnote |
| † Electronic supplementary information (ESI) available. See DOI: 10.1039/d1ea00021g |
| This journal is © The Royal Society of Chemistry 2021 |