
 Open Access Article
 This Open Access Article is licensed under a Creative Commons Attribution-Non Commercial 3.0 Unported Licence
A proposed framework to establish in vitro–in vivo relationships using gastric digestion models for food research†
Joanna Nadia a,
Debashree Roya,
Carlos A. Montoyaab,
Harjinder Singha,
Alejandra Acevedo-Fania and
Gail M. Bornhorst*ac
a,
Debashree Roya,
Carlos A. Montoyaab,
Harjinder Singha,
Alejandra Acevedo-Fania and
Gail M. Bornhorst*ac
aRiddet Institute, Massey University, Private Bag 11222, Palmerston North, New Zealand. E-mail: gbornhorst@ucdavis.edu
bSmart Foods & Bioproducts, AgResearch, Te Ohu Rangahau Kai Facility, Palmerston North 4474, New Zealand
cDepartment of Biological and Agricultural Engineering, University of California, Davis, CA, USA
First published on 20th September 2024
Abstract
In vitro digestion methods have been utilized in food research to reduce in vivo studies. Although previous studies have related in vitro and in vivo data, there is no consensus on how to establish an in vitro–in vivo relationship (IVIVR) for food digestion. A framework that serves as a tool to evaluate the utility and limitations of in vitro approaches in simulating in vivo processes is proposed to develop IVIVRs for food digestion, with a focus on the gastric phase as the main location of food structural breakdown during digestion. The IVIVR consists of three quantitative levels (A, B, and C) and a qualitative level (D), which relate gastric digestion kinetic data on a point-to-point basis, parameters derived from gastric digestion kinetic data, in vitro gastric digestion parameters with in vivo absorption or appearance parameters, and in vitro and in vivo trends, respectively. Level A, B, and C IVIVRs can be used to statistically determine the agreement between in vitro and in vivo data. Level A and B IVIVRs can be utilized further evaluate the accuracy of the in vitro approach to mimic in vivo processes. To exemplify the utilization of this framework, case studies are provided using previously published static and dynamic gastric in vitro digestion data and in vivo animal study data. Future food digestion studies designed to establish IVIVRs should be conducted to refine and improve the current framework, and to improve in vitro digestion approaches to better mimic in vivo phenomena.
1. Introduction
With increasing prevalence and ease of access to information about food and health, consumers are more cautious about the health impacts of the food they consume. This widens the focus of food research and development from improving the sensory experience during food consumption to the physiological responses and health benefits of foods.1 Increasing health benefits from foods can be achieved by understanding the food digestion process, starting from the sensory perception and initiation of structural breakdown in the mouth (oral phase), further physical and biochemical digestion in the stomach (gastric phase), biochemical digestion in the small intestine (small intestinal phase) followed by nutrient absorption and dietary fiber fermentation in the distal small intestine, and the fermentation of the unabsorbed materials in the large intestine (large intestinal phase).2–5The nutrient release, absorption, and bioavailability from foods have been linked to structural changes during the digestion process, highlighting the importance of food structure and its evolution after consumption on physiological outcomes.6 In vitro digestion models have become a valuable tool to study the structural changes of food during digestion, which has resulted in a growing number of studies focusing on in vitro food digestion.7–9 In addition to these in vitro studies, previous in vivo studies have suggested gastric digestion as a rate-limiting step to the digestion and nutrient bioavailability in the small intestine, indicating the importance of the stomach in the overall digestion processes.10–13 As a result, numerous in vitro gastric digestion approaches have been developed and used extensively to predict changes of foods in the in vivo stomach.
Currently there are various in vitro gastric digestion models and protocols in the literature, which have features and parameters that are derived from in vivo data with the expectation to simulate physiological conditions. However, considering the complexity of physiological responses that regulate in vivo gastric digestion, the use of certain digestion parameters based on available in vivo data in an in vitro study may not guarantee an accurate simulation of in vivo phenomenon.8,14–16 Therefore, it is important to identify how data generated from in vitro gastric digestion models are related to in vivo gastric digestion data, which is useful to evaluate the performance and limitations of the in vitro approach used.
Various quantitative and qualitative methods to identify relationships between in vitro and in vivo food digestion data, or in vitro–in vivo relationships (IVIVR), have been reported in the literature as an attempt to validate in vitro digestion models.8,17–22 However, there has been no consensus on how an IVIVR should be established in food research. There are no clear guidelines on how an IVIVR can be utilized to interpret the limitations of in vitro digestion, as well as to improve in vitro approaches to better mimic physiological outcomes. Guidelines on IVIVR establishment for food research would be useful in the translation of in vitro food digestion data to certain health benefits or physiological effects, which is likely the future direction of food digestion research. Although currently the use of in vitro studies for food labelling to support food nutrition- and health-related claims has not been regulated, the increasing use of in vitro digestion models may be accompanied with regulatory requirements in the future to inform consumers.17,23 This suggests the need for establishing a framework for developing IVIVRs for food digestion research that focuses on the gastric phase as the main location of structural transformation during digestion. Such a framework will be useful to determine specific relationships between in vitro digestion methods with in vivo digestion processes, as well as to identify limitations in mimicking the complex physiological aspects of in vivo digestion processes in vitro.
The closest framework to an IVIVR for food digestion was the food breakdown classification system (FBCS) framework proposed by Bornhorst et al.17 In the FBCS framework, the likelihood of similarity between in vitro and in vivo gastric digestion of solid foods was classified according to the initial hardness and rate of softening of foods during in vitro gastric digestion. However, foods are not always consumed in solid form and a relationship to in vivo data was not directly established in that work. There is an opportunity to develop a framework to relate in vitro and in vivo data that can be applied to any type of food without restrictions on physical form, and without being limited by a specific digestion model or method, which will help researchers in food area to evaluate and improve their in vitro digestion approaches. Here, an IVIVR framework is proposed for food digestion with a focus on the gastric phase. The framework was adapted from the in vitro–in vivo correlation practices in the pharmaceutical field.24 Case studies are provided using previously published in vitro and in vivo data to demonstrate the application of the IVIVR framework, selected works from the literature are reviewed, a description is given as to how they would fit within this proposed framework, and challenges and opportunities in utilizing the IVIVR framework for future studies are identified.
2. In vitro–in vivo correlation (IVIVC) in the pharmaceutical field
In vitro studies (in the form of drug release testing using a standard apparatus) are commonly used by the pharmaceutical industry as a tool to study and predict the in vivo performance of pharmaceutical products, due to their less time- and cost-intensive nature compared to clinical or animal studies.25 The utilization of in vitro studies to predict the physiological outcome of oral drugs in the pharmaceutical field is clearly regulated, where a meaningful relationship between in vitro dissolution and in vivo absorption behavior of a dosage form must be established prior to using in vitro testing as a surrogate for an in vivo study.24,26 Such relationship between in vitro dissolution and in vivo absorption data in pharmaceutical products is known as an in vitro–in vivo correlation (IVIVC).27An IVIVC is defined by United States Food and Drug Administration (FDA) as “a predictive mathematical model describing the relationship between an in vitro property of an extended-release dosage form and a relevant in vivo response”.24 In establishing a successful IVIVC in the pharmaceutical field, the in vitro and in vivo studies must be appropriately designed and constructed.28 It is recommended to use three or more formulations that represent slow-, medium-, and fast-release rates to gather in vitro and in vivo kinetic data to define an IVIVC, although a minimum of two formulations with contrasting release rates (e.g., highest and lowest release rate) can also be used.29,30 The in vivo response, which is generally obtained as peripheral plasma concentration over time, must be mathematically transformed to in vivo release or absorption data prior to correlating with in vitro data.26,28
An IVIVC model is generally established using linear regression analysis between in vivo and in vitro data. The model is then validated (i.e., checked for its accuracy in estimating in vivo values) by applying it to predict in vivo plasma concentration using in vitro dissolution data for either the same formulation (internal validation) or other formulations with different release rates (external validation). The prediction error of the model is calculated as the difference between the measured in vivo values with the predicted values based on the model. The model is considered validated if the mean absolute percent error (MAPE) across all formulations tested does not exceed 10%, and the prediction error for individual formulations does not exceed 15%.25,31 After model development and validation are completed, the IVIVC model can be used to predict the in vivo profile using the in vitro dissolution profile of drug formulations with similar dissolution or release mechanisms.31,32 A validated IVIVC can be used to request a biowaiver, i.e., an exemption to avoid in vivo bioavailability and/or bioequivalence studies for drug products with similar release mechanisms from a drug regulatory agency during drug development.25,27 Having a validated IVIVC is especially useful during production scale-up and changes in the drug manufacturing process after approval by pharmaceutical regulatory agencies (post-approval changes), which ultimately reduces the cost and time of the drug to market.31–33
Based on their ability to predict the complete profile of plasma drug levels over time, quantitative IVIVCs are divided into three main categories (Table 1): Level A, Level B, and Level C. A subcategory of Level C known as multiple Level C is also possible.24,31 Level A is considered the highest correlation, as it directly relates every data point of an in vitro (i.e., fraction of drug dissolved) and in vivo (i.e., fraction of drug absorbed) measurement over time, showing that the in vitro approach reflects the kinetics of the in vivo process for that drug. Level A correlations can be used to support biowaivers in the case of changes in the manufacturing setup that may affect the drug performance.26 A significant 1![[thin space (1/6-em)]](https://www.rsc.org/images/entities/char_2009.gif) :1 correlation is desired in Level A, which is indicated by the slope and correlation coefficient (r) that are both close to 1. During the process of correlation development, the in vitro dissolution conditions may be adjusted to obtain a 1:1 in vitro–in vitro correlation.24,28 Although the term “correlation” in an IVIVC specifies linear relationships between the in vitro and in vivo data, non-linear correlations, while uncommon, may also be appropriate for comparison.24
:1 correlation is desired in Level A, which is indicated by the slope and correlation coefficient (r) that are both close to 1. During the process of correlation development, the in vitro dissolution conditions may be adjusted to obtain a 1:1 in vitro–in vitro correlation.24,28 Although the term “correlation” in an IVIVC specifies linear relationships between the in vitro and in vivo data, non-linear correlations, while uncommon, may also be appropriate for comparison.24
| Correlation | Level A | Level B | Level C | Level D |
|---|---|---|---|---|
| Example figure of correlation | 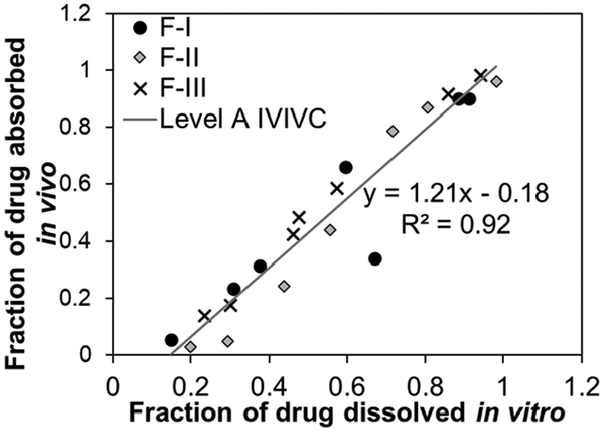 |
 |
 |
 |
| Relationship | Quantitative | Quantitative | Quantitative | Qualitative |
| Point-to-point between the in vitro release time course and the in vivo response time course | Correlation based on statistical moments/secondary parameters that characterize the overall rate of the process | Point-to-point between an in vitro dissolution and a pharmacokinetic parameter | Rank order (e.g., comparison of trends) | |
| Data points | Multiple formulations, multiple data points (time course) for each formulation | Multiple formulations, but only 1 data point (same in vitro–in vivo parameters) for each formulation | Multiple formulations, but only one data point (two different in vitro–in vivo parameters) for each formulation | Multiple formulations, one or multiple data points for each formulation |
| Examples of in vitro data | Dissolution curve (fraction of drug dissolved over time) | Mean dissolution time (MDT) | One of these parameters: | Any measurement, as long as similar variable/parameter in vitro and in vivo is measured |
| • Disintegration time | ||||
| • Time for dissolution of x% of the drug (e.g., t60%) | ||||
| • Dissolution rate | ||||
| • Dissolution efficiency | ||||
| Examples of in vivo data | Absorption curve (fraction of drug absorbed in the blood over time; obtained by mathematical transformation of plasma concentration data) | One of these parameters: | One of these parameters: | |
| • Mean residence time (MRT) | • Cmax or Tmax | |||
| • Mean absorption time | • Absorption constant | |||
| • Area under the curve (AUC – total or cumulative) | ||||
| • Time for 20%, 60%, or 80% absorption |
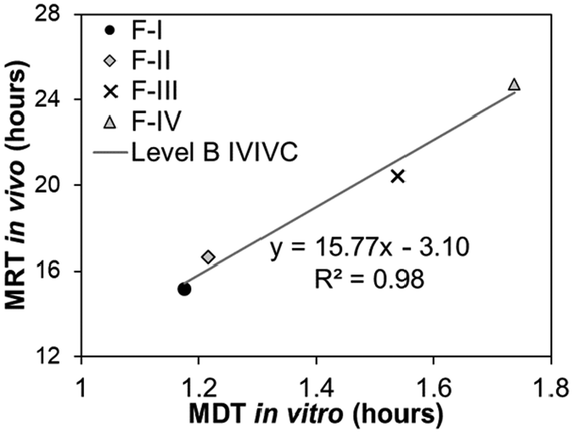
Level B correlates analogous parameters between in vitro and in vivo data derived from data reduction through mathematical modeling of the data, such as half-dissolution or half-disappearance time (Table 1). Each data point in the Level B IVIVC plot corresponds to a formulation with a specific in vitro and in vivo value. Consequently, it does not uniquely reflect the actual in vivo plasma level curve or in vitro dissolution curve as there are various possibilities of kinetics that have the same half-dissolution or half-disappearance time.27 Establishing a Level B correlation requires in vitro and in vivo data from at least three formulations with different release rates. Due to data reduction to derive the analogous in vitro and in vivo parameters that does not a provide a point-to-point correlation, a Level B correlation is less predictive than Level A and has limited application in the pharmaceutical industry, including to support biowaivers. However, a Level B correlation is crucial if the dissolution rate of the drug limits the absorption process.28,31
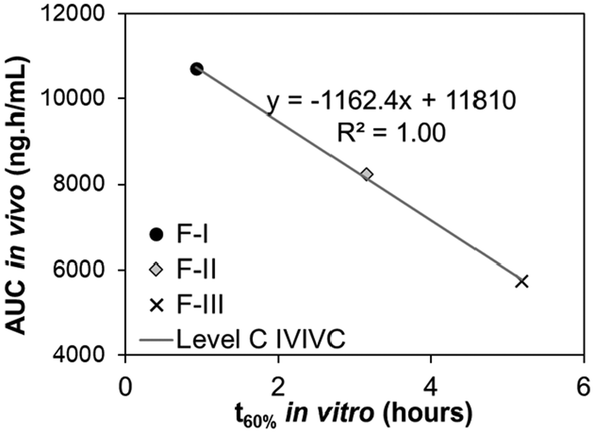
Level C correlations utilize data from multiple formulations, where each formulation contributes to one data point in the IVIVC plot. In a Level C correlation, the amount of drug dissolved in vitro at a specific time point (e.g., t60% [the time to dissolve 60% of the drug]) is correlated with one or more in vivo pharmacokinetic parameters (e.g., Cmax [maximum plasma concentration] or AUC [area under the curve of the absorption data]). When only examined at one in vitro time point, a Level C correlation cannot be used to support biowaivers since it does not reflect the complete shape of the plasma profile, but it may be useful in early stages of drug formulation development. However, if a correlation is found between in vivo pharmacokinetic parameter(s) with in vitro drug dissolution kinetics at 3 or more time points that cover the beginning, middle, and end of the dissolution profile (e.g., in vivo Cmax with in vitro t20%, t60%, and t80%), a multiple Level C correlation is present. This multiple Level C correlation can be used to justify biowaivers due to its equivalence to a Level A correlation.28,31
In addition to the three quantitative IVIVC categories, there is a qualitative correlation known as Level D. Level D cannot be used to justify a biowaiver as it correlates non-parametric rank order between in vitro dissolution parameters and in vivo pharmacokinetic parameters. However, it can be used to aid the development of a formulation or processing procedure.30
Although the IVIVC concept has been well-defined and established in the pharmaceutical area, it is noteworthy that not all drug formulations can exhibit an IVIVC. The in vitro aqueous solubility and in vivo intestinal permeability of a drug formulation, known as the Biopharmaceutics Classification System (BCS), determine the likelihood of establishing an IVIVC. There are four classes of drugs according to the BCS, where classes with high solubility and/or permeability have a higher likelihood for establishing an IVIVC, while a class with both low solubility and permeability has limited or no IVIVC expected.30,34 Further detailed discussion on establishment and limitations of IVIVCs in the pharmaceutical area are beyond the scope of this review. Readers are referred to existing reviews for more information.25–29,32,33,35
The fact that not all drug formulations can exhibit an IVIVC, as well as the presence of multiple classification systems of drug formulations, highlights the complexity in relating in vitro and in vivo pharmaceutical data. As a complex in vivo system cannot be entirely mimicked with an in vitro setup, the physicochemical properties of the drug, complexity of the delivery system, formulation composition, manufacturing method, dissolution method, and type of dissolution media used must be carefully considered during IVIVC development.31 Similar principles also apply to studies on food digestion, but with more complexities due to the variations in food structure, mastication, and physiological responses-related to food properties. Understanding available in vitro and in vivo approaches to study food digestion and how to relate the data generated in both types of studies are the first steps in interpreting findings from in vitro studies such that they can adequately mimic the in vivo food digestion process.
3. IVIVR development for food gastric digestion studies
3.1 General overview of available in vivo and in vitro gastric digestion approaches
Food digestion can be investigated through in vivo (human or animal studies), in vitro (laboratory experiments), or in silico (numerical/computational simulation) approaches.37 As this review focuses on relating in vitro with in vivo gastric digestion data, only in vivo and in vitro gastric digestion approaches are discussed here.For a comprehensive investigation of gastric digestion and the subsequent digestion processes, an ideal study design would be an in vivo study with the collection of the entire content of the gastrointestinal tract or collection of gastrointestinal content from specific locations in the gut, which is invasive and difficult to ethically conduct in human subjects. With the analysis of food across the entire gastrointestinal content, physical, chemical, and microstructural changes at a particular digestion time point can be measured from the same subject, such as: pH and enzyme distribution in specific locations in the stomach, physical properties of the digesta, chemical content of the digesta, and microstructural changes in the digesta. Although non-invasive methods, which are commonly imaging-based methods (e.g., magnetic resonance imaging and ultrasound), are preferred to study food digestion in the stomach,38–40 these methods do not provide as complete of information as invasive methods. The development of non-invasive procedures to predict in vivo physicochemical changes in the stomach is an area for future research in food digestion.
The need for an invasive study design leads to the common use of non-primate, monogastric animals (e.g., dogs, pigs, rodents) as physiologically-relevant models for the human stomach.41–43 Among the available animal models, rodents and pigs are the most commonly used, with pigs having the closest physiological resemblance to the gastrointestinal tract of humans.42,43 However, the use of animal models for research purposes is tightly regulated; it is only allowed with research ethics approval. Additionally, the planning and execution of an in vivo study is relatively complex and expensive, which is attributed to funding availability, the requirements for special expertise in preclinical studies or animal handling, longer time needed to conduct a study, and logistics of sampling. The lack of reference standards to compare the results between studies as well as inter-individual variations make data interpretation more complicated.44–46
The ethical constraints and complexities of in vivo studies have made in vitro digestion studies a more preferred and widely used approach in food digestion research, especially for rapid screening of digestibility and/or in-depth investigation of physical changes of foods in the gastrointestinal environment. Moreover, in vitro studies allow for more treatments or product formulations to be tested without significant cost and resource limitations, as well as the adjustment of digestion parameters to simulate certain physiological conditions for product development and testing purposes.47,48 Available in vitro gastric digestion models can be generally classified into static, semi-dynamic, and dynamic models based on the approach used to simulate gastric digestion processes.8 For the purpose of this review, gastric digestion models are defined and classified based on the presence of gastric wall contractions. Static models consist of a batch-type reaction (food mixed with limited or excess simulated gastric fluids) with no simulation of the mechanical breakdown and the removal of the entire digestion mixture after the assigned digestion duration.46 Semi-dynamic models consist of a model without the simulation of gastric wall contractions (typically in the form of a jacketed vessel with slow stirring at the bottom) with the simulation of gradual acidification of the digestion mixture (by gradual addition of simulated gastric fluid to the food) and gastric emptying (by sample withdrawal at designated time points).44,49 Dynamic models consist of mechanical models with a mechanism to simulate the contraction pattern of the in vivo stomach wall and the gradual acidification of the digestion mixture, as well as an outlet located at the pyloric part of the model to simulate gastric emptying.8,41,49 Detailed discussion on in vitro digestion methods and models are outside the scope of this review, and readers are referred to recent review papers for further reading.8,9,41,45,46,49–52
An important aspect in an in vitro gastric digestion study is the appropriate selection of digestion parameters, such as digestive fluid composition and pH, simulated gastric fluid:food ratio or gastric secretion rate, and gastric emptying rate. There are various protocols used by different research groups to simulate physiologically relevant gastric digestion processes, although standardized protocols for static digestion and semi-dynamic digestion have been proposed by the COST-INFOGEST network.44,53,54 Regardless of the digestion model and protocol used, it is critical to ensure that the approach is able to either mimic or provide an understanding of the food behavior in vivo, considering the lack of physiological aspects in many in vitro systems.49 As such, we propose a framework to establish IVIVRs for food digestion studies that can be applied to any type of in vitro gastric digestion approach. The framework can be utilized by food researchers to quantitatively evaluate the usefulness and identify limitations of the in vitro digestion approach, and ultimately to improve in vitro digestion models and protocols such that they can be utilized to accurately mimic in vivo food digestion. While our focus here is on the gastric phase of digestion, this framework has the possibility to be utilized in other stages of digestion (e.g. oral or small intestinal phase) in the future.
3.2 Proposed IVIVR framework for food digestion research applications
In developing the proposed framework, the term IVIVR was selected to involve both linear and non-linear relationships between in vitro and in vivo data, instead of the term IVIVC from the pharmaceutical area that focuses mainly on linear correlations. This IVIVR framework can be applied to any type of food digestion data, but in the scope of this work, a focus on gastric digestion data is emphasized due to the importance of the gastric phase in the structural transformation of food and the large variations of the approaches reported in the literature to simulate in vitro gastric digestion. Moreover, with minimal or absence of nutrient absorption in the stomach, understanding food digestion and comparing in vitro with in vivo data in the gastric phase is more straightforward compared to other gastrointestinal regions. For example, in the small intestinal phase, there are numerous variables, such as variations in the rate of gastric emptying and size of emptied particles that are not well-understood (and as such, are difficult to mimic in vitro) and will play a critical role in the subsequent digestion processes. Once the framework for IVIVRs developed here has been adopted to gastric digestion data, it is recommended that additional studies work to refine the framework to be utilized for later regions in the gastrointestinal tract (e.g. small or large intestine).It is noteworthy that gastric digestion of food involves various changes in the food matrix, which may affect the breakdown and emptying mechanisms of the food in the dynamic gastric environment. As such, the structural changes of a food matrix during gastric digestion can be described by multiple parameters (or output variables), which may differ across food structures and composition, and may be limited by the type of in vitro or in vivo gastric digestion approach used. The need for having multiple different output variables for assessing IVIVRs in food digestion emphasizes the high level of complexity of such processes, compared to oral drug delivery that commonly focuses on the dissolution process of the drug. However, the use of multiple parameters also emphasizes the IVIVR framework proposed here provides enough flexibility to compare different parameters from various foods at different IVIVR levels, depending on the specific product(s) of interest and the specific outcome desired from the in vitro or in vivo study.
When developing an IVIVR, care should be taken in selection of the food products and the in vitro and in vivo methods utilized. It is recommended that a developed IVIVR may be applied to foods of similar composition and structure as those that were utilized in its development, and must note the specific in vitro (e.g. static, dynamic, etc.) method and in vivo species/population (e.g. healthy adult humans, growing pigs, etc.) that were utilized to develop the IVIVR. It should be noted that conclusions drawn from development of an IVIVR for a specific food product × in vitro method × in vivo study combination may not necessarily represent all food products (especially those foods with very different structure and/or composition to the foods utilized in the IVIVR development) or results from different in vivo species or populations. It is also important to select digestion parameters for development of the IVIVR that are relevant to the specific food products tested and will be applicable for future applications of the IVIVR.
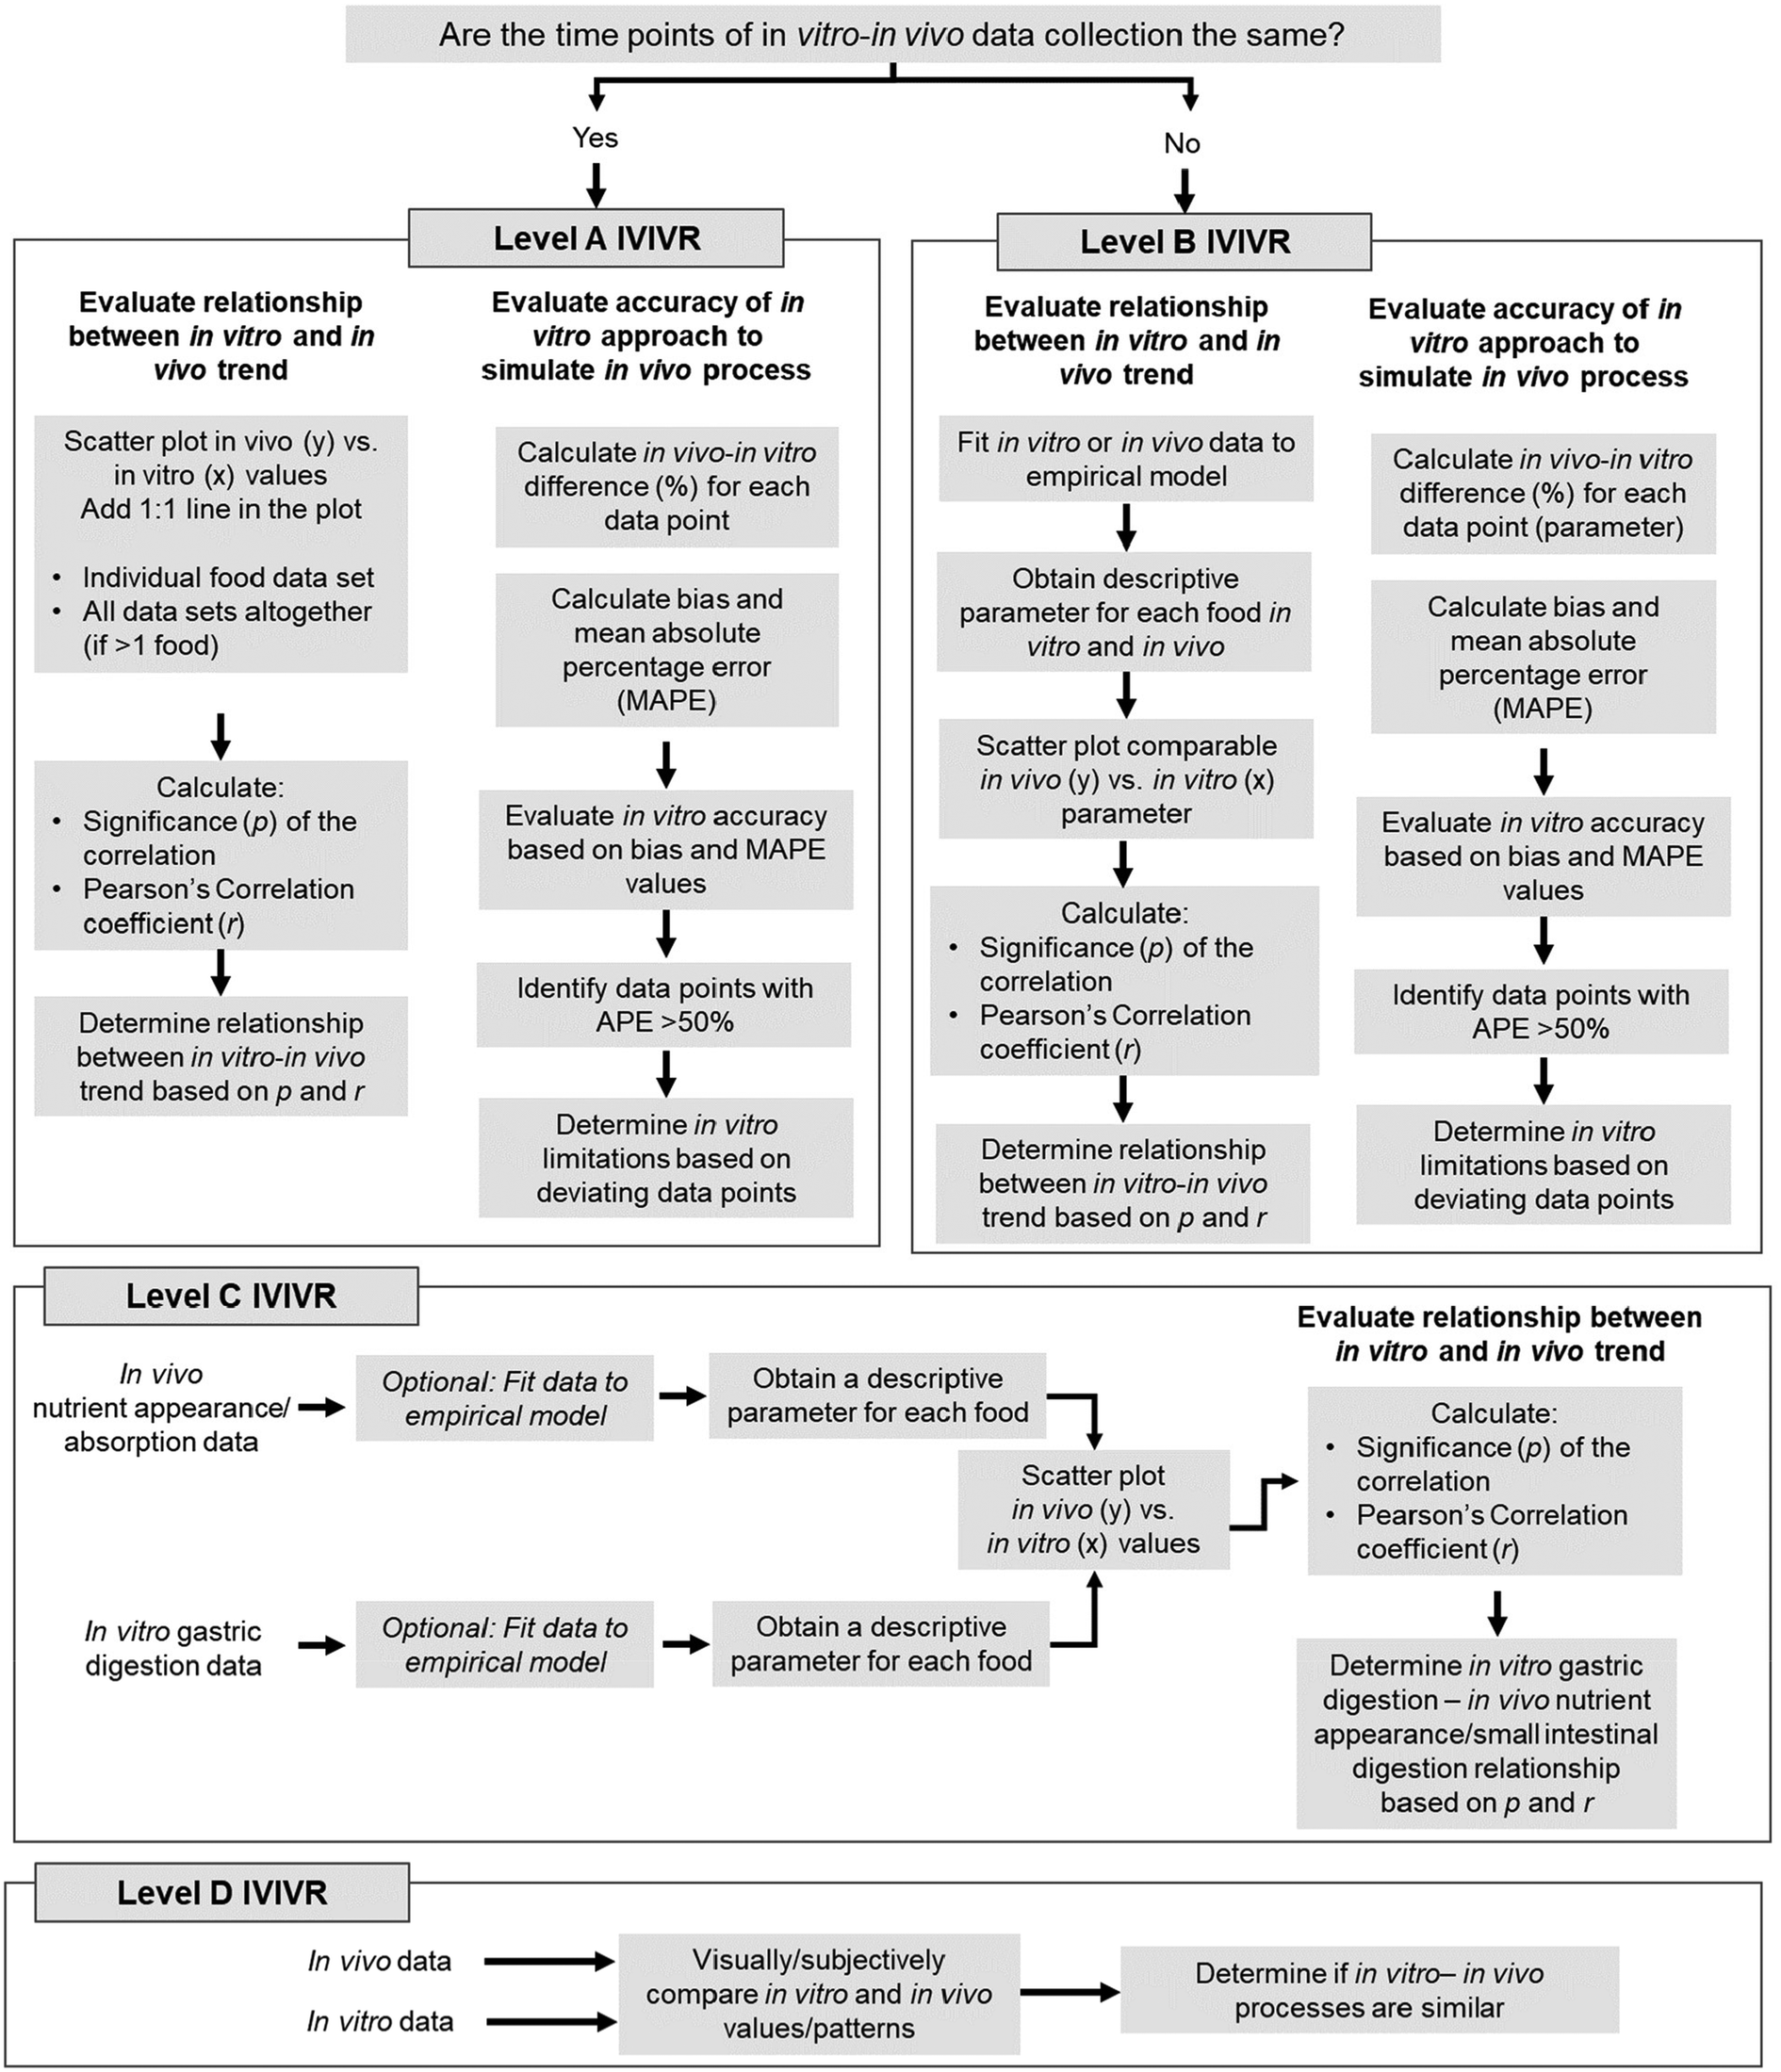 | ||
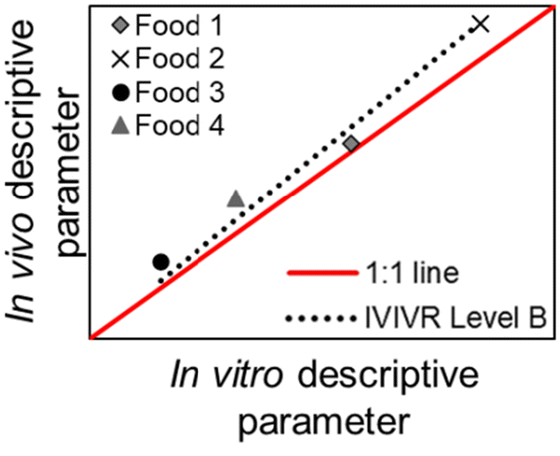
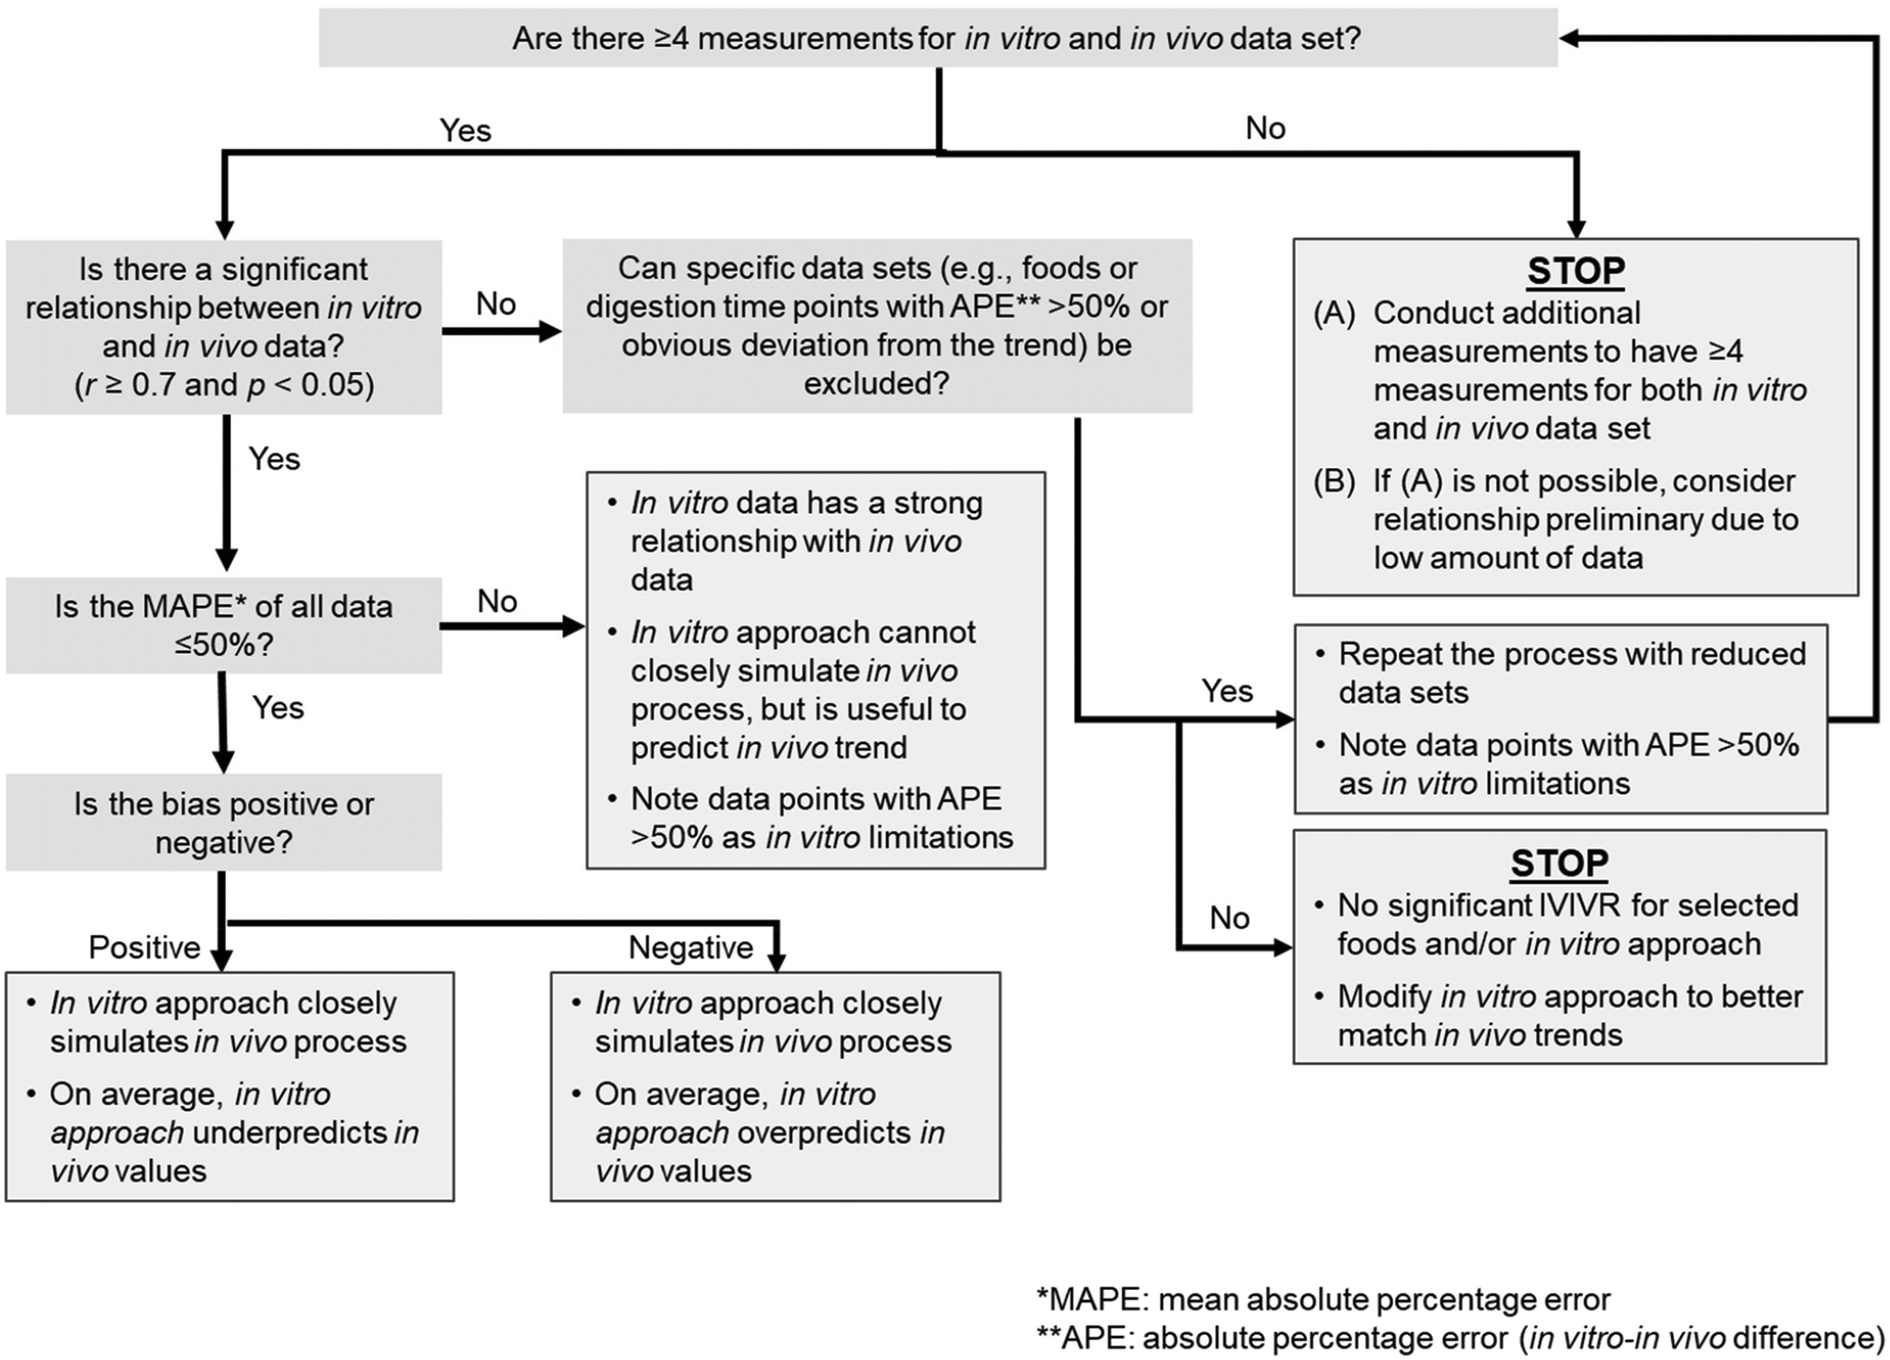
| Fig. 1 Step-by-step diagram to establish IVIVR at the different levels according to the proposed IVIVR framework (Table 2). Thresholds for quantitative values are detailed in Table 3. A more detailed decision tree for establishing a Level A or B IVIVR is provided in Fig. 2. It should be noted that an IVIVR must also contain clear information on the in vitro and in vivo approach utilized for data generation, the food products tested, and any data excluded from the relationship to avoid unnecessary extrapolation. | ||
| Relationship | Level A | Level B | Level C | Level D |
|---|---|---|---|---|
| Illustration of relationship | 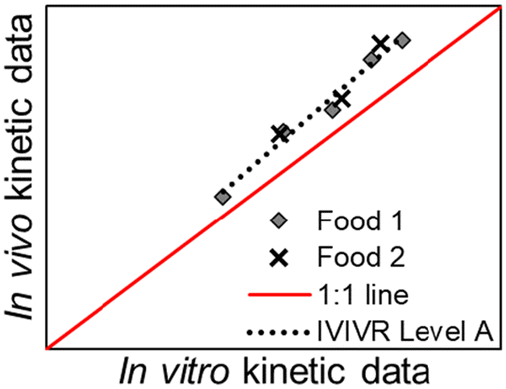 |
 |
 |
 |
| Type of relationship | Quantitative | Quantitative | Quantitative | Qualitative/semi-quantitative |
| In vivo kinetic data vs. in vitro kinetic data (paired at the same time point) | An in vivo vs. an in vitro kinetic secondary parameter | An in vitro gastric digestion parameter vs. an in vivo small intestinal digestion/blood nutrient appearance parameter | Based on visual similarity between in vitro and in vivo data | |
| Number of data points per food product involved | Multiple (time-course data, covering the beginning, middle, and end of digestion) | One (single descriptive value, typically derived from mathematical/empirical modeling of the data) | One in vitro gastric digestion and one in vivo small intestinal digestion/blood nutrient appearance (single descriptive value or derived from mathematical/empirical modeling of the data) | Can be a group of data that is observed as a whole, or a single qualitative observation |
| Minimum number of food products needed to develop relationship | Three (representing slow, medium, and fast breakdown rate) for each type or category of food | Four | Four | N/A |
| Examples of in vitro data | The same in vivo–in vitro data collected over time, such as: | The same in vivo–in vitro descriptive parameter obtained from data fitting to mathematical model, such as: | Gastric digestion parameter, such as: | The same in vitro–in vivo visually interpreted data, such as: |
| • Fraction emptied/retained | • Breakdown rate (softening half-time, disintegration half-time) | • Breakdown rate | • SDS-PAGE pattern | |
| • Fraction hydrolyzed | • Aggregation index half-time | • Aggregation index (tx%) | • Particle size distribution | |
| • Moisture content | • Gastric emptying half-time | • Gastric emptying half-time | • Microscopy observation | |
| • pH | • Gastric emptying rate constant | • Area under the curve (AUC), incremental AUC (iAUC) | • Intragastric pH change/distribution pattern | |
| • Mean retention time | • Nutrient degree of hydrolysis | • Rank order/trend of measured values | ||
| • Mean particle size (D50) | • Fraction released at a selected time point | |||
| Examples of in vivo data | Appearance of nutrient in blood parameter, such as: | |||
| • AUC, iAUC | ||||
| • Maximum plasma nutrient concentration at a selected time point | ||||
| Small intestinal absorption parameter, such as: | ||||
| • Rate of absorption | ||||
| • % Bioaccessibility | ||||
| • % Digestibility | ||||
| Significance to the evaluation of the in vitro approach | To evaluate the physiological relevance and limitations of the in vitro method or model | To determine if the in vitro approach has the same trend found in vivo and evaluate factors that cause differences between in vitro–in vivo trends | To identify if gastric digestion is a limiting factor in nutrient release and absorption | To complement quantitative observations |
| When to apply the approach | • When sampling time points are the same between in vitro and in vivo | • When sampling time points are not the same between in vitro and in vivo (due to different study designs) | • (Preferred, but not required) Level A and/or Level B IVIVR has been evaluated to show similarity between in vitro and in vivo gastric digestion processes | • When data is qualitative |
| • When evaluating the performance of selected in vitro measurements to reproduce in vivo kinetics | • When comparing kinetic parameters between in vitro vs. in vivo studies | • If there is in vivo evidence of the relationship between gastric digestion and nutrient absorption | • When comparing general trends between in vivo and in vitro processes | |
| Cautions in interpretation | • Sufficient number of data points are needed to establish reliable correlation | • Different in vitro or in vivo profiles may produce similar secondary parameters | • The presence of Level C correlation does not indicate similar kinetics between gastric and small intestinal digestion (it may occur “by chance”) | • Cannot be used as the sole basis to evaluate an in vitro approach |
| • Digestion time at which deviation from 1:1 correlation needs to be identified together with the possible factors causing the deviation |
• It may not indicate similarities in the kinetics, but in in vitro trend can reliably mimic the in vivo results | • Relationship is applicable for foods within the same product cateogry or type as those used to establish the relationship | • Qualitative comparison is very subjective and may be influenced by the observer's bias | |
| • Relationship is applicable for foods within the same product cateogry or type as those used to establish the relationship | • Relationship is applicable for foods within the same product cateogry or type as those used to establish the relationship |
A Level A IVIVR directly compares the kinetics of a gastric digestion process as a point-to-point relationship through pairing of in vitro and in vivo data collected at the same digestion time point in a scatter plot (Table 2). The digesta properties to be related must be carefully selected to represent a gastric digestion process and changes that may occur over time. For example, the pH of digesta remaining in the stomach can be selected as an indicator of gastric acidification; the fraction of hydrolyzed protein in the stomach relative to the initial total protein can be selected as an indicator of gastric proteolysis. For each food tested, at least three digestion time points are needed to establish a Level A IVIVR, which should cover the beginning, middle, and end of the digestion process. With the use of time-course data, evaluation of a Level A IVIVR also enables the evaluation of the physiological relevance of the in vitro approach (see section 3.2.2). Three different food products are suggested to obtain a Level A IVIVR. However, two types of foods may be acceptable if there is evidence of their contrasting digestive behavior obtained through in vivo studies (e.g. slow vs. fast gastric emptying). The behavior of each food should be monitored at early, middle, and late digestion times to capture the entire digestion kinetics. While a Level A IVIVR can also be explored on only one type of food, it is not recommended for extrapolation of the in vitro approach to other foods, because it is unclear whether the in vitro approach would produce similar accuracy to the in vivo system when applied to other types of food.
A Level B IVIVR relates in vitro and in vivo descriptive parameters of food digestion. The digestion kinetics of each food are represented by a single descriptive parameter (e.g., gastric emptying half-time, gastric breakdown half-time), thereby each food contributes to one data point in the scatter plot (Table 2). The descriptive digestion kinetic parameter for each food is obtained by collecting the kinetic data of a digestion process for each food and fitting the data from each food to an appropriate empirical or mathematical model. For example, a modified-exponential model can be used to describe the gastric emptying of solid foods with parameters of gastric emptying rate constant, lag phase, or gastric emptying half-time;55,56 the Weibull equation can be used to describe the softening process (an indicator of breakdown process) of solid food in the stomach with parameters of softening half-time, the shape parameter, and the scale parameter.10,57 At least four products with varying rate or degree of structural changes in the in vivo stomach are recommended to evaluate a Level B IVIVR.
Level C is a quantitative relationship between a value derived from in vitro gastric digestion time-course data and a value from in vivo small intestinal digestion/absorption time-course data. When a Level C IVIVR is present between an in vitro gastric digestion parameter with an in vivo absorption parameter, the structural transformation of the food during gastric digestion is likely to be the limiting factor to nutrient release and absorption in the small intestine, such that the trends in in vivo nutrient absorption can be predicted using in vitro gastric digestion. It is preferred that Level A and B IVIVRs have been evaluated prior to evaluating Level C IVIVR. However, in the case that Level A and B IVIVRs cannot be evaluated, a Level C IVIVR can be evaluated given the relationship between an in vitro gastric digestion parameter and a small intestinal digestion/absorption parameter has been reported in vivo. For example, gastric emptying rate has been reported to affect the maximum change of plasma glucose (Δmax,glucose) in humans and growing pigs for carbohydrate-based foods,12,58 such that a Level C IVIVR can be evaluated for an in vitro gastric digestion emptying rate parameter and in vivo Δmax,glucose.
Level C IVIVRs should include at least four food products; the products should either have varying rates of structural changes in vitro, or varying rates of nutrient absorption properties (e.g., area under the curve (AUC) of blood plasma concentration over time). Similar to a Level B IVIVR, each food tested contributes to one data point in the IVIVR plot. The relationship can be either linear or non-linear, and if needed, a non-linear relationship can be linearized through data transformation to evaluate the linear R2 equivalent. A Level C IVIVR is not a point-to-point comparison between the same type of data, thus the scale (and units) between x- and y-axes can be different.
The last IVIVR level proposed is Level D, which implies certain similarities between in vitro and in vivo data, but with less certainty compared to a level A, B, or C IVIVR. In Level D, trends or overall profiles between in vitro and in vivo digestion data are compared based on visual inspection to determine the similarity between results, such as: (i) similarity in the overall appearance of protein bands in SDS-PAGE gels, (ii) similarity in the overall particle size distribution profile, (iii) similar appearance between in vitro and in vivo digesta, or (iv) visually similar intragastric pH profile. Level D relationships could also involve ranking of food products or trends, as in the Level D pharmaceutical correlation. Unless Level A and Level B IVIVRs have already been examined, the presence of Level D relationship does not necessarily indicate the accuracy of an in vitro gastric digestion approach in simulating an in vivo process. As such, the significance of Level D IVIVR in the evaluation of an in vitro gastric digestion approach is to provide complementary information that supports the similarities between in vitro and in vivo processes.
The evaluation of Level A and B IVIVRs involves the statistical assessment of the agreement between in vitro and in vivo data using Pearson's correlation coefficient or ordinary linear regression (Fig. 1; section 3.2.2.1). For Level A and B IVIVRs, as the in vitro and in vivo data utilized should represent the same measurement (with the same units), an assessment of the accuracy of the in vitro approach to predict in vivo values can also be conducted (section 3.2.2.2). Since Level C IVIVRs will not have equivalent data between in vitro (gastric digestion parameter) and in vivo (absorption or appearance parameter), a statistical evaluation of the relationship between the in vitro and in vivo data can be conducted, but the accuracy of the relationship cannot be evaluated (Fig. 1). Each of these steps are described in detail below. It should be noted that prior to starting an in-depth analysis of any in vitro or in vivo data, statistical outlier tests should be conducted to identify any data considered outliers, as the analyses described below will not serve to statistically detect outliers in the data sets or relationships.
3.2.2.1 Statistical evaluation of relationship between the in vitro and in vivo data (levels A, B, C). a. Calculate the correlation (linear relationship) between in vitro and in vivo data
It is recommended that the correlation between the in vitro and in vivo data is determined using Pearson's correlation procedure59 to determine the r value. An alternative approach is to use an ordinary linear regression equation that is fit to the data:
| in vivo output = slope × (in vitro output) + intercept | (1) |
The significance of the correlation (determined at p < 0.05) can be obtained by calculating the t-score and p-value of the correlation. The t-score is calculated as follows:60
 | (2) |
b. Interpret the r and p values
p-Value: p < 0.05 is required to show that there is a significant relationship between the in vitro and in vivo gastric digestion processes. It is noteworthy that the probability of obtaining p < 0.05 is greater with increasing number of data points.60 Therefore, caution is needed when interpreting the p value determined in datasets with small number of samples (<4 data points). As a result, at least 4 foods are recommended for Level B and C IVIVR (since each food contributes only one data point to the relationship).
Correlation coefficient (r): Strong correlation is defined by Pearson's correlation coefficient (r) ≥ 0.7 or the coefficient of determination of the linear regression (R2) ≥ 0.5.61 A high r or R2 should not be mistakenly interpreted as physiological relevance (Table 3); it only indicates that the in vitro digestion process follows the same direction (Level A) or trend (Level B, C) as the corresponding in vivo process.
| IVIVR Level | IVIVR parameter | Value | Interpretation |
|---|---|---|---|
| a The APE is calculated on individual data points, while the other metrics in this table represent the entire dataset utilized to develop the IVIVR at each specific level. | |||
| A, B, C | Significance of correlation (p) | p < 0.05 | Significant relationship exists between the examined in vitro and in vivo process |
| p ≥ 0.05 | No significant relationship between the examined in vitro and in vivo process | ||
| A, B, C | Correlation coefficient (r) or coefficient of determination (R2) | r ≥ 0.7 (or R2 ≥ 0.5) | High similarity in the trend and direction of in vivo and in vitro process |
| r < 0.7 (or R2 < 0.5) | Limited relationship between in vitro and in vivo process. There are variations in the in vivo process that are not properly addressed in the in vitro approach, or the in vitro approach is not applicable for certain time point or food structure | ||
| A, B | Mean absolute percentage error (MAPE) | MAPE < 20% | Accurate simulation of an in vivo process by an in vitro approach; the in vitro approach can be used to accurately mimic in vivo output |
| 20% ≤ MAPE ≤ 50% | Reasonable simulation of an in vivo process by an in vitro approach. Interpretation of the in vitro approach to mimic in vivo output must be done with caution, and individual data points should be evaluated to identify limitations in the in vitro approach | ||
| MAPE > 50% | In vivo process cannot be accurately simulated by an in vitro approach; in vitro approach needs modification | ||
| A, B | Bias | Bias < −20% | In vitro approach generally overpredicts in vivo trend |
| −20% ≤ bias ≤ 20% | In vitro approach generally predicts the in vivo trend accurately | ||
| Bias > 20% | In vitro approach generally underpredicts in vivo trend | ||
| A, B | Absolute percent error (APE)a | APE < 50% | Specific in vitro data point shows reasonable similarity to corresponding in vivo data point |
| APE > 50% | Specific in vitro data point does not show reasonable similarity to corresponding in vivo data point; can be utilized to identify limitations in in vitro approach in accurately mimicking in vivo processes | ||
Regression line equation: If a linear regression approach is utilized, the regression line equation is useful to estimate in vivo values using in vitro data, given r ≥ 0.7 and p < 0.05. However, it cannot be utilized to define the accuracy and limitations of the in vitro approach in simulating physiological reality, because the regression does not indicate which in vitro data points that deviate from 1:1 relationship with in vivo data. For example, if there are 10 pairs of in vitro–in vivo data points and the four last in vitro data points deviate further from the respective in vivo data points, but the trend of change between in vitro and in vivo data is consistent, the regression approach would still result in a high r or R2 and a significant p-value. However, the regression fails to point out when the in vitro data points start to deviate from the expected in vivo result. Alternatively, it could be that the in vitro data follows a linear trend, but this trend is not necessarily a 1:1 relationship. In this case, there may still be a high r or R2 and significant p-value, while the in vitro and in vivo data may deviate significantly from a 1:1 relationship (e.g. the Level B correlation discussed in section 3.3.2.2 and Fig. 4). Therefore, it is not recommended to use the regression line equation to evaluate the accuracy of an in vitro approach in simulating in vivo process.
3.2.2.2 Evaluation of accuracy of an in vitro approach to simulate in vivo trends (levels A, B). Once the relationship between the in vitro and in vivo trends has been established, the accuracy of an in vitro digestion approach in simulating an in vivo digestion process also needs to be evaluated, as Level A and B IVIVRs facilitate the comparison of the same variable measured in vitro and in vivo (Fig. 2). For both Level A and B IVIVRs, the following steps should also be conducted after the statistical evaluation of the IVIVR has been completed:
a. Calculate the mean absolute percentage error (MAPE) and bias
MAPE and bias were selected to evaluate the accuracy of an in vitro approach, using the in vivo data as the “true” values, as they are commonly used in the quantitative analysis of the accuracy of modeling and forecasting data:62–64
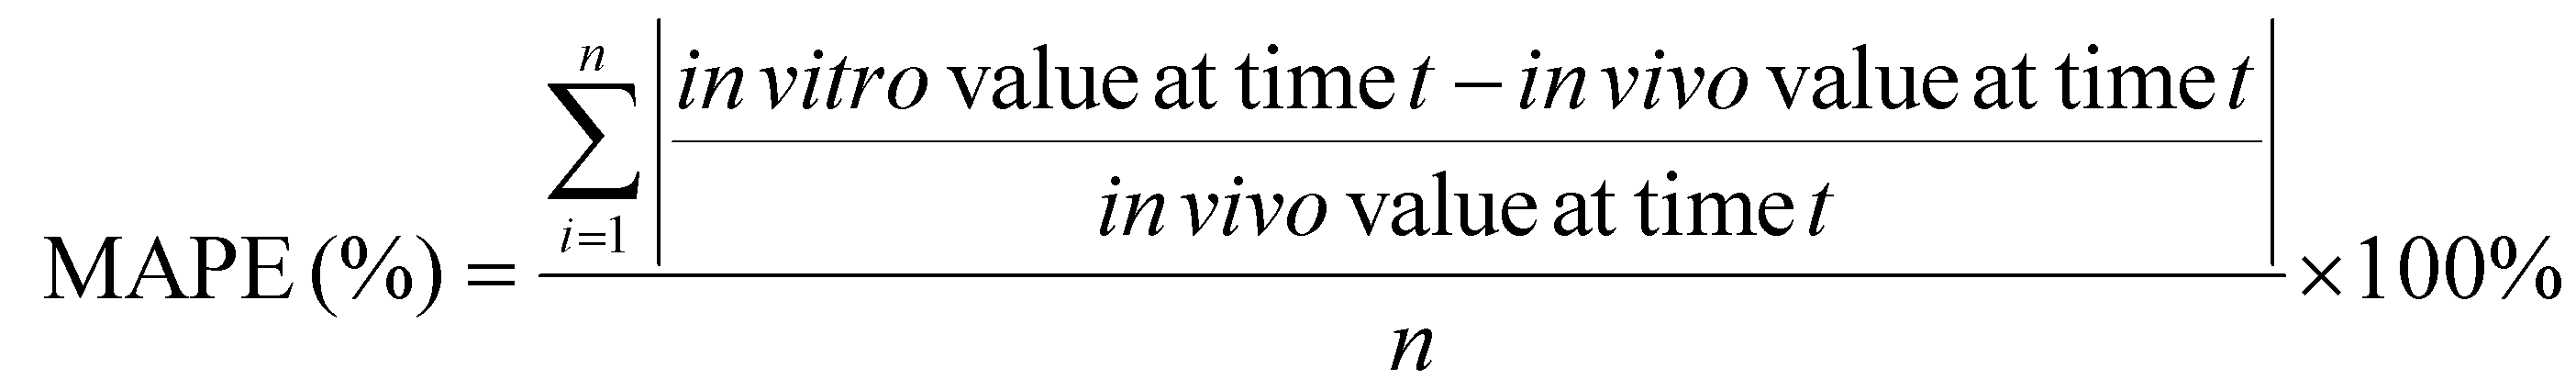 | (3) |
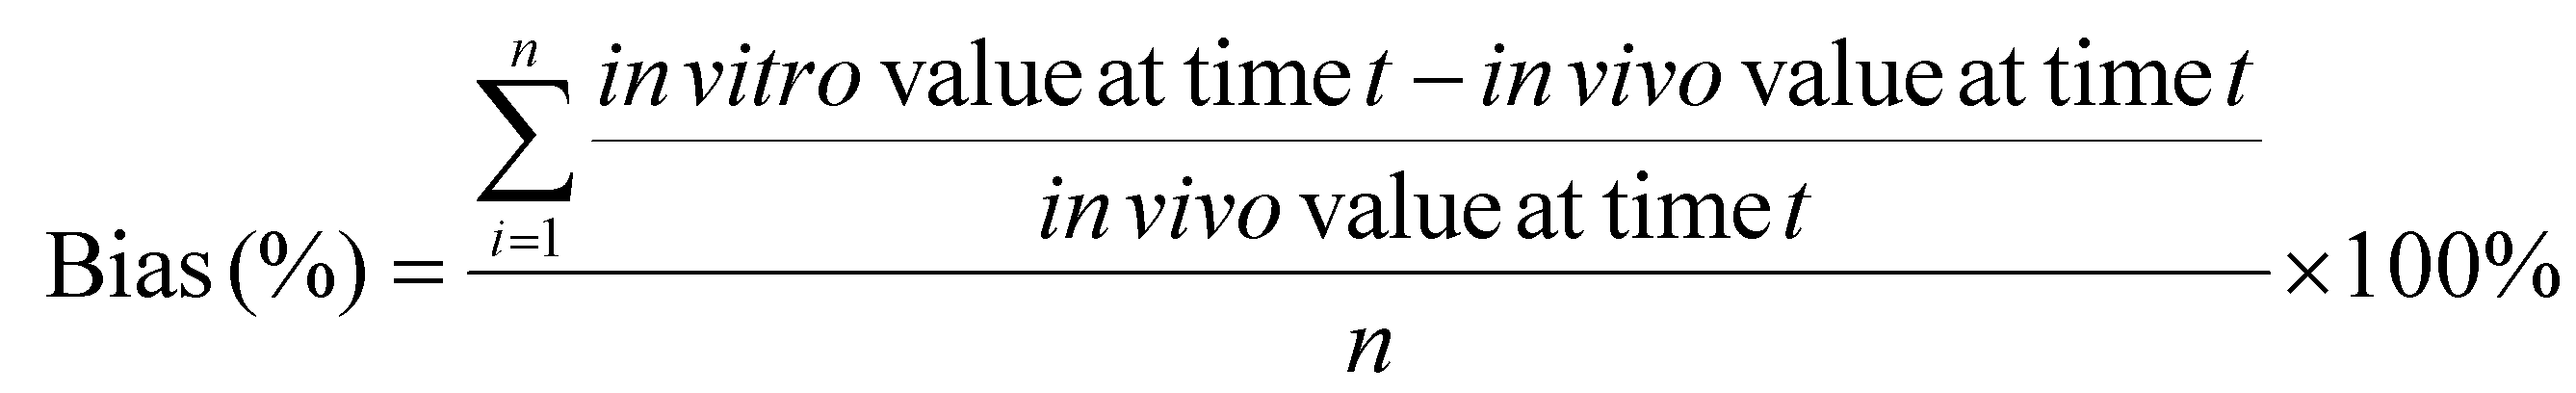 | (4) |
b. Interpret the MAPE and bias values
MAPE: We define MAPE < 50% as the limit to consider that an in vitro approach reasonably simulates in vivo digestion process, and a MAPE < 20% is required to conclude that a specific in vitro approach accurately simulates the in vivo gastric digestion process.63 MAPE > 50% indicates that the selected digestion parameters need adjustment to obtain a higher degree of similarity between the in vitro and in vivo digestion processes (Table 3).
If MAPE < 20% and the r and p values meet the suggested criteria (Table 3) to indicate agreement between in vitro and in vivo data, it can be concluded that the in vitro approach can be used as a substitute for in vivo data for the specific gastric digestion process examined (in specific in vitro and in vivo models) and for those foods utilized to establish the IVIVR.
However, if MAPE > 50% but the correlation values of r and p calculated above still meet the suggested values, the in vitro approach is still useful as a screening tool to predict in vivo trends in the measured digestion parameter, although there may be deviations between the specific values obtained in vitro compared to the in vivo data that need to be considered in the in vitro data interpretation (Fig. 2).
Bias: Bias provides more detailed information whether the in vitro approach underpredicts (bias > 20%), overpredicts (bias < −20%), or accurately predicts (−20% ≤ bias ≤ 20%) an in vivo digestion process (Table 3).
c. Calculate the absolute percent error (APE) of individual data points to determine limitations in the in vitro approach
Even when an in vitro approach meets the criteria for r, p, and MAPE (Table 3), it is possible that some in vitro data points exhibit large differences with in vivo data due to the complexity of in vivo gastric digestion processes. Such data points can be identified by calculating the absolute percent error (APE) between in vitro and in vivo data for each data point, with the in vivo study is considered as the “reference” method:65
 | (5) |
d. Interpret APE of individual values and repeat above steps (if needed)
We propose 50% as the maximum acceptable APE for any individual data point. Data points outside 50% difference from in vivo values can provide information pertaining to the limitations of the in vitro approach and may help to design future improvements in the current in vitro digestion models (examples will be discussed in section 3.3.1). If individual data points with APE > 50% can be removed from the data set, while still maintaining ≥4 total data points (of each in vitro and in vivo data), remove these points and consider them limitations of the in vitro approach and repeat the above steps with the reduced data set (Fig. 2). If data points are removed from any data set to develop the IVIVR, the limitations of the IVIVR should be noted clearly (e.g. if the relationship is only valid for certain digestion times or food products due to data points being removed when the relationship was developed).
 | ||
| Fig. 2 Decision tree diagram to evaluate Level A and B IVIVRs, using the values determined through the framework in Fig. 1 and the thresholds for these values provided in Table 3. MAPE can be calculated following eqn (3), bias can be calculated following eqn (4), and APE can be calculated following eqn (5). | ||
3.3 Case studies: application of the proposed IVIVR framework to evaluate the performance of in vitro gastric digestion models
In this section, we provide three case studies to serve as examples of the implementation of the proposed IVIVR framework to solid and liquid foods from studies of the authors where original research data was available for use in the quantitative analysis. Through these case studies, examples of how the IVIVR framework provided here can help in the interpretation of a specific in vitro approach and its improvement for better physiological relevance are shown. While semi-dynamic digestion data were not available to compare with our previous in vivo studies, we hypothesize that the relationships would be similar to those observed with the static digestion model. In each case study, selected digesta properties were monitored both in vivo and in vitro to evaluate different aspects of gastric digestion. Not all data/observations in the previously published in vivo or in vitro studies was presented for each case study. This is because the goal of this review was to demonstrate how to assess an in vitro digestion approach using the proposed IVIVR framework, which will aid in future development of IVIVRs when both in vitro and in vivo data are available.3.3.1.1 Description of the study. Food products: Six starch-rich foods of similar composition but varying food structure (durum wheat semolina porridge, white rice couscous, durum wheat couscous, white rice noodle, long grain white rice, durum wheat fettucine pasta) were used in the in vivo study. Two of the six foods (durum wheat semolina porridge (semolina) and durum wheat fettucine pasta (pasta)) were selected for the in vitro study, because they had the fastest (semolina) and slowest (pasta) gastric emptying rate in the in vivo study by Nadia et al.10 These foods also had contrasting microstructure and buffering capacity.
In vivo study: Growing pigs (∼22 kg body weight) were used as an animal model of the adult human digestive system. Details on the animal handling and sampling protocols have been described elsewhere.10,66,67 On sampling day, each pig was fed one of the six foods (250 g starch in the dry matter (DM) of the cooked product). The pigs were euthanized after 30, 60, 120, or 240 min of digestion to represent a food × digestion time combination. The stomach was removed and contents of the proximal (upper) and distal (lower) sections of the stomach were mixed carefully in separate containers before analysis.
The extension of this work to the absorption of glucose into the peripheral circulation was studied in an in vivo glycemic response study (growing pig model) that was previously described.67,68 Briefly, in the glycemic response study, growing pigs were catheterized in the ear vein for blood sampling. On blood sampling day, the plasma glucose response of the pigs was measured before and up to 360 min after feeding the same test meals as described above when gastrointestinal content properties were measured.
In vitro study: Dynamic gastric digestion was conducted in the second-generation human gastric simulator (HGS 2.0) built at the Riddet Institute, New Zealand, which has the feature of a J-shaped simulated stomach. The details of this dynamic gastric model are described elsewhere.69 The in vitro digestion started with an oral phase followed by a gastric phase with gastric secretions (pH = 0.8, 2000 U porcine pepsin per mL) introduced from the top of the HGS 2.0 at 4.1 mL min−1. Every 30 min for up to 240 min gastric digestion, ∼170 g digesta was withdrawn from the pyloric opening of the stomach bag to simulate a gastric emptying rate of 5.68 g min−1. The experiment was terminated at 30, 60, 120, or 240 min of gastric digestion, then the remaining digesta in the stomach bag was divided to two approximately equal parts (proximal/upper and distal/lower) to mimic the proximal and distal samples collected in the in vivo study.
3.3.1.2 IVIVR evaluation (Fig. 3). Level A: Dry matter (DM) retention was selected to evaluate if the in vitro gastric emptying approach was able to mimic in vivo DM gastric emptying. Moisture content and pH were selected to evaluate the in vitro gastric secretion approach in mimicking in vivo gastric content acidification and mixing. Normalized hardness was selected to evaluate the in vitro gastric secretions and stomach loading phase approach in simulating food overall breakdown in the in vivo stomach. For each digestion variable, the in vitro and in vivo values at the same digestion time (average values across all replicates from each respective experiment) were used to build a scatter plot (Fig. 3A), and the in vitro–in vivo MAPE (eqn (3)), bias (eqn (4)), and APE (eqn (5)) were calculated (Table 4). The DM retention, normalized hardness (Ht/H0), and moisture content had an R2 > 0.80, r ≥ 0.90, and p < 0.05 (Fig. 3A), indicating a high similarity in the direction and trends of the in vivo and in vitro DM emptying, gastric breakdown, and moisture uptake.
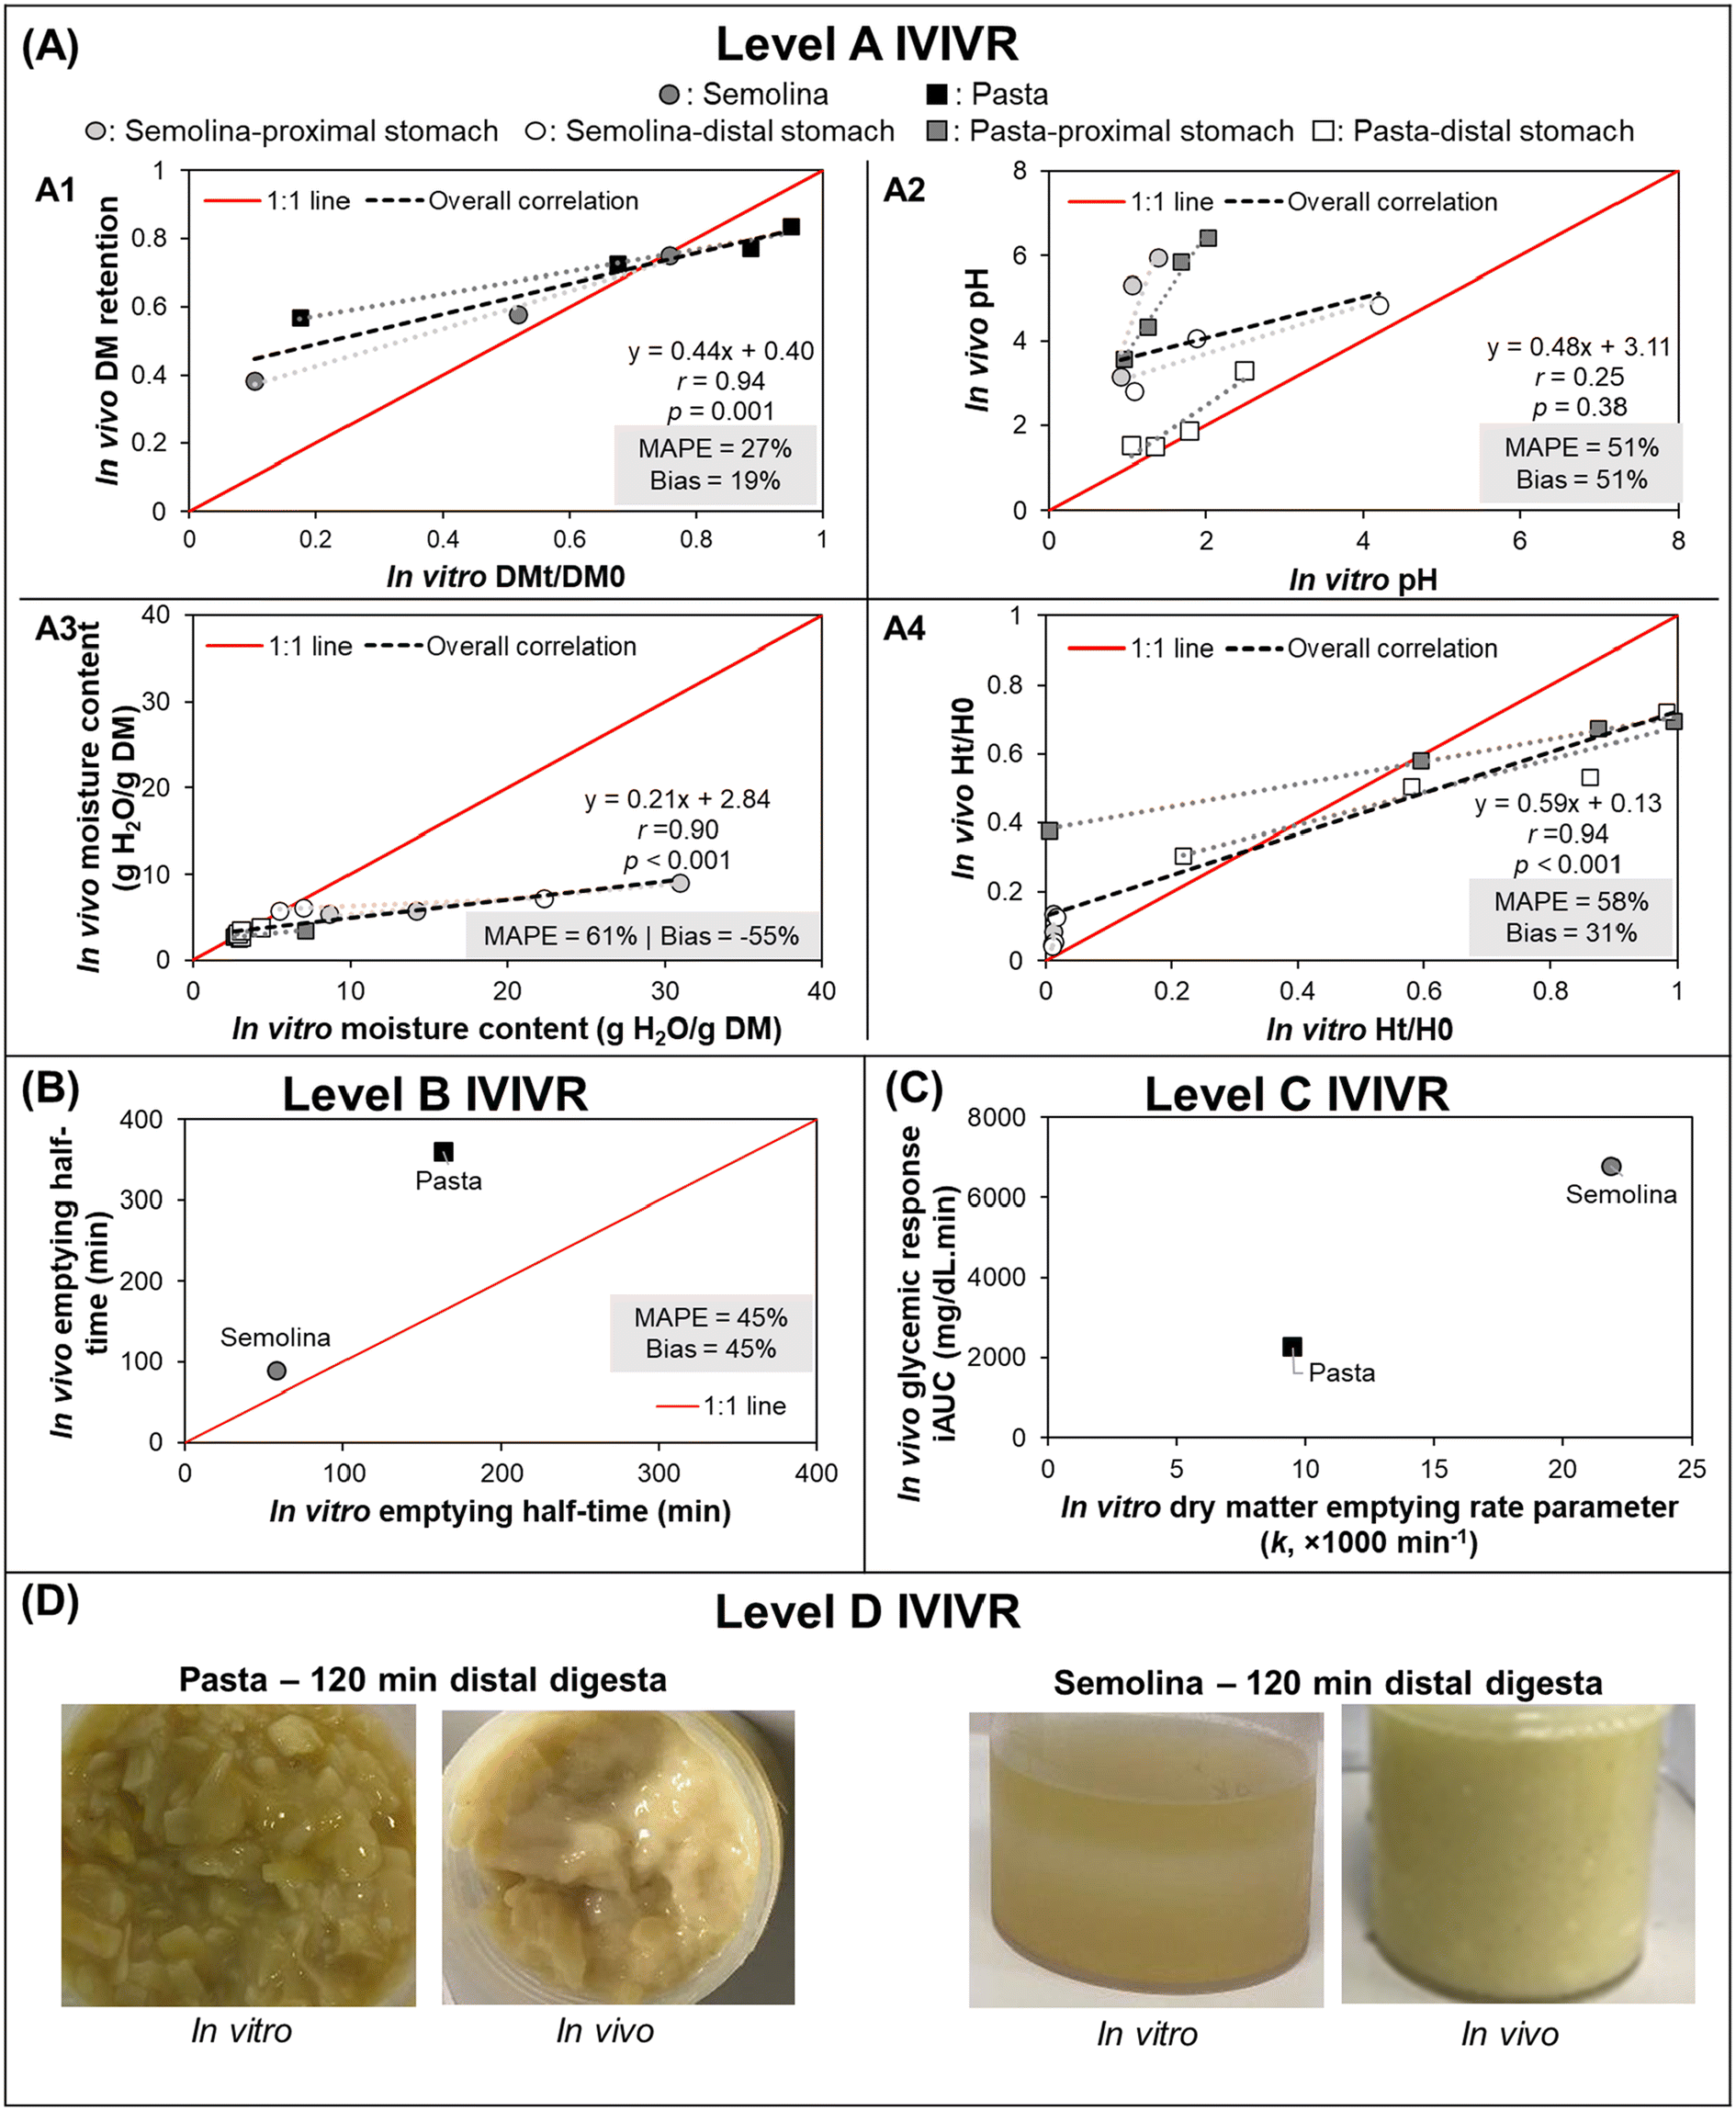 | ||
| Fig. 3 IVIVRs developed for Case Study 1 (in vitro dynamic gastric digestion using the HGS 2.0 vs. in vivo digestion in growing pigs). In vitro data was taken from Nadia et al.;69 in vivo study data was taken from Nadia et al.10,66,67 For plots in (A), black dashed lines represent overall correlation line, displayed together with the regression equation; dotted lines with matching color to the symbol represent ordinary linear regression lines for each type of food; MAPE and bias were calculated using eqn (3) and (4), respectively. For plots in (A) and (B) the solid red lines represent a 1:1 correlation between in vitro and in vivo values. The coefficients for the regression lines for individual type of food can be found in Table 5. Values shown are means (n = 3–6), error bars are not shown for ease of viewing. | ||
:1 line. Data points with in vitro–in vivo difference (APE) greater than 50% are preceded with a hash (#) superscript. In vivo data were obtained from Nadia et al.,10 in vitro data were obtained from Nadia et al.69 Bias and MAPE were calculated using eqn (3) and (4), respectively
| Food | Time (min) | Stomach region | Average values | (y − x)/y × 100 | |(y − x)/y| × 100 | |
|---|---|---|---|---|---|---|
| In vivo (y) | In vitro (x) | |||||
| A. Dry matter (DM) retention | ||||||
| Pasta | 30 | Not applicable | 0.84 | 0.95 | −13% | 13% |
| 60 | 0.77 | 0.89 | −15% | 15% | ||
| 120 | 0.73 | 0.68 | 7% | 7% | ||
| 240 | 0.57 | 0.18 | #69% | #69% | ||
| Semolina | 30 | Not applicable | 0.75 | 0.76 | −1% | 1% |
| 60 | 0.58 | 0.52 | 10% | 10% | ||
| 120 | 0.38 | 0.10 | #73% | #73% | ||
| Average difference | Bias = 19% | MAPE = 27% | ||||
| B. Intragastric pH | ||||||
| Pasta | 30 | Proximal | 6.42 | 2.03 | #68% | #68% |
| 60 | 5.86 | 1.68 | #71% | #71% | ||
| 120 | 4.33 | 1.25 | #71% | #71% | ||
| 240 | 3.58 | 0.95 | #73% | #73% | ||
| 30 | Distal | 3.30 | 2.49 | 25% | 25% | |
| 60 | 1.87 | 1.78 | 5% | 5% | ||
| 120 | 1.52 | 1.34 | 12% | 12% | ||
| 240 | 1.53 | 1.05 | 32% | 32% | ||
| Semolina | 30 | Proximal | 5.96 | 1.39 | #77% | #77% |
| 60 | 5.31 | 1.06 | #80% | #80% | ||
| 120 | 3.17 | 0.91 | #71% | #71% | ||
| 30 | Distal | 4.84 | 4.20 | 13% | 13% | |
| 60 | 4.07 | 1.87 | #54% | #54% | ||
| 120 | 2.82 | 1.08 | #62% | #62% | ||
| Average difference | Bias = −55% | MAPE = 61% | ||||
| C. Moisture content, dry basis (g H2O per g DM) | ||||||
| Pasta | 30 | Proximal | 2.54 | 2.96 | −16% | 16% |
| 60 | 2.72 | 2.60 | 4% | 4% | ||
| 120 | 3.07 | 2.72 | 11% | 11% | ||
| 240 | 3.51 | 7.18 | #−104% | #104% | ||
| 30 | Distal | 2.77 | 3.09 | −11% | 11% | |
| 60 | 3.12 | 2.84 | 9% | 9% | ||
| 120 | 3.44 | 3.03 | 12% | 12% | ||
| 240 | 3.83 | 4.29 | −12% | 12% | ||
| Semolina | 30 | Proximal | 5.39 | 8.69 | #−61% | #61% |
| 60 | 5.80 | 14.18 | #−145% | #145% | ||
| 120 | 9.10 | 30.95 | #−240% | #240% | ||
| 30 | Distal | 5.81 | 5.53 | 5% | 5% | |
| 60 | 6.19 | 7.03 | −14% | 14% | ||
| 120 | 7.28 | 22.30 | #−206% | #206% | ||
| Average difference | Bias = 51% | MAPE = 51% | ||||
| D. Normalized hardness (Ht/H0) | ||||||
| Pasta | 30 | Proximal | 0.68 | 0.88 | −29% | 29% |
| 60 | 0.69 | 0.99 | −43% | 43% | ||
| 120 | 0.58 | 0.59 | −2% | 2% | ||
| 240 | 0.38 | 0.01 | 98% | 98% | ||
| 30 | Distal | 0.72 | 0.98 | −36% | 36% | |
| 60 | 0.53 | 0.86 | #−62% | #62% | ||
| 120 | 0.51 | 0.58 | −14% | 14% | ||
| 240 | 0.31 | 0.22 | 29% | 29% | ||
| Semolina | 30 | Proximal | 0.14 | 0.01 | #91% | #91% |
| 60 | 0.09 | 0.01 | #87% | #87% | ||
| 120 | 0.05 | 0.01 | #78% | #78% | ||
| 30 | Distal | 0.13 | 0.02 | #87% | #87% | |
| 60 | 0.05 | 0.01 | #74% | #74% | ||
| 120 | 0.04 | 0.01 | #76% | #76% | ||
| Average difference | Bias = 31% | MAPE = 58% | ||||
The DM retention data had a MAPE of 27% (Fig. 3A), which indicated that the selected gastric emptying rate and approach of emptying a constant amount of digesta simulated in vivo DM emptying with reasonable accuracy. Based on the in vitro–in vivo difference calculation (Table 4A), data points with >50% APE were pasta after 240 min and semolina after 120 min; both digestion times were the longest time that was tested for each food product in vitro. The differences in the dry matter emptying kinetics that occurred at longer digestion times can be attributed to the absence of physiological responses to slow gastric emptying at longer times in the in vitro approach.
Intragastric pH, moisture content, and normalized hardness had MAPE > 50% (Fig. 3A2–A4). In the intragastric pH and moisture content data, >50% APE was found mostly in the proximal stomach region and at the longest digestion time in both stomach regions (Table 4B and C), which may be associated with two reasons. First, the limitation in the gastric secretion introduction system of the HGS v2.0 (where secretions are introduced in the proximal stomach region), which is different from an in vivo stomach where gastric secretions are introduced from the gastric wall. Second, the use of generalized and constant secretion rate throughout the digestion time that caused high intragastric dilution in vitro, which also explained the poor overall correlation of intragastric pH data (r = 0.25, p > 0.05) and resulted in a higher moisture content in vitro compared to in vivo results. If the values with APE > 50% are removed from the moisture content and pH data, the MAPE and bias both fall within ranges suggesting a reasonable estimation of digestion processes (MAPE and bias of 11 and −1% or 17 and 17% for moisture content and intragastric pH, respectively), although with fewer data points (n = 9 for moisture content and n = 5 for intragastric pH).
In the normalized hardness data (Table 4D), all semolina data points had >50% APE, indicating much faster breakdown of semolina in vitro. These differences may be attributed to the prolonged contact with amylase in the in vitro experiment, a greater dilution of the semolina with gastric secretions, and the low level of mucins in the in vitro simulated gastric fluids, which may impact the overall digesta consistency.70 However, for the pasta data, only two data points had >50% APE. If the remaining data set is considered, the MAPE and bias fall within reasonable ranges with >4 data points (MAPE = 26%, bias = −8%, n = 6), suggesting that the in vitro approach used here was able to mimic the breakdown of a solid meal (pasta) with better accuracy compared to a semi-solid meal (semolina).
Despite the identified limitations between in vivo and in vitro point-to-point data, it is worth noting that high correlation between in vivo and in vitro data was found (r > 0.75) for all selected parameters when the correlation was examined at individual food or food × stomach region level (Table 5), indicating changes in the selected digesta properties went in the same direction as what was found in vivo when examination was conducted only on one particular data set. The different slopes between the food or food × stomach region suggests that different foods responded differently to generalized gastric digestion parameters, thus the usefulness or validation of an in vitro approach should not be based on only a single type of food for future extrapolation to a wider variety of food materials.
| Food | Pasta | Semolina | ||
|---|---|---|---|---|
| Region | Proximal | Distal | Proximal | Distal |
| Dry matter (DM) retention | ||||
| Slope | 0.32 | 0.55 | ||
| Intercept | 0.51 | 0.32 | ||
| r/R2 | 0.99/0.97 | 0.99/0.99 | ||
| p | 0.014 | 0.073 | ||
| Moisture content (dry basis) | ||||
| Slope | 0.16 | 0.52 | 0.17 | 0.08 |
| Intercept | 2.33 | 1.57 | 3.64 | 5.48 |
| r/R2 | 0.84/0.71 | 0.76/0.58 | 0.99/0.98 | 0.99/0.97 |
| p | 0.159 | 0.240 | 0.088 | 0.108 |
| pH | ||||
| Slope | 2.75 | 1.27 | 5.20 | 0.58 |
| Intercept | 0.98 | −0.06 | −1.02 | 2.54 |
| r/R2 | 0.99/0.98 | 0.94/0.89 | 0.87/0.76 | 0.92/0.84 |
| p | 0.009 | 0.057 | 0.330 | 0.261 |
| Normalized hardness (Ht/H0) | ||||
| Slope | 0.33 | 0.47 | 60.14 | 11.57 |
| Intercept | 0.38 | 0.21 | −0.60 | −0.09 |
| r/R2 | 1/1 | 0.94/0.88 | 0.96/0.92 | 0.86/0.74 |
| p | 0.002 | 0.060 | 0.186 | 0.340 |
Level B (Preliminary): DM gastric emptying half-time was obtained from fitting the DM retention data (Table 4A) to the modified-exponential equation, conducted separately for the in vivo and in vitro data sets.55,56 Because there were only two data points (due to the two meals used in the in vitro study), the IVIVR is considered preliminary (Fig. 3B). However, an agreement in the in vitro and in vivo trend of DM emptying half-time for the two foods of contrasting structure likely suggests that the in vitro approach used in this case study can be used as a screening tool to predict the rank order of dry matter gastric emptying for starch-rich foods with similar structure to the six foods tested in the in vivo study. Overall, the bias and MAPE were both 45% (APE for pasta = 55%; APE for semolina = 35%). More food products need to be tested to determine the nature of the Level B IVIVR for DM emptying.
Level C (Preliminary): Previous in vivo studies have reported a relationship between gastric emptying rate with glycemic response,12,58 hence a Level C IVIVR was assessed on the in vitro gastric digestion emptying rate parameter (kin vitro) and the incremental area under the glycemic response in vivo (iAUCin vivo). As there were <4 data points (due to the two meals used in the in vitro study), this relationship is considered preliminary. As in Level B, there was an agreement in the in vitro and in vivo parameters (Fig. 3C), indicating that the in vitro approach may be utilized to predict the trend in the resulting glycemic response of starch-rich foods with similar structure to the six foods used in the in vivo study based on the in vitro gastric emptying rate parameter, however additional data is required to establish a Level C IVIVR with at least 4 food products.
Level D: The overall consistency of the digesta can give an approximation of the dilution of the sample with gastric secretions, the particle breakdown, and the mixing of gastric secretions with the solid meal. The digesta consistency (assessed visually) was similar between the in vitro and in vivo studies, particularly for pasta. Similar differences can also be observed between the proximal and distal region both in vivo and in vitro. Images suggest that the semolina diet had a greater dilution with gastric secretions in vitro, which is supported by the moisture uptake data (described in Level A, above) and greater phase separation between the semolina particles and gastric secretions, likely due to the absence of mucin in the in vitro digestion approach. This comparison provides complementary information to support the quantitative relationships described in the Level A IVIVR.
3.3.1.3 Summary. A Level A IVIVR could be established for the in vitro approach in Case Study 1 (using the HGS with generalized digestion parameters) for the DM gastric emptying, and examination of the individual APE values of the DM emptying data indicated that there is a limitation in the in vitro approach in mimicking the gastric emptying process at longer digestion times, due to the lack of physiological regulation. A Level A IVIVR could only be established for moisture update, gastric acidification (pH), and breakdown (hardness change) with removal of data points with APE > 50%, suggesting that the in vitro approach still can be improved to adequately mimic these in vivo gastric processes. A preliminary Level B and C correlation could be established, although additional data points are needed to fully assess these relationships.
Use of the IVIVR parameters allowed for identification of areas in which the in vitro approach could be improved to better mimic in vivo processes. Physiological responses that caused reductions in dry matter emptying rate and gastric secretion rate over time were absent, which was hypothesized to result in an overestimation in the gastric acidification and breakdown in vitro, especially in semolina (fast-breakdown food). Adjustment is needed in the stomach loading phase, gastric secretion introduction, and gastric secretion rate variation to improve the physiological relevance of the in vitro approach. However, despite its limitations, the in vitro approach used in this case study can be used to mimic the in vivo trends in DM emptying rate, food breakdown rate, and resulting glycemic response of foods with similar structure to semolina and pasta.
3.3.2.1 Brief description of the study. Food products: Raw whole milk from cow, goat, and sheep were studied as examples of complex liquid foods. The three milks varied in composition and physicochemical properties. Sheep milk had higher protein, fat, and mineral content than the other two milks. Goat milk had a larger number of small fat globules, but bigger casein micelles than cow and sheep milk.71,72 The milk composition of the three species varied slightly between the in vitro and in vivo studies due to seasonal differences in the fresh milk used, but the overall differences between the milks remained consistent.
In vivo study: Piglets (3 weeks old on sampling day) were used as a model of gastric digestion in infants. Details on the animal handling and sampling protocols have been described elsewhere.72 On the sampling day, each piglet was fed fresh raw whole milk (milk volume was determined to provide an equal amount of protein per kg body weight) and was euthanized after an assigned digestion duration (30, 90, 150, or 210 min), such that each piglet represented a replicate for a milk type × digestion time combination. The stomach content of each piglet was separated into curd and liquid fractions for analysis.
In vitro study: Dynamic digestion experiments were conducted using the first generation human gastric simulator (HGS),73 which has a simulated stomach with an inverted cone shape. Detailed descriptions of the experiments are given elsewhere.71 Briefly, 200 mL pre-warmed milk (37 °C) was added to the stomach bag. Gastric secretions were introduced into the stomach bag as two separate mixtures (combined pH of 1.0–1.3): 176 mL electrolyte solution + 6 M HCl solution at 0.73 mL min−1 and 24 mL electrolyte solution (pH 7) containing pepsin (96 U porcine pepsin per mg milk protein) at 0.1 mL min−1. The total volume of simulated gastric secretions introduced to the HGS was 1:1 to the weight of the milk. No gastric lipase was used, as the alternative to human gastric lipase with similar activity and specificity (e.g., rabbit gastric lipase) was not commercially available when the study was conducted. Gastric emptying (∼1.66 mL min−1; theoretically calculated as the rate needed to empty 200 mL milk + 200 mL simulated gastric secretions within 240 min) was simulated by withdrawing ∼50 mL sample every 30 min. The digestion experiments were terminated at 30, 90, 120, 150, 180, 210, or 240 min to simulate different total digestion time, then the remaining digesta in the stomach bag was separated into the curd and liquid fractions for analysis.
3.3.2.2 IVIVR evaluation (Fig. 4). Level A: The pH of the liquid fraction of digesta was selected to assess the simulation of gastric secretion pattern and acidification kinetics in the stomach. Curd DM retention was selected to evaluate the simulation of curd disintegration behavior and its gastric emptying, whereas protein and fat retention in the curd were selected to evaluate the release of protein and fat globules from the curd using the in vitro approach as compared to the in vivo system. For each of the selected variables, the average in vitro and in vivo values (Table S1†) were paired at each digestion time and used to build a scatter plot (Fig. 4A) and calculate in vitro–in vivo MAPE, bias, and APE (Table S1†).
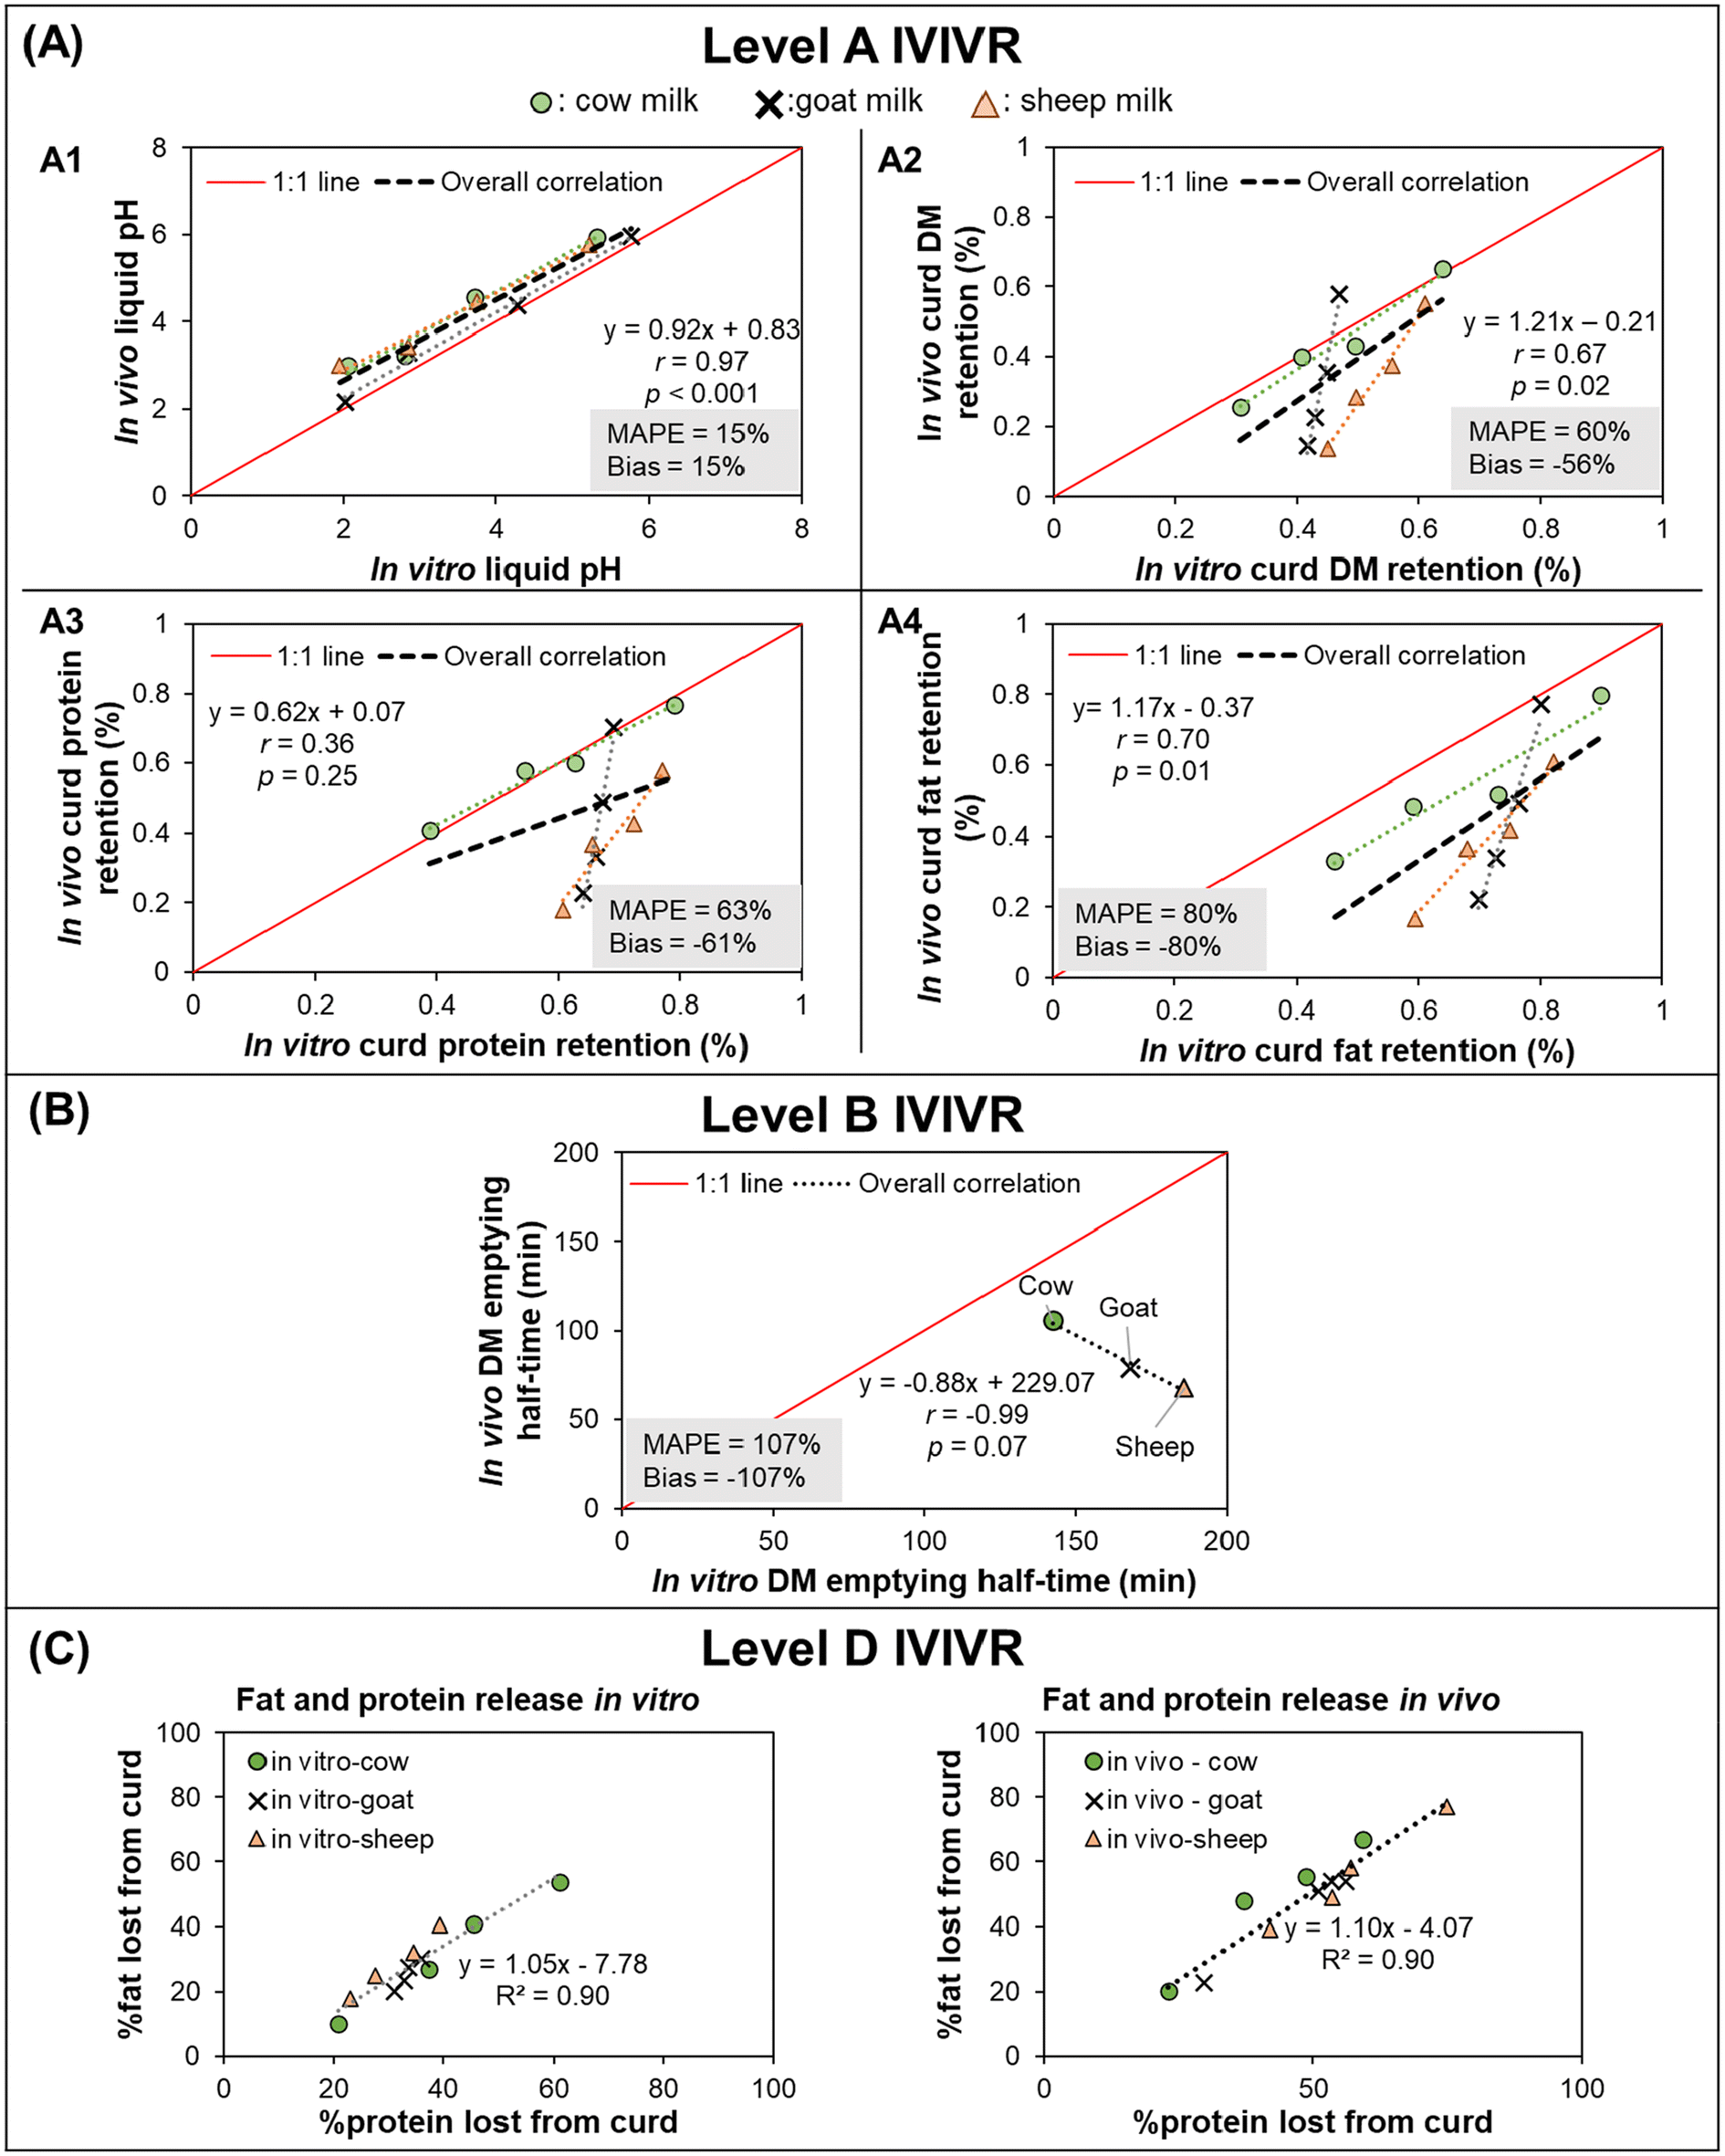 | ||
| Fig. 4 IVIVR illustration for Case Study 2 (in vitro dynamic digestion using the human gastric simulator v1.0 vs. in vivo digestion in piglets). In vitro study data were obtained from Roy et al.,71 in vivo study data were obtained from Roy et al.72 For plots in (A), black dashed lines represent the overall correlation line, displayed together with the regression equation; dotted lines with matching colors to the symbol represent ordinary regression lines for each type of milk; MAPE and Bias were calculated using eqn (3) and (4), respectively. For plots in (A) and (B) the solid red lines represent a 1:1 correlation between in vitro and in vivo values. The coefficients for the regression lines for individual type of milk can be found in Table S2.† Values shown are means (3 ≤ n ≤ 4), error bars are not shown for ease of viewing. | ||
In the overall comparison across the three different types of milk, a Level A relationship could be established based on the trend in the in vivo and in vitro pH kinetics (r = 0.97, p < 0.05, bias and MAPE = 15%; Fig. 4A1 and Table S1A†). This indicates that the in vitro gastric acid secretion approach was physiologically relevant and could mimic the gastric acidification kinetics of all three milks. However, it should be noted that while the MAPE was 15% between the in vitro and in vivo approaches, as pH is on a logarithmic scale to represent the H+ ion concentration, such differences in pH may ultimately impact the enzyme activity or subsequent breakdown of the meals.
The in vivo vs. in vitro data linear regression for of curd DM and fat retention (Fig. 4A2 and A4) indicated an acceptable strength of relationship (r = ∼0.7, p < 0.05). However, these digesta properties had MAPE > 50% and bias ≤−56%, indicating that large differences were observed between the in vitro and in vivo data and improvement in the in vitro approach is required to establish a Level A IVIVR for these measurements. Calculation of the APE for the curd DM retention and curd protein retention (Table S1B and C†) revealed that significant in vitro–in vivo differences were found mostly in the goat and sheep milk (at times longer than 30–60 min). Meanwhile, in the curd fat retention data (Table S1D†), APE > 50% was found for almost all data points for goat and sheep milk. In the deviating data points, in vivo values were always lower than their in vitro counterparts, which indicated that in vivo curd disintegration occurred faster than in vitro. Such faster curd disintegration in vivo might be attributed to differences in the milk amounts fed on equal protein basis to piglets, differences in the gastric enzyme concentrations or secretion rates, or that the peristaltic contractions in the HGS were not as strong as those in in vivo, which ultimately underpredicted the disintegration of milk curds in the dynamic gastric model utilized in this study (HGS).
Interestingly, cow's milk had a significant (p < 0.05, r ≥ 0.97) in vitro–in vivo relationship for the pH, and the curd DM, fat, and protein retention. When only the data from cow's milk is considered for these parameters, the MAPE and bias are within acceptable ranges for all data points except for dry matter retention after 90 min digestion. This suggests that the in vitro approach used may be able to adequately mimic the in vivo digestion of cow's milk but needs modification to adequately mimic the in vivo digestion of milk from other species in future studies. The discrepancy between the IVIVRs for the three milk types when analyzed altogether or separately within each type of milk may indicate a missing critical physiological factor in the in vitro approach that is needed for it to be applied across complex liquid food systems of varying composition.
Level B (Preliminary): As there were only three types of milk used in this study (resulting in <4 data points for the IVIVR), this IVIVR is considered preliminary. DM emptying half-time for each milk in vitro and in vivo was obtained from fitting the DM retention data (in vitro and in vivo separately) to the power-exponential equation.74 There was a negative, linear relationship between in vivo and in vitro DM emptying half-time (Fig. 4B), indicating a contradictory in vivo–in vitro trend. Although in the Level A IVIVR, the DM retention was significant between the in vitro and in vivo data, the correlation coefficient was r = 0.67, and the MAPE > 60%, which agreed with this contradictory IVIVR Level B trend. This suggests that IVIVR evaluation needs to consider food-specific variation to gain holistic information relating to food-specific variations in digesta properties. In addition, this supports the recommendation of evaluating both Level A and B IVIVRs, as they provide complementary information and may help identify limitations of the in vitro method.
The contradictory trend between in vivo and in vitro DM emptying half-time could indicate a lack of simulation of critical physiological aspects in the in vitro approach (e.g., gastric fluid composition and secretion rates including optimum levels of enzyme concentrations) or a mismatch in the design of in vitro and in vivo study that interfered with the factors that might affect gastric emptying of liquids in vivo (e.g., food amount, food composition, calorie content).75,76 It is also possible that the gastric emptying approach of withdrawing a constant volume at a regular interval may not be suitable for milk digesta, which might affect the DM emptying; such possibility is a topic for future investigation.
Level C: Ideally, in vivo plasma amino acid concentration as an indicator of protein concentration should be related with either the in vitro protein gastric emptying half-time or protein hydrolysis. However, as no published information on the absorption properties of the milk diets was available from the in vivo study, it was not possible to develop a Level C correlation with these previously published data.
Level D: In both the in vitro and in vivo stomach models, a high correlation (R2 = 0.90; Fig. 4C) was found between the percent of protein and fat lost from the curd. These trends indicate that the release of fat globules from the curd was dependent and proportional to the rate of breakdown of the curd protein network in both the in vitro and in vivo approaches.
3.3.2.3 Summary. In vivo gastric acidification kinetics of milk were accurately mimicked using the in vitro approach by varying the amount of HCl depending on the type of milk. However, due to the differences in meal size (and composition), lack of physiologically relevant enzyme concentration (or secretion rates), and gastric emptying in the in vitro study, the in vitro approach utilized was not suitable to mimic the in vivo trends in the retention of milk curd components (DM, protein, fat). Regardless of the lack of agreement in curd disintegration and emptying kinetics, the in vitro approach was still useful for investigating the release mechanisms of fat globules from the milk curd into the liquid phase of digesta for an individual type of milk.
3.3.3.1 Description of the study. Food products: Six starch-rich products of different food structures, as described in Case Study 1, were used in the in vivo study. Five of them were selected for the in vitro study (semolina was excluded because of its semi-solid form).
In vivo approach: The same in vivo studies (growing pig model) as described in Case Study 1 were utilized. Gastric digesta properties data from the distal stomach, as well as overall gastric dry matter retention (from proximal and distal stomach), was used for IVIVR evaluation. For the glycemic response study, the maximum change plasma glucose concentration within 360 min period after feeding the test meals relative to the baseline plasma glucose concentration was measured and expressed as Δmax.
In vitro approach: Batch-type, static in vitro gastric digestion was conducted, as previously described.77 In each digestion experiment, 60 g food was incubated with simulated saliva (1 mL g−1 DM of food) for 30 s in a shaking water bath (37 °C) to simulate the oral phase. Subsequently, simulated gastric secretions (pH 1.8, containing 2000 U porcine pepsin per mL; 3 mL g−1 cooked food) was added to the food–saliva mixture, then incubated in the shaking water bath for an additional 15, 30, 60, 120, or 180 min to simulate the distal gastric phase. The pH of the digestion mixture was maintained at pH 2.0 ± 0.1. After each distal phase time, the entire digestion mixture was separated into large solid fraction (>2 mm particles) and liquid fraction (containing suspended solid particles ≤2 mm) for analysis.
3.3.3.2 IVIVR evaluation (Fig. 5). Level A: The simulation of moisture uptake into solid food particles was evaluated by comparing the moisture content of the in vitro solid digesta fraction with the moisture content of the in vivo distal stomach digesta (a mixture of solids and free liquids). The simulation of the softening process due to the action of gastric secretions in the in vitro approach was evaluated by comparing normalized hardness of the solid digesta fraction in vitro with the normalized hardness of the in vivo distal stomach digesta. The simulation of solid loss due to the dissolution and/or erosion into gastric secretions and its relationship with solid gastric emptying in vivo was evaluated by comparing the dry matter retention (DM) of in vitro solid digesta fraction (e.g. the amount of dry matter remaining in the solid particles after digestion) with the in vivo overall stomach digesta DM retention. The average in vitro and in vivo values for each of the selected variables (Table S3†) were paired at each digestion time to build a scatter plot (Fig. 5A) and calculate MAPE, bias, and APE.
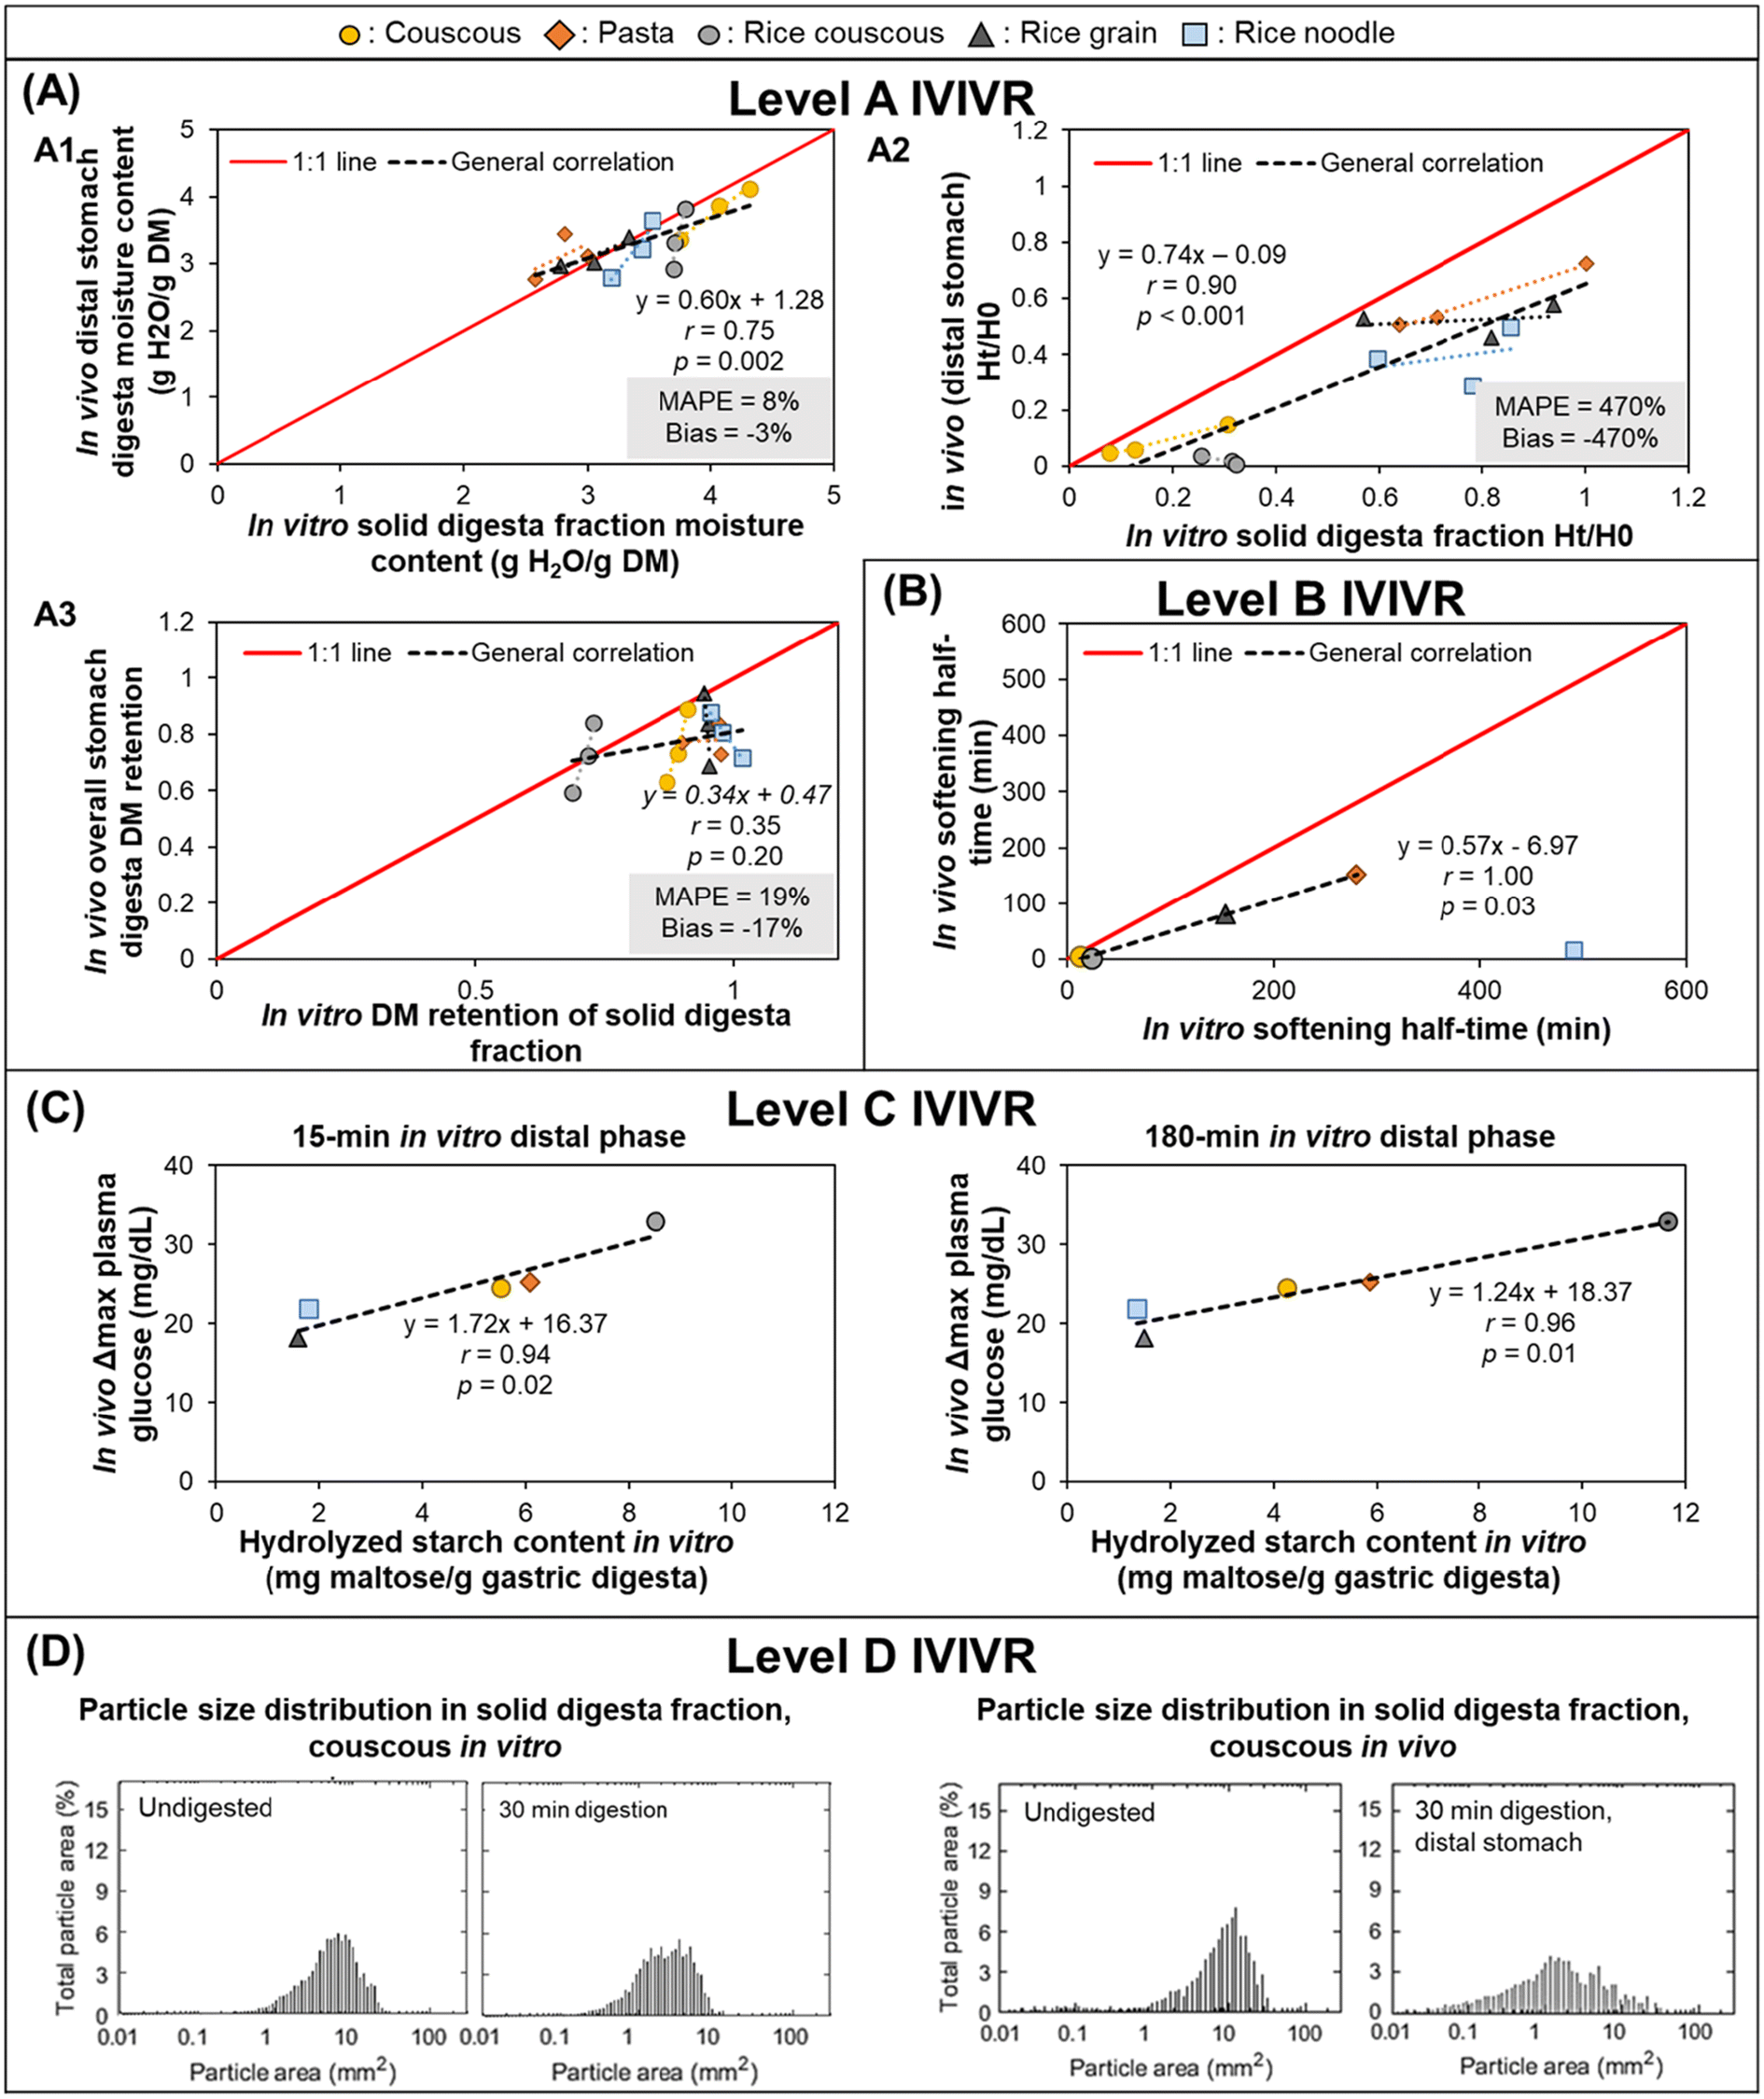 | ||
| Fig. 5 IVIVR illustration for Case Study 3 (in vitro static digestion in excess gastric fluid vs. in vivo digestion in growing pigs). In vitro data were taken after 0 min proximal phase followed by up to 180 min distal phase data from Nadia et al.,77 in vivo data were taken from Nadia et al.10,66 For plots in the Level A IVIVR panel, black dashed lines represent the overall correlation line, displayed together with the regression equation; dotted lines with matching colors to the symbol represent ordinary regression lines for each type of food; MAPE and Bias were calculated using eqn (3) and (4), respectively. For plots in (A) and (B) the solid red lines represent a 1:1 correlation between in vitro and in vivo values. The coefficients for the regression lines for individual type of food can be found in Table S4.† Values shown are means (n = 3–6), error bars are not shown for ease of viewing. | ||
Normalized hardness and moisture uptake met the correlation coefficient criteria listed in Table 3 (r = 0.90, p < 0.001 for normalized hardness and r = 0.75, p = 0.002 for moisture uptake). The high and significant correlation indicates that the static in vitro approach can be used in mimicking the direction and trend of in vivo softening and moisture uptake processes. However, in the normalized hardness data, the MAPE was 470%, and 13 of the 15 data points had in vitro–in vivo difference >50% with higher in vivo values compared to in vivo values (Table S3†). This suggests that although the trend and general direction of the softening kinetics was the same between the in vitro and the in vivo studies, the in vitro approach did not accurately simulate all aspects of the in vivo softening process. This is likely due to the absence of mechanical breakdown in the static digestion approach. It should be noted for data points with very small values in vivo (e.g. rice couscous at all digestion times), deviations in the trend resulted in very large APE for these data points (>500%).
A high, significant correlation (r = 0.75, p < 0.05), but low MAPE (8%) and bias (−3%), was obtained between the moisture content of in vitro solid digesta fraction and in vivo distal stomach digesta, indicating that the in vitro approach of incubation in excess gastric secretions was useful in predicting the direction and trend in the moisture uptake kinetics of solid starch-rich foods in vivo with reasonable accuracy. None of the individual data points had an APE > 30%, further supporting the utility of the static in vitro approach to mimic the moisture uptake in vivo.
A low general correlation (r = 0.35, p = 0.20) between in vitro solid digesta DM fraction and the in vivo DM gastric retention was obtained. Although the MAPE of DM retention was <19%, it cannot be concluded that the in vitro and in vivo solid loss process was similar because the general correlation was poor. When examined within individual food structure, high, positive correlation was found for couscous and rice couscous (r ≥ 0.97; Table S4†). The high correlation only for couscous and rice couscous, which were reported as fast-breakdown foods in the in vivo approach, suggests that the static in vitro approach was only useful in mimicking the trend and direction in the solid loss kinetics of food structure that undergoes fast breakdown in the gastric environment, and may not require as much breakdown due to the mechanical forces (that were not present in the static digestion approach used here).
Level B: The breakdown rate of the foods in the gastric environment, measured as softening half-time, was obtained from fitting the normalized hardness data to the Weibull equation.10,57 A linear, but not 1:1 relationship (r = 1, slope = 0.57) between in vitro and in vivo softening half-time was identified in 4 out of the 5 foods tested (Fig. 5B). This suggests that the static in vitro approach can be utilized to predict the rank order in the breakdown rate of varying structures of solid starch-rich foods, despite the absence of mechanical breakdown in the in vitro approach. The deviation of one food type (rice noodle) from this strong trend possibly indicates that the breakdown of certain food structures in the stomach was not just controlled by diffusion of gastric fluid, but also other factors that were not mimicked in the static in vitro approach.
Level C: As a previous in vivo study reported a relationship between hydrolyzed starch content in the liquid fraction of gastric digesta with glycemic response in vivo,58 the relationship between hydrolyzed starch content in the liquid fraction of in vitro digesta with in vivo maximum change in plasma glucose concentration was examined. A high linear relationship (r ≥ 0.94) between in vivo maximum change of plasma glucose and in vitro hydrolyzed starch content in the liquid digesta fraction measured at both early and late digestion time points (15 and 180 min distal phase). This high correlation suggests that the general trend in the maximum change of glycemic response in vivo of a wide range of starch-rich foods may be predicted using the specific static in vitro approach with gastric fluid added in excess, either by evaluation of the liquid fraction at an early or late time point of digestion.
Level D: Couscous, which showed a good correlation and acceptable in vitro–in vivo differences in the Level A IVIVR assessment, had a similar solid breakdown profile in vitro and in vivo based on the particle size distribution graphs after 30 min digestion (Fig. 5D). In both in vivo and in vitro graphs, the particle size distribution curve shifted to the left and flattened after 30 min digestion, compared to the undigested food. The similarity in how the particle size distribution changed in vitro and in vivo may suggest that the breakdown process of couscous was driven by dissolution by gastric secretions in both in vitro and in vivo gastric digestion scenarios.
3.3.3.3 Summary. The in vitro static digestion approach can be utilized to predict the in vivo trend and direction of moisture uptake of solid starch-rich foods. It also has been demonstrated to accurately predict the in vivo gastric emptying of solids and breakdown process of food structures that do not require significant mechanical breakdown (e.g., couscous, rice couscous). Despite the absence of mechanical breakdown, the static in vitro approach is still useful in predicting the rank order of food breakdown rate due to softening by gastric secretions. However, some food structures (e.g., rice noodle) deviated from the rank order, and food-related aspects that may cause such deviations need to be examined to improve the static in vitro approach in future studies.
4. Challenges and methodological considerations in evaluating IVIVR for gastric digestion of foods
In addition to the case studies discussed above, the proposed IVIVR framework was also applied to previously published studies that relate in vitro and in vivo gastric digestion data (Table 6). An example of the extension of the proposed framework to the small intestinal phase is included as ESI Table S5.† It should be noted that in some of the examples from previous studies, the number of foods may not meet the criteria proposed in this IVIVR framework, but they are listed with the corresponding IVIVR level to exemplify the type of comparisons that can be made. The application of this IVIVR framework to the three detailed case studies and previous studies demonstrated that relationships between in vivo and in vitro data can be observed, regardless of the in vitro approach used. Based on this evaluation of in vitro and in vivo data, several considerations that should be taken into account to assist in future development of IVIVRs are presented here to aid future studies in development of physiologically relevant in vitro approaches and determination of quantitative IVIVRs with in vivo data.| Food | In vitro approach | In vivo method | Data used for IVIVR evaluation | Findings | IVIVR within proposed framework | Ref. |
|---|---|---|---|---|---|---|
| Pretzel, white rice, brown rice, couscous, quinoa, orzo pasta | Static model: shaking water bath (excess gastric fluid) | Published data (international tables of glycemic index) | • In vitro softening half-time (time required to reduce the food hardness by 50%) | • The trend in the breakdown half-time (measured as softening half-time) in vitro aligned with the trends in in vivo glycemic index for five out of six of the foods studied | Level C | 57 |
| • In vivo glycemic index | ||||||
| Reconstituted infant formula | Semi-dynamic model: glass jacket reactor | Piglet model (slaughter method) | • Remaining volume of gastric digesta | • Similar kinetics of protein hydrolysis in vitro and in vivo, based on no significant differences in the proportion of immunoreactive caseins and β-lactoglobulin in vitro and in vivo | Level A | 78 |
| • Percentage of caseins and β-lactoglobulin in the stomach over time | • Good correlation between in vitro and in vivo proteolysis (correlation coefficient = 0.987) | |||||
| • No significant difference between in vitro and in vivo volumes of digesta remaining in the stomach (p < 0.05) | Level D | |||||
| α-Lactalbumin solution | Dynamic model: artificial gastric dynamic system (AGDS) | Human study (capsule endoscopy and nasogastric intubation in healthy adults) | • Gastric force, pepsin and gastric juice secretion | • Similar contractile force between the force exerted by the AGDS stomach and the mechanical force in the human stomach | Level D | 20 |
| Static model: water jacketed reactor | • Gastric emptying | • Similar pH reduction profile in the gastric antrum of the AGDS and semi-dynamic system to that of human stomach | ||||
| Semi-dynamic model: water-jacketed reactor | • pH at various intragastric locations | • Order of similarity to in vivo protein hydrolysis pattern and mechanisms: AGDS > semi-dynamic > static | ||||
| Red delicious apples (cored and skinned) consumed with water | Dynamic model: artificial stomach response kit (ARK®) | Human study (magnetic resonance imaging [MRI] in healthy adults) | • Meal retention in the stomach over time | • Linear correlation between in vitro and in vivo gastric content retention (r = 0.99) | Level A | 79 |
| • Gastric emptying parameters (lag phase, gastric emptying rate constant (k), y-intercept (β)) | • Similar gastric emptying patterns between in vitro and in vivo data | Level D | ||||
| • No significant difference between in vitro and in vivo emptying half-time, lag phase, k, and β | ||||||
| Locust bean gum test meals (low and high viscosity) containing agar beads of varying fracture strengths | Dynamic model: dynamic gastric model (DGM) | Published data (MRI in healthy adults using multiple agar beads) | • Mean breaking time (MBT) of the agar beads | • Linear correlation between in vivo and in vitro MBTs (regression line R2 = 0.824 for low viscosity meal, R2 = 0.685 for high viscosity meal) | Level B | 80 |
| Beef stew and orange juice | Dynamic model: new version of the near-real dynamic in vitro human stomach (new DIVHS) | Published data (dual phase isotopic study; gastric aspiration study in healthy adults) | • Gastric retention ratio of solid and liquid | • <12% average relative in vivo–in vitro difference in solid and liquid gastric content fraction | Level A | 81 |
| • pH profile | • Similar solid and liquid emptying half-time, and average gastric emptying rate between in vitro and in vivo system | Level D | ||||
| • Consistent trend in the pH change during digestion with in vivo data | ||||||
| Unheated-homogenized, pasteurized-homogenized, or UHT-homogenized cow's milk | Dynamic model: human gastric simulator (HGS) | Rat model (Sprague Dawley rats, slaughter method) | • Appearance of the milk curds formed | • Similar trends between in vitro and in vivo data in curd mass retention and protein hydrolysis | Level D | 82 |
| • Protein hydrolysis (assessed from SDS-PAGE patterns) | ||||||
| Medium grain white rice | Dynamic model: human gastric simulator (HGS) v2.0 | Growing pig model (slaughter method) | • Dry matter retention in the stomach | • Linear correlation between in vivo and in vitro dry matter retention (almost 1:1 correlation) |
Level A | 8 |
| • pH in the pylorus and fundus regions of the stomach | • Similar values between in vitro and in vivo pH in the pylorus or fundus region for up to 120 min digestion | Level D | ||||
| • Textural changes (hardness) in the proximal and distal region of the stomach | • Similar trends between in vitro and in vivo hardness of digesta from the proximal and distal regions at all digestion time points | |||||
| Nutrilon® liquid meal, beef stew meal mixed with orange juice | Dynamic model: TIM advanced gastric compartment (TIMagc) | Published data (nasogastric intubation and scintigraphy studies in healthy adults) | • Gastric motility pattern, gastric wall pressure and shear forces | • Comparable gastric secretion profile, motility pattern, pressure height, pressure peak, and shear forces duration between in vitro and in vivo data, but sharp pressure peaks in vivo could not be fully simulated | Level D | 83 |
| • Gastric emptying over time | • Similar solid fraction emptying curve to the in vivo study, but faster liquid emptying in vitro dan in vivo | |||||
| • Gastric secretions component (overall gastric juice, pepsin, HCl) flow rate over time | • Close trend between the in vitro and in vivo gastric juice rate, pepsin, and HCl flowrate profile over time |
4.1 Selection of relevant digestion variables for comparison
Depending on the purpose and type of the in vitro approach, digesta properties or the digestion variables to be compared within the proposed IVIVR framework may differ between studies and should be strategically selected. As a result, the three case studies and studies listed in Table 6 were selected as they examined different aspects of gastric digestion (e.g., dry matter retention, pH, nutrient hydrolysis, mean breaking time) that are relevant to the food being tested. For example, the Level A IVIVR evaluation of the static in vitro digestion presented in Case Study 3 was conducted to relate the in vitro and in vivo softening behavior of solid foods due to the diffusion of gastric secretions, therefore the relevant digestion parameters to be evaluated were those related to secretion uptake (measured as moisture content) and softening (measured as normalized hardness) of the solid particles. On the other hand, there is more flexibility in the selection of digestion parameters that could be measured when using a dynamic in vitro approach, such as the pH, material retention (e.g., dry matter, curd, fat, protein), moisture uptake, and physicochemical breakdown (see Table 6 and case studies 1–2). It is recommended that to minimize external factors that may affect the relationships between in vitro and in vivo data, the same measurement methods to characterize digesta properties should be utilized for samples from both the in vitro and in vivo studies.4.2 Selection of food structures for IVIVR development
In the proposed IVIVR framework, it is strongly suggested to select a wide range of food structures to be studied in vivo and in vitro, which is particularly useful for the evaluation of Level B and Level C IVIVRs. However, many of the previous studies that focused on Level A IVIVRs typically investigated only one type of food consumed as a single-component meal (Table 6) to validate the physiological relevance of the in vitro approach; few studies listed in Table 6 reported Level B or C IVIVRs for more than one food.57,80 Although good agreement with in vivo data was reported in the studies that reported the equivalent of a Level A IVIVR (Table 6), the use of only a single product in these studies may result in uncertainty whether the in vitro approach would be applicable for other types of foods to produce a high agreement with in vivo data.8 For example, in the Level B IVIVR of Case Study 3, the static in vitro approach used to mimic the softening half-time worked only for four out of five foods tested (Fig. 5B). Similarly, the work of Drechsler and Bornhorst57 indicated that only five out of the six foods studied showed a good agreement with in vivo data. This suggests that an in vitro approach may be applicable to only a certain range of food structures, and that drawing a conclusion of the usefulness or physiological relevance of an in vitro approach based on a single food structure may not result in similar physiological relevance for other food structures.The limited number of studies that reported Level B and Level C IVIVRs, combined with the tendency of reporting Level A IVIVR for one type of food only in the literature (Table 6), suggests that future evaluation of in vitro gastric digestion approaches should involve more types of food products and more quantitative comparisons to examine IVIVRs across the three quantitative levels. Additionally, similar to the IVIVC in the pharmaceutical industry where not all drug formulations exhibit an IVIVC (depending on the solubility and permeability), aspects of food structure and composition that may affect the likelihood of establishing an IVIVR for food digestion need to be investigated. For example, in the food breakdown classification system (FBCS), it was proposed that the likelihood of an IVIVR for solid food digestion may be predicted by the initial texture (hardness), the rate of softening of the food in the gastric environment, and the rate-limiting mechanism of the breakdown process.17 In the field of food digestion, such concept has not been established in complex liquid foods and is an area for future investigation. In the process of evaluating IVIVRs across various food structures, it is also suggested that each food is first studied as a single-component meal, then followed up by the evaluation of IVIVRs using mixed meals. It should also be noted in any IVIVR the types of food composition and structures utilized for its development, as other foods with very dissimilar properties may not necessarily follow the same trends in vitro or in vivo.
4.3 In vivo study design
The usefulness of an in vitro digestion approach, either as a tool to mimic in vivo behavior or as a tool to investigate mechanisms that occur in vivo, is determined by the design of the in vitro and in vivo studies.49 The first aspect of the study design is the selection of the in vivo model. For human digestion applications, the most preferred in vivo approach is a human study. Previous studies listed in Table 6 and the case studies, however, have utilized animal models for more specific comparison of digesta properties that are difficult to measure in human subjects, such as averaged physical properties of digesta, nutrient hydrolysis in the stomach, and gastric emptying of a specific nutrient. As such, future studies are recommended to evaluate the utility of the proposed IVIVR framework using in vivo data from human studies. In the case of limited access to a pig model, smaller animal models such as rats may also be used, such as in the study of Ye et al.82 However, caution in the data interpretation is needed due to the anatomical and physiological differences between smaller animal models (e.g., rats) and large monogastric animals.9,43 In the case of in vivo digestion approach evaluation using animal model, once Level A and B IVIVRs are established for the in vitro approach (i.e., the breakdown processes have been confirmed to be similar to in vivo system), the next step should be validating the in vitro approach with measurable properties in human studies. If an animal model is utilized in developing an IVIVR, this should be stated clearly to avoid misinterpretation of the data in future studies to other species or populations that may not be relevant. In the planning of the in vivo study, it is also important to ensure that the variability of in vivo results is anticipated by carefully planning the study and having a sufficient number of experimental replicates to achieve a statistical power of at least 80%.4.4 In vitro study design
In addition to methodological considerations of the in vivo study, the design of the in vitro study plays a crucial role in future IVIVR development. One aspect of the in vitro study design that should be carefully considered is the amount of food to be studied, especially if using a dynamic digestion model. Whenever possible, the scale of the in vitro approach also needs to be matched to the scale of the in vivo reference study, because it is unclear if gastric digestion parameters scale linearly. In certain cases, in vitro studies with different food amount, slightly different composition, and different digestion time scale from in vivo studies may still be useful as a predictive tool of general in vivo behavior (Table 3).For example, in the work of Vardakou et al.,80 the mean breaking time of agar beads of varying fracture strength in vitro (using the dynamic gastric model) and in vivo (published human study data) followed a similar trend, although in the in vitro study a single agar bead was used, whereas multiple agar beads were used in the in vivo study. Similarly, in the study of Drechsler and Bornhorst,57 the trend of in vitro softening rate of solid carbohydrate-rich foods generally aligned with the trend in published glycemic index of similar types of foods (human study data), although the specific foods were not exactly the same in the in vitro and in vivo studies that were compared. In contrast, in Case Study 2, the dry matter emptying half-time in vitro and in vivo across three different types of milk was inversely related, which may have been caused by the different amounts of milk volume used in the studies (equal protein amounts fed in vivo vs. equal volume of milk utilized in vitro).
In addition to meal amount, the specific in vitro digestion parameters utilized also play an important role in whether an IVIVR can be established. For example, in Case Study 2, the differences in the simulated gastric fluid enzyme composition and secretion rates may have resulted in inaccurate simulation of curd disintegration kinetics in vitro for raw whole milks. Also, in Case Study 1, due to the differences in gastric secretion rate and location utilized in the in vitro study, the kinetics of gastric acidification and mixing of gastric secretions in vitro did not mimic what was observed in vivo.
Due to the importance of the specific digestion parameters in IVIVR development, it is critical to select digestion parameters (e.g. gastric secretion rate, gastric emptying rate, ratio of meal:secretions, enzyme and mucin content, etc.) that are derived from in vivo findings. It is recommended that future studies examine such parameters within this IVIVR framework for wide variety of food structures, as it is not practical (nor resource efficient) to conduct an in vivo study for each food product to determine specific digestion parameters to be utilized for that food. In addition, future studies are encouraged to utilize the quantitative approaches developed as part of this IVIVR framework to identify limitations in the current in vitro approaches, such that they can be improved to become more physiologically-relevant for a wide variety of foods. As the specific digestion method and parameters have been shown to be critical in the ability to develop an IVIVR, such details should be carefully noted in any future IVIVR, and the applicability of the IVIVR should be limited to use of the same in vitro digestion method and parameters.
4.5 Identification of physiological factors that contribute to lack of an IVIVR
One of the keys to define the limitations of an in vitro gastric digestion approach is identifying physiological factors that may contribute to the lack of relationships between in vitro and in vivo data, some of which have been highlighted in the case studies. These factors include: mastication, gastric secretory response, gastric sieving mechanisms, and hormonal feedback that affects gastric emptying and digestion processes.For example, a common attribute in the in vitro approaches listed in Table 6 is the use of varying gastric secretion rate over time to closely mimic the pH profile in the in vivo stomach, because gastric secretions are important to biochemical changes in the gastric environment due to the presence of multiple digestive enzymes, each with a different range of active pH.23,84,85 Such approach of varying the gastric secretion rate is ideal to achieve the closest resemblance to physiological reality, as also highlighted in the studies that involved the comparison between static, semi-dynamic, and dynamic gastric digestion models.20,86 However, gastric secretion data may not be available for every food type or for specific food combinations, and a previous in vivo study reported that gastric secretions vary not only with digestion time, but also across food types.10
Another example is the use of a constant gastric emptying rate over time in dynamic in vitro digestion models. In Case Study 1, while the in vivo dry matter gastric emptying was mimicked well in vitro, larger APE values were observed at later digestion times. This suggests that that incorporation of a variable gastric emptying rate (where the gastric emptying rate changes with digestion time) during the digestion period may help to incorporate the physiological regulation that occurs in vivo. Understanding mechanisms of how to control the gastric emptying rate (and if this process varies with different food types or structures) is an area for future study.
5. Conclusions & future recommendations
Use of in vitro gastric digestion studies to mimic food structural changes and nutrient release in vivo are expected to keep growing in the future. With the various advantages of in vitro studies over in vivo studies, it is anticipated that in vitro studies will eventually be utilized in the food industry to redefine the healthiness and nutrition information panels of food products and support certain health claims of functional food products. Prior to drawing certain conclusions based on in vitro gastric digestion study results, it is important that researchers understand the utility and limitations of their in vitro gastric digestion approach. To facilitate this evaluation, we proposed an IVIVR framework to relate in vitro gastric digestion data with in vivo gastric digestion and nutrient blood appearance/small intestinal absorption. The current version of the IVIVR framework serves as a tool to assess the utility of a specific in vitro approach in mimicking in vivo gastric digestion process. The IVIVR framework is also useful to evaluate the selection of in vitro digestion parameters and improve their accuracy, and to help understand key aspects of gastric digestion. If an in vitro approach has been evaluated with this IVIVR framework and its usefulness to mimic in vivo process of certain food groups has been defined, one can be confident that the in vitro method can be applied for foods with similar composition and structure and result in similar findings to an in vivo study with the species or population used in the IVIVR development.In the future, the implementation of this IVIVR framework in food digestion research will be valuable for:
• Identification of food structures/compositions that may not exhibit an IVIVR
• Reviewing existing in vitro gastric digestion approaches (especially dynamic in vitro approaches that are likely to achieve a 1:1 relationship with in vivo data) to develop physical models, process parameters and protocols that accurately simulate the kinetics of digestion and nutrient release in the human stomach
• Coupling the existing experimental work in vitro with in silico approaches to improve prediction of food digestion variables
• Development of a generalized regression model to predict in vivo gastric digestion and/or nutrient absorption output based on in vitro data, taking into account variations of the structure and composition of foods
• Application of the framework to investigate the IVIVRs of mixed meals, which is a more realistic scenario of in vivo food consumption
While the methodology and assessment criteria of this IVIVR framework have been carefully formulated to be applicable for any type of gastric digestion method and food structure, it is expected that the robustness of the methodology and assessment criteria will be refined in the future when it is widely implemented in more experimental data, such as the inclusion of case studies that utilize in vivo data from human studies. It is also recommended that after application of this IVIVR to a wider variety of food products, and types of in vitro–in vivo studies, refinements should be made, including extension of the framework to other sections of the gastrointestinal tract, such as the small intestine.
Author contributions
J. Nadia: conceptualization, data curation, methodology, formal analysis, visualization, writing – original draft preparation; D. Roy: methodology, writing – review & editing; C. A. Montoya: methodology, writing – review & editing; A. Acevedo-Fani: methodology, writing – review & editing; H. Singh: writing – review & editing; G. M. Bornhorst: conceptualization, methodology, supervision, writing – review & editing.Data availability
No primary research results have been included and no new data were generated as part of this review.Conflicts of interest
There are no conflicts of interest to declare.Acknowledgements
This work was supported by the Riddet Institute, a New Zealand Center of Research Excellence, funded by the Tertiary Education Commission with grant number: Center of Research Excellence – Riddet Institute (ref: A1615154).References
- J. E. Norton, G. A. Wallis, F. Spyropoulos, P. J. Lillford and I. T. Norton, Designing food structures for nutrition and health benefits, Annu. Rev. Food Sci. Technol., 2014, 5, 177–195 CrossRef CAS PubMed.
- H. Singh and S. Gallier, in Food Structures, Digestion and Health, ed. M. Boland, M. Golding and H. Singh, Academic Press, San Diego, 2014, pp. 51–81. DOI:10.1016/B978-0-12-404610-8.00002-5.
- A. M. E. Hoogeveen, P. J. Moughan, E. S. de Haas, P. Blatchford, W. C. McNabb and C. A. Montoya, Ileal and hindgut fermentation in the growing pig fed a human-type diet, Br. J. Nutr., 2020, 124, 567–576 CrossRef CAS PubMed.
- M. P. H. van Trijp, C. Rösch, R. An, S. Keshtkar, M. J. Logtenberg, G. D. A. Hermes, E. G. Zoetendal, H. A. Schols and G. Hooiveld, Fermentation Kinetics of Selected Dietary Fibers by Human Small Intestinal Microbiota Depend on the Type of Fiber and Subject, Mol. Nutr. Food Res., 2020, 64, e2000455 CrossRef PubMed.
- A. M. Hoogeveen, P. J. Moughan, S. M. Hodgkinson, N. Stroebinger, W. Yu, E. A. Rettedal, W. C. McNabb and C. A. Montoya, In Vitro Ileal Fermentation is Affected More by the Fiber Source Fermented than the Ileal Microbial Composition in Growing Pigs, Curr. Dev. Nutr., 2023, 7, 100076 CrossRef CAS PubMed.
- Q. Guo, A. Ye, H. Singh and D. Rousseau, Destructuring and restructuring of foods during gastric digestion, Compr. Rev. Food Sci. Food Saf., 2020, 19, 1658–1679 CrossRef PubMed.
- R. Lucas-Gonzalez, M. Viuda-Martos, J. A. Perez-Alvarez and J. Fernandez-Lopez, In vitro digestion models suitable for foods: Opportunities for new fields of application and challenges, Food Res. Int., 2018, 107, 423–436 CrossRef CAS PubMed.
- D. Dupont, M. Alric, S. Blanquet-Diot, G. Bornhorst, C. Cueva, A. Deglaire, S. Denis, M. Ferrua, R. Havenaar, J. Lelieveld, A. R. Mackie, M. Marzorati, O. Menard, M. Minekus, B. Miralles, I. Recio and P. Van den Abbeele, Can dynamic in vitro digestion systems mimic the physiological reality?, Crit. Rev. Food Sci. Nutr., 2019, 59, 1546–1562 CrossRef CAS PubMed.
- C. Li, W. Yu, P. Wu and X. D. Chen, Current in vitro digestion systems for understanding food digestion in human upper gastrointestinal tract, Trends Food Sci. Technol., 2020, 96, 114–126 CrossRef CAS.
- J. Nadia, A. G. Olenskyj, N. Stroebinger, S. M. Hodgkinson, T. G. Estevez, P. Subramanian, H. Singh, R. P. Singh and G. M. Bornhorst, Tracking physical breakdown of rice- and wheat-based foods with varying structures during gastric digestion and its influence on gastric emptying in a growing pig model, Food Funct., 2021, 12, 4349–4372 RSC.
- C. A. Montoya, D. L. Cabrera, M. Zou, M. J. Boland and P. J. Moughan, The Rate at Which Digested Protein Enters the Small Intestine Modulates the Rate of Amino Acid Digestibility throughout the Small Intestine of Growing Pigs, J. Nutr., 2018, 148, 1743–1750 CrossRef PubMed.
- J. Mourot, P. Thouvenot, C. Couet, J. M. Antoine, A. Krobicka and G. Debry, Relationship between the rate of gastric emptying and glucose and insulin responses to starchy foods in young healthy adults, Am. J. Clin. Nutr., 1988, 48, 1035–1040 CrossRef CAS PubMed.
- N. A. Nasef, P. Zhu, M. Golding, A. Dave, A. Ali, H. Singh and M. Garg, Salmon food matrix influences digestion and bioavailability of long-chain omega-3 polyunsaturated fatty acids, Food Funct., 2021, 12, 6588–6602 RSC.
- Y. Reynaud, A. Couvent, A. Manach, D. Forest, M. Lopez, D. Picque, I. Souchon, D. Rémond and D. Dupont, Food-dependent set-up of the DiDGI® dynamic in vitro system: Correlation with the porcine model for protein digestion of soya-based food, Food Chem., 2021, 341, 128276 CrossRef CAS PubMed.
- J. Brand-Miller and S. Holt, Testing the glycaemic index of foods: in vivo, not in vitro, Eur. J. Clin. Nutr., 2004, 58, 700–701 CrossRef CAS PubMed.
- L. Egger, O. Ménard, C. Baumann, D. Duerr, P. Schlegel, P. Stoll, G. Vergères, D. Dupont and R. Portmann, Digestion of milk proteins: Comparing static and dynamic in vitro digestion systems with in vivo data, Food Res. Int., 2019, 118, 32–39 CrossRef CAS PubMed.
- G. M. Bornhorst, M. J. Ferrua and R. P. Singh, A proposed food breakdown classification system to predict food behavior during gastric digestion, J. Food Sci., 2015, 80, R924–R934 CrossRef CAS PubMed.
- T. Bohn, F. Carriere, L. Day, A. Deglaire, L. Egger, D. Freitas, M. Golding, S. Le Feunteun, A. Macierzanka, O. Menard, B. Miralles, A. Moscovici, R. Portmann, I. Recio, D. Remond, V. Sante-Lhoutelier, T. J. Wooster, U. Lesmes, A. R. Mackie and D. Dupont, Correlation between in vitro and in vivo data on food digestion. What can we predict with static in vitro digestion models?, Crit. Rev. Food Sci. Nutr., 2017, 1–23, DOI:10.1080/10408398.2017.1315362.
- S. Bellmann, M. Minekus, P. Sanders, S. Bosgra and R. Havenaar, Human glycemic response curves after intake of carbohydrate foods are accurately predicted by combining in vitro gastrointestinal digestion with in silico kinetic modeling, Clin. Nutr. Exp., 2018, 17, 8–22 CrossRef.
- W. Liu, D. Fu, X. Zhang, J. Chai, S. Tian and J. Han, Development and validation of a new artificial gastric digestive system, Food Res. Int., 2019, 122, 183–190 CrossRef CAS PubMed.
- B. Miralles, J. Sanchón, L. Sánchez-Rivera, D. Martínez-Maqueda, Y. Le Gouar, D. Dupont, L. Amigo and I. Recio, Digestion of micellar casein in duodenum cannulated pigs. Correlation between in vitro simulated gastric digestion and in vivo data, Food Chem., 2021, 343, 128424 CrossRef CAS PubMed.
- L. Egger, P. Schlegel, C. Baumann, H. Stoffers, D. Guggisberg, C. Brugger, D. Durr, P. Stoll, G. Vergeres and R. Portmann, Physiological comparability of the harmonized INFOGEST in vitro digestion method to in vivo pig digestion, Food Res. Int., 2017, 102, 567–574 CrossRef CAS PubMed.
- J. Nadia, J. Bronlund, H. Singh, R. P. Singh and G. M. Bornhorst, Structural breakdown of starch-based foods during gastric digestion and its link to glycemic response: In vivo and in vitro considerations, Compr. Rev. Food Sci. Food Saf., 2021, 20, 2660–2698 CrossRef CAS PubMed.
- FDA, Guidance for industry, Extended release dosage forms: development, evaluation and application of an in vitro/in vivo correlation, 1997.
- Y. Qiu and J. Z. Duan, in Developing Solid Oral Dosage Forms, ed. Y. Qiu, Y. Chen, G. G. Z. Zhang, L. Yu and R. V. Mantri, Academic Press, Boston, 2nd edn, 2017, ch. 16, pp. 415–452. DOI:10.1016/B978-0-12-802447-8.00016-9.
- I. González-García, V. Mangas-Sanjuán, M. Merino-Sanjuán and M. Bermejo, In vitro-in vivo correlations: general concepts, methodologies and regulatory applications, Drug Dev. Ind. Pharm., 2015, 41, 1935–1947 CrossRef PubMed.
- S. Suarez-Sharp, M. Li, J. Duan, H. Shah and P. Seo, Regulatory Experience with In Vivo In Vitro Correlations (IVIVC) in New Drug Applications, AAPS J., 2016, 18, 1379–1390 CrossRef CAS PubMed.
- S. Jacob and A. B. Nair, An updated overview with simple and practical approach for developing in vitro-in vivo correlation, Drug Dev. Res., 2018, 79, 97–110 CrossRef CAS PubMed.
- M. G. Davanço, D. R. Campos and P. d. O. Carvalho, In vitro–In vivo correlation in the development of oral drug formulation: A screenshot of the last two decades, Int. J. Pharm., 2020, 580, 119210 CrossRef PubMed.
- S. Sakore and B. S. Chakraborty, In Vitro-In Vivo Correlation (IVIVC): A Strategic Tool in Drug Development, J. Bioequivalence Bioavailability, 2011, S3, 1–12 Search PubMed.
- B. Singh, R. Khurana and S. Beg, From Biostudies to Biowaivers using IVIVC: A Favorable but Fastidious Sojourn, Pharmatimes, 2013, 45, 9–16 Search PubMed.
- J. M. Cardot and B. M. Davit, In vitro–In Vivo Correlations: Tricks and Traps, AAPS J., 2012, 14, 491–499 CrossRef CAS PubMed.
- J. Emami, In vitro–in vivo correlation: From theory to application, J. Pharm. Pharm. Sci., 2006, 9, 169–189 CAS.
- G. L. Amidon, H. Lennernäs, V. P. Shah and J. R. Crison, A Theoretical Basis for a Biopharmaceutic Drug Classification: The Correlation of in Vitro Drug Product Dissolution and in Vivo Bioavailability, Pharm. Res., 1995, 12, 413–420 CrossRef CAS PubMed.
- A. Charalabidis, M. Sfouni, C. Bergström and P. Macheras, The Biopharmaceutics Classification System (BCS) and the Biopharmaceutics Drug Disposition Classification System (BDDCS): Beyond guidelines, Int. J. Pharm., 2019, 566, 264–281 CrossRef CAS PubMed.
- L. J. Henze, B. T. Griffin, M. Christiansen, C. Bundgaard, P. Langguth and R. Holm, Exploring gastric emptying rate in minipigs: Effect of food type and pre-dosing of metoclopramide, Eur. J. Pharm. Sci., 2018, 118, 183–190 CrossRef CAS PubMed.
- S. Muttakin, T. E. Moxon and O. Gouseti, in Interdisciplinary Approaches to Food Digestion, ed. O. Gouseti, G. M. Bornhorst, S. Bakalis and A. Mackie, Springer International Publishing, Cham, 2019, pp. 29–67. DOI:10.1007/978-3-030-03901-1_3.
- R. Spiller and L. Marciani, Intraluminal impact of food: New insights from MRI, Nutrients, 2019, 11, 1147 CrossRef CAS PubMed.
- J. B. Frøkjaer, A. M. Drewes and H. Gregersen, Imaging of the gastrointestinal tract-novel technologies, World J. Gastroenterol., 2009, 15, 160–168 CrossRef PubMed.
- K. S. Schulze, The imaging and modelling of the physical processes involved in digestion and absorption, Acta Physiol., 2015, 213, 394–405 CrossRef CAS PubMed.
- G. M. Bornhorst and R. P. Singh, Gastric digestion in vivo and in vitro: how the structural aspects of food influence the digestion process, Annu. Rev. Food Sci. Technol., 2014, 5, 111–132 CrossRef CAS PubMed.
- A. Ziegler, L. Gonzalez and A. Blikslager, Large Animal Models: The Key to Translational Discovery in Digestive Disease Research, Cell. Mol. Gastroenterol. Hepatol., 2016, 2, 716–724 CrossRef PubMed.
- T. T. Kararli, Comparison of the gastrointestinal anatomy, physiology, and biochemistry of humans and commonly used laboratory animals, Biopharm. Drug Dispos., 1995, 16, 351–380 CrossRef CAS PubMed.
- A.-I. Mulet-Cabero, L. Egger, R. Portmann, O. Ménard, S. Marze, M. Minekus, S. Le Feunteun, A. Sarkar, M. M. L. Grundy, F. Carrière, M. Golding, D. Dupont, I. Recio, A. Brodkorb and A. R. Mackie, A standardised semi-dynamic in vitro digestion method suitable for food – an international consensus, Food Funct., 2020, 11, 1702–1720 RSC.
- I. Sensoy, A review on the food digestion in the digestive tract and the used in vitro models, Curr. Res. Food Sci., 2021, 4, 308–319 CrossRef PubMed.
- A. Alegria, G. Garcia-Llatas and A. Cilla, in The Impact of Food Bioactives on Health: in vitro and ex vivo models, ed. K. Verhoeckx, P. Cotter, I. Lopez-Exposito, C. Kleiveland, T. Lea, A. Mackie, T. Requena, D. Swiatecka and H. Wichers, Cham, CH, 2015, pp. 3–12. DOI:10.1007/978-3-319-16104-4_1.
- G. M. Bornhorst, O. Gouseti, M. S. Wickham and S. Bakalis, Engineering digestion: Multiscale processes of food digestion, J. Food Sci., 2016, 81, R534–R543 CAS.
- C. Shani-Levi, P. Alvito, A. Andrés, R. Assunção, R. Barberá, S. Blanquet-Diot, C. Bourlieu, A. Brodkorb, A. Cilla, A. Deglaire, S. Denis, D. Dupont, A. Heredia, S. Karakaya, C. V. L. Giosafatto, L. Mariniello, C. Martins, O. Ménard, S. N. El, G. E. Vegarud, E. Ulleberg and U. Lesmes, Extending in vitro digestion models to specific human populations: Perspectives, practical tools and bio-relevant information, Trends Food Sci. Technol., 2017, 60, 52–63 CrossRef CAS.
- A. Mackie, A.-I. Mulet-Cabero and A. Torcello-Gómez, Simulating human digestion: developing our knowledge to create healthier and more sustainable foods, Food Funct., 2020, 11, 9397–9431 RSC.
- H. Ji, J. Hu, S. Zuo, S. Zhang, M. Li and S. Nie, In vitro gastrointestinal digestion and fermentation models and their applications in food carbohydrates, Crit. Rev. Food Sci. Nutr., 2022, 62, 5349–5371 CrossRef CAS PubMed.
- P. Wu and X. D. Chen, On designing biomimic in vitro human and animal digestion track models: ideas, current and future devices, Curr. Opin. Food Sci., 2020, 35, 10–19 CrossRef.
- D. Duijsens, K. Pälchen, J. M. Guevara-Zambrano, S. H. E. Verkempinck, M. R. Infantes-Garcia, M. E. Hendrickx, A. M. Van Loey and T. Grauwet, Strategic choices for in vitro food digestion methodologies enabling food digestion design, Trends Food Sci. Technol., 2022, 126, 61–72 CrossRef CAS.
- A. Brodkorb, L. Egger, M. Alminger, P. Alvito, R. Assuncao, S. Ballance, T. Bohn, C. Bourlieu-Lacanal, R. Boutrou, F. Carriere, A. Clemente, M. Corredig, D. Dupont, C. Dufour, C. Edwards, M. Golding, S. Karakaya, B. Kirkhus, S. Le Feunteun, U. Lesmes, A. Macierzanka, A. R. Mackie, C. Martins, S. Marze, D. J. McClements, O. Menard, M. Minekus, R. Portmann, C. N. Santos, I. Souchon, R. P. Singh, G. E. Vegarud, M. S. J. Wickham, W. Weitschies and I. Recio, INFOGEST static in vitro simulation of gastrointestinal food digestion, Nat. Protoc., 2019, 14, 991–1014 CrossRef CAS PubMed.
- M. Minekus, M. Alminger, P. Alvito, S. Ballance, T. Bohn, C. Bourlieu, F. Carriere, R. Boutrou, M. Corredig, D. Dupont, C. Dufour, L. Egger, M. Golding, S. Karakaya, B. Kirkhus, S. Le Feunteun, U. Lesmes, A. Macierzanka, A. R. Mackie, S. Marze, D. J. McClements, O. Menard, I. Recio, C. N. Santos, R. P. Singh, G. E. Vegarud, M. S. Wickham, W. Weitschies and A. Brodkorb, A standardised static in vitro digestion method suitable for food – an international consensus, Food Funct., 2014, 5, 1113–1124 RSC.
- J. L. Urbain, J. A. Siegel, N. D. Charkes, A. H. Maurer, L. S. Malmud and R. S. Fisher, The two-component stomach: effects of meal particle size on fundal and antral emptying, Eur. J. Nucl. Med., 1989, 15, 254–259 CrossRef CAS PubMed.
- J. A. Siegel, J. L. Urbain, L. P. Adler, N. D. Charkes, A. H. Maurer, B. Krevsky, L. C. Knight, R. S. Fisher and L. S. Malmud, Biphasic nature of gastric emptying, Gut, 1988, 29, 85–89 CrossRef CAS PubMed.
- K. C. Drechsler and G. M. Bornhorst, Modeling the softening of carbohydrate-based foods during simulated gastric digestion, J. Food Eng., 2018, 222, 38–48 CrossRef CAS.
- J. Nadia, A. G. Olenskyj, N. Stroebinger, S. M. Hodgkinson, T. G. Estevez, P. Subramanian, H. Singh, R. P. Singh and G. M. Bornhorst, Cooked Rice–Based and Wheat-Based Food Structure Influenced Digestion Kinetics and Glycemic Response in Growing Pigs, J. Nutr., 2023, 153(5), 1373–1388 CrossRef CAS PubMed.
- P. Ahlgren, B. Jarneving and R. Rousseau, Requirements for a cocitation similarity measure, with special reference to Pearson’s correlation coefficient, J. Am. Soc. Inf. Sci. Technol., 2003, 54, 550–560 CrossRef.
- J. A. Bower, in Statistical Methods for Food Science: Introductory Procedures for the Food Practitioner, Wiley Blackwell, UK, 2nd edn, 2013, pp. 141–154. DOI:10.1002/9781118541593.ch6.
- M. M. Mukaka, Statistics corner: A guide to appropriate use of correlation coefficient in medical research, Malawi Med. J., 2012, 24, 69–71 CAS.
- J. M. Bland and D. G. Altman, Measuring agreement in method comparison studies, Stat. Methods Med. Res., 1999, 8, 135–160 CrossRef CAS PubMed.
- J. J. M. Moreno, A. P. Pol, A. S. Abad and B. C. Blasco, Using the R-MAPE index as a resistant measure of forecast accuracy, Psicothema, 2013, 25, 500–506 Search PubMed.
- J. S. Krouwer, Why Bland–Altman plots should use X, not (Y + X)/2 when X is a reference method, Stat. Med., 2008, 27, 778–780 CrossRef PubMed.
- J. Tayman and D. A. Swanson, On the validity of MAPE as a measure of population forecast accuracy, Popul. Res. Policy Rev., 1999, 18, 299–322 CrossRef.
- J. Nadia, A. G. Olenskyj, P. Subramanian, S. Hodgkinson, N. Stroebinger, T. G. Estevez, R. P. Singh, H. Singh and G. M. Bornhorst, Influence of food macrostructure on the kinetics of acidification in the pig stomach after the consumption of rice- and wheat-based foods: Implications for starch hydrolysis and starch emptying rate, Food Chem., 2022, 394, 133410 CrossRef CAS PubMed.
- J. Nadia, A. G. Olenskyj, N. Stroebinger, S. M. Hodgkinson, T. G. Estevez, P. Subramanian, H. Singh, R. P. Singh and G. M. Bornhorst, Cooked Rice–Based and Wheat-Based Food Structure Influenced Digestion Kinetics and Glycemic Response in Growing Pigs, J. Nutr., 2023, 153, 1373–1388 CrossRef CAS PubMed.
- J. Nadia, A. Olenskyj, N. Stroebinger, S. Hodgkinson, T. Estevez, P. Subramanian, H. Singh, R. Singh and G. Bornhorst, Carbohydrate Digestion: The importance of the proximal and distal stomach during digestion in growing pigs, Anim. – Sci. Proc., 2022, 13, 127–132 CrossRef.
- J. Nadia, H. Singh and G. M. Bornhorst, Evaluation of the performance of the human gastric simulator using durum wheat-based foods of contrasting food structure, Food Funct., 2023, 14, 6877–6895 RSC.
- P. Wu, S. Dhital, B. A. Williams, X. D. Chen and M. J. Gidley, Rheological and microstructural properties of porcine gastric digesta and diets containing pectin or mango powder, Carbohydr. Polym., 2016, 148, 216–226 CrossRef CAS PubMed.
- D. Roy, A. Ye, P. J. Moughan and H. Singh, Impact of gastric coagulation on the kinetics of release of fat globules from milk of different species, Food Funct., 2021, 12, 1783–1802 RSC.
- D. Roy, P. J. Moughan, A. Ye, S. M. Hodgkinson, N. Stroebinger, S. Li, A. C. Dave, C. A. Montoya and H. Singh, Structural changes in milk from different species during gastric digestion in piglets, J. Dairy Sci., 2022, 105, 3810–3831 CrossRef CAS PubMed.
- F. Kong and R. P. Singh, A human gastric simulator (HGS) to study food digestion in human stomach, J. Food Sci., 2010, 75, E627–E635 CrossRef CAS PubMed.
- J. D. Elashoff, T. J. Reedy and J. H. Meyer, Analysis of gastric emptying data, Gastroenterology, 1982, 83, 1306–1312 CrossRef CAS.
- J. A. Calbet and D. A. MacLean, Role of caloric content on gastric emptying in humans, J. Physiol., 1997, 498(Pt 2), 553–559 CrossRef CAS PubMed.
- N. S. Kwatra, E. Shalaby-Rana, M. P. Andrich, J. Tsai, A. L. Rice, S. J. Ghelani, S. E. Spottswood and M. Majd, Gastric emptying of milk in infants and children up to 5 years of age: normative data and influencing factors, Pediatr. Radiol., 2020, 50, 689–697 CrossRef PubMed.
- J. Nadia, J. E. Bronlund, H. Singh, R. P. Singh and G. M. Bornhorst, Contribution of the proximal and distal gastric phases to the breakdown of cooked starch-rich solid foods during static in vitro gastric digestion, Food Res. Int., 2022, 157, 111270 CrossRef CAS PubMed.
- O. Menard, T. Cattenoz, H. Guillemin, I. Souchon, A. Deglaire, D. Dupont and D. Picque, Validation of a new in vitro dynamic system to simulate infant digestion, Food Chem., 2014, 145, 1039–1045 CrossRef CAS PubMed.
- A. Payal, A. Elumalai, S. V. Murugan, J. A. Moses and C. Anandharamakrishnan, An investigation on gastric emptying behavior of apple in the dynamic digestion model ARK® and its validation using MRI of human subjects – A pilot study, Biochem. Eng. J., 2021, 175, 108134 CrossRef.
- M. Vardakou, A. Mercuri, S. A. Barker, D. Q. M. Craig, R. M. Faulks and M. J. S. Wickham, Achieving antral grinding forces in biorelevant in vitro models: Comparing the USP dissolution apparatus II and the dynamic gastric model with human in vivo data, AAPS PharmSciTech, 2011, 12, 620–626 CrossRef PubMed.
- J. Wang, P. Wu, M. Liu, Z. Liao, Y. Wang, Z. Dong and X. D. Chen, An advanced near real dynamic in vitro human stomach system to study gastric digestion and emptying of beef stew and cooked rice, Food Funct., 2019, 10, 2914–2925 RSC.
- A. Ye, W. Liu, J. Cui, X. Kong, D. Roy, Y. Kong, J. Han and H. Singh, Coagulation behaviour of milk under gastric digestion: Effect of pasteurization and ultra-high temperature treatment, Food Chem., 2019, 286, 216–225 CrossRef CAS PubMed.
- S. Bellmann, J. Lelieveld, T. Gorissen, M. Minekus and R. Havenaar, Development of an advanced in vitro model of the stomach and its evaluation versus human gastric physiology, Food Res. Int., 2016, 88, 191–198 CrossRef CAS.
- G. Somaratne, M. J. Ferrua, A. Ye, F. Nau, J. Floury, D. Dupont and J. Singh, Food material properties as determining factors in nutrient release during human gastric digestion: a review, Crit. Rev. Food Sci. Nutr., 2020, 1–17, DOI:10.1080/10408398.2019.1707770.
- G. M. Bornhorst, Gastric mixing during food digestion: Mechanisms and applications, Annu. Rev. Food Sci. Technol., 2017, 8, 523–542 CrossRef PubMed.
- C. C. Chiang, J. Croom, S. T. Chuang, P. W. S. Chiou and B. Yu, Development of a Dynamic System Simulating Pig Gastric Digestion, Asian-Australas. J. Anim. Sci., 2008, 21, 1522–1528 CrossRef CAS.
Footnote |
| † Electronic supplementary information (ESI) available. See DOI: https://doi.org/10.1039/d3fo05663e |
| This journal is © The Royal Society of Chemistry 2024 |