
 Open Access Article
 This Open Access Article is licensed under a
 Creative Commons Attribution 3.0 Unported Licence
Shine bright or live long: substituent effects in [Cu(N^N)(P^P)]+-based light-emitting electrochemical cells where N^N is a 6-substituted 2,2′-bipyridine†
Sarah
Keller
a,
Antonio
Pertegás
b,
Giulia
Longo
b,
Laura
Martínez
b,
Jesús
Cerdá
b,
José M.
Junquera-Hernández
b,
Alessandro
Prescimone
a,
Edwin C.
Constable
a,
Catherine E.
Housecroft
*a,
Enrique
Ortí
*b and
Henk J.
Bolink
b
aDepartment of Chemistry, University of Basel, Spitalstrasse 51, CH-4056 Basel, Switzerland. E-mail: catherine.housecroft@unibas.ch
bInstituto de Ciencia Molecular, Universidad de Valencia, Catedrático José Beltrán 2, Paterna, E-46980, Spain. E-mail: enrique.orti@uv.es
First published on 25th January 2016
Abstract
We report [Cu(P^P)(N^N)][PF6] complexes with P^P = bis(2-(diphenylphosphino)phenyl)ether (POP) or 4,5-bis(diphenylphosphino)-9,9-dimethylxanthene (xantphos) and N^N = 6-methyl-2,2′-bipyridine (Mebpy), 6-ethyl-2,2′-bipyridine (Etbpy), 6,6′-dimethyl-2,2′-bipyridine (Me2bpy) or 6-phenyl-2,2′-bipyridine (Phbpy). The crystal structures of [Cu(POP)(Phbpy)][PF6]·Et2O, [Cu(POP)(Etbpy)][PF6]·Et2O, [Cu(xantphos)(Me2bpy)][PF6], [Cu(xantphos)(Mebpy)][PF6]·CH2Cl2·0.4Et2O, [Cu(xantphos)(Etbpy)][PF6]·CH2Cl2·1.5H2O and [Cu(xantphos)(Phbpy)][PF6] are described; each copper(I) centre is distorted tetrahedral. In the crystallographically determined structures, the N^N domain in [Cu(xantphos)(Phbpy)]+ and [Cu(POP)(Phbpy)]+ is rotated ∼180° with respect to its orientation in [Cu(xantphos)(Mebpy)]+, [Cu(POP)(Etbpy)]+ and [Cu(xantphos)(Etbpy)]+; in each complex containing xantphos, the xanthene ‘bowl’ retains the same conformation in the solid-state structures. The two conformers resulting from the 180° rotation of the N^N ligand were optimized at the B3LYP-D3/(6-31G**+LANL2DZ) level and are close in energy for each complex. Variable temperature NMR spectroscopy evidences the presence of two conformers of [Cu(xantphos)(Phbpy)]+ in solution which are related by inversion of the xanthene unit. The complexes exhibit MLCT absorption bands in the range 378 to 388 nm, and excitation into each MLCT band leads to yellow emissions. Photoluminescence quantum yields (PLQYs) increase from solution to thin-film and powder; the highest PLQYs are observed for powdered [Cu(xantphos)(Mebpy)][PF6] (34%), [Cu(xantphos)(Etbpy)][PF6] (37%) and [Cu(xantphos)(Me2bpy)][PF6] (37%) with lifetimes of 9.6–11 μs. Density functional theory calculations predict that the emitting triplet (T1) involves an electron transfer from the Cu–P^P environment to the N^N ligand and therefore shows a 3MLCT character. T1 is calculated to be ∼0.20 eV lower in energy than the first singlet excited state (S1). The [Cu(P^P)(N^N)][PF6] ionic transition-metal (iTMC) complexes were tested in light-emitting electrochemical cells (LECs). Turn-on times are fast, and the LEC with [Cu(xantphos)(Me2bpy)][PF6] achieves a maximum efficacy of 3.0 cd A−1 (luminance = 145 cd m−2) with a lifetime of 1 h; on going to the [Cu(xantphos)(Mebpy)][PF6]-based LEC, the lifetime exceeds 15 h but at the expense of the efficacy (1.9 cd A−1). The lifetimes of LECs containing [Cu(xantphos)(Etbpy)][PF6] and [Cu(POP)(Etbpy)][PF6] exceed 40 and 80 h respectively.
Introduction
Current research on light-emitting materials focuses on the replacement of power-inefficient light bulbs by more efficient, sustainable and versatile solid-state lighting devices including light-emitting diodes (LEDs), organic light-emitting diodes (OLEDs) and light-emitting electrochemical cells (LECs).1–3 By direct conversion of electrical energy into light, the energy loss through heat is negligible in these systems, resulting in considerable lower energy and cost of operation. Although most research efforts have focused on LEDs and OLEDs, the simpler design and solution processing of LECs make them promising candidates for upscaling to eventually fulfil commercial demands.1,4Examples of LECs based on polymers,5,6 small molecules7–9 and ionic transition-metal complexes (iTMCs)1,10–12 have been reported in the literature over the last few years. However, the best efficiencies have been achieved with the last group due to their phosphorescent emission.13 Iridium(III) and ruthenium(II) complexes have been extensively explored in LECs and have led to considerable progress in the field. However, with the low abundance and high price of these rare-heavy metal atoms, copper has recently emerged as a cheap14 alternative for the preparation of LECs. To date, mononuclear,15–17 dinuclear18–20 and polynuclear21 copper complexes have been investigated for application in LECs or OLEDs, with heteroleptic copper(I) complexes of the type [Cu(P^P)(N^N)]+ (P^P and N^N = chelating bis(phosphino) and diimine ligands, respectively) showing particular promise.15,16,22–32 For practical applications, devices which combine long-term stability with high efficiency are required, and this remains a challenge for LECs based on Cu-iTMCs.
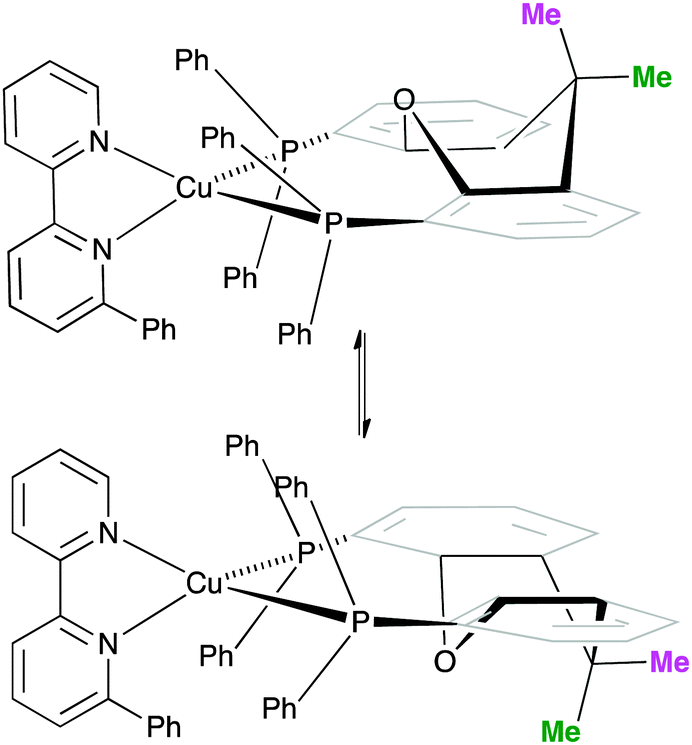
We have previously demonstrated that the emissive properties of [Cu(POP)(N^N)][PF6] (POP = bis(2-(diphenylphosphino)phenyl)ether) complexes improve as the N^N ligand is changed from 2,2′-bipyridine (bpy) to 6-methyl-2,2′-bipyridine (Mebpy) to 6,6′-dimethyl-2,2′-bipyridine (Me2bpy).15,16 This is consistent with the enhancement of the emission of [Cu(POP)(phen)]+ (phen = 1,10-phenanthroline) complexes upon increasing the number of substituents in the 2,9-positions of phen.33 Most significantly, the complexes [Cu(POP)(Mebpy)][PF6] and [Cu(POP)(Me2bpy)][PF6] perform remarkably well in LECs.16 When operated under a pulsed current, LECs containing [Cu(POP)(Me2bpy)][PF6] achieve a maximum luminance of 52 cd m−2 and a maximum efficacy of 5.2 cd A−1.16 This compares to 1.64 cd A−1 for [Cu(POP)(bpy)][PF6] in LECs driven under a constant voltage of 4 V.15 We now report the effects of introducing bulkier substituents into the 6-position of the bpy ligand in [Cu(POP)(bpy)]+-based complexes, and also the consequences for the emission properties and LEC performances of exchanging POP for xantphos (xantphos = 4,5-bis(diphenylphosphino)-9,9-dimethylxanthene) (Scheme 1). The effect of modifying the bpy ligands combined with different P^P domains provides insights into the factors that control the stability and performance of both the [Cu(N^N)(P^P)]+ complexes and their LEC devices.
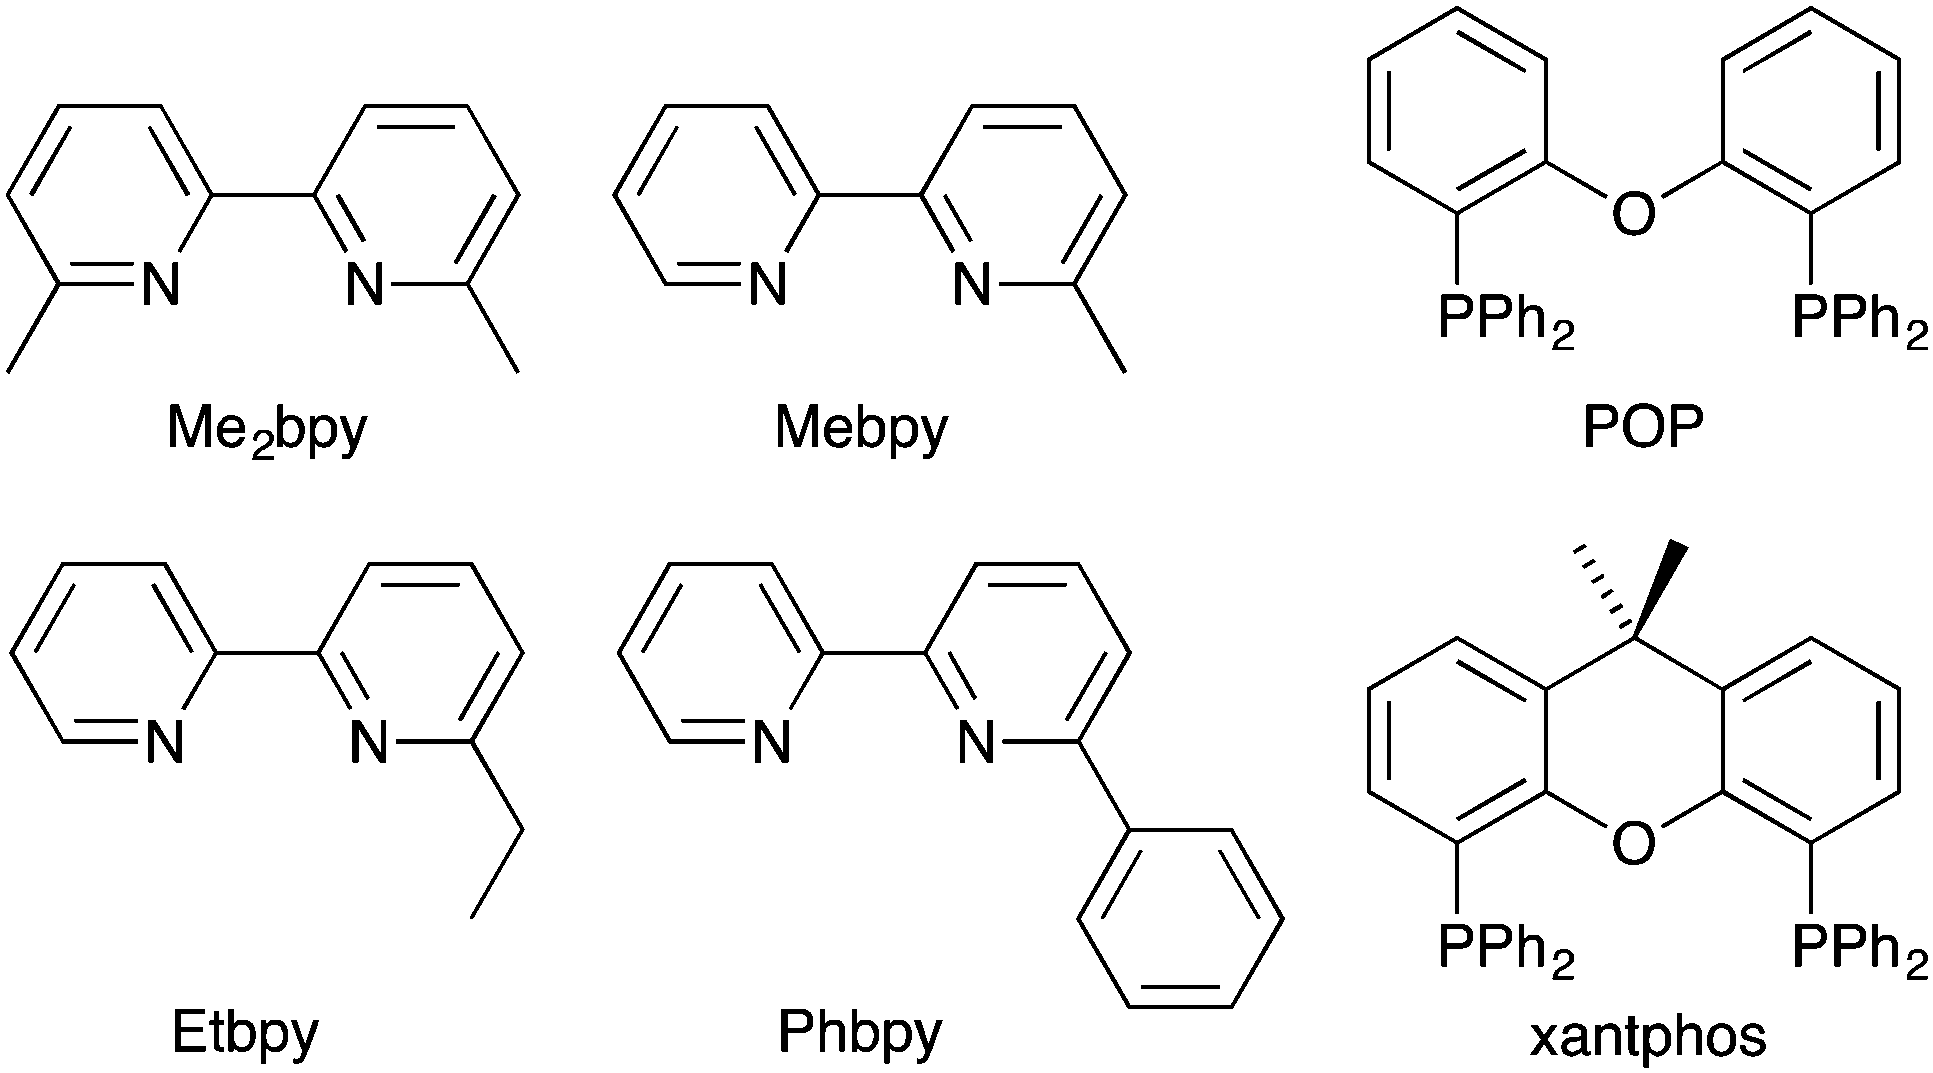 | ||
| Scheme 1 Structures of N^N ligands 6,6′-dimethyl-2,2′-bipyridine (Me2bpy), 6-methyl-2,2′-bipyridine (Mebpy), 6-ethyl-2,2′-bipyridine (Etbpy) and 6-phenyl-2,2′-bipyridine (Phbpy), and the P^P ligands POP and xantphos. | ||
Experimental
General
1H, 13C and 31P NMR spectra were recorded at room temperature using a Bruker Avance III-600, III-500 or III-400 NMR spectrometer. 1H and 13C NMR chemical shifts were referenced to residual solvent peaks with respect to δ(TMS) = 0 ppm and 31P NMR chemical shifts with respect to δ(85% aqueous H3PO4) = 0 ppm. Solution absorption and emission spectra were measured using an Agilent 8453 spectrophotometer and a Shimadzu RF-5301PC spectrofluorometer, respectively. Electrospray ionization (ESI) mass spectra were recorded on a Bruker esquire 3000plus instrument. Quantum yields in CH2Cl2 solution and powder were measured using a Hamamatsu absolute photoluminescence (PL) quantum yield spectrometer C11347 Quantaurus-QY. Emission lifetimes and powder emission spectra were measured with a Hamamatsu Compact Fluorescence lifetime Spectrometer C11367 Quantaurus-Tau, using an LED light source with λexc = 365 nm. Quantum yields and PL emission spectra in thin films were recorded using a Hamamatsu absolute quantum yield C9920. The preparation of the thin film samples consisted of deposition on a quartz plate (1 cm2) of the complex with addition of the ionic liquid 1-ethyl-3-methylimidazolium hexafluoridophosphate [Emim][PF6]. These samples were excited using a light source with λexc = 365 nm at room temperature under ambient conditions.The compounds Mebpy, Etbpy and Phbpy were prepared following literature methods34,35 and the NMR spectroscopic data matched those reported.35,36 POP was purchased from Acros, xantphos, and Me2bpy from Fluorochem. [Cu(MeCN)4][PF6] was prepared by the published method.37
![[thin space (1/6-em)]](https://www.rsc.org/images/entities/char_2009.gif) 800), 295 (24400), 388 (3000). ESI MS: m/z 873.6 [M−PF6]+ (base peak, calc. 873.2). Found C 63.40, H 4.67, N 3.19; C52H40CuF6N2OP3 requires C 63.77, H 4.12, N 2.86%.
400), 312sh (15500), 386 (3000). ESI MS: m/z 873.6 [M−PF6]+ (base peak, calc. 873.2). Found C 63.84, H 4.70, N 3.07; C55H44CuF6N2OP3·H2O requires C 63.68, H 4.47, N 2.70%.
700), 284 (29500), 312sh (12500), 379 (3500). ESI MS: m/z 811.6 [M−PF6]+ (base peak, calc. 811.2). Found C 63.24, H 4.86, N 3.33; C50H42CuF6N2OP3 requires C 62.73, H 4.42, N 2.93%.
600), 244sh (33200), 284 (29500), 311sh (12900), 378 (3500). ESI MS: m/z 825.6 [M−PF6]+ (base peak, calc. 825.2). Found C 63.29, H 4.95, N 3.27; C51H44CuF6N2OP3 requires C 63.06, H 4.57, N 2.88%.
100), 290 (24900), 312sh (30000), 381 (3300). ESI MS: m/z 785.5 [M−PF6]+ (base peak, calc. 785.2). Found C 61.91, H 4.42, N 3.37; C48H40CuF6N2OP3 requires C 61.90, H 4.33, N 3.01%.
900), 284 (28000), 311sh (11300), 382 (2700). ESI MS: m/z 825.2 [M−PF6]+ (base peak, calc. 825.2). Found C 63.13, H 4.95, N 3.22; C51H44CuF6N2OP3 requires C 63.06, H 4.57, N 2.88%.
800), 295 (24400), 388 (3000). ESI MS: m/z 873.6 [M−PF6]+ (base peak, calc. 873.2). Found C 63.40, H 4.67, N 3.19; C52H40CuF6N2OP3 requires C 63.77, H 4.12, N 2.86%.
400), 312sh (15500), 386 (3000). ESI MS: m/z 873.6 [M−PF6]+ (base peak, calc. 873.2). Found C 63.84, H 4.70, N 3.07; C55H44CuF6N2OP3·H2O requires C 63.68, H 4.47, N 2.70%.
700), 284 (29500), 312sh (12500), 379 (3500). ESI MS: m/z 811.6 [M−PF6]+ (base peak, calc. 811.2). Found C 63.24, H 4.86, N 3.33; C50H42CuF6N2OP3 requires C 62.73, H 4.42, N 2.93%.
600), 244sh (33200), 284 (29500), 311sh (12900), 378 (3500). ESI MS: m/z 825.6 [M−PF6]+ (base peak, calc. 825.2). Found C 63.29, H 4.95, N 3.27; C51H44CuF6N2OP3 requires C 63.06, H 4.57, N 2.88%.
100), 290 (24900), 312sh (30000), 381 (3300). ESI MS: m/z 785.5 [M−PF6]+ (base peak, calc. 785.2). Found C 61.91, H 4.42, N 3.37; C48H40CuF6N2OP3 requires C 61.90, H 4.33, N 3.01%.
900), 284 (28000), 311sh (11300), 382 (2700). ESI MS: m/z 825.2 [M−PF6]+ (base peak, calc. 825.2). Found C 63.13, H 4.95, N 3.22; C51H44CuF6N2OP3 requires C 63.06, H 4.57, N 2.88%.
Crystallography
Data were collected on a Bruker Kappa Apex2 diffractometer with data reduction, solution and refinement using the programs APEX38 and CRYSTALS.39 Structural analysis was carried out using Mercury v. 3.5.1.40,41![[1 with combining macron]](https://www.rsc.org/images/entities/char_0031_0304.gif) , a = 11.7097(7), b = 14.0940(8), c = 16.9221(10) Å, α = 110.418(2), β = 105.114(2), γ = 96.608(2)°, U = 2460.4(3) Å3, Z = 2, Dc = 1.422 Mg m−3, μ(Cu-Kα) = 2.123 mm−1, T = 123 K. Total 31167 reflections, 8708 unique, Rint = 0.021. Refinement of 8536 reflections (631 parameters) with I > 2σ(I) converged at final R1 = 0.0421 (R1 all data = 0.0425), wR2 = 0.1093 (wR2 all data = 0.1095), gof = 0.9770. CCDC 1422375.
, a = 11.0240(10), b = 15.0242(13), c = 18.1498(16) Å, α = 109.274(4), β = 96.649(3), γ = 109.556(3)°, U = 2586.0(2) Å3, Z = 2, Dc = 1.377 Mg m−3, μ(Cu-Kα) = 2.947 mm−1, T = 123 K. Total 31667 reflections, 8960 unique, Rint = 0.028. Refinement of 8640 reflections (615 parameters) with I > 2σ(I) converged at final R1 = 0.0660 (R1 all data = 0.0673), wR2 = 0.1763 (wR2 all data = 0.1770), gof = 1.0065. CCDC 1422372.
, a = 11.3520(7), b = 14.0919(9), c = 14.8225(10) Å, α = 89.240(2), β = 68.865(2), γ = 88.481(2)°, U = 2210.88(15) Å3, Z = 2, Dc = 1.459 Mg m−3, μ(Cu-Kα) = 2.294 mm−1, T = 123 K. Total 36576 reflections, 7980 unique, Rint = 0.030. Refinement of 7676 reflections (577 parameters) with I > 2σ(I) converged at final R1 = 0.0549 (R1 all data = 0.0563), wR2 = 0.1380 (wR2 all data = 0.1386), gof = 0.8779. CCDC 1422373.
, a = 9.8765(10), b = 14.2651(15), c = 18.6704(19) Å, α = 103.932(3), β = 95.012(3), γ = 107.013(3)°, U = 2405.8(2) Å3, Z = 2, Dc = 1.388 Mg m−3, μ(Cu-Kα) = 2.141 mm−1, T = 123 K. Total 31470 reflections, 8397 unique, Rint = 0.028. Refinement of 8323 reflections (595 parameters) with I > 2σ(I) converged at final R1 = 0.0534 (R1 all data = 0.0537), wR2 = 0.1356 (wR2 all data = 0.1355), gof = 1.0230. CCDC 1422374.
, a = 10.9607(7), b = 15.1290(10), c = 18.4236(13) Å, α = 110.648(4), β = 96.075(4), γ = 108.716(3)°, U = 2623.7(3) Å3, Z = 2, Dc = 1.371 Mg m−3, μ(Cu-Kα) = 2.926 mm−1, T = 123 K. Total 32742 reflections, 9509 unique, Rint = 0.044. Refinement of 8432 reflections (622 parameters) with I > 2σ(I) converged at final R1 = 0.0694 (R1 all data = 0.0756), wR2 = 0.1860 (wR2 all data = 0.1894), gof = 1.0230. CCDC 1429456.
877 reflections, 8964 unique, Rint = 0.053. Refinement of 8089 reflections (613 parameters) with I > 2σ(I) converged at final R1 = 0.0442 (R1 all data = 0.0616), wR2 = 0.0715 (wR2 all data = 0.1159), gof = 1.0005. CCDC 1435492.
, a = 11.7097(7), b = 14.0940(8), c = 16.9221(10) Å, α = 110.418(2), β = 105.114(2), γ = 96.608(2)°, U = 2460.4(3) Å3, Z = 2, Dc = 1.422 Mg m−3, μ(Cu-Kα) = 2.123 mm−1, T = 123 K. Total 31167 reflections, 8708 unique, Rint = 0.021. Refinement of 8536 reflections (631 parameters) with I > 2σ(I) converged at final R1 = 0.0421 (R1 all data = 0.0425), wR2 = 0.1093 (wR2 all data = 0.1095), gof = 0.9770. CCDC 1422375.
, a = 11.0240(10), b = 15.0242(13), c = 18.1498(16) Å, α = 109.274(4), β = 96.649(3), γ = 109.556(3)°, U = 2586.0(2) Å3, Z = 2, Dc = 1.377 Mg m−3, μ(Cu-Kα) = 2.947 mm−1, T = 123 K. Total 31667 reflections, 8960 unique, Rint = 0.028. Refinement of 8640 reflections (615 parameters) with I > 2σ(I) converged at final R1 = 0.0660 (R1 all data = 0.0673), wR2 = 0.1763 (wR2 all data = 0.1770), gof = 1.0065. CCDC 1422372.
, a = 11.3520(7), b = 14.0919(9), c = 14.8225(10) Å, α = 89.240(2), β = 68.865(2), γ = 88.481(2)°, U = 2210.88(15) Å3, Z = 2, Dc = 1.459 Mg m−3, μ(Cu-Kα) = 2.294 mm−1, T = 123 K. Total 36576 reflections, 7980 unique, Rint = 0.030. Refinement of 7676 reflections (577 parameters) with I > 2σ(I) converged at final R1 = 0.0549 (R1 all data = 0.0563), wR2 = 0.1380 (wR2 all data = 0.1386), gof = 0.8779. CCDC 1422373.
, a = 9.8765(10), b = 14.2651(15), c = 18.6704(19) Å, α = 103.932(3), β = 95.012(3), γ = 107.013(3)°, U = 2405.8(2) Å3, Z = 2, Dc = 1.388 Mg m−3, μ(Cu-Kα) = 2.141 mm−1, T = 123 K. Total 31470 reflections, 8397 unique, Rint = 0.028. Refinement of 8323 reflections (595 parameters) with I > 2σ(I) converged at final R1 = 0.0534 (R1 all data = 0.0537), wR2 = 0.1356 (wR2 all data = 0.1355), gof = 1.0230. CCDC 1422374.
, a = 10.9607(7), b = 15.1290(10), c = 18.4236(13) Å, α = 110.648(4), β = 96.075(4), γ = 108.716(3)°, U = 2623.7(3) Å3, Z = 2, Dc = 1.371 Mg m−3, μ(Cu-Kα) = 2.926 mm−1, T = 123 K. Total 32742 reflections, 9509 unique, Rint = 0.044. Refinement of 8432 reflections (622 parameters) with I > 2σ(I) converged at final R1 = 0.0694 (R1 all data = 0.0756), wR2 = 0.1860 (wR2 all data = 0.1894), gof = 1.0230. CCDC 1429456.
877 reflections, 8964 unique, Rint = 0.053. Refinement of 8089 reflections (613 parameters) with I > 2σ(I) converged at final R1 = 0.0442 (R1 all data = 0.0616), wR2 = 0.0715 (wR2 all data = 0.1159), gof = 1.0005. CCDC 1435492.
Computational details
Dispersion-corrected density functional calculations (DFT-D) were carried out with the D.01 revision of the Gaussian 09 program package42 using Becke's three-parameter B3LYP exchange–correlation functional43,44 together with the 6-31G** basis set for C, H, and N,45 and the “double-ζ” quality LANL2DZ basis set for the Cu element46 in which an effective core potential (ECP) replaces the inner core electrons. The D3 Grimme's dispersion term with Becke–Johnson damping was added to the B3LYP functional (B3LYP-D3) to get a better description of the intramolecular non-covalent interactions that are expected to play a relevant role in determining the molecular geometry of the studied systems.47,48 The geometries of both the singlet ground electronic state (S0) and the lowest-energy triplet state (T1) were fully optimized without imposing any symmetry restriction. The geometry of T1 was calculated at the spin-unrestricted UB3LYP-D3 level using a spin multiplicity of three. Phosphorescence emission energies were estimated as the vertical energy difference between the energy of the minimum of the lowest-energy triplet state and the energy of S0 at the T1 optimized geometry. All the calculations were performed in the presence of the solvent (CH2Cl2). Solvent effects were considered within the self-consistent reaction field (SCRF) theory using the polarized continuum model (PCM) approach.49–51 The calculation of the energy of S0 at the T1 geometry was performed as an equilibrium single-point calculation with respect to the solvent reaction field/solute electronic density polarization process. Time-dependent DFT (TD-DFT)52–54 calculations of the lowest-lying 30 singlet excited states and the lowest-lying 30 triplets of all the complexes were performed in the presence of the solvent at the minimum-energy geometry optimized for the ground state.Device preparation
LECs were prepared on top of a patterned indium tin oxide (ITO, 15 Ω □−1) coated glass substrate (http://www.naranjosubstrates.com) previously cleaned as follows: (a) sonication with soap, (b) deionized water, (c) isopropanol and (d) UV-O3 lamp for 20 min. The thickness of the films was determined with an Ambios XP-1 profilometer. Prior to the deposition of the emitting layer, 80 nm of poly(3,4-ethylenedioxythiophene):poly(styrenesulfonate) (PEDOT:PSS) (CLEVIOS™ P VP AI 4083, aqueous dispersion, 1.3–1.7% solid content, Heraeus) was coated in order to increase the reproducibility of the cells. The emitting layer (130 nm) was prepared by spin-coating of an MeCN solution consisting of the emitting compound with the addition of an ionic liquid 1-ethyl-3-methylimidazolium hexafluoridophosphate [Emim][PF6] (>98.5%, Sigma-Aldrich) in a 4 to 1 molar ratio. The devices were then transferred to an inert atmosphere glovebox (<0.1 ppm O2 and H2O, MBraun), where a layer (70 nm) of aluminium (the top electrode) was thermally evaporated onto the devices using an Edwards Auto500 evaporator integrated in the inert atmosphere glovebox. The area of the device was 6.5 mm2. The devices were not encapsulated and were characterized inside the glovebox at room temperature.Device characterization
The device lifetime was measured by applying a pulsed current and monitoring the voltage and luminance versus time by a True Colour Sensor MAZeT (MTCSiCT Sensor) with a Botest OLT OLED Lifetime-Test System. The average current density is determined by multiplying the peak current density by the time-on time and dividing by the total cycle time. The average luminance is directly obtained by taking the average of the obtained photodiode results and correlating it to the value of a luminance meter. The current efficiency is obtained by dividing the average luminance by the average current density. The electroluminescent (EL) spectra were measured using an Avantes AvaSpec-2048 Fiber Optic Spectrometer during device lifetime measurement.Results and discussion
Synthesis and characterization of the [Cu(P^P)(N^N)][PF6] complexes
The formation of [Cu(P^P)(N^N)][PF6] complexes by treatment of [Cu(MeCN)4][PF6] with the N^N and P^P ligands55 can be complicated by the formation of homoleptic [Cu(N^N)2][PF6] and [Cu(P^P)2][PF6], or formation of [Cu(P^P)]+.32 The POP-containing complexes [Cu(POP)(Etbpy)][PF6] and [Cu(POP)(Phbpy)][PF6] were prepared in a similar manner to their 6-Mebpy analogue16 by sequential addition15 of the POP and N^N ligands to [Cu(MeCN)4][PF6] in CH2Cl2. The yellow heteroleptic complexes were isolated in 80 and 88% yields, respectively. Attempts to prepare [Cu(POP)(Et2bpy)][PF6] and [Cu(POP)(Ph2bpy)][PF6] led to mixtures of products which proved difficult to separate and purify. Optimum yields of the [Cu(xantphos)(N^N)][PF6] complexes were obtained by the slow addition of a CH2Cl2 solution containing a 1:1 mixture of xantphos and the N^N ligand to a CH2Cl2 solution of [Cu(MeCN)4][PF6]. The complexes [Cu(xantphos)(N^N)][PF6] with N^N = Mebpy, Me2bpy, Etbpy and Phbpy were isolated as yellow solids in 71–85% yields. The electrospray mass spectrum of each [Cu(POP)(N^N)][PF6] and [Cu(xantphos)(N^N)][PF6] complex exhibited a base peak corresponding to the [Cu(P^P)(N^N)]+ ion, with an isotope pattern that agreed with that calculated.
The solution 1H and 13C NMR spectra of [Cu(xantphos)(Me2bpy)][PF6] were in accord with C2 symmetry on the NMR timescale, showing only one pyridine environment (ring B, Scheme 2), and one ring C and one ring D environment (Scheme 2). On going to [Cu(xantphos)(Mebpy)][PF6], the symmetry is reduced (Scheme 3); Fig. S1 (ESI†) compares the 1H NMR spectra of [Cu(xantphos)(Me2bpy)][PF6] and [Cu(xantphos)(Mebpy)][PF6]. The assignments in Fig. S1 (ESI†) and of the corresponding 13C NMR spectra were made using COSY, HMQC and HMBC methods. Fig. S2 (ESI†) shows part of the NOESY spectrum of [Cu(xantphos)(Mebpy)][PF6]; the D and D′ phenyl rings can be distinguished from the bpy-Me/HD2 cross peak. Analogous cross peaks in the NOESY spectrum of [Cu(xantphos)(Etbpy)][PF6] between the phenyl ring HD2 and ethyl CH2 protons were observed, and these, in addition to HMQC and HMBC spectra, allowed the complete assignments of the 1H and 13C NMR spectra of [Cu(xantphos)(Etbpy)][PF6] (see Experimental section and Fig. S3, ESI†). A change in the P^P ligand on going from [Cu(xantphos)(Etbpy)][PF6] to [Cu(POP)(Etbpy)][PF6] is accompanied by a shift to lower frequency (δ 7.68 to 7.31 ppm) for the signal for HC5 (the ring CH adjacent to the bridging CMe2 unit in xantphos), and the appearance of a signal for HC6 (see Scheme 2). The bpy domain is little affected (Fig. S3 versus S4, ESI†). The chemical shift separation between signals for phenyl ring protons HD2 and HD2′ becomes less on going from [Cu(xantphos)(Etbpy)][PF6] to [Cu(POP)(Etbpy)][PF6] (Fig. S3 and S4, ESI†); this is also true when comparing the 1H NMR spectra of [Cu(xantphos)(Mebpy)][PF6] (Fig. S1b, ESI†) and [Cu(POP)(Mebpy)][PF6] (δ 7.07 and 6.96 ppm for HD2 and HD2′).16
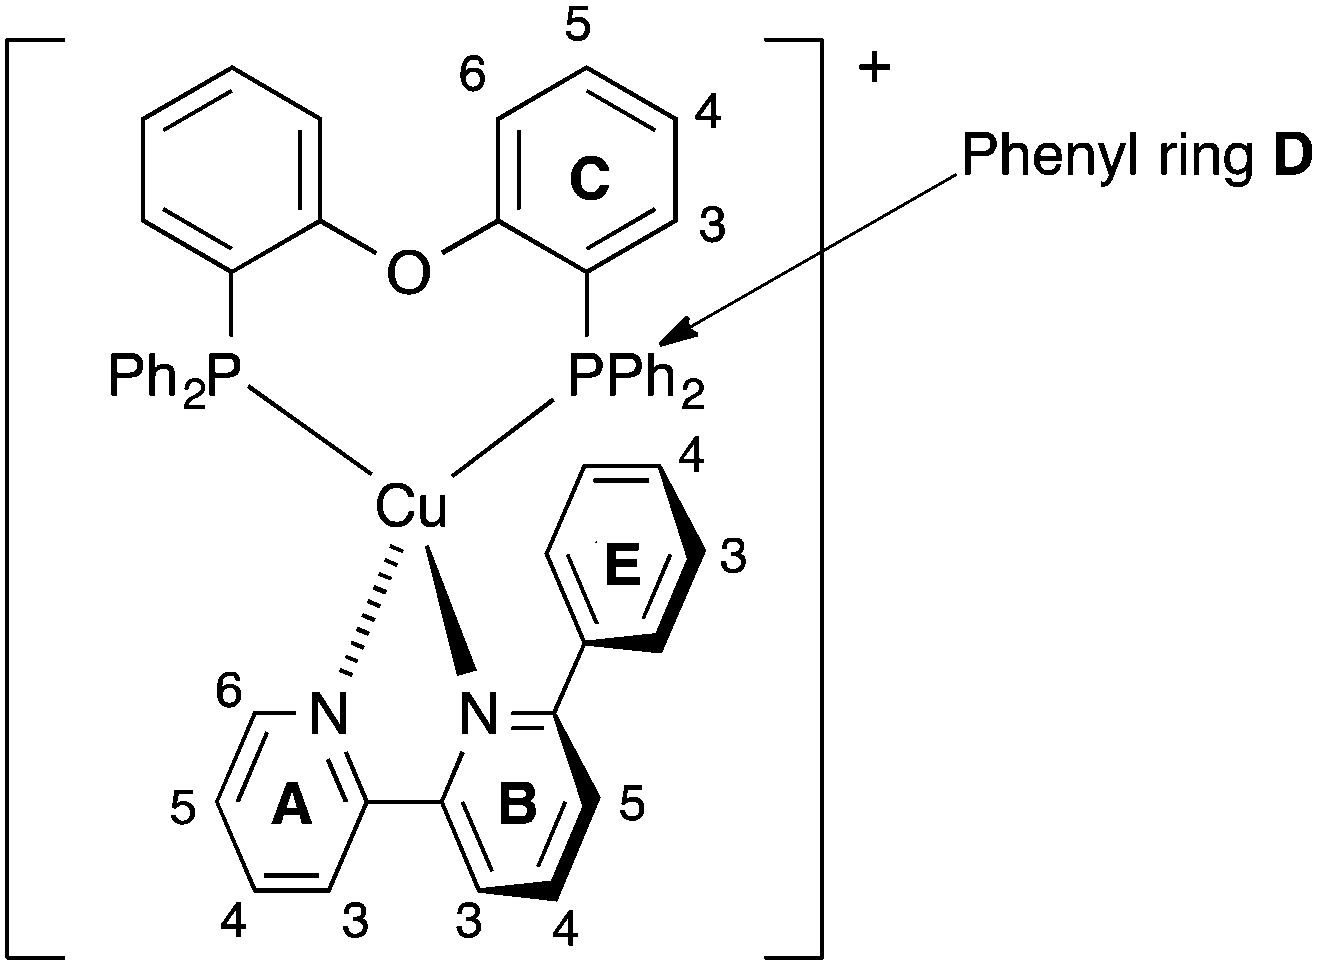 | ||
| Scheme 2 Atom labelling in [Cu(POP)(Phbpy)]+ for NMR spectroscopic assignments. Analogous labelling is used for all [Cu(P^P)(N^N)]+ complexes. | ||
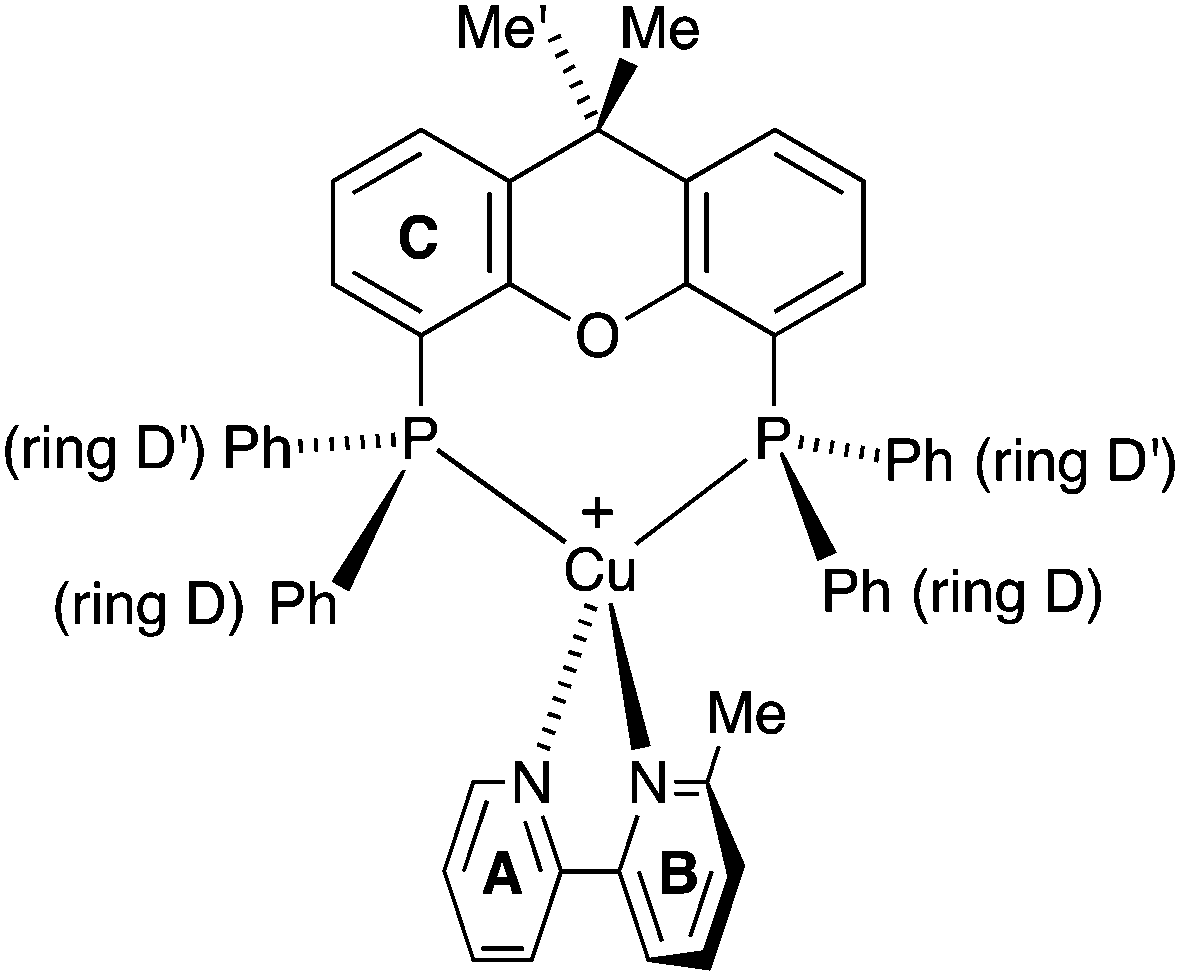 | ||
| Scheme 3 Structure of [Cu(xantphos)(Mebpy)]+ showing inequivalence of phenyl rings in each PPh2 unit, and inequivalence of the methyl groups in the xantphos ligand. | ||
The room temperature solution 1H and 13C NMR spectra of [Cu(POP)(Phbpy)][PF6] were assigned by 2D methods and are consistent with the inequivalence of the two pyridine rings in the N^N ligand and the inequivalence of the two phenyl rings in each PPh2 unit (Fig. S5a, ESI†). A change from POP to xantphos leads to the expected shift in the signal for HC5 (see above) and the loss of the signal for HC6 (Fig. S5, ESI†). Most notably, no signal for HA6 is observed at 295 K in the 1D 1H NMR spectrum of [Cu(xantphos)(Phbpy)][PF6], although an HMBC cross peak between CA6 and HA4 is visible; signals for phenyl protons HE3 and HE4 are broad (Fig. S5b, ESI†). The doublet for HE2 (Fig. S5b, ESI†) was assigned on the basis of NOESY cross peaks to HB5 and to HD2; the latter is consistent with the phenyl substituent of the N^N domain being close to phenyl D rings of the PPh2 units (see structural discussion).
The room temperature NMR spectroscopic signature of [Cu(xantphos)(Phbpy)][PF6] prompted a variable temperature study. On cooling, all signals collapse and split, leading to two sets of signals at 205 K (Fig. S6, ESI† and Fig. 1a) which are assigned to two conformers. The signals in Fig. 1a were assigned using COSY and HMQC spectra recorded at 205 K, and the EXSY spectrum (at 205 K, Fig. 1b) was consistent with the assignments. NOESY cross peaks between HB5 and HE2 were used to confirm the bpy-to-phenyl connections in each conformer. Signal integrals at 205 K indicate that the populations of the two conformers are similar (ratio ∼1.0:0.8). The greatest difference in chemical shifts for analogous protons in the two conformers is observed for bpy HA6, and pendant phenyl HE3 and HE4 (Fig. 1b). The disparate values of δ 8.42 and 6.35 ppm, respectively, for HA6 in the two conformers are especially noteworthy. The 31P{1H} NMR spectra are also consistent with the presence of two conformers. At 295 K, the 31P{1H} NMR spectrum shows a broad signal at δ −12.8 ppm (in addition to a septet for [PF6]−), and at 205 K, two singlets at δ −11.2 and −14.4 ppm with relative integrals of ∼1.0:0.9 are observed. The cross peaks in a 31P–1H HMBC spectrum (Fig. S7, ESI†) at 205 K are consistent with the assignments of the HD3, HC3 and HC4 protons shown in Fig. 1a. Samples kept in CD2Cl2 solution were prone to ligand dissociation,32 and a 31P{1H} NMR signal at δ –18.1 ppm was assigned to free xantphos.
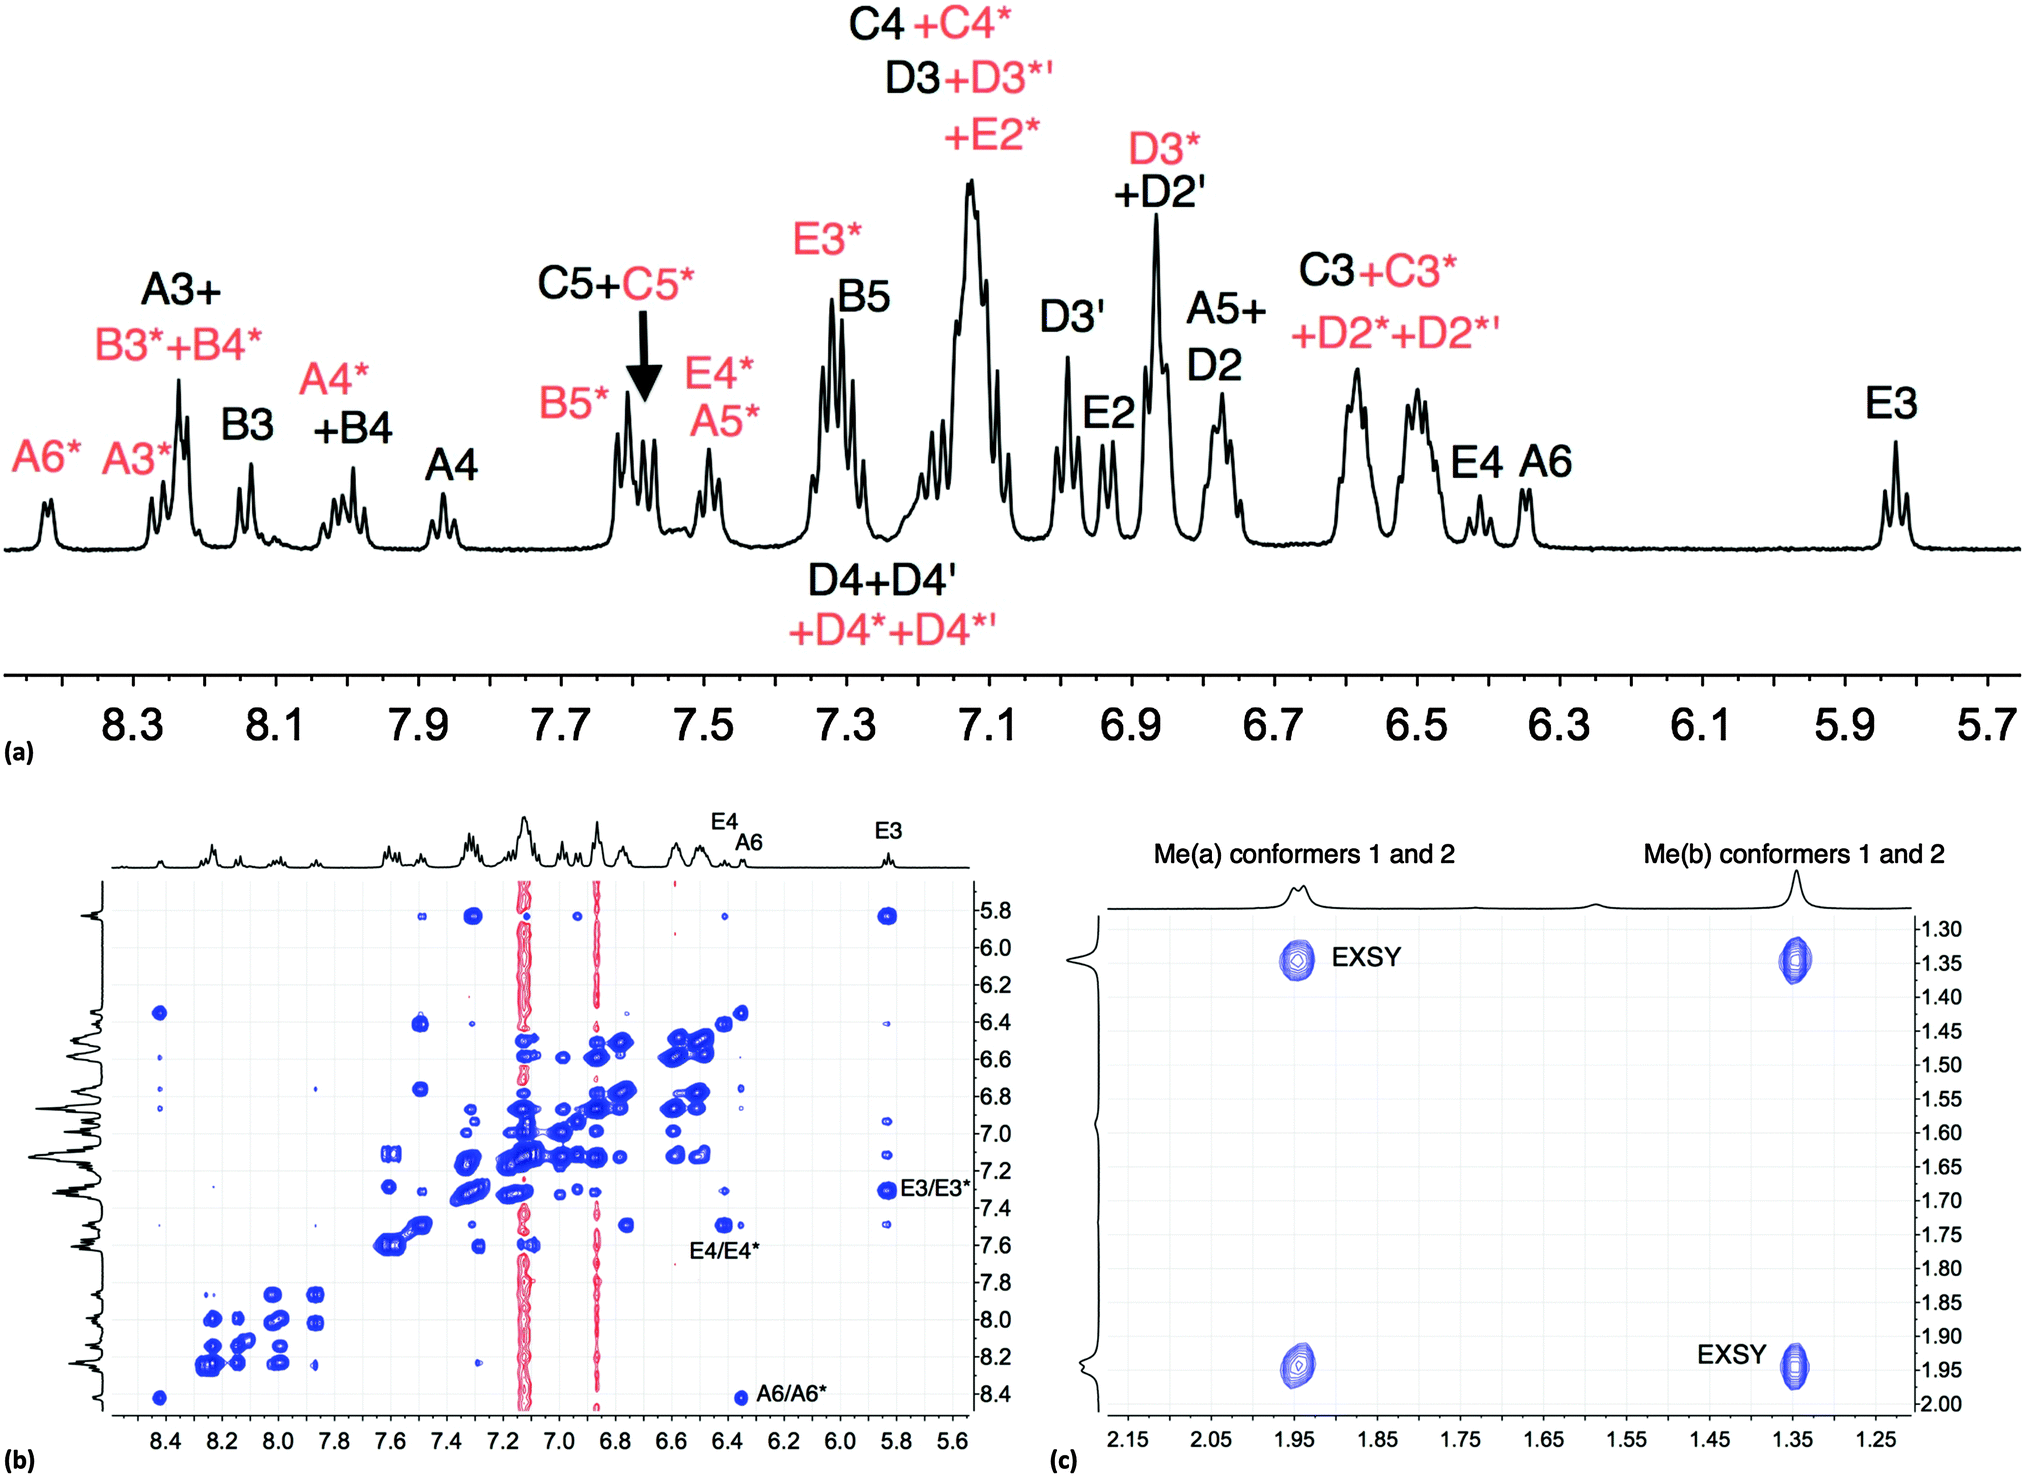 | ||
| Fig. 1 (a) Aromatic region of the 500 MHz 1H NMR spectrum of [Cu(xantphos)(Phbpy)][PF6] (CD2Cl2) at 205 K; signals marked with (red) and without (black) an asterisk arise from two different conformers. (b) Aromatic region of the EXSY spectrum at 205 K; exchange peaks are the most intense cross peaks; weaker cross peaks are NOESY signals. (c) Methyl region in the EXSY spectrum at 205 K; see Scheme 4. | ||
One possible explanation for the presence of two conformers of [Cu(xantphos)(Phbpy)]+ is different orientations of the asymmetric N^N ligand with respect to xantphos, as we shall later consider for solid-state structures. However, a 180° rotation of the bpy unit would involve dissociation of a Cu–N bond, as discussed for the interconversion of rotational isomers of [Cu(Mepypm)(POP)]+ and [Cu(Mepypm)(dppp)]+ (Mepypm = 4-methyl-2-(2′-pyridyl)pyrimidine, dppp = 1,3-bis(diphenylphosphino)propane)56 and for the interconversion of enantiomers of [Cu(N^N′)2]+ complexes in which N^N′ is an asymmetrical chelate.57 The most important clue as to the origin of the conformer interconversion comes from the behaviour of the signals for the xantphos CMe2 group on going from room temperature to 205 K, and the exchange peaks in the low temperature EXSY spectrum that support a change in conformation through inversion of the bowl-like conformation of the xantphos unit.58 Signals for the two xantphos methyl groups appear at δ 1.80 and 1.61 ppm (relative integrals 1:1) at 298 K; on cooling, these collapse and then give rise to three signals at δ 1.95, 1.94 and 1.34 ppm at 205 K (relative integrals 1:1:2). The EXSY peaks shown in Fig. 1c confirm exchange of the outer and inner pointing methyl groups which can only occur if the xanthene unit inverts as shown in Scheme 4.
 | ||
| Scheme 4 Proposed conformers of [Cu(xantphos)(Phbpy)]+ observed at 205 K in CD2Cl2 solution, and interconversion pathway through inversion of the xanthene unit. See also Fig. 2. | ||
The structures of the two conformers of the [Cu(xantphos)(Phbpy)]+ cation depicted in Scheme 4 were optimized using B3LYP-D3/(6-31G**+LANL2DZ) calculations. The xanthene units of the two structures adopt boat conformations (folded up along the O–Csp3 axis) as is typical for xantphos.59 Overlays of the geometry-optimized structures are shown in Fig. 2 and Fig. S8 (ESI†), and confirm that protons HA6 experience very different environments in the two conformers. Whereas in the blue conformer in Fig. 2, proton HA6 is directed to the cavity of the xantphos unit and is mainly interacting with the π-system of the benzene rings, in the purple conformer it lies only 2.35 Å away from the oxygen atom. The calculated energies of the conformers differ by 3.57 kcal mol−1, with the structure shown in blue in Fig. 2 being the more stable.
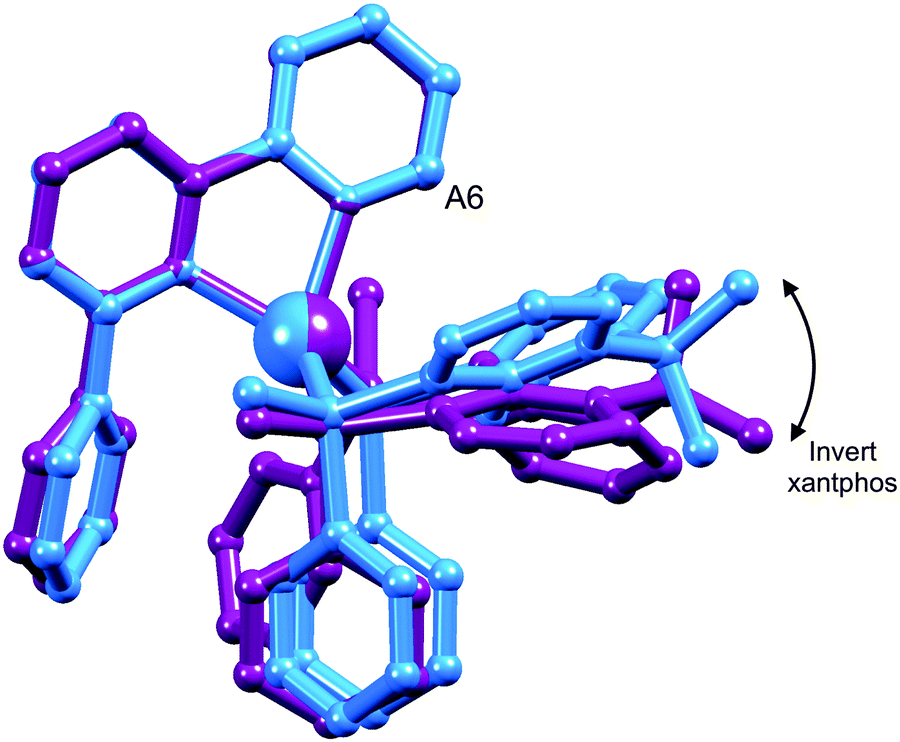 | ||
| Fig. 2 Overlay of the DFT geometry-optimized structures of two conformers of [Cu(xantphos)(Phbpy)]+ which are related by inversion of the xanthene unit (right side of figure); for clarity, H atoms are omitted and only the ipso-C atoms of PPh2 phenyl rings in front and behind the Cu atoms are shown. The Cu atoms and pairs of corresponding N atoms were overlaid. The position of the bpy HA6 protons is marked as “A6”. | ||
Structural characterizations
X-ray quality crystals of [Cu(POP)(Phbpy)][PF6]·Et2O, [Cu(xantphos)(Mebpy)][PF6]·CH2Cl2·0.4Et2O, [Cu(xantphos)(Me2bpy)][PF6], [Cu(POP)(Etbpy)][PF6]·Et2O, [Cu(xantphos)(Etbpy)][PF6]·CH2Cl2·1.5H2O and [Cu(xantphos)(Phbpy)][PF6] were grown from CH2Cl2 solutions of the complexes by diffusion of Et2O. With the exception of [Cu(xantphos)(Phbpy)][PF6] (monoclinic space group P21/n), the complexes crystallize in the triclinic space group P. ORTEP diagrams of the cations in the complexes are shown in Fig. S9–S14 (ESI†), and selected bond parameters are given in the captions to these figures. In each complex cation, atom Cu1 is in a distorted tetrahedral environment with each N^N and P^P ligand in a chelating mode. The Cu–P and Cu–N bond distances are unexceptional; Cu–P and Cu–N bond lengths lie in the ranges 2.2489(9)–2.2672(11) and 2.042(3)–2.108(2) Å, respectively. Of more significance is the angular distortion at the copper centre caused by the different combinations of N^N and P^P ligands. As expected, the N–Cu–N chelate angle varies little (78.65(6) to 80.97(12)°) and this range encompasses corresponding angles of 80.39(4)° in [Cu(POP)(Mebpy)][PF6]16 and 80.2(2)° in [Cu(POP)(Me2bpy)][PF6].16 In each structure containing xantphos, the conformation of the xanthene unit is the same, providing a ‘bowl’ to accommodate one end of the N^N ligand. Significantly, this conformation corresponds to the more stable one discussed above in the solution study (blue conformer in Fig. 2). The ground state structures of all the complexes were additionally optimized using DFT calculations and a selection of theoretical bond distances and angles are listed in the captions of Fig. S9–S14 (ESI†). As discussed below, the calculated geometries satisfactorily reproduce the X-ray structures, slightly overestimating the Cu–P and Cu–N bond distances.
The structures containing the asymmetrical 6-alkyl substituted bpy ligands have the N^N ligand positioned with the 6-methyl or 6-ethyl group lying over the xanthene ‘bowl’ of xantphos or the (C6H4)2O unit of POP. The structures of the [Cu(POP)(Phbpy)]+ and [Cu(xantphos)(Phbpy)]+ cations differ in having the N^N domain rotated ∼180° with respect to its orientation in [Cu(xantphos)(Mebpy)]+, [Cu(POP)(Etbpy)]+ and [Cu(xantphos)(Etbpy)]+.
Fig. 3a–c show the [Cu(xantphos)(Mebpy)]+ cation. The bpy domain is close to planar (the angle between the planes of the pyridine rings is 2.1°) and is close to being orthogonal (Fig. 3b) to the plane through the P–Cu–P unit (angle subtended between units = 87.4°). Fig. 3a and b illustrate the intra-cation π-stacking interaction involving two phenyl rings of different PPh2 units; the centroid⋯plane separation of 3.7 Å, the centroid⋯centroid distance of 3.8 Å, and a 5.5° angle between the planes of the rings make this an efficient interaction. The boat-conformation adopted by the heterocyclic ring in the xantphos ligand is as expected,59 and the xanthene ‘bowl’ neatly hosts the methyl group of the Mebpy ligand (Fig. 3c); the CHmethyl⋯centroidarene distances of 3.0 and 3.1 Å are at the extremity of the typical range for CH⋯arene interactions.60 The structure of the [Cu(xantphos)(Etbpy)]+ cation is similar to that of [Cu(xantphos)(Mebpy)]+. The bpy unit is approximately planar (angle between the pyridine rings = 1.9°) and the least squares plane through the bpy subtends an angle of 88.2° with the P–Cu–P plane. A face-to-face π-interaction between phenyl rings of two different PPh2 units (analogous to that shown in Fig. 3b) occurs and is characterized by parameters of the inter-ring angle = 4.7°, centroid⋯plane distance = 3.74 Å, and centroid⋯centroid separation = 3.80 Å. A comparison of Fig. 3c and d illustrates the similar accommodations of the 6-methyl and 6-ethyl groups in each xanthene ‘bowl’.
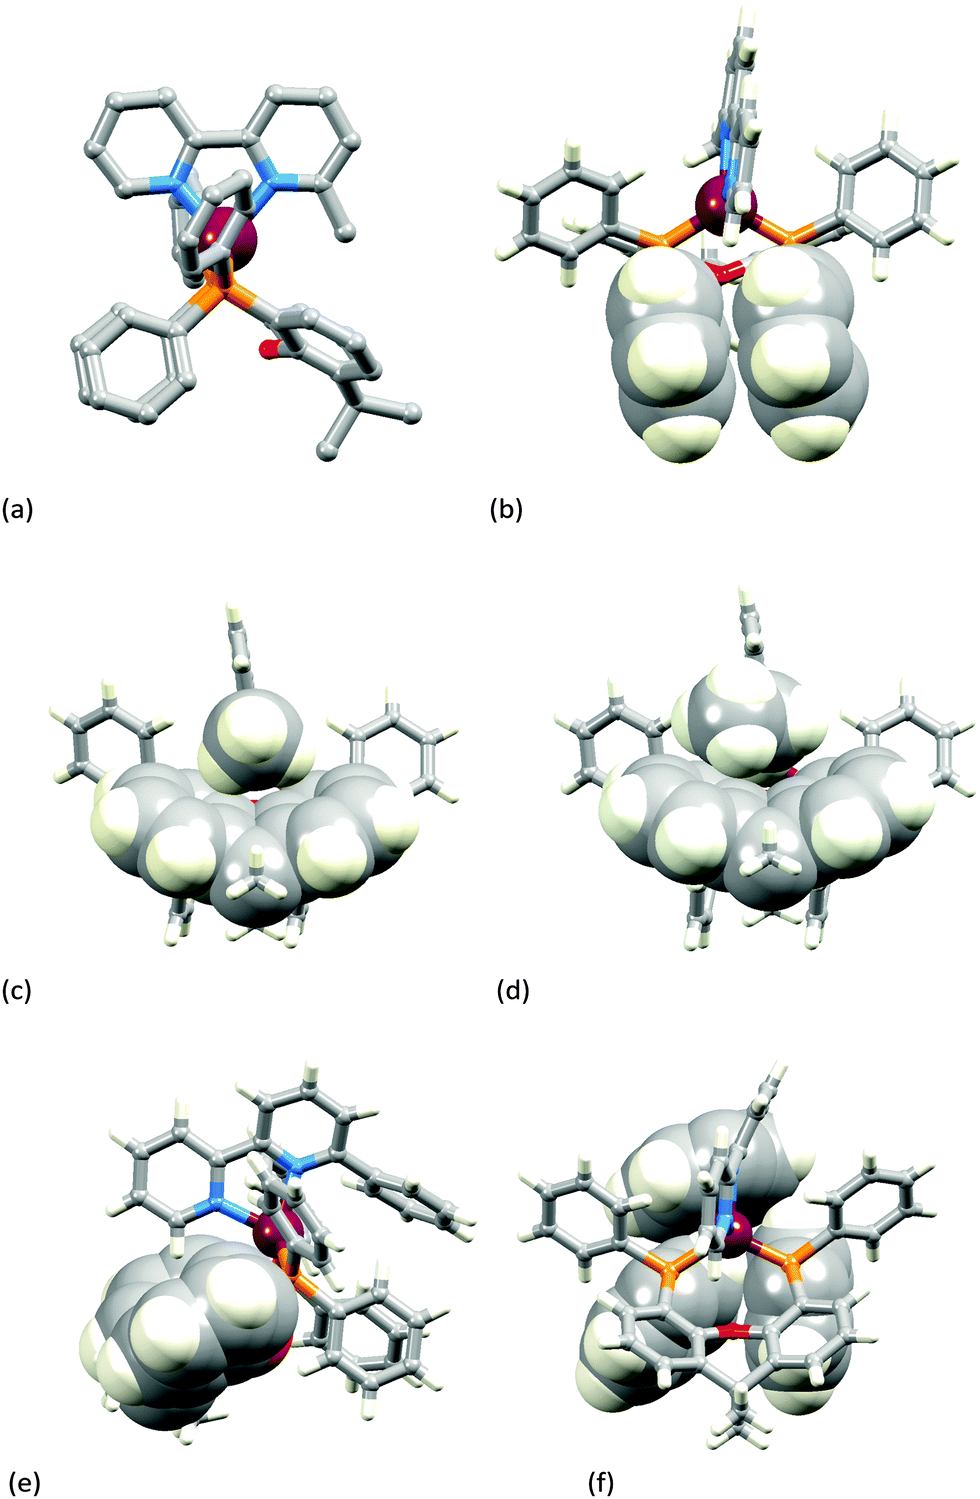 | ||
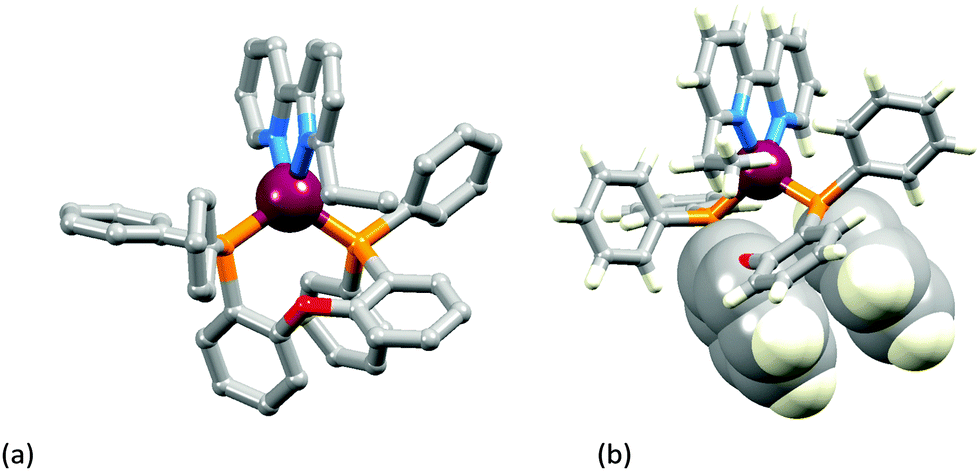
| Fig. 3 (a–c) The structure of the [Cu(xantphos)(Mebpy)]+ cation: (a) view along the P–P vector of the xantphos ligand (H atoms omitted for clarity); (b) face-to-face π-stacking of phenyl rings in the two different PPh2 units; (c) accommodation of the methyl group of Mebpy in the xantphos ‘bowl’. (d) A view of the [Cu(xantphos)(Etbpy)]+ cation for comparison with the analogous view of [Cu(xantphos)(Mebpy)]+ shown in (c). (e and f) The structure of the [Cu(xantphos)(Phbpy)]+ cation with space-filling representations emphasizing (e) the xanthene ‘bowl’ with the unsubstituted pyridine ring lying above it, and (f) the phenyl group of Phbpy oriented over two Ph rings of the PPh2 units. | ||
In the [Cu(xantphos)(Phbpy)]+ cation (Fig. 3e and f), the unsubstituted pyridine ring sits approximately orthogonally over the xanthene ‘bowl’ and the 6-phenyl substituent lies over two phenyl rings of the PPh2 units of the xantphos ligand. The bpy unit is noticeably twisted (angle between rings = 24.0°), and the phenyl ring is twisted by 47.6° with respect to the pyridine ring to which it is bonded. There are no efficient face-to-face or edge-to-face π-contacts between phenyl rings within the cation.
Theoretical results for [Cu(xantphos)(Mebpy)]+, [Cu(xantphos)(Etbpy)]+ and [Cu(xantphos)(Phbpy)]+ reproduce the main features of the X-ray structures. For instance, the face-to-face π–π interactions between phenyl rings of the two different PPh2 groups in [Cu(xantphos)(Mebpy)]+ and [Cu(xantphos)(Etbpy)]+ are predicted with centroid⋯centroid separations of 3.83 and 3.88 Å, respectively, in good accord with the X-ray value (3.80 Å in both cases). Conformers having the N^N domain rotated ∼180° with respect to the orientations in Fig. 3 were also calculated for [Cu(xantphos)(Mebpy)]+ and [Cu(xantphos)(Etbpy)]+ and are predicted to be 0.25 and 0.54 kcal mol−1 less stable, respectively. For [Cu(xantphos)(Phbpy)]+, the two conformers differ only by 0.49 kcal mol−1. The energetically favoured structure has, in the three complexes, the 6-substituent facing the xanthene ‘bowl’ in accord with that observed in the crystal for [Cu(xantphos)(Mebpy)]+ and [Cu(xantphos)(Etbpy)]+ and in contrast to the conformer observed experimentally for [Cu(xantphos)(Phbpy)]+. Given the small energy difference between conformers, this result is unsurprising, since packing forces in the crystal are not accounted for in the calculations.
The introduction of the second 6-methyl substituent in the bpy unit on going from [Cu(xantphos)(Mebpy)]+ to [Cu(xantphos)(Me2bpy)]+ results in a small twist in the bpy skeleton; the angle between the planes of the pyridine rings increases from 2.1 to 8.0°. A comparison of Fig. 3a and 4a shows that the major structural change is the loss of the intra-cation phenyl⋯phenyl π-stacking interaction because of a near 90° twist of one phenyl ring (Fig. 3a to 4a, bottom left). However, this loss is offset by the evolution of a π-stacking contact involving these twisted phenyl rings between a centrosymmetric pair of cations (Fig. 4b). The interaction is characterized by a ring-plane separation of 3.52 Å and an inter-centroid distance of 3.81 Å. It is not possible to conclude if the change from intra- to inter-cation π-stacking interactions is a consequence of the change in the N^N ligand since we compare solvated [Cu(xantphos)(Mebpy)][PF6]·CH2Cl2·0.4Et2O with solvent-free [Cu(xantphos)(Me2bpy)][PF6].
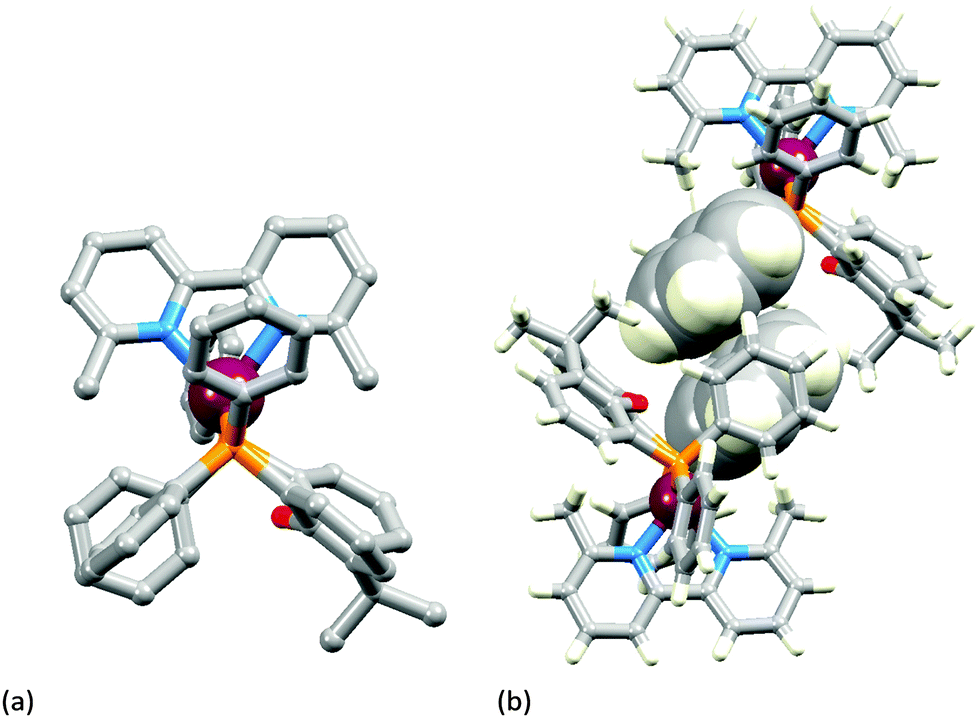 | ||
| Fig. 4 The structure of the [Cu(xantphos)(Me2bpy)]+ cation in [Cu(xantphos)(Me2bpy)][PF6]: (a) view along the P–P vector of the xantphos ligand (H atoms omitted for clarity); (b) face-to-face π-stacking of PPh2 phenyl rings between adjacent cations. | ||
Calculations, which are performed on the isolated complex and include no inter-cation effects, predict an intra-cation π-stacking interaction between phenyl rings of two different PPh2 groups similar to that obtained for [Cu(xantphos)(Mebpy)]+ (Fig. 3b). However, they clearly show that the interaction between the phenyl rings is weaker for [Cu(xantphos)(Me2bpy)]+ than for [Cu(xantphos)(Mebpy)]+ since the centroid⋯centroid separation and the inter-ring angle are calculated to be 0.20 Å longer and 13° larger, respectively, for the former. These results suggest that the interconversion from the parallel disposition of the phenyl rings observed experimentally in [Cu(xantphos)(Mebpy)]+ (Fig. 3a and b) to the perpendicular disposition found for [Cu(xantphos)(Me2bpy)]+ (Fig. 4a) takes place more easily for the latter and is due to packing forces.
The two [Cu(POP)(N^N)][PF6] complexes in which N^N is Etbpy or Phbpy are shown in Fig. 5a and 6a, respectively. The bpy unit is twisted in both structures, the angle between the ring-planes increasing from 7.2° in [Cu(POP)(Etbpy)]+ to 19.9° in [Cu(POP)(Phbpy)]+. The latter is associated with a C–H⋯π interaction (see below). The intra-cation π-stacking interaction in the [Cu(POP)(Etbpy)]+ cation (Fig. 5b) differs from that in [Cu(xantphos)(Mebpy)]+ (Fig. 3b), and involves one phenyl ring from one PPh2 unit and one of the rings of the diphenyl ether domain. The interaction is analogous to that observed in [Cu(POP)(Mebpy)][PF6] and [Cu(POP)(Me2bpy)][PF6],16 and is similarly weak (angle between the ring planes = 13.8°, and ring centroid⋯centroid = 3.73 Å). A related face-to-face π-interaction occurs in [Cu(POP)(Phbpy)]+ but is extended to incorporate an edge-to-face C–H⋯π interaction involving the pendant phenyl unit of the Phbpy ligand (Fig. 6b). The face-to-face π-contact is non-optimal with an angle between the ring planes = 22.0°, and the centroid⋯centroid distance = 3.8 Å; for the edge-to-face interaction, the C–H⋯centroid separation is 2.9 Å.60
 | ||
| Fig. 5 Structure of the [Cu(POP)(Etbpy)]+ cation in [Cu(POP)(Etbpy)][PF6]·Et2O: (a) view of the cation (H atoms omitted for clarity); (b) intra-cation face-to-face π-stacking interaction. | ||
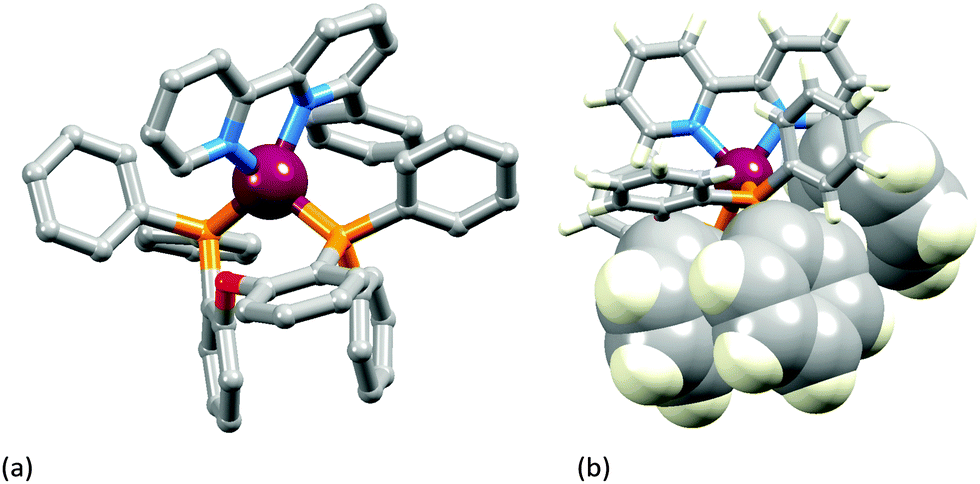 | ||
| Fig. 6 Structure of the [Cu(POP)(Phbpy)]+ cation in [Cu(POP)(Phbpy)][PF6]·Et2O: (a) view of the cation (H atoms omitted for clarity); (b) intra-cation face-to-face and accompanying edge-to-face π-stacking interaction. | ||
Calculations on [Cu(POP)(Etbpy)]+ and [Cu(POP)(Phbpy)]+ result in optimal structures close to those observed experimentally and reproduce the face-to-face π-stacking interaction (centroid⋯centroid distance = 3.66 Å for [Cu(POP)(Etbpy)]+ and 3.67 Å for [Cu(POP)(Phbpy)]+, C–H⋯centroid separation = 2.98 Å for the edge-to-face interaction of [Cu(POP)(Phbpy)]+). For these complexes, a second conformer with the N^N ligand rotated ∼180° with respect to the first one (Fig. S15, ESI†) is calculated to be higher in energy by 4.30 and 5.61 kcal mol−1 for [Cu(POP)(Etbpy)]+ and [Cu(POP)(Phbpy)]+, respectively. Note that the energy difference between conformers with different N^N orientations for POP-containing complexes is appreciably higher than for pairs of complexes containing xantphos.
Photophysical properties
The solution absorption spectra of the [Cu(P^P)(N^N)][PF6] complexes are shown in Fig. 7. The intense, high energy bands arise from ligand-based π → π* and n → π* transitions. Lower intensity metal-to-ligand charge transfer (MLCT) bands have similar values of λmax (378 to 388 nm) for the six complexes. To confirm this assignment, the lower-lying singlet excited states (Sn) of all complexes were computed using the TD-DFT approach. Intense electronic transitions are predicted below 300 nm corresponding to Sn states with mainly ligand-centred (LC) character and some MLCT contribution, both involving the xantphos or POP ligands and the bpy moiety. A lower intensity band of MLCT nature is found in the 405–415 nm range, slightly overestimating the experimental values.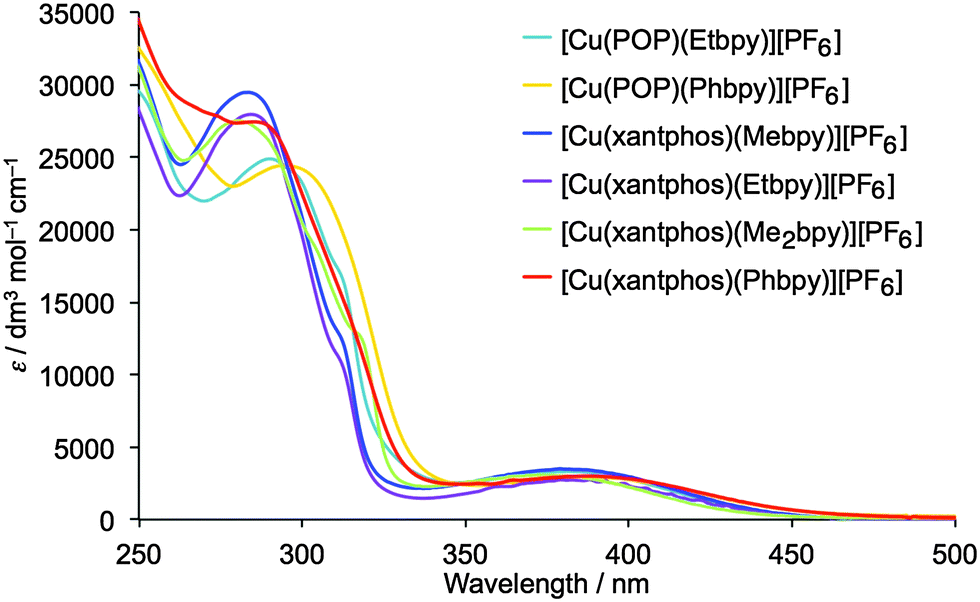 | ||
| Fig. 7 Solution absorption spectra of the [Cu(P^P)(N^N)][PF6] complexes (CH2Cl2, 2.5 × 10⁻⁵ mol dm−3). | ||
Dichloromethane solutions of the [Cu(P^P)(N^N)][PF6] complexes are all weak yellow emitters when excited at 379–400 nm (Table 1), and exhibit broad, slightly structured emission bands (Fig. S16, ESI†). The characteristics of the emission spectra and the low PLQYs are consistent with those observed for [Cu(POP)(Mebpy)][PF6] (CH2Cl2 solution, λmaxem = 639, 610 nm, PLQY = 0.1%).16 Reduction of the amount of dissolved O2 by applying an argon gas flow through the solution for 20 min has little effect except in the case of [Cu(xantphos)(Me2bpy)][PF6] for which the quantum yield increases from 1.6% to 10%. Powder samples of the complexes exhibit enhanced emission behaviour.61,62 The data in Table 1 reveal that [Cu(P^P)(N^N)][PF6] complexes containing N^N ligands with 6-alkyl substituents exhibit higher PLQY values and longer emission lifetimes than those with 6-phenyl substituents. The emission bands for the powders are broad and unstructured (Fig. 8), and are blue-shifted with respect to the solution emissions, but the solids remain yellow emitters. Similar blue-shifts from solution to powder are observed for [Cu(POP)(Mebpy)]+,16 [Cu(POP)(Me2bpy)]+,16 [Cu(POP)(pypz)]+,27 and [Cu(POP)(3-Mepypz)]+27 (pypz = 2-pyridylpyrazole, 3-Mepypz = 3-methyl-2-pyridylpyrazole). The range of values of λmaxem = 539–576 nm for the complexes in Table 1 is similar to those observed for a family of [Cu(POP)(tpy)][PF6] complexes (tpy = 2,2′:2′,6′′-terpyridine or a 4′-derivative of tpy).63 Photoluminescence characterization in thin film was also carried out for all the copper(I) complexes mixed with the ionic liquid (IL) 1-ethyl-3-methylimidazolium hexafluoridophosphate ([Emim][PF6]). The emission bands are red-shifted with respect to the photoluminescence in the powder, but show similar unstructured bands (Fig. S17, ESI†), which have maxima between 555 and 599 nm (Table 1). The thin films show moderate photoluminescence emission and, as for powder samples, changing the 6-substituent in the bpy unit has a significant effect on the PLQY. Once again, incorporation of Phbpy leads to lower PLQYs than alkyl-substituted N^N ligands. The surrounding environment therefore has a strong influence on the emitting properties of the copper(I) complexes and both the intensity and the emission wavelength change with environment (Table 1). A possible explanation for this behaviour has previously been suggested on the basis of the flattening that the pseudo-tetragonal geometry of the complexes experience in passing from the electronic ground state (S0) to the emitting excited state.64 This flattening, which is more favoured in a fluid medium, is partially hindered in thin film and is minimized in a crystalline state (powder), reduces the energy gap and increases the deactivation pathways of emission. A detailed discussion of the structural changes that take place in passing from S0 to the emitting states is given below on the basis of theoretical calculations.
| Complex cation | CH2Cl2 solutiona | Powderb | Thin filmb | ||||||
|---|---|---|---|---|---|---|---|---|---|
| λ exc/nm | λ maxem/nm | PLQY (non-degassed/degassed)/% | τ 1/2 (non-degassed/degassed)/μs | λ maxem/nm | PLQY/% | τ 1/2/μs | λ maxem/nm | PLQY/% | |
| a Solution concentration = 2.5 × 10⁻⁵ mol dm−3. b λ exc = 365 nm. | |||||||||
| [Cu(POP)(Etbpy)]+ | 390 | 635, 611 | 0.6/1.1 | 0.19/0.33 | 557 | 24 | 7.2 | 578 | 8.4 |
| [Cu(POP)(Phbpy)]+ | 400 | 643, 620 | 0.7/0.7 | 0.10/0.15 | 576 | 5.2 | 4.0 | 599 | 4.8 |
| [Cu(xantphos)(Mebpy)]+ | 379 | 635, 605 | 1.0/1.8 | 0.27/0.78 | 547 | 34 | 9.6 | 574 | 9.7 |
| [Cu(xantphos)(Etbpy)]+ | 390 | 635, 603 | 0.8/1.9 | 0.28/0.83 | 545 | 37 | 11 | 571 | 9.2 |
| [Cu(xantphos)(Me2bpy)]+ | 379 | 635, 606 | 1.6/10 | 0.45/3.4 | 539 | 37 | 11 | 555 | 21.8 |
| [Cu(xantphos)(Phbpy)]+ | 390 | 644, 620 | 0.6/0.7 | 0.14/0.22 | 563 | 3.7 | 5.8 | 592 | 3.5 |
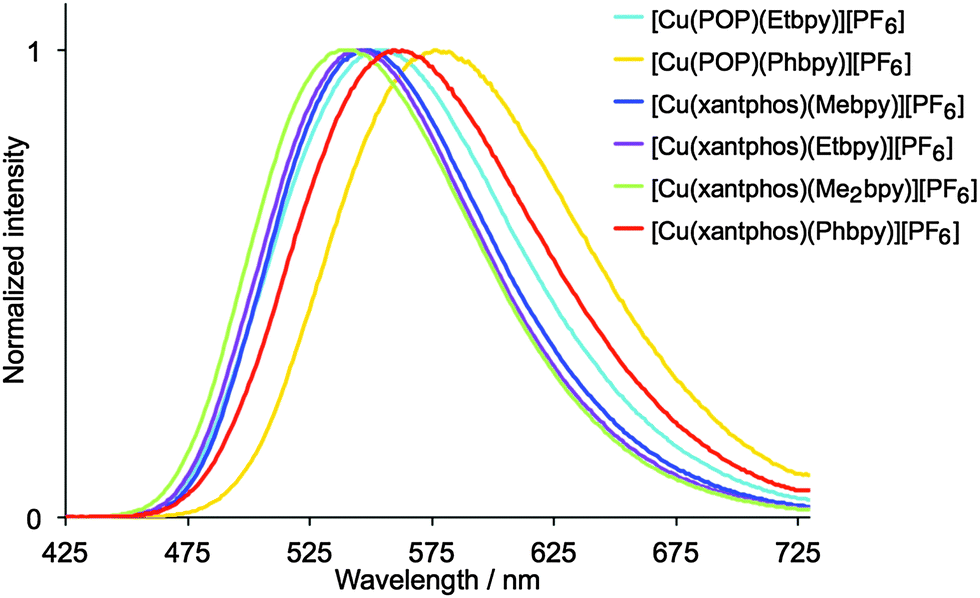 | ||
| Fig. 8 Normalized emission spectra of solid [Cu(P^P)(N^N)][PF6]. For λexc, see Table 1. | ||
The excited state lifetimes of the powder samples range from 4 to 11 μs which is within the expected range for [Cu(P^P)(N^N)]+ complexes.16,61,62 Solution lifetime measurements in CH2Cl2 yield values between 0.10 μs for [Cu(POP)(Phbpy)][PF6] and 0.45 μs for [Cu(xantphos)(Me2bpy)][PF6], but increase up to 0.15 and 3.4 μs for the respective complexes upon degassing by a 20 min argon gas flow through the solution.
To gain insight into the photophysical properties of these systems, the geometry of the first triplet excited state (T1) was fully relaxed at the UB3LYP-D3 level (a selection of bond distances and bond angles is given in the captions of Fig. S9–S14, ESI†). The geometries predicted for T1 present significant changes compared with those obtained for the ground state: a lengthening of the Cu–P bonds distances, a shortening of the Cu–N bond distances, and a flattening of the tetrahedral structure are observed in all cases. For instance, for the [Cu(xantphos)(Me2bpy)]+ cation (Fig. S10, ESI†), the Cu–P bonds lengthen from 2.33 Å in S0 to 2.42 and 2.38 Å in T1, the Cu–N bonds shorten from ∼2.15 Å to 2.07 and 1.97 Å and, at the same time, the P–Cu–N angles that present near tetrahedral values in S0 (from 112 to 118°) become severely distorted from the tetrahedral arrangement in T1 (from 94 to 142°). These changes suggest that in passing from S0 to T1 a redistribution of the electronic density takes place mainly involving the Cu–P^P environment and the bpy domain.
Fig. 9a shows the unpaired electron spin-density distribution calculated for the T1 state of [Cu(xantphos)(Etbpy)]+ and [Cu(POP)(Etbpy)]+ as representative examples. Similar spin-density distributions are obtained for the rest of the complexes. The spin density is mostly located over the metal and the bpy ligand, which suggests a 3MLCT nature for T1 in good agreement with the experimentally observed broad and unstructured emission bands. The spin-density distribution and the electronic nature of the T1 triplet originate from the HOMO → LUMO (HOMO = highest occupied molecular orbital; LUMO = lowest unoccupied molecular orbital) monoelectronic excitation, which represents the main contribution to the T1 excited state. As shown in Fig. 9b for [Cu(xantphos)(Etbpy)]+ and [Cu(POP)(Etbpy)]+, the HOMO is mainly located on the metal with some contribution from the phosphorus atoms, whereas the LUMO resides completely on the bpy ligand. The HOMO → LUMO excitation therefore indicates an electron transfer from the Cu–P^P environment to the N^N ligand. The topology of the frontier orbitals is the same for all the six complexes studied and their energies remain mainly constant along the series with HOMO–LUMO gaps ranging from 3.62 to 3.72 eV. The small differences predicted for the HOMO–LUMO gap explain, in a first approach, the similar values recorded for λmaxem in solution.
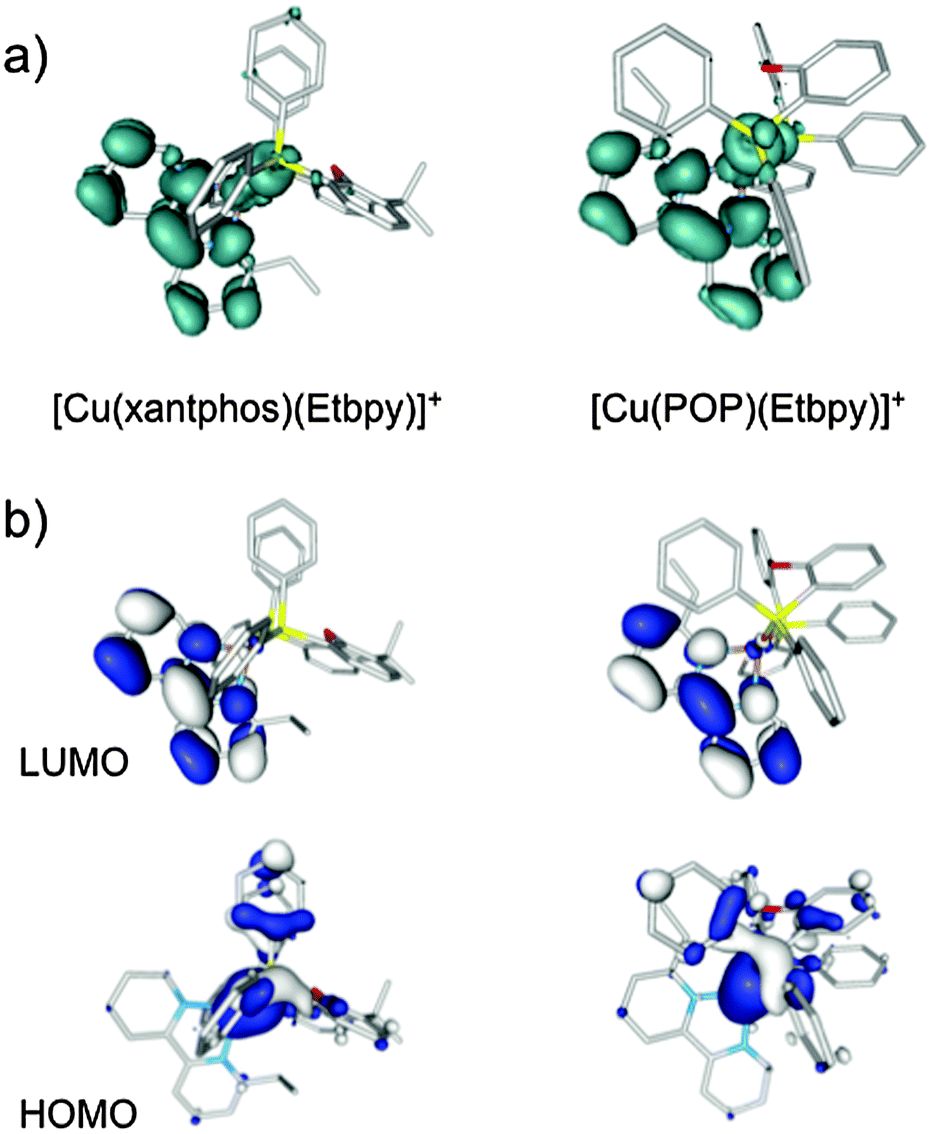 | ||
| Fig. 9 (a) Unpaired-electron spin-density distribution calculated for the fully-relaxed first triplet excited state of [Cu(xantphos)(Etbpy)]+ and [Cu(POP)(Etbpy)]+ (contours: 0.002 a.u.). (b) Isovalue contours (±0.03 a.u.) calculated for the HOMO and LUMO of [Cu(xantphos)(Etbpy)]+ and [Cu(POP)(Etbpy)]+. Hydrogen atoms are omitted for clarity. | ||
As an additional way to confirm the nature of the emitting state, TD-DFT calculations of the lower-lying triplets were performed at the equilibrium geometry of S0 for all the systems. The TD-DFT results are very similar for all the complexes, featuring a first triplet excited state at 2.80–2.88 eV of 3MLCT nature mostly described by the HOMO → LUMO excitation (contribution ranging from 87 to 92%). This state is around 0.3 eV more stable than the next calculated triplet, which is mainly of LC nature centred on the bpy ligand. TD-DFT calculations therefore support the LUMO → HOMO 3MLCT character of the triplet emitting state.
The emission energy was theoretically estimated using the fully-relaxed geometry of T1 as described in the Experimental section. Relaxation of T1 has a strong effect on the calculated emission energies, ranging from 1.65 to 1.96 eV (751 to 632 nm), which strongly differ from the vertical excitation energies (2.80–2.88 eV). As discussed above, this geometry relaxation explains the blue shift observed for the emission in passing from solution, in which relaxation takes place in a larger extent and emission occurs at lower energies, to thin film and to powder, in which relaxation is more restricted due to the rigid environment (Table 1). The calculated emission energies underestimate the experimental values (Table 1), but correctly reproduce the trend observed in Fig. 8, as the value calculated for the emission wavelength increases along the series [Cu(xantphos)(Me2bpy)]+, [Cu(xantphos)(Etbpy)]+, [Cu(xantphos)(Mebpy)]+, [Cu(POP)(Etbpy)]+, [Cu(xantphos)(Phbpy)]+ and [Cu(POP)(Phbpy)]+. The only difference found for the latter two complexes bearing 6-phenyl substituents in the bpy ligand is that they present the smallest energy difference between T1 and S0 (1.65 eV). This facilitates the nonradiative decay from T1 and could explain the lower PLQY measured for these complexes in comparison with those bearing 6-alkyl substituents.
Finally, the energy difference between the first singlet (S1) and triplet (T1) excited states is calculated in the range 0.17–0.21 eV for all the complexes. This energy difference is significantly lower than the 0.37 eV (3000 cm−1) proposed by Leitl et al.65 to allow the population of S1 from T1 at room temperature and, therefore, contribution from S1 to the emission cannot be excluded.
Electroluminescent devices
In order to evaluate the electroluminescence (EL) properties for all six complexes, LEC devices were prepared using a two-layer architecture, which consisted on a PEDOT:PSS layer and the [Cu(P^P)(N^N)][PF6] complex mixed with the ionic liquid (IL) [Emim][PF6]. [Emim][PF6] was selected as the IL in order to enhance the LEC response due to its higher ionic mobility compared with other commonly used ILs such as 1-butyl-3-methylimidazolium hexafluoridophosphate [Bmim][PF6].66 The ratio of iTMC:IL also has a large effect on the turn-on-time and lifetime of the LECs. Previously,16 for [Cu(POP)(Me2bpy)][PF6] and [Cu(POP)(Mebpy)][PF6], an iTMC:IL ratio of 1:1 was used. Therefore, LECs with the copper(I) complexes described in this manuscript were initially prepared keeping an iTMC:IL ratio of 1:1. The devices were operated under a pulsed current driving (average current density 50 A m−2, 1 kHz, 50% duty cycle and block wave), which has been demonstrated to provide better lifetimes and device performances67 than the constant current (DC) driving method.
The LECs prepared showed the typical behaviour of LEC operation under this driving, where the luminance rises whereas the voltage drops due to the decrease of the resistance during the p- and n-doped regions growing in the active layer.68,69 However, the majority of the LECs prepared with an iTMC:IL ratio of 1:1 showed a fast decrease in luminance accompanied by an increase of the operating voltage (Fig. S18, ESI†). This implies that permanent degradation occurs. For LECs using the same complexes but with a lower amount of ionic liquid (iTMC:IL ratio of 4:1), the increase in voltage was not observed and the luminance decay was slower. For this reason, the new complexes were evaluated in LECs using a 4:1 iTMC:IL composition. The device performances for the LECs are summarized in Table 2 and depicted in Fig. 10.
:PSS/iTMC:[Emim][PF6] 4:1 molar ratio/Al measured using a pulsed current driving (average current density 50 A m−2, 1 kHz, 50% duty cycle, block wave)
| iTMC | t on /min | Lum0b/cd m−2 | Lummaxc/cd m−2 | t 1/2 /h | EQEmaxe/% | PCEmaxf/lm W−1 | Efficacymax/cd A−1 | λ maxEL/nm |
|---|---|---|---|---|---|---|---|---|
| a Time to reach the maximum luminance. b Initial luminance. c Maximum luminance reached. d Time to reach one-half of the maximum luminance. e Maximum external quantum efficiency reached. f Maximum power conversion efficiency reached. | ||||||||
| [Cu(POP)(Etbpy)][PF6] | 260 | 25 | 53 | 82 | 0.2 | 0.2 | 0.6 | 582 |
| [Cu(POP)(Phbpy)][PF6] | 156 | 0 | 21 | 36 | 0.1 | 0.1 | 0.4 | 584 |
| [Cu(xantphos)(Mebpy)][PF6] | 102 | 41 | 90 | 15 | 0.7 | 0.6 | 1.9 | 583 |
| [Cu(xantphos)(Etbpy)][PF6] | 42 | 57 | 77 | 51 | 0.7 | 0.5 | 1.7 | 581 |
| [Cu(xantphos)(Me2bpy)][PF6] | 10 | 88 | 145 | 0.8 | 1.0 | 0.8 | 3.0 | 567 |
| [Cu(xantphos)(Phbpy)][PF6] | 2 | 1 | 5 | 0.1 | <0.1 | <0.1 | <0.1 | 586 |
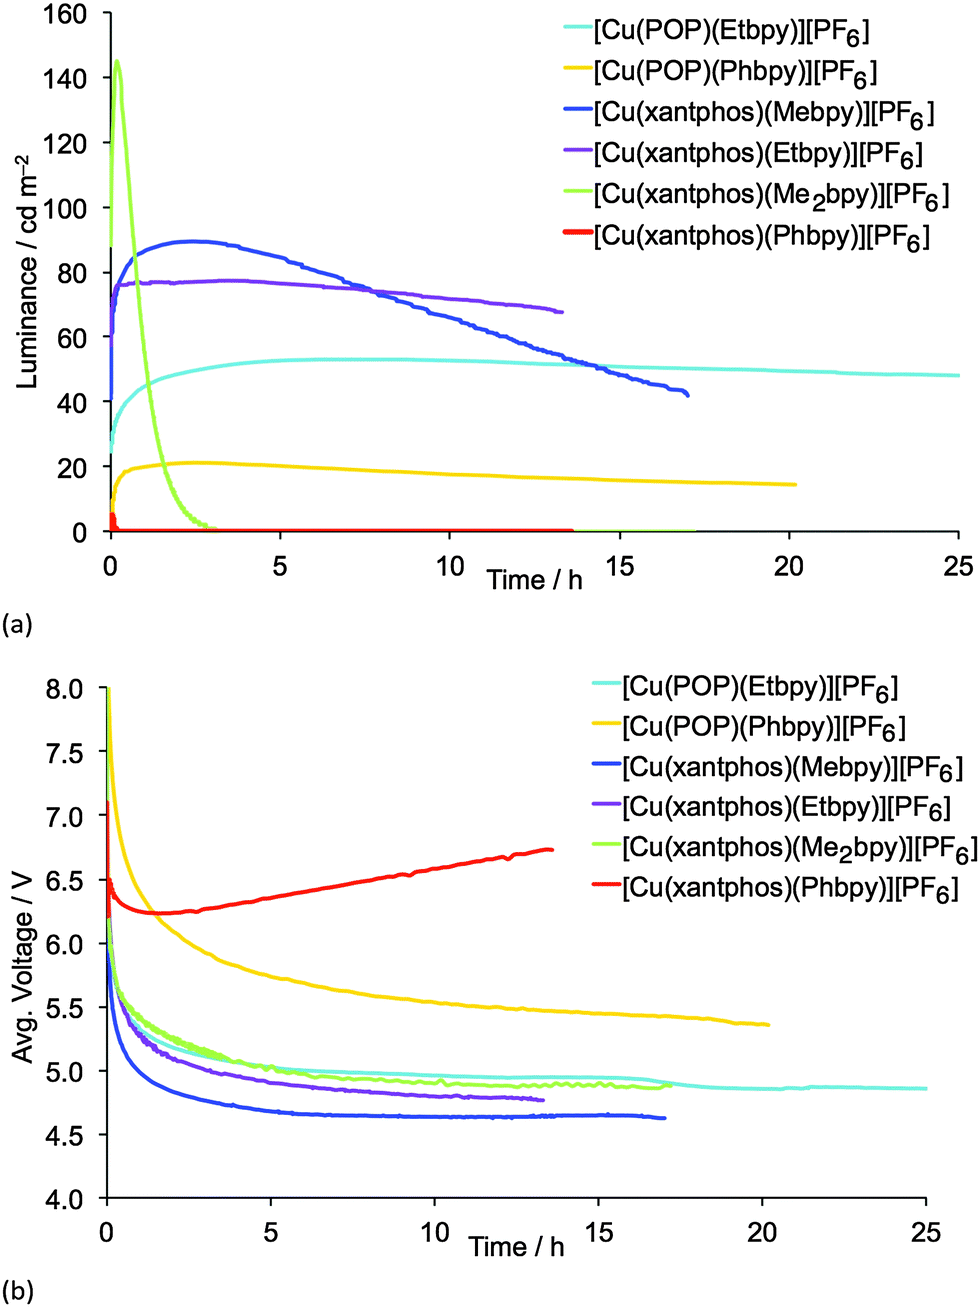 | ||
| Fig. 10 Luminance (a) and average voltage (b) for ITO/PEDOT:PSS/[Cu(P^P)(N^N)][PF6]:[Emim][PF6] 4:1 molar ratio/Al LECs measured using a pulsed current driving (average current density 50 A m−2, 1 kHz, 50% duty cycle, block wave). [Emim][PF6] = 1-ethyl-3-methylimidazolium hexafluoridophosphate. | ||
LECs containing Mebpy, Me2bpy or Etbpy show the best performances but, in accordance with the photophysical data, [Cu(POP)(Phbpy)][PF6] and [Cu(xantphos)(Phbpy)][PF6] exhibit poor electroluminescence emission properties. This behaviour was expected due to the low PLQY for both complexes. Moreover, the steady-state voltage for these devices was higher than for the LECs containing the other four complexes. This indicates that substitution with a phenyl ring in the 6-position of bpy leads to injection or conductivity issues in the LEC operation. LECs with the complexes containing Mebpy, Me2bpy or Etbpy ligands show good luminances (>20 cd m−2) and lower steady-state average voltages (<5 V). As the initial luminance is high (as much as 45% of the maximum luminance obtained), the turn-on of luminance has to be considered fast, yet in some devices it takes several minutes or hours to reach the maximum luminance, which is defined in Table 2 as the turn-on time (ton). On one hand, the luminances, as well as the maximum efficiencies reached, correlate well with the PLQYs for each complex, and the LEC with [Cu(xantphos)(Me2bpy)][PF6] is noteworthy in achieving a maximum efficacy of 3.0 cd A−1 at a luminance of 145 cd m−2. A lower performance was reached for the LEC based on [Cu(xantphos)(Mebpy)][PF6], which showed an efficacy of 1.9 cd A−1 at a luminance of 90 cd m−2. However, whereas the lifetime of the [Cu(xantphos)(Mebpy)][PF6]-based LEC exceeds 15 hours, that of the LEC containing [Cu(xantphos)(Me2bpy)][PF6] is significantly shorter (1 hour). A similar trend in luminance, efficiency and lifetime was previously reported for LECs based on [Cu(POP)(Me2bpy)][PF6] and [Cu(POP)(Mebpy)][PF6].16 This indicates that the disubstitution pattern leads to the better device efficiency, although at a cost in lifetime.
The LECs based on the ethyl-substituted complexes [Cu(POP)(Etbpy)][PF6] and [Cu(xantphos)(Etbpy)][PF6] have a similar efficiency compared with the devices containing the monomethyl-substituted bpy. [Cu(POP)(Etbpy)][PF6] achieves an efficiency of 0.6 cd A−1 and [Cu(xantphos)(Etbpy)][PF6] reaches 1.7 cd A−1; both are comparable with the efficiencies of LECs containing [Cu(POP)(Mebpy)][PF6] (0.6 cd A−1)16 and [Cu(xantphos)(Mebpy)][PF6] (1.9 cd A−1). However, a strong improvement in the device stability was found on going from methyl to ethyl substituents. The lifetimes of LECs based on [Cu(xantphos)(Etbpy)][PF6] and [Cu(POP)(Etbpy)][PF6] were longer than 40 hours, reaching >80 hours for the [Cu(POP)(Etbpy)][PF6]-based LEC (Fig. S19, ESI†). This is a considerable improvement with respect to the previously reported lifetimes in LECs based on copper.15,16,18
Finally, the electroluminescence (EL) spectra were recorded during the device operation (Fig. S20, ESI†). The LEC emission was similar for all the complexes (580–586 nm), except for [Cu(xantphos)(Me2bpy)][PF6], for which the EL emission maximum was blue-shifted (567 nm) with respect to the other complexes. In their solution, thin-film and solid-state PL spectra (Fig. S16 and S17, ESI† and Fig. 8), [Cu(xantphos)(Me2bpy)][PF6] is the most blue-shifted of the complexes.
Conclusions
We have described the synthesis and characterization of a series of [Cu(POP)(N^N)][PF6] and [Cu(xantphos)(N^N)][PF6] complexes with N^N = Mebpy, Etbpy, Phbpy or Me2bpy. In these distorted tetrahedral copper(I) complexes, the asymmetrical N^N ligands can be oriented so that the 6-substituent lies over either two PPh2 units of the P^P ligand, or the O(C6H4)2 unit of the xanthene ‘bowl’ of the P^P domain. Both conformers are represented among the crystallographically determined structures of the complexes. For the xantphos-containing complexes, the energy difference between conformers is very small (0.25–0.54 kcal mol−1). In solution, VT-NMR spectroscopic data for [Cu(xantphos)(Phbpy)][PF6] in CD2Cl2 evidence the presence of two conformers which are related by inversion of the xanthene ‘bowl’. In the solid-state, the conformation of the xanthene unit is constant and provides a ‘bowl’ to accommodate one end of the N^N ligand.The [Cu(P^P)(N^N)][PF6] complexes exhibit MLCT absorption bands in the range 378 to 388 nm, and are yellow emitters when excited into the MLCT band. The PLQYs increase from solution to thin-film or powder samples, and the introduction of 6-methyl or 6-ethyl substituents leads to the highest PLQYs (34–37% in the solid state). Theoretical calculations predict that the emitting triplet (T1) originates in the HOMO → LUMO excitation, which implies an electron transfer from the Cu–P^P environment to the N^N ligand. T1 therefore shows a 3MLCT character and is calculated to be ∼0.20 eV lower in energy than the first singlet excited state (S1).
The complexes were tested in LEC configuration devices which exhibit rapid turn-on times. The LEC using [Cu(xantphos)(Me2bpy)][PF6] as the electroluminescent material achieves a maximum efficacy of 3.0 cd A−1 (luminance = 145 cd m−2) with a lifetime of 1 h; on going to the [Cu(xantphos)(Mebpy)][PF6]-containing LEC, a lifetime >15 h is achieved but this is at the expense of the efficacy (1.9 cd A−1). Long-lived LECs are realized with [Cu(xantphos)(Etbpy)][PF6] and [Cu(POP)(Etbpy)][PF6] in the active layer (t1/2 > 40 and 80 h, respectively) without a considerable loss in efficiency with respect to [Cu(P^P)(Mebpy)][PF6].
Acknowledgements
We thank the Swiss National Science Foundation (Grant number 200020_144500), the European Research Council (Advanced Grant 267816 LiLo) and the University of Basel for financial support. This work has also been supported by the European Community's Seventh Framework Programme (LUMINET Grant 316906), the Spanish Ministry of Economy and Competitiveness (MINECO) (MAT2014-55200, CTQ2012-31914, CTQ2015-71154 and MDM-2015-0552), European Feder funds (CTQ2012-31914) and the Generalitat Valenciana (Prometeo/2012/053). PD Dr Daniel Häussinger, Dr Roché Walliser, Thomas Müntener and Yann Baumgartner are thanked for help with low temperature NMR spectroscopic measurements.Notes and references
- R. D. Costa, E. Ortí, H. J. Bolink, F. Monti, G. Accorsi and N. Armaroli, Angew. Chem., Int. Ed., 2012, 51, 8178 CrossRef CAS PubMed.
- D. Volz, M. Wallesch, C. Fléchon, M. Danz, A. Verma, J. M. Navarro, D. M. Zink, S. Bräse and T. Baumann, Green Chem., 2015, 17, 1988 RSC.
- Q. Pei, G. Yu, C. Zhang, Y. Yang and A. J. Heeger, Science, 1995, 269, 1086 CrossRef CAS PubMed.
- A. Sandström and L. Edman, Energy Technol., 2015, 3, 329 CrossRef.
- Y. Zhang and J. Gao, J. Appl. Phys., 2006, 100, 084501 CrossRef.
- N. Kaihovirta, C. Larsen and L. Edman, ACS Appl. Mater. Interfaces, 2014, 6, 2940 CAS.
- S. Tang, W.-Y. Tan, X.-H. Zhu and L. Edman, Chem. Commun., 2013, 49, 4926 RSC.
- M. D. Weber, M. Adam, R. R. Tykwinski and R. D. Costa, Adv. Funct. Mater., 2015, 25, 5066 CrossRef.
- M. Y. Wong, G. J. Hedley, G. Xie, L. S. Kolln, I. D. W. Samuel, A. Pertegás, H. J. Bolink and E. Zysman-Colman, Chem. Mater., 2015, 27, 6535 CrossRef CAS.
- J. D. Slinker, A. A. Gorodetsky, M. S. Lowry, J. Wang, S. Parker, R. Rohl, S. Bernhard and G. G. Malliaras, J. Am. Chem. Soc., 2004, 126, 2763 CrossRef CAS PubMed.
- J.-K. Lee, D. S. Yoo, E. S. Handy and M. F. Rubner, Appl. Phys. Lett., 1996, 69, 1686 CrossRef CAS.
- F. G. Gao and A. J. Bard, J. Am. Chem. Soc., 2000, 122, 7426 CrossRef CAS.
- T. Hu, L. He, L. Duan and Y. Qiu, J. Mater. Chem., 2012, 22, 4206 RSC.
- See for example: C. E. Housecroft and E. C. Constable, Chem. Soc. Rev., 2015, 44, 8386 RSC.
- R. D. Costa, D. Tordera, E. Ortí, H. J. Bolink, J. Schönle, S. Graber, C. E. Housecroft, E. C. Constable and J. A. Zampese, J. Mater. Chem., 2011, 21, 16108 RSC.
- S. Keller, E. C. Constable, C. E. Housecroft, M. Neuburger, A. Prescimone, G. Longo, A. Pertegás, M. Sessolo and H. J. Bolink, Dalton Trans., 2014, 43, 16593 RSC.
- A. Kaeser, O. Moudam, G. Accorsi, I. Séguy, J. Navarro, A. Belbakra, C. Duhayon, N. Armaroli, B. Delavaux-Nicot and J.-F. Nierengarten, Eur. J. Inorg. Chem., 2014, 1345 CrossRef CAS.
- C. Bizzarri, C. Strabler, J. Prock, B. Trettenbrein, M. Ruggenthaler, C.-H. Yang, F. Polo, A. Iordache, P. Brüggeller and L. De Cola, Inorg. Chem., 2014, 53, 10944 CrossRef CAS PubMed.
- D. Volz, M. Wallesch, S. L. Grage, J. Göttlicher, R. Steininger, D. Batchelor, T. Vitova, A. S. Ulrich, C. Heske, L. Weinhardt, T. Baumann and S. Bräse, Inorg. Chem., 2014, 53, 7837 CrossRef CAS PubMed.
- J.-J. Cid, J. Mohanraj, M. Mohankumar, M. Holler, F. Monti, G. Accorsi, L. Karmazin-Brelot, I. Nierengarten, J. M. Malicka, M. Cocchi, B. Delavaux-Nicot, N. Armaroli and J.-F. Nierengarten, Polyhedron, 2014, 82, 158 CrossRef CAS.
- K. Chen, J. Shearer and V. J. Catalano, Inorg. Chem., 2015, 54, 6245 CrossRef CAS PubMed.
- N. Armaroli, G. Accorsi, M. Holler, O. Moudam, J. F. Nierengarten, Z. Zhou, R. T. Wegh and R. Welter, Adv. Mater., 2006, 18, 1313 CrossRef CAS.
- R. Czerwieniec and H. Yersin, Inorg. Chem., 2015, 54, 4322 CrossRef CAS PubMed.
- K. Zhang and D. Zhang, Spectrochim. Acta, Part A, 2014, 124, 341 CrossRef CAS PubMed.
- L. Bergmann, J. Friedrichs, M. Mydlak, T. Baumann, M. Nieger and S. Bräse, Chem. Commun., 2013, 49, 6501 RSC.
- E. Mejía, S.-P. Luo, M. Karnahl, A. Friedrich, S. Tschierlei, A.-E. Surkus, H. Junge, S. Gladiali, S. Lochbrunner and M. Beller, Chem. – Eur. J., 2013, 19, 15972 CrossRef PubMed.
- X.-L. Chen, R. Yu, Q.-K. Zhang, L.-J. Zhou, X.-Y. Wu, Q. Zhang and C.-Z. Lu, Chem. Mater., 2013, 25, 3910 CrossRef CAS.
- A. Kaeser, M. Mohankumar, J. Mohanraj, F. Monti, M. Holler, J.-J. Cid, O. Moudam, I. Nierengarten, L. Karmazin-Brelot, C. Duhayon, B. Delavaux-Nicot, N. Armaroli and J.-F. Nierengarten, Inorg. Chem., 2013, 52, 12140 CrossRef CAS PubMed.
- C. Femoni, S. Muzzioli, A. Palazzi, S. Stagni, S. Zacchini, F. Monti, G. Accorsi, M. Bolognesi, N. Armaroli, M. Massi, G. Valenti and M. Marcaccio, Dalton Trans., 2013, 42, 997 RSC.
- I. Andrés-Tomé, J. Fyson, F. Baiao Dias, A. P. Monkman, G. Iacobellis and P. Coppo, Dalton Trans., 2012, 41, 8669 RSC.
- C. L. Linfoot, M. J. Leitl, P. Richardson, A. F. Rausch, O. Chepelin, F. J. White, H. Yersin and N. Robertson, Inorg. Chem., 2014, 53, 10854 CrossRef CAS PubMed.
- S.-M. Kuang, D. G. Cuttell, D. R. McMillin, P. E. Fanwick and R. A. Walton, Inorg. Chem., 2002, 41, 3313 CrossRef CAS PubMed.
- D. G. Cuttell, S.-M. Kuang, P. E. Fanwick, D. R. McMillin and R. A. Walton, J. Am. Chem. Soc., 2002, 124, 6 CrossRef CAS PubMed.
- M. Shaul and Y. Cohen, J. Org. Chem., 1999, 64, 9358 CrossRef CAS.
- P. J. Pijper, H. van der Goot, H. Timmernam and W. Th. Nauta, Eur. J. Med. Chem., 1984, 19, 399 CAS.
- E. C. Constable, R. P. G. Henney, T. A. Leese and D. A. Tocher, J. Chem. Soc., Dalton Trans., 1990, 443 RSC.
- G. J. Kubas, Inorg. Synth., 1979, 19, 90 CrossRef CAS.
- Bruker Analytical X-ray Systems, Inc., 2006, APEX2, version 2 User Manual, M86-E01078, Madison, WI.
- P. W. Betteridge, J. R. Carruthers, R. I. Cooper, K. Prout and D. J. Watkin, J. Appl. Crystallogr., 2003, 36, 1487 CrossRef CAS.
- I. J. Bruno, J. C. Cole, P. R. Edgington, M. K. Kessler, C. F. Macrae, P. McCabe, J. Pearson and R. Taylor, Acta Crystallogr., Sect. B: Struct. Sci., 2002, 58, 389 CrossRef.
- C. F. Macrae, I. J. Bruno, J. A. Chisholm, P. R. Edgington, P. McCabe, E. Pidcock, L. Rodriguez-Monge, R. Taylor, J. van de Streek and P. A. Wood, J. Appl. Crystallogr., 2008, 41, 466 CrossRef CAS.
- M. J. Frisch, G. W. Trucks, H. B. Schlegel, G. E. Scuseria, M. A. Robb, J. R. Cheeseman, G. Scalmani, V. Barone, B. Mennucci, G. A. Petersson, H. Nakatsuji, M. Caricato, X. Li, H. P. Hratchian, A. F. Izmaylov, J. Bloino, G. Zheng, J. L. Sonnenberg, M. Hada, M. Ehara, K. Toyota, R. Fukuda, J. Hasegawa, M. Ishida, T. Nakajima, Y. Honda, O. Kitao, H. Nakai, T. Vreven, J. A. Montgomery, Jr, J. E. Peralta, F. Ogliaro, M. Bearpark, J. J. Heyd, E. Brothers, K. N. Kudin, V. N. Staroverov, R. Kobayashi, J. Normand, K. Raghavachari, A. Rendell, J. C. Burant, S. S. Iyengar, J. Tomasi, M. Cossi, N. Rega, N. J. Millam, M. Klene, J. E. Knox, J. B. Cross, V. Bakken, C. Adamo, J. Jaramillo, R. Gomperts, R. E. Stratmann, O. Yazyev, A. J. Austin, R. Cammi, C. Pomelli, J. W. Ochterski, R. L. Martin, K. Morokuma, V. G. Zakrzewski, G. A. Voth, P. Salvador, J. J. Dannenberg, S. Dapprich, A. D. Daniels, O. Farkas, J. B. Foresman, J. V. Ortiz, J. Cioslowski and D. J. Fox, Gaussian 09, Revision D.01, Gaussian, Inc., Wallingford, CT, 2009 Search PubMed.
- C. Lee, W. Yang and R. G. Parr, Phys. Rev. B: Condens. Matter Mater. Phys., 1988, 37, 785 CrossRef CAS.
- A. D. Becke, J. Chem. Phys., 1993, 98, 5648 CrossRef CAS.
- M. M. Francl, W. J. Pietro, W. J. Hehre, J. S. Binkley, M. S. Gordon, D. J. DeFrees and J. A. Pople, J. Chem. Phys., 1982, 77, 3654 CrossRef CAS.
- P. J. Hay and W. R. Wadt, J. Chem. Phys., 1985, 82, 299 CrossRef CAS.
- S. Grimme, J. Antony, S. Ehrlich and H. Krieg, J. Chem. Phys., 2010, 132, 154104 CrossRef PubMed.
- S. Grimme, S. Ehrlich and L. Goerigk, J. Comput. Chem., 2011, 32, 1456 CrossRef CAS PubMed.
- J. Tomasi and M. Persico, Chem. Rev., 1994, 94, 2027 CrossRef CAS.
- C. S. Cramer and D. G. Truhlar, Solvent Effects and Chemical Reactivity, Kluwer, 1996, pp. 1–80 Search PubMed.
- J. Tomasi, B. Mennucci and R. Cammi, Chem. Rev., 2005, 105, 2999 CrossRef CAS PubMed.
- M. E. Casida, C. Jamorski, K. C. Casida and D. R. Salahub, J. Chem. Phys., 1998, 108, 4439 CrossRef CAS.
- C. Jamorski, M. E. Casida and D. R. Salahub, J. Chem. Phys., 1996, 104, 5134 CrossRef CAS.
- M. Petersilka, U. J. Gossmann and E. K. U. Gross, Phys. Rev. Lett., 1996, 76, 1212 CrossRef CAS PubMed.
- See for example: N. Armaroli, G. Accorsi, G. Bergamini, P. Ceroni, M. Holler, O. Moudam, C. Duhayon, B. Delavaux-Nicot and J.-F. Nierengarten, Inorg. Chim. Acta, 2007, 360, 1032 CrossRef CAS; K. Saito, T. Arai, N. Takahashi, T. Tsukuda and T. Tsubomura, Dalton Trans., 2006, 4444 RSC.
- M. Nishikawa, K. Nomoto, S. Kume and H. Nishihara, Inorg. Chem., 2013, 52, 369 CrossRef CAS PubMed and references therein.
- V. Desvergnes-Breuil, V. Hebbe, C. Dietrich-Buchecker, J.-P. Sauvage and J. Lacour, Inorg. Chem., 2003, 42, 255 CrossRef CAS PubMed; V. Hebbe-Viton, V. Desvergnes, J. J. Jodry, C. Dietrich-Buchecker, J.-P. Sauvage and J. Lacour, Dalton Trans., 2006, 2058 RSC; I. Pianet and J.-M. Vincent, Inorg. Chem., 2004, 43, 2947 CrossRef PubMed.
- See for example: G. Tárkányi, P. Király, G. Pálinkás and A. Deák, Magn. Reson. Chem., 2007, 45, 917 CrossRef CAS PubMed; A. Pintado-Alba, H. de la Riva, M. Nieuwhuyzen, D. Bautista, P. R. Raithby, H. A. Sparkes, S. J. Teat, J. M. López-de-Luzuriaga and M. C. Lagunas, Dalton Trans., 2004, 3459 RSC.
- S. Keller, F. Brunner, A. Prescimone, E. C. Constable and C. E. Housecroft, Inorg. Chem. Commun., 2015, 58, 64 CrossRef CAS and references cited therein.
- G. R. Desiraju and T. Steiner, The Weak Hydrogen Bond, Oxford University Press, 1999 Search PubMed.
- N. Armaroli, G. Accorsi, F. Cardinali and A. Listorti, Top. Curr. Chem., 2007, 280, 69 CrossRef CAS.
- N. A. Gothard, M. W. Mara, J. Huang, J. M. Szarko, B. Rolczynski, J. V. Lockard and L. X. Chen, J. Phys. Chem. A, 2012, 116, 1984 CrossRef CAS PubMed.
- N. S. Murray, S. Keller, E. C. Constable, C. E. Housecroft, M. Neuburger and A. Prescimone, Dalton Trans., 2015, 44, 7626 RSC.
- H. Yersin, A. F. Rausch, R. Czerwieniec, T. Hofbeck and T. Fischer, Coord. Chem. Rev., 2011, 255, 2622 CrossRef CAS.
- M. J. Leitl, V. A. Krylova, P. I. Djurovich, M. E. Thompson and H. Yersin, J. Am. Chem. Soc., 2014, 136, 16032 CrossRef CAS PubMed.
- R. D. Costa, A. Pertegás, E. Ortí and H. J. Bolink, Chem. Mater., 2010, 22, 1288 CrossRef CAS.
- D. Tordera, S. Meier, M. Lenes, R. D. Costa, E. Ortí, W. Sarfert and H. J. Bolink, Adv. Mater., 2012, 24, 897 CrossRef CAS PubMed.
- M. Lenes, G. Garcia-Belmonte, D. Tordera, A. Pertegás, J. Bisquert and H. J. Bolink, Adv. Funct. Mater., 2011, 21, 1581 CrossRef CAS.
- S. van Reenen, P. Matyba, A. Dzwilewski, R. A. J. Janssen, L. Edman and M. Kemerink, J. Am. Chem. Soc., 2010, 132, 13776 CrossRef CAS PubMed.
Footnote |
| † Electronic supplementary information (ESI) available: Fig. S1–S7: additional NMR spectra; Fig. S8: geometry-optimized structures of conformers of [Cu(xantphos)(Phbpy)]+; Fig. S9–S14: ORTEP structural diagrams; Fig. S15: geometry-optimized structures of conformers of [Cu(POP)(Etbpy)]+ and [Cu(POP)(Phbpy)]+; Fig. S16 and S17: solution and thin-film emission spectra; Fig. S18 and S19: average voltage and lifetime measurements of LECs; Fig. S20: EL spectra of LECs. CCDC 1422372–1422376 and 1435492. For ESI and crystallographic data in CIF or other electronic format see DOI: 10.1039/c5tc03725e |
| This journal is © The Royal Society of Chemistry 2016 |