Copper(II)-infused porphyrin MOF: maximum scavenging GSH for enhanced photodynamic disruption of bacterial biofilm†
Yaoxin
Zhang
a,
Linpei
Li
a,
Hui
Liu
c,
Haixia
Zhang
a,
Menghao
Wei
a,
Junqing
Zhang
ae,
Yanwei
Yang
d,
Mengnan
Wu
f,
Zhaowei
Chen
f,
Chaoqun
Liu
 *ad,
Faming
Wang
*b,
Qiang
Wu
 *a and
Jiahua
Shi
 *e
*e
aSchool of Pharmacy, Henan University, Kaifeng 475004, China. E-mail: cqliu@henu.edu.cn; henuwuqiang@henu.edu.cn
bSchool of Public Health, Nantong Key Laboratory of Public Health and Medical Analysis, Nantong University, Nantong 226019, China. E-mail: wangfaming1990@ntu.edu.cn
cDepartment of Pharmacy, Shangqiu First People's Hospital, Shangqiu 476100, China
dDepartment of Pharmacy, the First Affiliated Hospital of Henan University, Kaifeng 475001, China
eKey Laboratory of Natural Medicine and Immune-Engineering of Henan Province, Henan University, Kaifeng 475004, China. E-mail: sjiahua@henu.edu.cn
fInstitute of Food Safety and Environment Monitoring, College of Chemistry, Fuzhou University, Fuzhou 350108, China
First published on 2nd January 2024
Abstract
Bacterial biofilm infection is a serious obstacle to clinical therapeutics. Photodynamic therapy (PDT) plays a dynamic role in combating biofilm infection by utilizing reactive oxygen species (ROS)-induced bacterial oxidation injury, showing advantages of mild side effects, spatiotemporal controllability and little drug resistance. However, superfluous glutathione (GSH) present in biofilm and bacteria corporately reduces ROS levels and seriously affects PDT efficiency. Herein, we have constructed a Cu2+-infused porphyrin metal–organic framework (MOF@Cu2+) for the enhanced photodynamic combating of biofilm infection by the maximum depletion of GSH. Our results show that the released Cu2+ from porphyrin MOF@Cu2+ could not only oxidize GSH in biofilm but also consume GSH leaked from ROS-destroyed bacteria, thus greatly weakening the antioxidant system in biofilm and bacteria and dramatically improving the ROS levels. As expected, our dual-enhanced PDT nanoplatform exhibits a strong biofilm eradication ability both in vitro and in an in vivo biofilm-infected mouse model. In addition, Cu2+ can promote biofilm-infected wound closing by provoking cell immigration, collagen sediment and angiogenesis. Besides, no apparent toxicity was detected after treatment with MOF@Cu2+. Overall, our design offers a new paradigm for photodynamic combating biofilm infection.
1 Introduction
Bacterial infections have become a major medical and financial problem worldwide, leading to the death of 17 million patients annually.1–4 Clinical statistics have indicated that about 80% of infectious diseases are caused by bacterial biofilm.5–7 In biofilm, bacterial clusters are embedded in an autocrine matrix, named extracellular polymeric substance (EPS), which protects them from harsh external environments, such as the human immune system and antimicrobial agents.8–11 It has been reported that bacterial resistance in biofilm is a thousand times higher toward antibiotics than planktons.12,13 The incapacity to entirely obliterate biofilm usually brings about repeated infection, therapeutic failure, and even death.14 Hence, there is a dire need for a new antimicrobial strategy that can effectively destroy biofilm without developing drug resistance.In recent years, as a non-antibiotic alternative therapeutic for combating bacterial biofilm infection, photodynamic therapy (PDT) has received much more attention because of its particular antimicrobial mechanism without evoking bacterial resistance.15–19 The underlying principle of PDT is the activation of O2 molecules by the irradiation of the photosensitizer (PS) with a laser of an appropriate wavelength, resulting in the production of oxidative reactive oxygen species (ROS) and the subsequent eradication of bacteria and biofilm, showing the advantages of specific space-time selectivity and minimal invasiveness.20–22 ROS is capable of destroying bacterial cell walls, causing the leakage of cell contents and inactivating bacterial enzymes, thus resulting in irreversible bacterial death and biofilm dispersion.23,24 Although promising, excess glutathione (GSH) in biofilm and bacteria plays a vital role in consuming ROS and severely affects PDT efficiency.25 Hence, PDT has to utilize large doses of photosensitizers and high-powered light density, which inevitably induces injury to healthy tissues and causes patients great pain.26 Recently, some strategies have been devoted to reducing biofilm GSH levels for improving PDT efficacy;25,27 however, there are still concerns over how to consume GSH that leaked from ROS-destroyed bacteria, which also play an important role in decreasing PDT efficacy.28 Consequently, there is a great need to develop a new strategy to efficiently eliminate GSH from both the biofilm and destroyed bacteria for maximum enhancement of PDT efficacy.
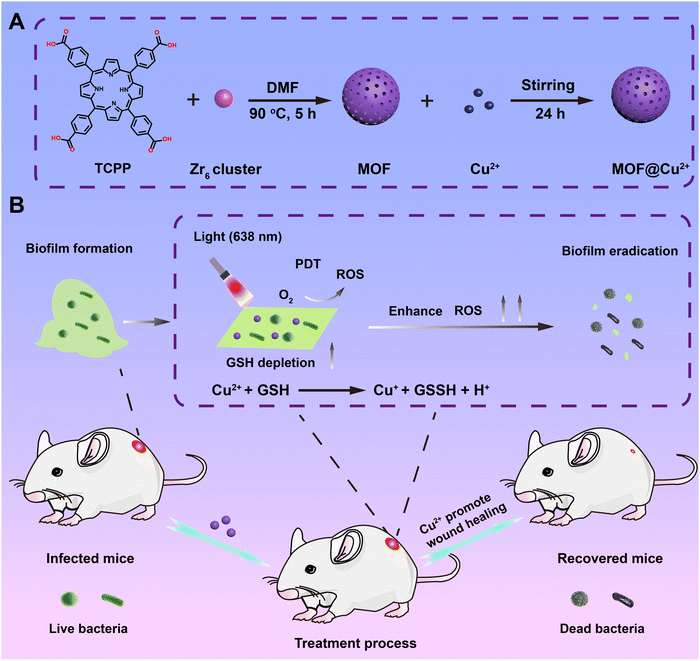
Herein, a maximum GSH-depleting photodynamic nanosystem has been developed by loading Cu2+ into porphyrin metal–organic frameworks (MOF) for efficaciously eradicating bacterial biofilm infection. Scheme 1 illustrates that 5,10,15,20-tetrakis-(4-methoxycarbonylphenyl)porphyrin (TCPP) was used as an organic photoactive ligand and the Zr6 cluster was utilized as a metal node to form the MOF, which exhibits strong visible light-induced ROS production ability. Moreover, benefiting from the porous structure and unreacted carboxylic groups, MOF supplies high surface area and many metal ion ligand-binding sites for loading Cu2+, which has been proven to possess strong reducing properties. Our results indicated that released Cu2+ could efficiently eliminate GSH in biofilm and ROS-destroyed bacteria, thus greatly improving PDT efficacy in combating biofilm infection both in vitro and in an in vivo S. aureus-infected biofilm wound model. Furthermore, Cu2+ released from Cu2+-infused MOF (MOF@Cu2+) can facilitate wound healing through stimulating cell migration, collagen deposition and angiogenesis with no distinct toxicity. Consequently, our designed nanosystem offers valid and secure simultaneous PDT therapeutics for antibiofilm infection.
2 Experimental section
2.1 Synthesis of MOF
ZrOCl2·8H2O (300 mg), TCPP (100 mg) and benzoic acid (2.8 g) were dispersed in 20 mL, 40 mL and 40 mL of DMF, respectively, and then added to a flask with stirring. Subsequently, the mixture was heated at 90 °C and reacted for 5 h. Finally, MOF was obtained by centrifugation and rinsed with DMF, EtOH and water.2.2 Synthesis of MOF@Cu2+
MOF (40 mg) and CuCl2·2H2O (20 mg) were added to deionized water (20 mL) under slight sonication. Subsequently, the mixture was reacted on a shaker at 25 °C for 1 day. The suspension was then centrifuged and rinsed with H2O to eliminate the unabsorbed Cu2+. The amount of Cu2+ in the MOF@Cu2+ was determined by ICP-MS. The obtained MOF@Cu2+ was freeze-dried and stored at 4 °C under dark conditions.2.3 Cu2+ release from MOF@Cu2+
To evaluate the release behavior of Cu2+, MOF@Cu2+ (10 mg) was added to deionized water (4 mL) with gentle stirring. The mixture was then centrifuged to acquire the supernatant, which was replaced with fresh water (4 mL); the Cu2+ in the supernatant was assessed by ICP-MS.2.4 Detection of ROS generation.
DCFH-DA was hydrolyzed to DCFH by adding NaOH solution.29 MOF or MOF@Cu2+ (100 μg mL−1) was then mixed with DCFH (10 μM) with or without GSH (1 mM). The mixture was illuminated by light (0.65 W cm−2, 638 nm) for 600 s. Finally, the suspensions were centrifuged and the ROS levels in supernatants were detected using a fluorescence spectrophotometer.2.5 GSH depletion capacity of MOF@Cu2+
GSH (30.7 mg) was added to tris buffer (10 mL, 25 mM, pH 7.2) to form a homogeneous solution. MOF@Cu2+ (5 mg) and MOF (5 mg) were then introduced into the above solution with slight agitation. At different time points, 1 mL of the above mixture was extracted and centrifuged at 12![[thin space (1/6-em)]](https://www.rsc.org/images/entities/char_2009.gif) 000 rpm for 0.25 h to remove the precipitate in the bottom. Finally, DTNB solution (200 μL, 200 μM) was added to the supernatant and kept for 180 s, and OD412
000 rpm for 0.25 h to remove the precipitate in the bottom. Finally, DTNB solution (200 μL, 200 μM) was added to the supernatant and kept for 180 s, and OD412![[thin space (1/6-em)]](https://www.rsc.org/images/entities/char_2009.gif) nm was then measured to evaluate the GSH level.
nm was then measured to evaluate the GSH level.
2.6 In vitro antimicrobial assays
Gram-positive S. aureus and Gram-negative E. coli were used to investigate the antimicrobial ability of MOF@Cu2+. A single colony of bacteria at solid Luria Bertani agar plates was transferred into LB medium (10 mL) and cultured at 37 °C for half a day. Next, the cultured bacteria were centrifuged (3000 rpm, 180 s), rinsed three times with tris buffer (0.025 M, pH 7.2) and diluted to 106 CFU mL−1. Subsequently, the antibacterial efficiency of MOF@Cu2+ was detected via the plate counting method. Typically, the above suspensions (500 μL) were put into a 24-well plate and treated with saline, MOF, Cu2+ or MOF@Cu2+ with or without laser illumination (0.65 W cm−2, 600 s). After culturing for another 720 min, the bacterial solution (0.1 mL) was uniformly coated on agar plates and incubated for 720 min to form bacterial clones. Finally, the numbers of colonies were detected to evaluate microbic viability.Bacterial activity was also evaluated through a live/dead staining experiment. Generally, bacterial suspensions from the various groups above were stained with FDA (10 μL, 10 mg mL−1) and PI (5 μL, 1 mg mL−1) for 0.5 h, respectively. Excess dye was then washed off by centrifugation (3000 rpm, 600 s) and rinsed with tris buffer several times. Finally, the microbial condition was detected by fluorescence microscopy.
2.7 Intracellular ROS production property of MOF@Cu2+
To evaluate the ability to generate intracellular ROS, DCFH-DA (10 μM) was added to microbial suspensions and cultivated for 0.5 h. After rinsing three times with tris buffer, the bacterial suspensions were treated with saline, MOF, Cu2+ or MOF@Cu2+ with or without light illumination (0.65 W cm−2, 600 s). The amount of ROS produced in the bacteria was visualized using fluorescence microscopy.2.8 In vitro antibiofilm property of MOF@Cu2+
To culture biofilm, 10 μL of S. aureus or E. coli and 990 μL of TSB were added to a 24-well plate and incubated at 37 °C for 48 h. The medium was discarded and replaced with fresh TSB at intervals of 1 day. Biofilm attached to the bottom of wells could be detected after 48 h.To evaluate the antibiofilm ability of MOF@Cu2+, S. aureus or E. coli biofilm was treated with MOF, Cu2+ or MOF@Cu2+ with or without light illumination (0.65 W cm−2, 600 s). Then, the medium was eliminated and the remaining biofilm was rinsed with tris buffer. Finally, the biofilm was subjected to mild sonication for 600 s, diluted and spread onto an agar plate. After incubation for 720 min, microbial colonies were recorded to evaluate bacterial viability.
To assess the biomass of biofilm after various disposals, the biofilm was dyed with crystal violet solution (0.1%) for 0.5 h and photographed after rinsing with tris buffer to eliminate the residual dye. Finally, 95% ethanol was utilized to dissolve the crystal violet-stained biofilm and the OD590 nm was measured to assess the biofilm biomass.
The live/dead staining assay was also conducted to assess the microbial condition in the biofilm. After various treatments, biofilm was dispersed in tris buffer and stained with FDA (10 μL, 10 mg mL−1) and PI (5 μL, 1 mg mL−1) in dark conditions for 0.5 h, respectively. After rinsing 3 times with tris buffer, the bacterial condition in the biofilm was observed by fluorescence microscope.
SEM was utilized to evaluate the bacterial morphology in biofilm. After the treatment of the various groups, S. aureus or E. coli biofilm was fixed by 2.5% glutaraldehyde solution for 720 min and then subjected to dehydration by gradient ethanol solution (30%, 50%, 70%, 80%, 90% and 100%). After drying at room temperature, biofilm morphology was evaluated by SEM.
2.9 Assessment of GSH levels in dead bacteria
After incubating with the control, MOF, or MOF@Cu2+ without light irradiation for 4 h, the bacteria (108 CFU mL−1) were subjected to an ultrasonic cell crusher for 20 min to fully destroy the bacteria and the supernatant was harvested by centrifugal separation. Next, deproteinizing reagents were added to the supernatant to avoid protein interference. Finally, DTNB was added to the above solution and OD412![[thin space (1/6-em)]](https://www.rsc.org/images/entities/char_2009.gif) nm was monitored to evaluate the GSH consumption rate in bacteria. The GSH consumption rate can be determined based on the formula below:
nm was monitored to evaluate the GSH consumption rate in bacteria. The GSH consumption rate can be determined based on the formula below:where ODcontrol and ODsample indicate the absorption values of control group and tested group, respectively.
2.10 Detecting GSH levels in biofilm
After incubating with the control, MOF or MOF@Cu2+ for 5 h, S. aureus or E. coli biofilm was rinsed with saline 3 times. Subsequently, Tris buffer was added to the biofilm and sonicated for 30 min. Finally, the DTNB assay was used to evaluate the residual content rate of GSH in the biofilm. The GSH residual content rate can be calculated according to the following formula:where ODcontrol and ODsample represent the absorptions of the control group and tested group at 412 nm, respectively.
2.11 In vitro migration and viability of human umbilical vein endothelial cells (HUVECs)
HUVECs were seeded into to a 24-well plate at a density of 2 × 10⁵ per well and cultured in a serum-free medium until the formation of cell monolayers. Next, a 20 μL pipette tip was scraped perpendicularly to the cell's flat face. After the scratch was finished, the well plates were rinsed three times with saline to eliminate exfoliated cells. After treatment with different groups, cells were placed in an incubator. Finally, cells were taken out (at 0 h or 24 h) and the results of cell migration were observed by fluorescence microscopy. The percentage of cell mobility was calculated based on the formula below:where Ao and As indicate the original scratch area and the scratch area after cultivation, respectively.
2.12 Hemolysis assay
The hemolysis assay was performed to assess the blood compatibility of MOF@Cu2+. Generally, fresh blood (2 mL) was extracted from the mice's orbital veins and stabilized with heparin. Red blood cells (RBCS) were isolated by dilution to 4 mL with saline and centrifugation (3000 rpm for 5 min). Then, RBCS were further rinsed with saline and dispersed in diluted tris buffer (10 mL). After that, different concentrations of MOF@Cu2+ solutions were cultivated with RBCS for 240 min at 37 °C. Finally, the absorbances of the supernatants from each group were measured at 570 nm via a microplate reader. The hemolysis rate (%) was determined based on the formula below:where ODt, ODn and ODp indicate the absorptions of the test group, negative control group and positive control group, respectively.
2.13 Cytotoxicity assays
Cell viability was appraised via MTT assay. First, L929 cells were grown in 96-well cell plates for one day to reach a density of 1 × 10⁴ cells per well. After removing the DMEM medium, fresh DMEM with various concentrations of MOF@Cu2+ was added to each well separately. After 1 day of cultivation, the cells were rinsed with saline and MTT/DMEM solution (10%, 100 μL) was added to each well and cultivated for 240 min. Finally, dimethyl sulfoxide (DMSO, 100 μL) was introduced to the wells and cultivated at 37 °C for 600 s. Cell proliferation was confirmed by a microplate reader at 490 nm with a reference wavelength of 630 nm.2.14 In vivo antibiofilm assay of MOF@Cu2+
All animal experiments were approved by the Animal Experiment Ethics Committee of Henan University (Kaifeng, China). Male mice aged 6–8 weeks were used to establish the biofilm-infected wound model for testing the biofilm elimination and wound healing effect of MOF@Cu2+. First, mice were injected intraperitoneally with 4% sodium chloral hydrate (0.1 mL/10 g) for anesthesia. After the depilation of the mice's backs, 6 mm diameter wounds were created and cultured with S. aureus (50 μL, 106 CFU mL−1) for 24 h to establish a biofilm-infected model. Mice were stochastically divided into 8 groups: saline; saline + L; MOF; MOF + L; Cu2+; Cu2+ + L; MOF@ Cu2+; MOF@ Cu2+ + L. Light-irradiated groups underwent 638 nm light illumination (0.65 W cm−2, 600 s). During the treatment process, photographs were taken every 48 hours to record wound conditions, and the weight alteration of each mouse was also monitored. After 10 days, mice were sacrificed and wound tissue was collected to determine the bacterial number at the infected site via the method of plate counting. For the evaluation of GSH concentration, mice skin wounds were dissected and homogenized. After centrifuging at 12![[thin space (1/6-em)]](https://www.rsc.org/images/entities/char_2009.gif) 000 rpm for 15 min, supernatants were mixed with DTNB solution to evaluate the GSH level. Hematoxylin and eosin (H&E) staining, Masson's trichrome staining and CD31 staining were performed to further assess the wound healing process. Finally, the major organs of mice were harvested and their potential changes in histopathology were detected by H&E staining.
000 rpm for 15 min, supernatants were mixed with DTNB solution to evaluate the GSH level. Hematoxylin and eosin (H&E) staining, Masson's trichrome staining and CD31 staining were performed to further assess the wound healing process. Finally, the major organs of mice were harvested and their potential changes in histopathology were detected by H&E staining.
2.15 In vivo ROS fluorescence imaging
In vivo fluorescence imaging was performed to evaluate ROS levels at biofilm-infected wounds. Mice were stochastically divided into 8 groups, the same as before. Next, the mice were completely anesthetized, followed by the administration of drugs at biofilm-infected wound sites and then the injection of the ROS probe DCFH-DA through the tail vein at a dose of 1.8 mg kg−1. After 30 min, 638 nm light illumination (0.65 W cm−2, 600 s) was applied to the wound site. Fluorescence images were taken using a live imaging system for small animals and their mean fluorescence intensities were quantified using the software attached to the live imaging system.2.16 Statistical analysis
Data are represented as the mean ± standard deviation (SD). Statistical analysis was conducted by employing the OriginPro 2017 software. Differences between the two groups were calculated using Student's t-test. Inter-group and intra-group comparison analyses were performed using one- or two-way ANOVAs with Tukey's multiple comparison test. In all cases, probability (p) values of less than 0.05 were considered statistically significant.3 Results and discussion
3.1 Synthesis and characterization of MOF@Cu2+
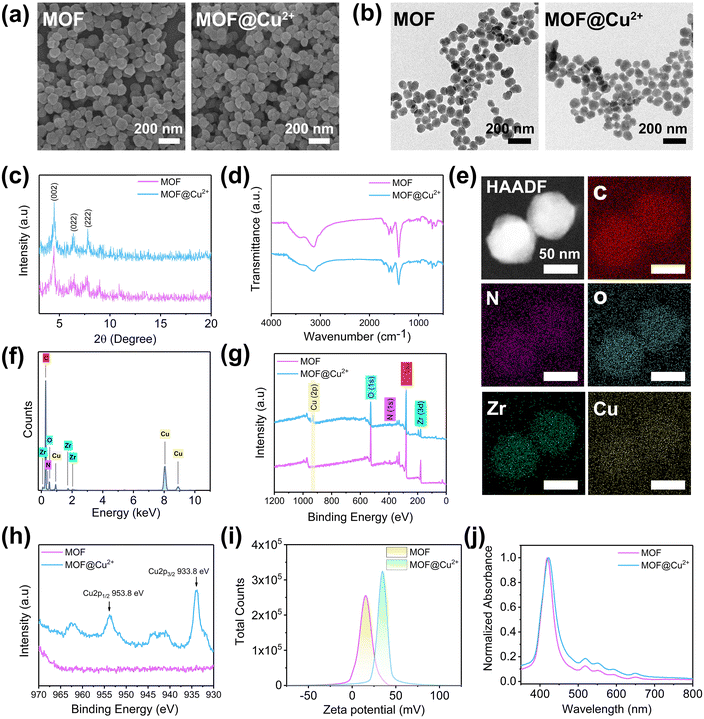
The MOF was prepared according to a previously reported method.30 SEM (Fig. 1(a)) and TEM (Fig. 1(b)) indicated that the MOF exhibited a spherical shape with an average diameter of around 100 nm. The XRD results showed that the MOF displayed typical (002), (022) and (222) peaks at 4.6°, 6.5° and 7.9° (Fig. 1(c)), which was consistent with a previous report.31 Next, the chemical structure of MOF was determined through FTIR; typically peaks at 1400 cm−1 and 1603 cm−1 were due to the symmetric and asymmetric stretching vibrations of the carboxyl group, respectively. The N2 adsorption–desorption isotherm and pore size distribution results showed that the BET surface area, the average pore size, and the pore volume of MOF were 1964 m2 g−1, 1.9 nm and 1.127 cm3 g−1, respectively (Fig. S1, ESI†). The porous structure and carboxylic groups of MOFs can provide large available surface areas and binding sites for loading Cu2+.30 CuCl2·2H2O was selected as the copper source to prepare MOF@Cu2+. As shown in Fig. 1(e) and (f), TEM element mappings and energy-dispersive spectroscopy (EDS) confirmed the loading of Cu2+. Moreover, the valence state of MOF@Cu2+ was evaluated by XPS. As shown in Fig. 1(g), the Cu 2p peak was observed after Cu2+ infusion, and the typical peaks of Cu 2p3/2 and Cu 2p1/2 at 933.8 eV and 953.8 eV could be assigned to Cu(II) (Fig. 1(h)). The zeta potential increased from +14.9 mV to +37.9 mV (Fig. 1(i)). These results collectively evidenced the successful preparation of MOF@Cu2+. In addition, no distinct change in morphology, size, water dispersibility, crystal structure, chemical structure and ultraviolet-visible absorption spectra were detected (Fig. 1(a)–(d), (j) and Fig. S2 (ESI†), indicating that Cu2+ loading had no influence on MOF properties. The amount of Cu2+ in MOF@Cu2+ was determined to be 1.2 mol mL−1 by ICP-MS. The release behavior of Cu2+ was evaluated by immersing MOF@Cu2+ in deionized water, as shown in Fig. S3 (ESI†). About 58.9% Cu2+ was released from MOF@Cu2+ after 60 h, indicating that MOF@Cu2+ possessed a sustained Cu2+ release property.3.2 Photodynamic activity and GSH consumption property of MOF@Cu2+
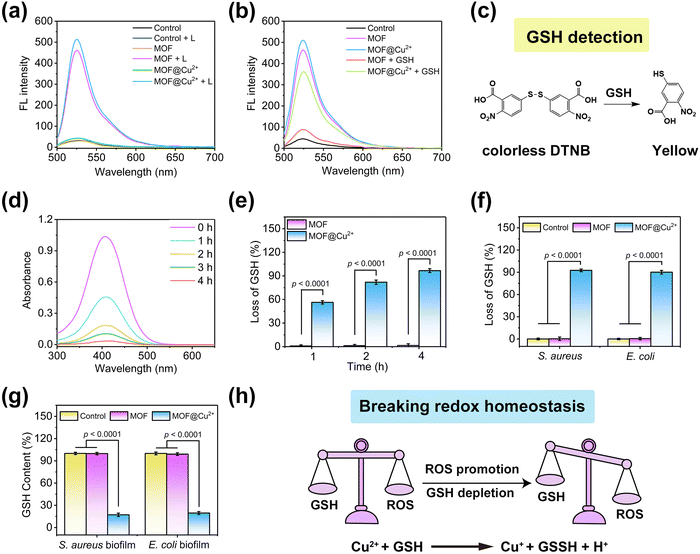
To study the photodynamic activity of MOF@Cu2+, a fluorescence probe, DCFH, was utilized to assess ROS production. Compared with non-light conditions, both MOF and MOF@Cu2+ produced strong fluorescence intensities under 638 nm light illumination for 10 min (Fig. 2(a)). The amount of ROS produced by MOF@Cu2+ is comparable to that of MOF, indicating that the loading of Cu2+ did not affect its PDT efficiency. Furthermore, the effect of GSH on PDT was also investigated. MOF and MOF@Cu2+ were separately mixed with GSH under the same conditions (638 nm irradiation for 10 min) to evaluate changes in fluorescence intensity.32 As illustrated in Fig. 2(b), with the addition of GSH, the fluorescence intensity of MOF was close to the level of the control group, suggesting that GSH could consume ROS and seriously affect the photodynamic efficiency of MOF. However, the fluorescence intensity of MOF@Cu2+ + GSH was much stronger as compared to the MOF + GSH group, indicating that MOF@Cu2+ can deplete GSH efficaciously and greatly improve ROS production efficiency. To validate the mechanism, the depletion of GSH by MOF@Cu2+ was further studied using the Ellman assay, in which GSH could be reduced by colorless DTNB to a yellow product, with an absorption peak at 412 nm (Fig. 2(c)).33 On this basis, we investigated the residual GSH levels in the mixed solution of MOF@Cu2+ and GSH at different time points. As depicted in Fig. 2(d), for the MOF@Cu2+ group, the absorbance at 412 nm decreased continuously with the increasing reaction time, while no distinct change was detected for the MOF group (Fig. S4, ESI†), indicating that MOF@Cu2+ possessed an excellent GSH depletion ability. The rate of GSH consumption by MOF@Cu2+ reached 96.7% after 4 h of incubation. However, this value was almost unchanged for MOF alone, further confirming that the GSH consumption-ability of MOF@Cu2+ was derived from Cu2+ (Fig. 2(e)).25 Next, we investigated whether MOF@Cu2+ could consume GSH from dead bacteria. Herein, Gram-positive staphylococcus aureus (S. aureus) and Gram-negative Escherichia coli (E. coli) were chosen as model bacteria. As shown in Fig. 2(f), negligible bacterial GSH depletion ability was detected for the control and MOF groups. However, the S. aureus and E. coli GSH consumption efficacy reached 93.6% and 90.1% for MOF@Cu2+ groups, proving that MOF@Cu2+ could efficaciously consume the GSH leaked by bacteria. The ability of MOF@Cu2+ to consume biofilm GSH was also examined. As shown in Fig. 2(g), no distinct GSH level was detected after treating with the control or MOF groups, while GSH content in the MOF@Cu2+-treated S. aureus or E. coli biofilm was significantly reduced to 17.2% or 19.6%. Overall, the above results proved that MOF@Cu2+ possessed superior GSH consumption ability both in dead bacteria and bacterial biofilm, which was expected to break redox homeostasis and greatly improve its PDT efficacy in combating biofilm infection (Fig. 2(h)).3.3 In vitro antibacterial activities of MOF@Cu2+
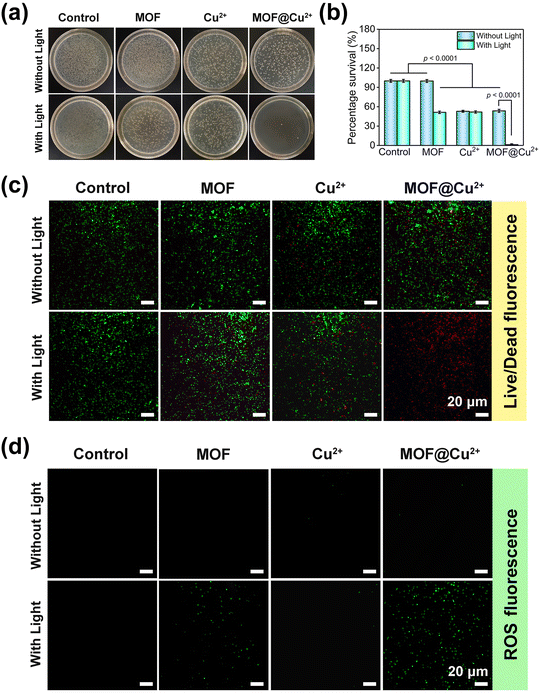
Inspired by the above results, we next appraised the in vitro antibacterial effects of MOF@Cu2+ by the spread plate method, live/dead staining assay and intracellular ROS analysis. The treatment groups were sectioned based on the therapies they were exposed to, including saline, MOF, Cu2+ and MOF@Cu2+. The groups treated with light illumination were marked as saline + L, MOF + L, Cu2+ + L, MOF@Cu2+ + L, respectively.The antibacterial activity of MOF@Cu2+ was investigated on S. aureus. As shown in Fig. 3(a) and (b), no obvious antimicrobial effects were detected for the saline, saline + L, and MOF groups, implying that MOF alone exhibited little bactericidal ability. However, when the MOF group was combined with light illumination, it demonstrated an antibacterial effect and bacterial viability was decreased by approximately 48.7%. This could be attributed to the PDT effect of MOF. Besides, the bacterial viability of free Cu2+, Cu2+ + L and MOF@Cu2+ groups decreased by 47.1%, 48.2% and 46.4%, respectively, indicating incomplete bacterial eradication solely through the bactericidal properties of Cu2+.34 Remarkably, an intense antibacterial effect (98.9%) with nearly invisible colonies was detected for the MOF@Cu2+ + L group. This enhanced bactericidal activity was due to the simultaneous effect of PDT and Cu2+, wherein PDT could generate ROS to attack bacteria, causing them to release GSH. The released Cu2+ could then deplete GSH, disrupting the bacterial intracellular defense system, thereby strengthening the bactericidal action of ROS and improving the overall antimicrobial activity. To further understand the antibacterial effect of MOF@Cu2+, live/dead staining experiments were performed. We stained the bacteria with FDA and PI to visualize live or dead bacteria. FDA could penetrate the intact bacterial membrane and display green fluorescence, whereas PI could enter dead bacteria through the disrupted membrane and emit red fluorescence. As shown in Fig. 3(c), almost all bacteria emitted red fluorescence for the MOF@Cu2+ + L group, while other groups still exhibited green fluorescence, confirming that light-irradiated MOF@Cu2+ possessed the best antimicrobial ability. In the end, intracellular ROS levels were assessed with various treatments via the DCFH-DA probe. As disclosed in Fig. 3(d), distinct green fluorescence could be observed for the light-illuminated MOF or MOF@Cu2+ groups, and the MOF@Cu2+ + L group exhibited stronger fluorescence. Moreover, the semi-quantitative results of live/dead staining and ROS fluorescence images were evaluated by Image J software and the results confirmed that MOF@Cu2+ possessed the best bactericidal activity and ROS production activity (Fig. S5 and S6, ESI†), suggesting that the released Cu2+ can significantly enhance the efficiency of ROS production by consuming GSH leaked from dead bacteria. Similar experimental results could also be detected for E. coli. (Fig. S7–S12, ESI†) Consequently, our prepared GSH-consuming photodynamic nanoplatform exhibited excellent broad-spectrum bactericidal ability under light irradiation.
3.4 In vitro antibiofilm activity of MOF@Cu2+
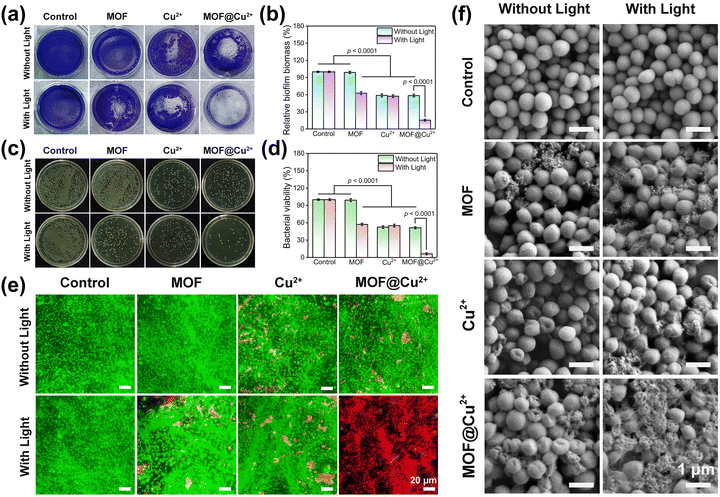
The remarkable antibacterial activity of MOF@Cu2+ suggested that it may possess exceptional capabilities in eradicating biofilm. To investigate this aspect, a series of experiments were conducted, including crystal violet staining assay, the spread plate method, live/dead staining assay and SEM. Initially, the antibiofilm activity of MOF@Cu2+ was investigated on S. aureus, as disclosed in Fig. 4(a) and (b), the MOF alone group presented an apparent dark purple color and large amounts of biomass, indicating that the MOF did not show any antibiofilm ability. However, the color of the crystal violet-stained biofilm became much lighter and the biofilm mass decreased by 37.4%, 41.3%, 42.7%, and 41.6% for MOF + L, Cu2+, Cu2+ + L and MOF@Cu2+ groups, respectively, suggesting that the light-irradiated MOF and Cu2+ exerted an antimicrobial effect to a certain extent. The MOF@Cu2+ + L group showed the lightest color and only 15.4% of biofilm mass was detected, indicating that Cu2+ could effectively enhance the photodynamic effect of MOF for eliminating the biofilm. We assumed this could be attributed to the GSH-consuming ability and the inherent bactericidal effect of Cu2+. The results from the spread plate method, bacterial viability measurement and live/dead staining assay further confirmed this effect (Fig. 4(c)–(e)), consistent with the in vitro antibacterial results. Finally, the morphological changes in the S. aureus biofilm were detected via SEM. As disclosed in Fig. 4(f), compared with the control groups, the MOF@Cu2+ + L group-treated biofilm showed the most severe damage to bacteria, including severe folding and shrinkage of the bacterial surface, significant deformation of the bacterial morphology, and the loss of cell integrity. This suggests that the combination of MOF@Cu2+ and light treatment resulted in the most potent destructive effects on the S. aureus biofilm. Similar results were found in E. coli (Fig. S13–S18, ESI†). In summary, these findings afford precious insights into the effectiveness of light-irradiated MOF@Cu2+ in the destruction of biofilm.3.5 In vitro biocompatibility and cell migration assays of MOF@Cu2+
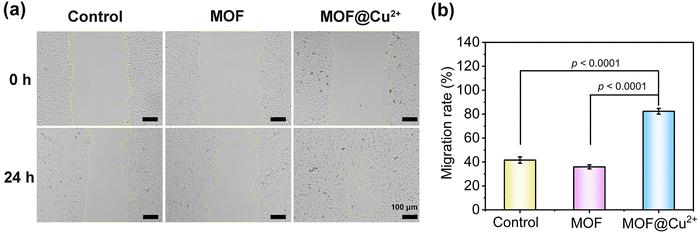
To further investigate the in vivo application potentials of MOF@Cu2+, in vitro assessments were conducted to assess the biocompatibility of MOF@Cu2+via hemolysis and MTT assays. As depicted in Fig. S19 (ESI†), no significant hemolysis was detected even at a high concentration of 200 μg mL−1, indicating the negligible cytotoxicity of MOF@Cu2+. The MTT assay corroborated these findings by demonstrating a cell survival rate above 90% even at the aforementioned concentration of MOF@Cu2+ (Fig. S20, ESI†). Collectively, these outcomes establish the favorable in vitro biocompatibility of MOF@Cu2+.Cu2+ plays an important role in regulating cellular metabolism, such as in angiogenesis. It has been reported that Cu2+ could expedite the healing of mice skin wounds.35 The primary mechanism of Cu2+ in modulating wound healing was mostly dependent on upregulating vascular endothelial growth factor and integrin, stimulating the multiplication of human umbilical vein endothelial cells, inducing collagen deposition, and increasing copper-dependent enzymes.36,37 The human umbilical vein endothelial cells (HUVEC) showed great effects in terms of inflammation and wound healing.38,39 Herein, a wound-scratch assay was performed to appraise the impact of MOF@Cu2+ on HUVEC migration. As illustrated in Fig. 5(a), after 24 hours of treatment, the cells in the MOF@Cu2+ group exhibited substantial migration into the scratched area, resulting in a distinct reduction in the size of the initial wound. Quantification using image J software further confirmed these observations (Fig. 5(b)), revealing an approximately 82.4% increase in HUVEC mobility in the MOF@Cu2+ group, which was higher than the control (41.6%) and MOF groups (35.9%). These results indicated that MOF@Cu2+ could promote cell migration and may facilitate wound healing.
3.6 Antibiofilm and skin wound healing effects of MOF@Cu2+in vivo
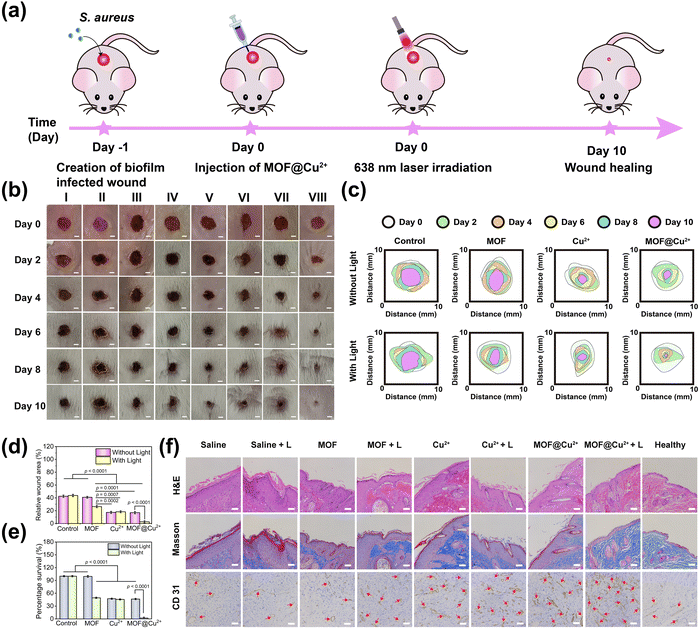
Encouraged by the excellent antibiofilm and cell proliferation properties of MOF@Cu2+in vitro, we next assessed its ability to combat biofilm infection and promote wound healing in vivo by constructing a mice model of the S. aureus biofilm-infected skin wound (6 mm in diameter). The whole animal experiment is shown in Fig. 6(a). The infected mice were divided into 8 groups (5 mice in each group) and named saline; saline + L; MOF; MOF + L; Cu2+; Cu2+ + L; MOF@Cu2+; MOF@Cu2+ + L. First, in vivo fluorescence imaging was performed to evaluate ROS levels in biofilm-infected wounds before/after various treatments. As shown in Fig. S21(a) and b) (ESI†), much higher fluorescence intensity was detected for the MOF@Cu2+ + L group than other groups, proving that MOF@Cu2+ possessed the best ROS production ability. Next, the wound areas of all groups were monitored on days 0, 2, 4, 6, 8, and 10. As can be seen from Fig. 6(b), wounds in all groups became smaller, and skin epidermal thickening and inflammation could be detected for control groups, while the MOF@Cu2+ + L group showed the minimum wound area. The wound-healing effect of MOF@Cu2+ was also assessed by monitoring the real-time changes in wound areas. As illustrated in Fig. 6(c) and (d), the MOF@Cu2+ + L group exhibited the smallest wound area, accounting for approximately 2.7% of the initial wound size, indicating the superior effectiveness of this treatment in promoting wound healing as compared to the other groups. To evaluate the GSH-consuming ability of MOF@Cu2+in vivo, mice skin samples were obtained to determine GSH levels. As shown in Fig. S22 (ESI†), the GSH levels were very low in the MOF@Cu2+ + L group, indicating that the light-irradiated MOF@Cu2+ exhibited significant GSH-depleting behavior in vivo. In addition, to further assess the antimicrobial activity of MOF@Cu2+, wound skin samples were harvested from all treatment groups, and the bacteria in wounds were quantified using the plate counting method. As depicted in Fig. S23 (ESI†) and Fig. 6(e), the MOF@Cu2+ + L group displayed a remarkable absence of bacterial colonies in comparison to the other treatment groups, and bacterial viability was decreased by approximately 97.9%. These results unequivocally highlighted the pronounced antibacterial effect of light-irradiated MOF@Cu2+, underscoring its superiority in mitigating bacterial growth. On day 10, skin wounds were dissected, and skin sections were stained with H&E for histological analysis (Fig. 6(f)). Compared with healthy skin, the saline group possessed a large amount of inflammatory cell accumulation and a thickening of the epidermal layer. In contrast, light-irradiated MOF@Cu2+ displayed minimal infiltration of inflammatory cells, dense tissue structure, and intact histological features. These observations were consistent with the staining results obtained using Masson's trichrome (Fig. 6(f)). In the MOF@Cu2+ + L group, a significant increase in the number of collagen fibers was observed, and the fibers were closely and regularly arranged, similar to healthy skin. To assess new vessel formation, CD 31 immunohistochemical staining was also conducted (Fig. 6(f)). The number of blood vessels was significantly higher in the MOF@Cu2+ + L treatment group than in the other groups, which was consistent with the results of H&E and Masson staining. We assumed that this was mainly caused by the synergistic effect of PDT in combating biofilm infection and the angiogenesis of Cu2+. In summary, our designed MOF@Cu2+ nanosystem had excellent antibiofilm activity in vivo and superior capability in promoting wound healing.3.7 Biosafety evaluation of MOF@Cu2+in vivo
To appraise the in vivo biosafety of MOF@Cu2+, histological analysis was conducted on the major organs of mice, including the heart, liver, spleen, lungs, and kidneys, dissected from mice in the different treatment groups after 10 days. Notably, no significant inflammatory lesions or organ damage were observed in any of the examined major organs of the mice (Fig. 7) and all the mice grew stably during the treatment (Fig. S24, ESI†). Moreover, hematological parameters, such as platelet count (PLT), mean corpuscular hemoglobin concentration (MCHC), mean corpuscular hemoglobin (MCH), mean corpuscular volume (MCV), hematocrit (HCT), hemoglobin (HGB), red blood cell count (RBC) and white blood cell count (WBC), as well as parameters related to kidney and liver function, including urea, uric acid (UA), urea nitrogen (UREA), aspartate transaminase (AST) and alanine transaminase (ALT) were assessed. The results indicated no significant differences in these parameters among the treatment groups (Fig. S25(a), ESI†). Additionally, the blood biochemistry parameters related to liver and kidney function (ALT, AST, UREA, and UA) were found to be within the normal range (Fig. S25(b), ESI†), further confirming that the material did not induce liver or kidney dysfunction. These collective findings indicate the excellent biosafety profile of MOF@Cu2+, supporting its promising potential for clinical applications.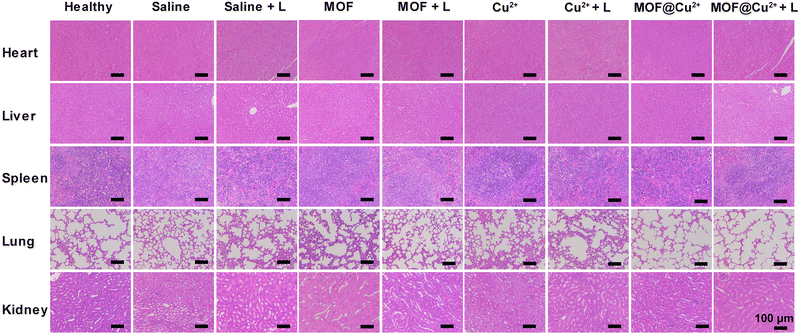 | ||
| Fig. 7 H&E staining of internal organs (heart, liver, spleen, lungs, kidney) of mice after various therapies. | ||
4 Conclusions
This study has favorably prepared Cu2+-infused MOF as a novel dual-enhanced photodynamic therapy approach for the eradication of bacterial biofilm infection. This therapeutic strategy capitalizes on the simultaneous action of the bacterial-killing effect of ROS and Cu2+ in the maximization of GSH depletion within bacteria and biofilm, and the consequent enhancement of PDT efficacy against biofilm. In vitro and in vivo investigations confirmed the outstanding biofilm elimination capacity of MOF@Cu2+ under 638 nm laser irradiation. Noteworthy findings also indicated the minimal toxicity associated with the entire treatment process, stimulation of angiogenesis in mice, and a substantial reduction in the healing time of skin wounds. Collectively, this research provides a compelling and innovative avenue for developing antimicrobic reagents and the eradication of biofilm formation.Author contributions
Yaoxin Zhang: conceptualization, methodology, investigation, validation, writing – original draft. Linpei Li: validation. Hui Liu: investigation, funding acquisition. Haixia Zhang: investigation. Menghao Wei: investigation. Junqing Zhang: methodology. Mengnan Wu: methodology. Zhaowei Chen: methodology. Chaoqun Liu: conceptualization, supervision, writing review, editing, funding acquisition. Faming Wang: conceptualization, supervision, writing review, editing. Qiang Wu: conceptualization, supervision, writing review, editing. Jiahua Shi: conceptualization, supervision, editing.Conflicts of interest
The authors declare no conflicts of interest.Acknowledgements
This work was financially supported by the National Natural Science Foundation of China (grant no. 22307033, C. L.), the Medical Science and Technology Research Project of Henan Province (grant no. SBGJ202302090, C. L.; LHGJ20230984, H. L.) and the Open Project Program of Key Laboratory for Analytical Science of Food Safety and Biology, Ministry of Education (grant no. FS2204, C. L.).Notes and references
- S. S. Kanj, M. Bassetti, P. Kiratisin, C. Rodrigues, M. V. Villegas, Y. Yu and D. van Duins, Int. J. Antimicrob. Agentsd, 2022, 60, 106633 CrossRef CAS PubMed.
- B. Jia, X. Du, W. Wang, Y. Qu, X. Liu, M. Zhao, W. Li and Y.-Q. Li, Adv. Sci., 2022, 9, 2105252 CrossRef CAS PubMed.
- A. Cano, M. Ettcheto, M. Espina, A. López-Machado, Y. Cajal, F. Rabanal, E. Sánchez-López, A. Camins, M. L. García and E. B. Souto, J. Nanobiotechnol., 2020, 18, 156 CrossRef PubMed.
- S. Zhang, K. Guan, Y. Zhang, J. Zhang, H. Fu, T. Wu, D. Ouyang, C. Liu, Q. Wu and Z. Chen, Nano Res., 2023, 16, 5346–5356 CrossRef CAS.
- A. K. Epstein, B. Pokroy, A. Seminara and J. Aizenberg, Proc. Natl. Acad. Sci. U. S. A., 2011, 108, 995–1000 CrossRef CAS PubMed.
- K. Liu, M. Brivio, T. Xiao, V. M. I. V. Norwood, Y. S. Kim, S. Jin, A. Papagni, L. Vaghi and R. W. Huigens, III, ACS Infect. Dis., 2022, 8, 280–295 CrossRef CAS PubMed.
- L. Zou, D. Hu, F. Wang, Q. Jin and J. Ji, Nano Res., 2021, 15, 1636–1644 CrossRef.
- H.-C. Flemming and J. Wingender, Nat. Rev. Microbiol., 2010, 8, 623–633 CrossRef CAS PubMed.
- B. Kim, C. S. Madukoma, J. D. Shrout and R. Nerenberg, Water Res., 2023, 240, 120101 CrossRef CAS PubMed.
- C. Liu, S. Feng, L. Ma, M. Sun, Z. Wei, J. Wang, Z. Chen, Y. Guo, J. Shi and Q. Wu, ACS Appl. Mater. Interfaces, 2021, 13, 38029–38039 CrossRef CAS PubMed.
- X. Lv, L. Wang, A. Mei, Y. Xu, X. Ruan, W. Wang, J. Shao, D. Yang and X. Dong, Small, 2023, 19, 2206220 CrossRef CAS PubMed.
- A. Vishwakarma, F. Dang, A. Ferrell, H. A. Barton and A. Joy, J. Am. Chem. Soc., 2021, 143, 9440–9449 CrossRef CAS PubMed.
- O. Ciofu, C. Moser, P. Ø. Jensen and N. Høiby, Nat. Rev. Microbiol., 2022, 20, 621–635 CrossRef CAS PubMed.
- J. Mei, D. Xu, L. Wang, L. Kong, Q. Liu, Q. Li, X. Zhang, Z. Su, X. Hu, W. Zhu, M. Ye, J. Wang and C. Zhu, Adv. Mater., 2023, 35, 2303432 CrossRef CAS PubMed.
- L. Zhang, C. Hu, M. Sun, X. Ding, H.-B. Cheng, S. Duan and F.-J. Xu, Adv. Sci., 2023, 10, 2300328 CrossRef CAS PubMed.
- H. Han, Y. Gao, M. Chai, X. Zhang, S. Liu, Y. Huang, Q. Jin, A. Grzybowski, J. Ji and K. Yao, J. Controlled Release, 2020, 327, 676–687 CrossRef CAS PubMed.
- A. d C. M. de Paiva, M. d C. Ferreira and A. d S. da Fonseca, Photodiagn. Photodyn. Ther., 2022, 37, 102717 CrossRef CAS PubMed.
- M. Ding, W. Zhao, X. Zhang, L. Song and S. Luan, J. Hazard. Mater., 2022, 439, 129594 CrossRef CAS PubMed.
- S. Zhang, Y. Yang, Y. Zhang, J. Zhang, L. Li, C. Liu and Q. Wu, J. Anal. Test., 2023, 7, 227–236 CrossRef.
- M. E. Lim, Y.-l Lee, Y. Zhang and J. J. H. Chu, Biomaterials, 2012, 33, 1912–1920 CrossRef CAS PubMed.
- J. L. Wardlaw, T. J. Sullivan, C. N. Lux and F. W. Austin, Vet. J., 2012, 192, 374–377 CrossRef CAS PubMed.
- Y. Wang, J. Liao, Y. Lyu, Q. Guo, Z. Zhu, X. Wu, J. Yu, Q. Wang and W.-H. Zhu, Adv. Funct. Mater., 2023, 33, 2301692 CrossRef CAS.
- X. Hu, H. Zhang, Y. Wang, B.-C. Shiu, J.-H. Lin, S. Zhang, C.-W. Lou and T.-T. Li, Chem. Eng. J., 2022, 450, 138129 CrossRef CAS.
- B. A. Thomas-Moore, C. A. del Valle, R. A. Field and M. J. Marín, Photochem. Photobiol. Sci., 2022, 21, 1111–1131 CrossRef CAS PubMed.
- D. Hu, Y. Deng, F. Jia, Q. Jin and J. Ji, ACS Nano, 2020, 14, 347–359 CrossRef CAS PubMed.
- Y. Feng, L. Liu, J. Zhang, H. Aslan and M. Dong, J. Mater. Chem. B, 2017, 5, 8631–8652 RSC.
- J. Zeng, Y. Wang, Z. Sun, H. Chang, M. Cao, J. Zhao, K. Lin and Y. Xie, Chem. Eng. J., 2020, 394, 125017 CrossRef CAS.
- X. Zhou, S. Zhang, Y. Liu, J. Meng, M. Wang, Y. Sun, L. Xia, Z. He, W. Hu, L. Ren, Z. Chen and X. Zhang, ACS Appl. Mater. Interfaces, 2022, 14, 11104–11115 CrossRef CAS PubMed.
- Y. Zhang, F. Wang, C. Liu, Z. Wang, L. Kang, Y. Huang, K. Dong, J. Ren and X. Qu, ACS Nano, 2018, 12, 651–661 CrossRef CAS PubMed.
- Y. Zhang, P. Sun, L. Zhang, Z. Wang, F. Wang, K. Dong, Z. Liu, J. Ren and X. Qu, Adv. Funct. Mater., 2019, 29, 1808594 CrossRef.
- F. Qi, Z. Wang, L. Yang, H. Li, G. Chen, S. Peng, S. Yang and C. Shuai, Mater. Today Chem., 2023, 27, 101336 CrossRef CAS.
- E. Ju, K. Dong, Z. Chen, Z. Liu, C. Liu, Y. Huang, Z. Wang, F. Pu, J. Ren and X. Qu, Angew. Chem., Int. Ed., 2016, 55, 11467–11471 CrossRef CAS PubMed.
- Q. Wang, X. Jia, X. Li, M. He, J.-N. Hao, M. Guan, Y. Mao, Y. Cao, B. Dai and Y. Li, Biomater. Sci., 2022, 10, 4208–4217 RSC.
- Y. Liu, N. Nie, H. Tang, C. Zhang, K. Chen, W. Wang and J. Liu, ACS Appl. Mater. Interfaces, 2021, 13, 11631–11645 CrossRef CAS PubMed.
- B. Tao, C. Lin, Y. Deng, Z. Yuan, X. Shen, M. Chen, Y. He, Z. Peng, Y. Hu and K. Cai, J. Mater. Chem. B, 2019, 7, 2534–2548 RSC.
- W. He, X. Wang, T. Hang, J. Chen, Z. Wang, D. A. Mosselhy, J. Xu, S. Wang and Y. Zheng, Carbohydr. Polym., 2023, 309, 120681 CrossRef CAS PubMed.
- J. Zeng, X. Geng, Y. Tang, Z.-C. Xiong, Y.-J. Zhu and X. Chen, Chem. Eng. J., 2022, 437, 135347 CrossRef CAS.
- G. C. Gurtner, S. Werner, Y. Barrandon and M. T. Longaker, Nature, 2008, 453, 314–321 CrossRef CAS PubMed.
- M. Wu, Z. Zhang, Z. Liu, J. Zhang, Y. Zhang, Y. Ding, T. Huang, D. Xiang, Z. Wang and Y. Dai, Nano Today, 2021, 37, 101104 CrossRef CAS.
Footnote |
| † Electronic supplementary information (ESI) available. See DOI: https://doi.org/10.1039/d3tb02577b |
| This journal is © The Royal Society of Chemistry 2024 |

