 Open Access Article
Unravelling ionic liquid solvent effects for a non-polar Cope rearrangement reaction†
Gavin J.
Smith
 a,
Spyridon
Koutsoukos
 a,
Ben
Lancaster
 a,
Julian
Becker
 a,
Tom
Welton
 a and
Patricia A.
Hunt
 *ab
*ab
aDepartment of Chemistry, Imperial College London, UK
bSchool of Chemical and Physical Sciences, Victoria University of Wellington, New Zealand. E-mail: patricia.hunt@vuw.ac.nz
First published on 9th April 2024
Abstract
The impact of ionic liquids (ILs) on polar reactions is well recognised, however the impact of ILs on non-polar reactions is less well understood or explored. Pericyclic Cope rearrangements are highly concerted, exhibit minimal charge localisation and pass through an uncharged but well-defined transition state, and thus provide a good mechanism for exploring the impact of IL polarizability on chemical reactivity. Recently, a 10× rate enhancement has been observed for the Cope rearrangement of 3-phenyl-1,5-hexadiene in the IL 1-butyl-3-methylimidazolium bis(trifluoromethanesulfonyl)imide [C4C1im][NTf2] compared to benzene. In this work we undertake a DFT based computational study (B3LYP-D3BJ/6-311+G(d,p) and M06-2X-D3/6-311+G(d,p)) of the Cope rearrangement of 3-phenyl-1,5-hexadiene and 3-propyl-hexa-1,5-diene in molecular solvents (acetonitrile, benzene and ethanol) and the IL [C4C1im][NTf2] using the SMD solvation model. The impact of benzene and [C4C1im][NTf2] on the Cope rearrangement of 3-phenyl-1,5-hexadiene is studied in more detail and we provide insight into the reason for the rate enhancement in an IL. The volume of activation is evaluated and the potential impact of ‘solvent pressure’ is discussed. We identify two potential mechanisms for volume effects to contribute to the rate enhancement. Solvent association energies are evaluated at the DLNPO-CCSD(T) level. Specific solvent interactions are explored through atomic partial charge, molecular orbital and bond critical point analysis, as well as via non-colvalent interaction (NCI) plots, electrostatic potential (ESP) differences and density difference Δρ(r) plots. We find that the cation and anion together form an extensive van der Waals pocket in-which the transition state (TS) sits. Electron density within the TS is anisotropically polarised via a 'push–pull' effect due to the dual cation–anion nature of the IL, stabilising the TS relative to benzene. We also provide experimental evidence that these effects are generalisable to other ILs. Overall, our aim is to provide a deeper moleuclar level understanding of the impact of ILs on non-polar reactions.
Introduction
Ionic liquids (ILs) are salts that are liquid at the temperature of interest. The term is often used to differentiate these from simple inorganic salts with high melting points. As a group ILs also exhibit a variety of properties which set them apart from common molecular liquids. Most ILs are non-volatile, non-flammable, conductive, have good solubility/miscibility characteristics and a high thermal stability. ILs, compared to traditional organic solvents, are able to dissolve recalcitrant materials and facilitate reactivity in new ways.1–4 A subset of ILs are re-cyclable, operate at lower temperatures and volumes, have reduced toxicity and do not produce volatile pollutants and are considered to be green reaction solvents.Varying the cation or anion or forming a binary IL can tune the properties of an IL for a given task. Moreover, either or both the anion and the cation can be functionalised to participate in, and optimise a specific reaction, giving rise to the potential for ILs to be “designer solvents”.5
A large number of ion combinations is possible, and new ILs are being developed, however the flexibility of ILs as designer solvents has yet to be fully realised or exploited. Critically, we still lack a robust fundamental understanding of how ILs solvate molecular species. In this work we aim to improve the understanding of IL solvation.
Of particular interest in this work are ILs employed as reaction solvents and the impact ILs can have on reactivity and reaction rates. ILs are known to affect the reaction rate of a variety of organic reactions either as a solvent or by acting as a co-catalyst.5,6 They do this by differential solvation of reactants, intermediates, transition states and products, via both specific and non-specific solute–solvent interactions. Understanding IL solvent effects on reactions will provide a key to better utilising ILs as designer solvents.
ILs can engage in a range of non-covalent interactions; e.g. Coulombic, hydrogen (H)-bonding, van der Waals, π-interactions. Kamlet–Taft parameters π*, α and β are commonly used to quantify the ability of solvents to interact with solutes via dipolarity/polarizability, H-bond donation and H-bond acceptance.6–9 The H-bond donating (α) and accepting (β) abilities can vary considerably between ILs.10–12 Kamlet–Taft H-bonding parameters have been linked with the impact of an IL on organic reactions.13–15 However, the contribution made by (non-long chain alkyl) van der Waals interactions to solvation is less studied. Moreover, the Kamlet–Taft π* parameter of ILs is not well understood or studied.10 π* is generally taken as an indicator of the magnitude of van der Waals interactions, dispersive contributions, and electron delocalisation.
Solvent dipolarity is not well defined, and relates to the (time averaged) sum of all the molecular dipoles per unit volume within the liquid.10 Individual molecules will have a dipole moment which is the sum of static and induced dipoles (μ = μd + μid). The magnitude of the induced dipole μid = αE is dependent on the molecular polarizability (α), which measures the ease of deforming the molecular electron cloud where E is an external electric field (which could be the field of a neighbouring ion). Dispersive interactions are induced dipole-induced dipole (μid–id) interactions, while the van der Waals interaction includes all the attractive dipole interactions (μd–d + μd–id + μid–id). Applying a static electric field to the liquid will orient the collective molecular dipoles. Induction or polarisation includes both the electrostatic (ion and permanent dipole) and dispersive (induced dipole) responses to the external electric field.
The exact nature of polarity in ILs is complex. Intuitively as ILs are composed of ions, they are often assumed to be polar. Polar solvents are expected to have a larger effect on reaction rates in accordance with the Hughes–Ingold rules; a reaction which exhibits charge build up in a relevant transition state (TS) will be accelerated by polar solvents.16
However, the relative permittivity of ILs is not large, typically εr ≈ 11–30. ILs with longer alkyl chains form nano-scale polar and lipophilic domains.17,18 Thus, an IL can have regions that are more polar than could be anticipated from the magnitude of εr. However, ILs with shorter alkyl chains (R = CnH2n+1) n < 4 are generally considered to be homogeneous, and still have a moderate εr.17,19–21 It has been recognised for some time that IL ion–ion interactions can have non-negligible induction and dispersion contributions.22,23 However, solute–IL ion dispersion interactions are not well studied.
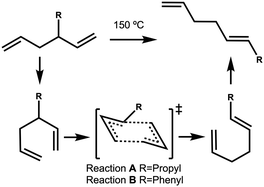
The impact of ILs on polar species is well recognised, in contrast the impact of ILs on non-polar reactions is poorly understood. In this work we are interested in studying the impact of IL van der Waals interactions, dispersive contributions, and electron delocalisation on non-polar reactions. The pericyclic Cope rearrangement provides a good exemplar reaction to study solvent effects not based on strong ionic interactions or H-bond donating/accepting (Kamlet–Taft α/β) (Fig. 1). The Cope reaction is highly concerted and exhibits minimal charge localisation throughout, moreover the reaction passes through a well-defined uncharged TS.24
Recently the Cope rearrangements of 3-propyl-1,5-hexadiene (reaction A R = Pr) and 3-phenyl-1,5-hexadiene (reaction B R = Ph), Fig. 1, have been studied in a range of molecular solvents (benzene, ethanol and acetonitrile) and compared with the reactions in the IL [C4C1im][NTf2], Table 1.25 The Cope rearrangement of 3-phenyl-1,5-hexadiene was found to proceed 10× faster in 1-butyl-3-methylimidazolium bis(trifluoromethylsulfonyl)imide, [C4C1im][NTf2], compared to benzene.
k
1 10−7s−1![[thin space (1/6-em)]](https://www.rsc.org/images/entities/char_2009.gif) a a |
ε r | π*![[thin space (1/6-em)]](https://www.rsc.org/images/entities/char_2009.gif) c c |
n D | |
|---|---|---|---|---|
| a Data from ref. 25. b Data from ref. 26. c Molecular solvent data from ref. 27. [C4C1im][NTf2] data from ref. 28. d Molecular solvent data from ref. 29. [C4C1im][NTf2] data from ref. 30. | ||||
| Benzene | 6.2 | 2.28 | 0.59 | 1.5011 |
| Ethanol | 7.7 | 25.30 | 0.54 | 1.3611 |
| MeCN | 16.1 | 36.64 | 0.75 | 1.3442 |
| [C4C1im][NTf2] | 61.6 | 11.60 | 0.84 | 1.4271 |
However, despite efforts to correlate the rate enhancement with a range of relevant solvent physical properties, no clear rationalisation for the rate enhancement could be identified. In particular, no correlation of the rate constant k1 was observed with εr, π*, or refractive index nD, parameters that should reflect solvent polarity and (static/infinite) polarizability.25
Keaveney et al., hypothesised that ‘solvent pressure’ may be important.25 Reactions that lack strong direct solute–solvent interactions (such as H-bonding) can exhibit more subtle effects due to ‘solvent pressure’.31 Forming a solvent cavity requires pushing solvent molecules apart, and the larger the association energy of the solvent molecules the more energy is required to create the solute cavity, this effect is often loosely described as a solvophobic effect due to ‘solvent pressure’. It has been suggested that the strong ionic interactions within ILs may lead to a high internal ‘solvent pressure’ and favour reactions with a negative activation volume −Vact (a decrease in volume between the reactant and TS).32,33
A number of Cope rearrangements have been reported to exhibit a negative activation volume. The Cope rearrangement of meso-2,3-diphenyl-1,5-hexadiene has been experimentally evaluated to have Vact = −13.3 or −8.8 cm3 mol−1 for the reactions forming E,Z or E,E products respectively.34 The Cope rearrangement of 1,4-diphenyl-1,5-hexadiene has been experimentally measured to have Vact = −9.1 cm3 mol−1.35 The activation volume of the Cope rearrangement of 1,5-hexadiene has been computationally evaluated using the XP-PCM method at the B3LYP/6-31G(d) level and found to have a negative activation volume Vact = −14 cm3 mol−1.35 The lack of H-bonding and potential negative Vact of reactions A and B make these reactions good candidates to exhibit ‘solvent pressure’ effects.
In this work, the mechanism for the Cope rearrangements of reactions A and B are explored computationally. The volume of activation is evaluated to establish whether a negative activation volume is possible and the potential impact of internal ‘solvent pressure’ is discussed. The generalised effect of a range of solvents (acetonitrile, benzene, ethanol and [C4C1im][NTf2]) on the reaction energies of reactions A and B are examined. The impact of benzene and the IL [C4C1im][NTf2] on reaction B is studied in more detail to provide insight into the basis for the rate enhancement of the Cope rearrangement. Specific solvent interactions are explored through NBO charges, molecular orbitals, bond critical point analysis, NCI plots, ESP differences and Δρ(r) plots. Overall, our aim is to further expand understanding of the impact of IL van der Waals interactions, dispersive contributions, electron delocalisation and polarization on non-polar reactions.
Methodology
Computational
Calculations were primarily carried out using Gaussian16 (G16).36 The B3LYP functional with Grimme's D3 dispersion correction and Becke–Johnson damping (GD3BJ) was employed with 6-311+G (d,p) basis sets, “B3LYP” will be used to identify calculations at the B3LYP-D3BJ/6-311+G(d,p) level.37 The lowest energy conformer for each reactant, TS, and product in the gas-phase and respective solvents was subsequently optimised and evaluated using M06-2X-D3/6-311+G(d,p), identified as “M06-2X” calculations.38 The choice of DFT functional was further checked against reaction B reactant to TS in the gas-phase employing the M06-L and PBE0 (BPE1PBE0) functionals.39,40 Both M06-L and PBE0 have previously been determined to be good functionals of their class in DFT benchmark studies of pericyclic reactions.41,42For all G16 calculations, the SCF convergence on the energy is 10−8 a.u. and on the RMS density matrix is 10−10 (SCF = conver = 10). All optimised minima and transition states were confirmed via frequency calculations to have 0 or 1 imaginary frequency respectively. TS were confirmed by IRC scans.
A small subset of single point energy calculations were also undertaken (on B3LYP-geometries) using Orca 5.0.3.43–45 Recently IL interactions have been benchmarked for the domain-based local pair natural orbital coupled-cluster method DLPNO-CCSD(T) with noted recovery of dispersion and correlation and are known to reach 1 kJ mol−1 accuracy.46 DLNPO-CCSD(T) calculations were carried out with cc-pVTZ basis sets, with convergence on the energy to 10−8 a.u. and on the RMS density 5.0 × 10⁻⁹ (tightSCF). Cut-off parameters TCutPairs = 10−5, TCutPNO = 10−9 and TCutDO = 5.0 × 10⁻³ (tightPNO), were employed as was the resolution of the identity approximation (RIJCOSX) with def2 auxiliary basis sets.
Specific DFT and CCSD(T) energies were basis set superposition error (BSSE) corrected using the counterpoise correction of Boys and Bernardi.
Multiple conformers were explored for the reagents and products, details can be found in the ESI,† Section S2. Conformer searches were performed using the conformer–rotamer ensemble sampling tool (CREST) within xTB version 6.4.1 at the GFN2-xTB level.47 The conformer/rotamer ensemble (CRE) sorting algorithm CREGEN was then employed to isolate conformers from simple rotamers. The conformers obtained where subsequently optimized at the B3LYP level, conformers with identical or near identical energy were visualised and compared using a quaternion based orientation method in Jmol and only unique conformers retained.48 The lowest Gibbs free energy conformer was used to evaluate reaction energies and for the other DFT functional and CCSD(T) calculations.
Multiple conformers are also possible for the transition state (TS), details can be found in the ESI,† Section S3. For each Cope reaction the TS can take on a boat or chair arrangement and the Pr or Ph substituents can take on an equatorial or axial configuration, leading to 4 TS conformers. Rotation of the Ph substituent through a relaxed scan was also explored, and a barrier of 25 kJ mol−1 was determined.
All reactions were subsequently evaluated employing the generalised solvation model based on density (SMD).49 The solvents employed were acetonitrile, benzene, ethanol and [C4C1im][NTf2]. Internal parameters for SMD within G16 were employed for acetonitrile, benzene and ethanol. The following parameters were employed for the IL [C4C1im][NTf2], ε = 11.52, n2 = 2.0366, γ = 53.97 α = 0.259 β = 0.238 φ = 0.1200 and ψ = 0.2400.50 Optimised gas-phase structures where solvated, re-optimised and confirmed by frequency analysis.
Volumes were evaluated using AIMALL51 and JMol.48 AIMALL divides the electronic density into basin regions (based on the gradient vector field) for each atom, for atoms on the periphery an iso-density limit is taken (0.001 electrons Bohr−3). The defined atomic volume is then integrated and summed to determine the molecular volume. In Jmol the option “resolution 20 solvent 0” was employed. Solvent determines a molecular surface from the outer edge of a hard sphere probe rolled over the molecule represented as spheres of a given van der Waals radius. A radius of 0 Å for the probe (ie delivering a volume defined by the van der Waals radius) and a resolution of 20 points per Å was employed.
Selected B3LYP structures were analysed in detail. NBO analysis52 and MOs where computed. Bond critical points were generated using AIMALL, NCI plots were generated using NCI-plot53 and visualised with VMD.54 Density and ESP differences were generated using the cubegen utility of G16 and visualised using Gaussview6 and VMD.
Experimental
The ILs were prepared according to known literature procedures (see ESI,† Section S1 for detailed procedures).55 3-Phenyl-1,5-hexadiene was prepared in a 2-step synthesis according to literature (see ESI,† Section S1 for detailed procedures).25 The Cope rearrangement reactions were run in pressure tubes at concentrations of approximately 0.02 mol L−1 at 150 °C for 17 h. The product was quantified by HPLC using naphthalene as an internal standard (ESI,† Section S14).Results and discussion
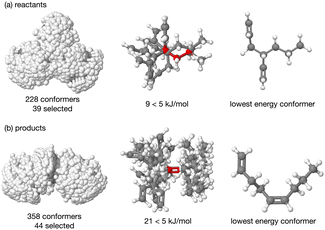
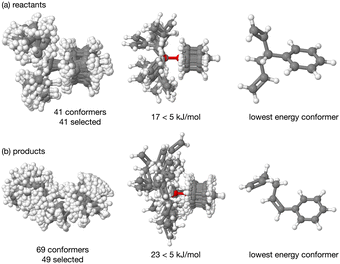
Structures and energies for reactions A and B
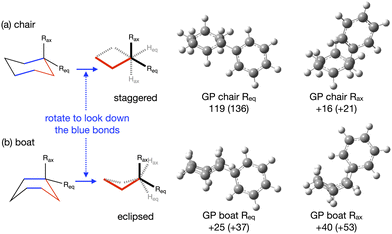
The energy profile, reactants, transition states (TS) and products, for reactions A and B have been evaluated. A large range of conformers is possible for both the reactants and products, a description of the search procedure and computational details can be found in the Methods section and the CREST data can be found in the ESI,† Section S2. The number of CREST conformers obtained for the reactant and product of each reaction is shown in Fig. 2 for reaction A (R = Pr) and Fig. 3 for reaction B (R = Ph), as is the number of conformers selected for B3LYP analysis and the number of conformers within 5 kJ mol−1 of the lowest energy structure, in addition the lowest energy structure obtained at the B3LYP level is depicted.The TS structures of reactions A and B can have 4 possible conformers; the ring can exist in chair or boat forms and the R substituent can take on an equatorial or axial alignment. The chair-Req, chair-Rax, boat-Req and boat-Rax forms are depicted in Fig. 4 for reaction B (R = Ph). Computational details can be found in the Methods section and in the ESI,† Section 3. For both reactions the chair TS is favoured over the boat conformer due to the bulky substituents being forced into a less favourable (eclipsed) position in the boat conformer. The relative energy (ΔE) and Gibbs free energy (ΔG) of the different TS conformers (reactions A and B) has been compared for B3LYP and M06-2X methods in the gas-phase, and in acetonitrile, benzene, ethanol and [C4C1im][NTf2], ESI,† Section S3 and Tables S3.1–S3.4. The (B3LYP) Gibbs free energy has been evaluated at the reaction temperature of 150 °C and no re-ordering of TS conformers occurred at the higher temperature of 423.15 K, ESI,† Section S3 and Tables S3.5–S3.8.
The lowest Gibbs free energy B3LYP reactant, TS and product conformers have subsequently been employed. The B3LYP reaction Gibbs Free energy profiles for reactions A and B in the gas-phase, benzene and IL [C4C1im][NTf2] are given in Fig. 5.
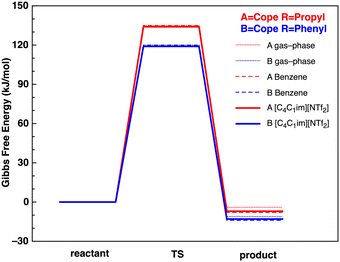 | ||
| Fig. 5 Reaction Gibbs free energy profiles (kJ mol−1) at the B3LYP level in the gas-phase (solid thin lines), benzene (dashed lines) and IL [C4C1im][NTf2] (solid thick lines). | ||
Reactions A and B have been evaluated using the B3LYP and M06-2X methods in the gas-phase, and in acetonitrile, benzene, ethanol and [C4C1im][NTf2] at room temperature (T = 298.15 K), ESI,† Section S4 and Tables S4.1–S4.4. Structures optimised in the gas-phase and with SMD are near identical. Thermochemical data (ΔE, ΔH, ΔG, TΔS) for all reactions can be found in the ESI,† Section S4. Reactions have also been evaluated at the B3LYP level at the experimentally employed reaction temperature 150 °C (T = 423.15 K), ESI,† Section S4 and Tables S4.5–S4.6. A range of functionals was employed to ensure TS energies recovered by B3LYP were reasonable. The gas-phase ΔE and ΔG for reaction B, and previously evaluated RMSD barrier heights,42 are reported for the B3LYP, M06-2X, M06-L and PBE0 DFT functionals, ESI,† Section S4 and Table S4.7. Solvation Gibbs free energies ΔGsolvent − Ggas-phase are reported in ESI,† Section S5.
The reaction enthalpy (ΔHreact) borders on the accuracy of the DFT methods employed; the product is more stable by 1–15 kJ mol−1. Stabilisation comes from the formation of an internal double bond in the product, vs. a terminal double bond in the reactant. The slightly more negative ΔHreact for reaction B, R = Ph, can be rationalised as due to stabilisation and extension of the conjugated π-system through the phenyl ring in the product.
The activation energy Ea ranges from 115–132 kJ mol−1 at the B3LYP level and 129–144 at the M06-2X level (EaTable 2), and is slightly higher for the R-Pr compared to R-Ph Cope rearrangement. The energies obtained match values from literature for the rearrangement of similar compounds. The Ea of 3-phenyl-1,5-hexadiene has previously been reported as 136 kJ mol−1 in hexane (determined experimentally).56 Computational data for a variety of phenyl substituted 1,5-hexadiene compounds has given Ea in the range 109–161 kJ mol−1 depending on the exact nature and position of the substituents.57 The Ea of the parent rearrangement (unsubstituted 1,5-hexadiene) is reported as 139–144 kJ mol−1.58,59 The generalised SMD model for different solvent environments indicates a solvent stabilisation of the transition state ΔETS,solv ≈ 20 kJ mol−1 for reaction A and ≈33 kJ mol−1 for reaction B (Table 2). However, solvent stabilisation is similar for all the reactants, TS and products, leading to minimal solvent based stabilisation of ΔEa,solv = 1–3 kJ mol−1 across all the solvents examined (Table 2).
| Energy (kJ mol−1) | Reaction A (R-Pr) | Reaction B (R-Ph) | ||||||
|---|---|---|---|---|---|---|---|---|
| E a | E a | ΔETS,solv | ΔEa,solv | E a | E a | ΔETS,solv | ΔEa,solv | |
| Method | B | M | B | B | B | M | M | B |
| Gas phase | 132 | 144 | — | — | 118 | 134 | — | — |
| MeCN | 130 | 141 | −22 | −1 | 116 | 130 | −37 | −2 |
| Benzene | 131 | 141 | −23 | −1 | 116 | 131 | −33 | −2 |
| Ethanol | 129 | 140 | −21 | −2 | 115 | 129 | −32 | −3 |
| IL | 130 | 140 | −17 | −2 | 115 | 129 | −29 | −3 |
For reaction B, the variation in Ea from benzene to the IL [C4C1im][NTf2] is minimal, despite the IL solvent showing the highest experimental rate increase. The 10× rate enhancement of the Cope rearrangement of 3-phenyl-1,5-hexadiene (reaction B) equates to a 6 kJ mol−1 reduction in Ea. Thus, our results indicate that using different solvent parameters to generate generalised solvent environments (see methodology) does not explain the observed differences in reaction rate, especially for the IL [C4C1im][NTf2]. Other sources of potential impact on Ea are ‘solvent pressure’ or specific solute–solvent interactions, both of which will be investigated in the following sections.
Keaveny et al.,25 showed that the extent of conversion for reaction B is larger than A in the IL (71 ± 4% vs. 56 ± 1% respecitvely) but due to a limited supply of the reagent for reaction A (3-propyl-1,5-hexadiene) they only carried out kinetic experiments on reaction B. To maintain a strong connection to experimental data and to limit the computational expense we now focus exclusively on the details for reaction B.
Volume analysis
High internal ‘solvent pressure’ is thought to favour reactions with a negative activation volume (negative Vact) and other Cope rearrangements are known to have a negative Vact. We need to establish whether reaction B has a negative activation volume. The activation volume Vact = Vreactant − VTS has been assessed via two methods, as the sum of integrated atomic basins (AIMALL), or integration of a solvent van-der-Waals defined excluded volume (JMol), more details can be found in the Methods section.For reference purposes a reaction (reaction C) of known negative Vact was evaluated first. Reaction C is the Cope rearrangement of 1,4-diphenyl-1,5-hexadiene and has been experimentally measured to have Vact = −9.1 cm3 mol−1 (Fig. 6).34,35 Reference reaction C was computationally examined in a similar manner to reaction B, CREST data and conformers are given in the ESI,† Section S6.
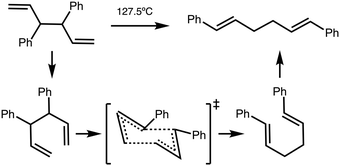 | ||
| Fig. 6 Cope rearrangement of reaction C.35 | ||
Conformational changes can have an effect on the molecular volume. Therefore, multiple starting conformers were examined from the CREST analysis and unique conformers of reaction B and reference reaction C within 5 and 10 kJ mol−1 (at the B3LYP-D3BJ/6-311+G(d,p) level) of the lowest energy conformer were evaluated and the average taken (ESI,† Section S7). In contrast to the flexible starting materials, the cyclic TS of the Cope reaction is highly constrained and single TS conformers were examined.
The average volumes determined for reactants within 5 kJ mol−1 of the lowest energy structure for reaction B and reference reaction C using AIMALL are given in Table 3, along with the volume of the minimum energy conformer and the evaluated activation volumes. A negative Vact is confirmed for the reference reaction C, and a negative Vact of similar magnitude is found for reaction B. Thus, there is potential for the negative Vact of reaction B to contribute to the observed rate enhancement in the IL compared to benzene.
| V ave (cm3 mol−1) | V react (cm3 mol−1) | V TS (cm3 mol−1) | V act(ave) (cm3 mol−1) | V act(min) (cm3 mol−1) | |
|---|---|---|---|---|---|
| B | 147.0 ± 0.5 | 146.8 | 145.1 | −1.9 | −1.8 |
| C | 204.4 ± 0.7 | 205.0 | 203.3 | −1.2 | −1.7 |
Volume analysis using Jmol also returned a negative Vact (ESI,† Section S7). The Vact values delivered by AIMALL and JMol differ in magnitude compared to experimental values due to the different methodologies employed, however qualitatively the results are consistent.
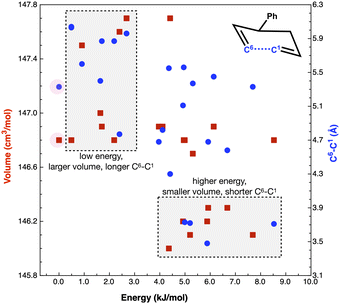
Concurrent with a high internal ‘solvent pressure’ favouring smaller TS, low volume starting conformers could be expected to be preferentially adopted. If the low volume conformers link more readily to the low volume TSs, reaction rates could be enhanced. The TS of reaction B requires C1 and C6 to come into proximity (Fig. 7) to form the new bond (r(C1–C6) = 2.21 Å in the product). Thus, low volume reactant conformers with a shorter r(C1–C6) may be favoured through solvent pressure, enhancing reactivity.
Fig. 7 plots reaction B reactant conformer volumes against conformer energy. Two regions are identified, low energy conformers that tend to have a larger volume, and higher energy conformers that tend to have a smaller volume. Sorting reaction B reactant conformers to mutually minimize volume and r(C1–C6) delivers 2 conformers with energies of 5 and 6 kJ mol−1. Thus, the high ‘solvent pressure’ IL could lead to reactant pre-organisation by favouring conformers with a smaller volume, with potential to lower Ea by ≈5 kJ mol−1.
The computed volume of the TS (145 cm3 mol−1) is still smaller than the ‘smallest’ reactants (146 cm3 mol−1). Individual plots of energy vs. volume and energy vs. r(C1–C6) and a interpolated surface map of (x, y) volume, (r(C1–C6)) with energy on the z-axis can be found in the ESI,† Section S7.
Internal solvent pressure discussion
Volume effects on a reaction are connected to changes in the solvent cavity occupied by the reacting species. Forming a cavity requires pushing solvent molecules apart against ‘solvent pressure’. Experimental parameters linked to the concept of ‘solvent pressure’ are cohesive energy (ce), cohesive energy density (ced) and internal solvent pressure Pint.31,60,61 ce, ced and Pint are all concepts related to the strength of intermolecular interactions within a liquid. The ce of a liquid is the change in internal energy required to separate 1 mol of the liquid into a saturated vapour (assuming negligible intermolecular interactions in the vapour), thus this is the internal energy of vaporization ΔvapU.60 ced is the internal energy of vaporization divided by the molar volume, (ΔvapU/Vm). Pint is the change in internal energy with respect to small volume changes at a constant temperature, (dU/dV)T.31 Pushing solvent molecules apart to from a larger cavity, is just the start of a dissociation process.A complexity arises with ILs because ced is hard to determine experimentally due to the difficulty of vaporising ILs; the reported ced is often related to the vaporization of neutral ion-pairs cedIP.60 The cedIP of ILs is similar to ced of molecular liquids. In both cases neutral species are formed, and the molecule–molecule or ion-pair–ion-pair interaction energies are not large. An alternative is to separate the IL into isolated ions. A vapour of isolated ions is not stable, nevertheless, cedions can be obtained with the aid of calculations. cedions is significantly larger than cedIP representing the much larger Coulombic ion–ion interaction energies for ILs, Table 4.
![[thin space (1/6-em)]](https://www.rsc.org/images/entities/char_2009.gif) ref. 60, b
ref. 60, b![[thin space (1/6-em)]](https://www.rsc.org/images/entities/char_2009.gif) ref. 62, c
ref. 62, c![[thin space (1/6-em)]](https://www.rsc.org/images/entities/char_2009.gif) ref. 63, otherwise molecular solvent data at 25 °C from d
ref. 63, otherwise molecular solvent data at 25 °C from d![[thin space (1/6-em)]](https://www.rsc.org/images/entities/char_2009.gif) ref. 64, e
ref. 64, e![[thin space (1/6-em)]](https://www.rsc.org/images/entities/char_2009.gif) ref. 31, f
ref. 31, f![[thin space (1/6-em)]](https://www.rsc.org/images/entities/char_2009.gif) ref. 65
ref. 65
| k 1 (10−7 s−1) | ced (kJ mol−1) | cede (J cm−3) | P int e (J cm−3) | γ f (mN m−1) | |
|---|---|---|---|---|---|
| Benzene | 6.2 | 28 | 353 | 370 | 28.21 |
| Ethanol | 7.7 | 37 | 679a | 282 | 21.91 |
| MeCN | 16.1 | 31 | 881 | 402 | 28.66 |
| [C4C1im][NTf2] | 61.6 | 134a | 457a (IP) | 361b | 33.60c |
| 1650a (ions) |
As noted by Keaveney et al.,25 the rate of reaction B in the solvents studied does not correlate well with cedIP or Pint and we found no correlation with γ (surface tension), Table 4. Of the parameters examined, ce and cedions have a possible link to the observed rate enhancement, Fig. 8. Why do Pint and cedIP not correlate with the reaction rate, while ce and cedions do?
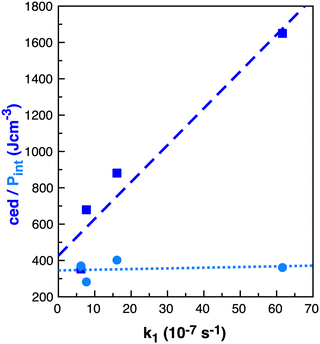 | ||
| Fig. 8 Properties ced (J cm−3) dark blue squares and Pint (J cm−3) light blue circles relative to k1 (10−7 s−1)25 in benzene, ethanol, acetonitrile and [C4C1im][NTf2] for reaction B. | ||
The difference between ce and Pint is that Pint is related to small increases in the distances between molecules without major disruption to intramolecular interactions, while ce describes breaking all intramolecular interactions.60 Thus, Pint is based on small local volume changes. IL ions, like molecular solvents, can rearrange around a solute for a moderate cost in energy and thus ILs have a similar Pint to the molecular solvents.
How do we consider the difference of cedIP (related to the separation of one ion pair from another ion pair) and cedions (related to the separation of two oppositely charged ions) in terms of the solvation of a solute and reaction rate enhancement? If changes in volume of the solute can be easily accommodated within an IL by ion-pairs moving together to allow cavity formation then cedIP is similar to that of neutral molecular solvents, Fig. 9(a).
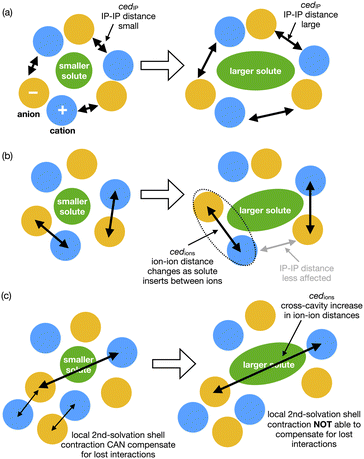 | ||
| Fig. 9 Cartoons representing conceptual differences between (a) ced(IP) and (b) ced(Ions), and (c) representing second shell solvation effects. | ||
However, the rate of the studied Cope reaction is much faster in the IL and follows the trend of cedions, this implies that the larger solute induces increased inter-ion distances, as opposed to ion-pair distances. A larger solute might force the individual ions apart, Fig. 9(b) and for non-polar solutes this is destabilising, due to the inability of solute–ion interactions to compensate for the loss of ion–ion Coulombic interactions. For small solutes second solvation-shell ions could undertake small displacements moving closer to first solvation-shell ions to compensate for the loss of ionic interactions. These are shorter-range changes in-line with Pint, Fig. 9(c). For larger solutes the second solvation shell adjustments may not be sufficient to compensate for the more significant loss of cross-cavity ion–ion interactions, destabilising the system. Coulomb interactions are long range within an IL, and cross-cavity solute separated interactions are longer range than those encompassed by Pint. Thus, we hypothesise that shorter cross-cavity inter-ion distances associated with a negative Vact can reduce the destabilisation due to lost Coulomb interactions in an IL and can be considered as a reduced solvophobic effect.
In summary, there is potential for TS volume effects to contribute to the rate enhancement of reaction B within an IL. There is also potential for stabilisation of reactant conformers with a smaller volume and slightly higher energy. However, less clear is how these small local changes in volume relate to the cohesive energy rather than the internal pressure. For the cohesive energy to be important, the larger solute (reactant) must be increasing the separation between ions relative to the smaller solute. One concept is that smaller solvent cavities could allow for increased solute-separated Coulomb interactions and hence stabilise the Cope TS more in the IL than in molecular solvents.
Specific solvent solute interactions
The applicability of a polarisable continium representation of the solvent breaks down when strong solute–solvent interactions occur. Due to the uncharged nature of the reaction we do not expect strong interactions, but there is potential for the IL ions to influence the reaction rate through interaction with the TS. We expect weak interactions as the 10 times rate enhancement is indicative of stabilisation of only 6 kJ mol−1. Probing potential interactions of the IL with the TS via a single IL ion pair has the advantage of localising and maximising such interactions and simplifying the computational study. We would expect the strength of interactions identifed to be reduced within a fully solvated environment. Neverthelss movement of solvent molecules over time can result in localisation of charge and stronger interactions for short periods of time, and these effects can be important as reaction drivers.Specific interactions between [C4C1im][NTf2] and the reaction B TS chair-Req conformer have been explored, details of individual structures can be found in the ESI,† Section S8. Four low energy conformers of the ion-pair [C4C1im][NTf2] were optimised in the gas-phase, with the anion [NTf2]− ranging over top and front positions, with cis or trans CF3 groups and with the butyl arm of [C4C1im]+ in different orientations, ESI,† Fig. S8.1. The lowest energy [C4C1im][NTf2] structure was selected to interact with the reaction B TS.
Conformers were formed allowing the cation front C2–H and anion O-atoms to interact with the bond making/breaking area of the TS, and with the Ph ring, both above and to the side, ESI,† Fig. S8.2. Structures allowing the cation to primarily interact with the TS (anion ‘spectator’), the anion to primarily interact with the TS (cation ‘spectator’) and for both the cation and anion to interact with the TS were tested. Structures with the cation rotated so the rear C4–H, C5–H could interact with the TS were also considered. Conformers with the IP above or to the side of the TS were explored. Two conformers splitting the cation and anion were also attempted, but as expected these converged to an ion-pair, confirming that it is unlikely an uncharged solute would separate the ions associated as an IP.
Optimisation was performed, first with a fixed TS allowing the IL to freely optimise, subsequently the TS structure was released and a full TS-optimisation completed (denoted TS-IL). Structures were confirmed as a TS by a single imaginary frequency associated with the Cope bond making/breaking process. The presence of the generalised solvent had no effect on the negative TS mode −463 cm−1 (isolated TS in gp, and benzene or IL SMD) and was only slightly reduced in the presence of the explicit IL ion-pair in TS-IL, −458 cm−1.
A similar process was followed for the reaction B lowest energy reactant and [C4C1im][NTf2] (R-IL ESI,† Fig. S8.3), and for 2-benzene molecules (ESI,† Fig. S8.4) interacting with the reaction B TS (TS-2Bz ESI,† Fig. S8.5) and reactant (R-2Bz ESI,† Fig. S8.6). In each case the lowest energy conformer was selected for further analysis. Each TS cluster was subsequently optimised (and confirmed by frequency analysis) in the generalised SMD IL or benzene solvent environment. Only very minor changes in the geometry occur from the gas-phase to SMD solvated structures, ESI,† Fig. S9.1.
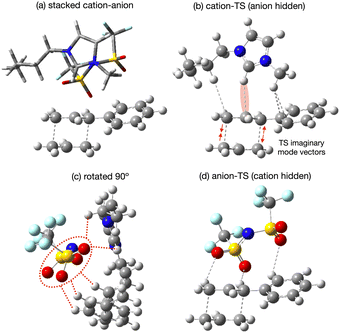
The lowest energy TS-IL conformer identified has the IP ‘above’ the forming bonds and Ph group of the TS (Fig. 10a). The imidazolium cation interacts with the TS, the C2–H pointing towards the centre C-atom of the TS π-bond (Fig. 10b), the bond breaking/forming C-atoms either side are moving, opening and closing along the forming bond in the TS imaginary mode. The anion is situated above the ring of the imidazolium cation with the N-atom located above the imidazolium C2-atom (Fig. 10c). The O-atoms of the [NTf2]− are interacting with H-atoms from the cation side-chains and the TS phenyl and reactive site (Fig. 10d). The reactant-IL clusters exhibit similar features, the imidazolium C2–H interacting with the reactant, the [NTf2]− N-atom above the imidazolium ring, with O-atoms also interacting with the reactant.
From all the optimised structures obtained it is clear that neither the reactant nor the TS penetrate between the cation and anion. However, the presence of the solute does affect the cation-C2 to anion-N distance r(CA), relative to the optimised ion-pair, for the lowest energy structures, there is an increase in r(CA) for the reactant (+0.50 Å), but not the TS (−0.03 Å). Hence, there is a larger ion–ion separation upon interaction with the reactant.
The energy of association Eass = Ecluster − (ETS + Esolvent) has been evaluated, Table 5. ΔH and ΔG are given in the ESI,† Table S9.1. Eass is larger than expected (≈40 kJ mol−1 at the B3LYP level) for both benzene and the IL, demonstraiting the importance of electron polarisation effects. Interactions are weaker within a generalised solvent environment (B3LYP-SMD). However, natural fluctations within the liquid phase could be expected to result in short periods of time were closer association with a particular ion-pair occurs. For benzene Eass remains approximately the same for both the reactant and the TS at all levels. In contrast, for the IL Eass is significantly stronger in the TS (54 kJ mol−1 at the DLNPO-CCSD(T) level) compared to the reactants (30 kJ mol−1) for all methods.
| Method | IL, Eass (kJ mol−1) | 2Bz, Eass (kJ mol−1) | ||
|---|---|---|---|---|
| Reactant | TS | Reactant | TS | |
| B3LYP (min) | −37 | −59 | −37 | −45 |
| B3LYP-SMD (min) | −27 | −40 | −30 | −30 |
| M06-2X (min) | −47 | −67 | −48 | −49 |
| B3LYP (cluster) | −52 | −81 | −42 | −47 |
| B3LYP-SMD (cluster) | −31 | −47 | −30 | −31 |
| B3LYP (cluster, BSSE) | −43 | −70 | −38 | −43 |
| CCSD(T) (cluster) | −40 | −73 | −36 | −40 |
| CCSD(T) (cluster, BSSE) | −30 | −54 | −27 | −30 |
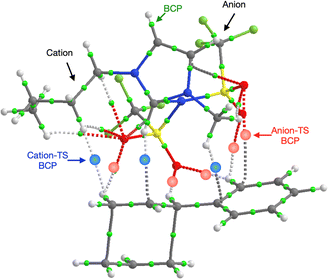
Further investigation of the specific TS-IL and TS-2Bz cluster interactions was conducted using electron density and charge based methods. Covalent interactions are minimal, molecular orbital analysis identified only minor orbital interactions between the IL and TS. AIM analysis reveals multiple weak bond critical points (BCPs) ρ(r) ≤ 0.011, between the cation and TS, and anion and TS (Fig. 11 and ESI,† Section S10). Importantly, both the cation and anion are interacting with the TS.
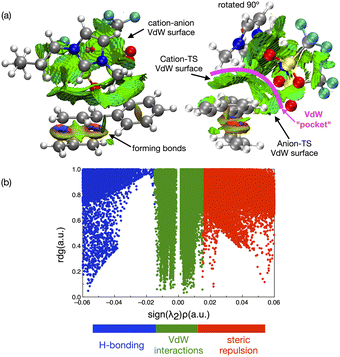
In contrast to the weak covalent interactions, non-covalent interaction (NCI) plots exhibit strong van der Waals (VdW) interactions between each of the IL ions and the TS, Fig. 12 (green). Weak H-bonding (blue) and significant steric repulsion (red) are also evident. The IL cation and anion VdW interaction surfaces form a pocket within which the TS sits. Additional NCI plots showing theVdW interactions from different perspectives can be found in the ESI,† Section S11.
Both the NCI plots and AIM BCP analysis reveal interactions with the TS along the entire front of the imidazolium cation, stretching from the butyl chain on one side to the methyl chain on the other side. In addition, extensive interactions between the O-atoms of the anion and the TS (in the bond breaking/forming region and the phenyl side chain) are evident. Thus, the cation and anion together form a VdW pocket for the TS.
The TS and IL ions are well matched in terms of size and optimal structural alignment for interaction. We rationalise that an IL with smaller ions would not be able to create a similarly extended region of VdW interaction. An IL with larger ions, could not substantially extend the VdW interaction because all of the TS is already participating. Thus, in terms of selecting an optimal IL for a reaction, we anticipate that a good size match between the IL ions and TS species is required to maximally stabilise a TS and hence accelerate a reaction.
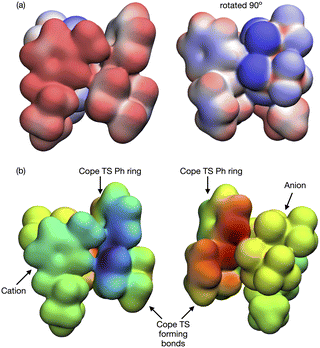
As expected, natural bond orbital (NBO) partial charge analysis shows minimal electron redistribution on atomic centers (ESI,† Section S12). A map of the electrostatic potential energy (ESP) onto the 0.007 a.u. density surface shows that polaraisation is evident within the TS-IL [C4C1im][NTf2] cluster, Fig. 13(a). A map of the ESP difference, ΔESP = ESPcluster − (ESPTS + ESPsolvent), mapped onto the 0.007 a.u. density iso-surface shows a clear change in polarisation on the formation of the TS-cluster, Fig. 13(b). The two images show the TS from either side, the cation generating a negative ΔESP on one side and the anion genearting a positive ΔESP on the other side of the TS. ESP difference images for the SMD solvated cluster are given in the ESI,† Fig. S14.1.
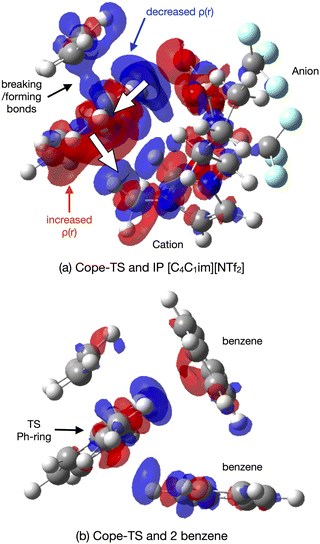
The origin of the TS-IL polarisation is further revealed in the electron 0.004 a.u. density difference iso-surface plot Δρ = ρcluster − (ρTS + ρsolvent) of Fig. 14(a), and ESI,† Fig. S13.1 gives the more extensive 0.002 a.u. iso-surface and comparative images for the SMD solvated clusters are given in the ESI,† Fig. S13.2. Anion ρ(r) is polarised towards the TS (σ-frame), and cation ρ(r) is polarised away from the TS (π-frame) causing a ‘push–pull’ polarisation of ρ(r) within the TS. Polarisation in the TS–benzene cluster is substantially less, Fig. 14(b). The polarisable ions of the IL, and the dual nature of the IL (positive and negative ions) has allowed the IL to stabilise the TS via a push–pull mechanism acting on the electron density. These effects are reduced, particularly for the IL, in the solvated cluster.
The importance of the VdW surfaces and electron polarisation indicates that polarizability parameters could provide a useful quantitative measure correllating with TS stabilisation and reaction rate enhancement. The experimental Kamlet–Taft π* parameter for the solvents examined is given in Table 1, computed polarizability (α) and π* are plotted relative to the rate constant k1 in Fig. 15. For the small number of data points available, α offers a better qualitative link with k1 than the Kamlet–Taft parameter π*.
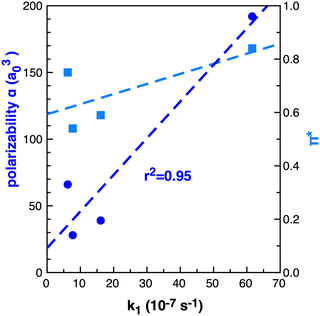 | ||
| Fig. 15 Computed (B3LYP) dipole polarizability (α) a03 dark blue circles and Kamlet–Taft π* light blue squares relative to k1 (10−7 s−1)25 in benzene, ethanol, acetonitrile and [C4C1im][NTf2] for reaction B. | ||
The computed polarizability of 2 interacting benzene (2Bz) molecules is additive, α(Bz) = 66 a03 and α(2Bz) = 133 a03, as is the polarizability of the IL ions, α(C + A) = 100 + 95 = 192 a03 where α(IP) = 195 a03. Ethanol and MeCN have α of 31 and 27 a03 respectively. The IL demonstrates an increase in polarizability of ≈60 a03 relative to benzene. Thus, we anticipate that a calculation of the individual IL ion α can provide a first estimate of the effectiveness of an IL to accelarate non-polar reactions. The computed polarizability of the TS–solvent clusters for TS-2Bz and TS-IL are α = 285 and 347 a03 respectively, and also exhibit a Δα ≈ 60 a03.
In summary, the cation and anion act together to form a VdW pocket in which the TS sits. We have rationalised that a good match between the TS and the size/shape of the IL ions is important to maximise the VdW interactions and induction (polarisation) effects on the TS. Both the cation and anion interact directly with bond breaking/forming region and the phenyl substituent of the TS. The electron density of the TS is anisotropically polarised by the ions of the IL, stabilising the TS relative to other solvents via a push–pull mechanism. We concluded that the computed α of the solvent may offer a useful handle for solvent selection.
Experimental screening of ionic liquids
Further insight into IL–solute interactions can be gained from considering a variety of ILs. The original work by Keaveney et al. used NMR experiments and studied the effect of one IL, [C4C1im][NTf2].25 Reaction B has been run in 5 different ILs and in acetonitrile as a reference molecular solvent. The percentage of converted product was measured after 17 h at 150 °C using HPLC. The ILs examined vary the anion for a fixed [C4C1im]+ cation, and vary the cation for a fixed [NTf2]− anion, [C4C1im][OTf], [C4C1im][NTf2] [C4C1C1im][NTf2] [C4C1pyrr][NTf2] and [C8C1im][NTf2] Fig. 16(a) and Table 6. A significant increase in conversion (relative to the molecular solvent) is observed for all the ILs studied, but changes between different ILs are subtle (of the order of 4%).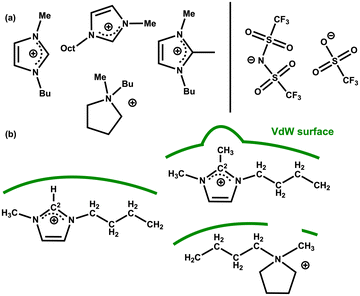 | ||
| Fig. 16 (a) Cations and anions of the IL solvents screened for the rearrangement reaction B (b) selected cation structures with representation of the differing VdW surfaces (green lines). | ||
| Average conversion (%) | IP α (a03) | |
|---|---|---|
| MeCN | 4.7 | 27 |
| [C4C1im][OTf] | 14.9 | 149 |
| [C4C1im][NTf2] | 17.8 | 195 |
| [C4C1pyrr][NTf2] | 14.2 | 201 |
| [C4C1C1im][NTf2] | 17.0 | 208 |
| [C8C1im][NTf2] | 13.2 | 247 |
The polarizability α = αcation + αanion of the selected ILs has been computed, Table 6. An increase in reaction yield is observed for an increase in anion α. However, for the cation α changes are more subtle and do not correlate with reaction yield. The cations examined (except [C8C1im]+) are of a similar size but with slightly different chemical structures.
We rationalise that the molecular structure of the cation is having a larger effect than α. For [C4C1im]+ a VdW surface forms across the whole ‘front’ of the cation (including alkyl chains). In [C4C1C1im]+ the methyl group at the C2 position protrudes and could interfere with the formation of the VdW pocket. In [C4C1pyrr]+ the ring is not aromatic and a gap will form at the N-atom again interfering with the formation of the VdW pocket, Fig. 16(b). For [C8C1im][NTf2] we rationalise that the reduced conversion (compared to [C4C1im][NTf2]) stems from the presence of nanoscale domains that occur in ‘long chain’ (R = CnH2n+1) n > 4 imidazolium-based ILs.18 As discussed above, the reactivity of the substrate is increased in the ionic domains, while in the lipophilic hydrocarbon domains the substrate does not experience beneficial polarization. Overall, these results highlight a consistent increase in reaction rate for the ILs examined, moderated slightly by structural and VdW/dispersion effects due to the individual IL ions.
Conclusions
The non-polar and highly concerted Cope rearrangement of 3-propyl-1,5-hexadiene (reaction A R = Pr) and 3-phenyl-1,5-hexadiene (reaction B R = Ph) have been studied. Conformer variation in the reactants, TSs and products has been explored using the CREST algorithm followed by DFT optimisation at the B3LYP-D3BJ/6-311+G(d,p) and M06-2X-GD3/6-311+G(d,p) levels. The reactions have been evaluated in a range of molecular solvents (benzene, ethanol and acetonitrile) and compared to the IL [C4C1im][NTf2].Experimentally, a 10× rate enhancement of reaction B is observed for the IL [C4C1im][NTf2] compared to benzene, this equates to a 6 kJ mol−1 reduction in the activation energy Ea. However, no significant effect on Ea was determined when a generalised solvent model was employed. This led us to investigate other sources of potential impact on Ea, first volume effects and then specific interactions between the solute and solvent.
Negative activation volumes are favoured in solvents with higher ‘solvent pressure’. We identified two potential mechanisms for volume effects to contribute to the rate enhancement of reaction B within an IL. We determined that the Cope reaction B has a similar negative activation volume to the Cope rearrangement of 1,4-diphenyl-1,5-hexadiene, reaction C. Greater solvent destabilisation in the reactant is thus thought to facilitate the formation of the TS. Moreover, we identified a group of reactant conformations with a smaller volume, and closer r(C1–C6) arrangement (where is C1–C6 the forming bond). In the gas-phase these conformers had an energy lying ≈5 kJ mol−1 above the lowest energy conformer, but could be expected to be stabilised in a solvent with a higher ‘solvent pressure’.
The term ‘solvent pressure’ is usually loosely taken to be the resistance of a solvent to the formation of a solute cavity. IL are intuitively thought to have a high ‘solvent pressure’. Several properties that could be expected to have a correlation with this process were discussed; cohesive energy (ce), cohesive energy density (ced) and internal solvent pressure Pint. We explored why only ce, or the less well known cedions, might have a correlation with the rate enhancement observed. Pint relates to small changes in volume to which the IL can adapt easily by 2nd solvation shell screening and movement of ‘ion-pairs’. Larger solute volumes more effectively dissociate ‘cross-cavity’ ions, creating a solvophobic effect as the solvent is destabilised.
Direct reactant/TS interactions with an IL ion-pair or 2-benzene molecules was explored. We found that the cation and anion together form a VdW pocket in which the TS sits. Both the cation and anion form direct interactions with the bond breaking/forming region of the TS, and the phenyl substituent. A good match between the TS and the size of the IL ions is required to maximise the TS–solvent VdW surfaces.
We found that the electron density within the TS is anisotropically (transiently) polarised stabilising the TS, and the effect is much larger in the IL relative to benzene. A ‘push–pull’ mechanism is active with the anion pushing TS σ-framework ρ(r) and the cation pulling TS π-framework ρ(r). We explored the computed polarizability as a quantifiable measure of solvent effectiveness in polarising the TS. We found that the association energy between the solute (reactant or TS) and explicit sovent (IL or 2Bz) Eass for benzene remains approximately the same for both the reactant and the TS, but that Eass is significantly enhanced in the IL for the TS compared to the reactant. Overall we find there is good evidence to suggest the IL can interact more strongly with the TS and enhance reactivity.
Given the knowledge obtained in this study, using MD or undertaking QM/MM to sample a fully solvated TS is appealing. However, there are a number of technical hurdles. A pure MD study would require the development of a polarisable force field for the Cope rearrangement TS, and both methods would require the use and benchmarking of polarisable potentials for the IL solvent. The potentials for the TS and IL would need to be compatable, and it is unclear how the somewhat arbitrary Lennard Jones potentials (that recover dispersive interactions) would interact with subtle movements of the charge redistribution. An additional consideration is that QM/MM methods are generally set up at a relatively low QM level unable to fully recover dispersion effects, and that the selection of the boundary of the QM vs. MM regions is not always obvious due to solvent molecules moving in and out of the first solvation sphere. For both methodologies substantial time and computational resource would be required. We believe, the insights reported here could provide a valuable starting point for directing important aspects of MD or QM/MM studies. MD or QM/MM studies, are beyond the scope of this work, but could provide complementary information on reactant, product and TS solvation.
Examination of reaction B (% conversion over a given time) for a number of other ILs, demonstrated the effectiveness of ILs as a group. Varying the cation or anion contributed more subtle effects. Nevertheless, our evaluation that a larger anion α and good structural match maximising TS–cation VdW interactions for the cation, are supported.
Overall, this study has given a deeper molecular level insight into the volume of the reactant and TS conformers of the studied Cope rearrangement, and the specific interactions that can occur between a TS and individual IL ions or benzene molecules. Our results and linked rationalisations (models) provide insight into the potential root causes of the rate increase for ILs compared benzene. We have also expanded our understanding of IL polarizability and the potential for ILs to have significant impact on concerted non-polar reactions.
Conflicts of interest
There are no conflicts to declare.Acknowledgements
We acknowledge valuable conversations with Assoc. Prof. Jason Harper (UNSW) with respect to the experimental work carried out. GS acknowledges support from the NIHR Health Protection Research Unit in Chemical and Radiation Threats and Hazards.References
- J. P. Hallett and T. Welton, Chem. Rev., 2011, 111, 3508–3576 CrossRef CAS PubMed.
- T. Welton, Chem. Rev., 1999, 99, 2071–2084 CrossRef CAS PubMed.
- R. Sheldon, Chem. Commun., 2001, 2399–2407 RSC.
- T. Welton, Coord. Chem. Rev., 2004, 248, 2459–2477 CrossRef CAS.
- M. Freemantle, Chem. Eng. News Arch., 1998, 76(13), 32–37 CrossRef.
- M. J. Kamlet and R. W. Taft, J. Am. Chem. Soc., 1976, 98, 377–383 CrossRef CAS.
- M. J. Kamlet, J. L. Abboud and R. W. Taft, J. Am. Chem. Soc., 1977, 99, 6027–6038 CrossRef CAS.
- M. J. Kamlet, T. N. Hall, J. Boykin and R. W. Taft, J. Org. Chem., 1979, 44, 2599–2604 CrossRef CAS.
- R. W. Taft and M. J. Kamlet, J. Am. Chem. Soc., 1976, 98, 2886–2894 CrossRef CAS.
- N. Weiß, C. H. Schmidt, G. Thielemann, E. Heid, C. Schröder and S. Spange, Phys. Chem. Chem. Phys., 2021, 23, 1616–1626 RSC.
- P. A. Hunt, C. R. Ashworth and R. P. Matthews, Chem. Soc. Rev., 2015, 44, 1257–1288 RSC.
- H. Niedermeyer, C. Ashworth, A. Brandt, T. Welton and P. A. Hunt, Phys. Chem. Chem. Phys., 2013, 15, 11566 RSC.
- E. Priede, S. Brica, E. Bakis, N. Udris and A. Zicmanis, New J. Chem., 2015, 39, 9132–9142 RSC.
- L. Crowhurst, R. Falcone, N. L. Lancaster, V. Llopis-Mestre and T. Welton, J. Org. Chem., 2006, 71, 8847–8853 CrossRef CAS PubMed.
- L. Crowhurst, N. L. Lancaster, J. M. Pérez Arlandis and T. Welton, J. Am. Chem. Soc., 2004, 126, 11549–11555 CrossRef CAS PubMed.
- C. Reichardt and T. Welton, Solvents and Solvent Effects in Organic Chemistry, Wiley-VCH Verlag GmbH & Co. KGaA, 2010 Search PubMed.
- M. A. A. Rani, A. Brant, L. Crowhurst, A. Dolan, M. Lui, N. H. Hassan, J. P. Hallett, P. A. Hunt, H. Niedermeyer, J. M. Perez-Arlandis, M. Schrems, T. Welton and R. Wilding, Phys. Chem. Chem. Phys., 2011, 13, 16831–16840 RSC.
- S. Koutsoukos, J. Avila, N. J. Brooks, M. C. Gomes and T. Welton, Phys. Chem. Chem. Phys., 2023, 25, 6316–6325 RSC.
- J. N. A. Canongia Lopes and A. A. H. Pádua, J. Phys. Chem. B, 2006, 110, 3330–3335 CrossRef CAS PubMed.
- C. Reichardt, Green Chem., 2005, 7, 339–351 RSC.
- S. Spange, R. Lungwitz and A. Schade, J. Mol. Liq., 2014, 192, 137–143 CrossRef CAS.
- S. Zahn, F. Uhlig, J. Thar, C. Spickermann and B. Kirchner, Angew. Chem., Int. Ed., 2008, 47, 3639–3641 CrossRef CAS PubMed.
- E. I. Izgorodina, D. Golze, R. Maganti, V. Armel, M. Taige, T. J. S. Schubert and D. R. MacFarlane, Phys. Chem. Chem. Phys., 2014, 16, 7209–7221 RSC.
- N. Graulich, Wiley Interdiscip. Rev.: Comput. Mol. Sci., 2011, 1, 172–190 CAS.
- S. T. Keaveney, R. S. Haines and J. B. Harper, ChemPlusChem, 2017, 82, 449–457 CrossRef CAS PubMed.
- C. Wohlfarth, Permittivity of Liquids, in CRC Handbook of Chemistry and Physics, ed. J. R. Rumble, Jr., CRC Press, Taylor & Francis, Boca Raton, FL, 104th edn (Internet Version), 2023 Search PubMed.
- M. H. Abraham, P. L. Grellier, J.-L. M. Abboud, R. M. Doherty and R. W. Taft, Can. J. Chem., 1988, 66, 2673–2686 CrossRef CAS.
- N. Weiß, C. H. Schmidt, G. Thielemann, E. Heid, C. Schröder and S. Spange, Phys. Chem. Chem. Phys., 2021, 23, 1616–1626 RSC.
- Physcial Constants of Orgnic Compounds, in Handbook of Chemistry and Physics, ed. J. R. Rumble, Jr., CRC Press, Taylor & Francis, Boca Raton, FL, 104th edn (Internet Version), 2023 Search PubMed.
- J. G. Huddleston, A. E. Visser, W. M. Reichert, H. D. Willauer, G. A. Broker and R. D. Rogers, Green Chem., 2001, 3, 156–164 RSC.
- M. Yizhak, Chem. Rev., 2013, 113, 6536–6551 CrossRef PubMed.
- C. E. Rosella and J. B. Harper, Tetrahedron Lett., 2009, 50, 992–994 CrossRef CAS.
- S. R. D. George, G. L. Edwards and J. B. Harper, Org. Biomol. Chem., 2010, 8, 5354–5358 RSC.
- M. K. Diedrich, D. Hochstrate, F.-G. Klärner and B. Zimny, Angew. Chem., Int. Ed. Engl., 1994, 33, 1079–1081 CrossRef.
- B. Chen, R. Hoffmann and R. Cammi, Angew. Chem., Int. Ed., 2017, 56, 11126–11142 CrossRef CAS PubMed.
- M. J. Frisch, G. W. Trucks, H. B. Schlegel, G. E. Scuseria, M. A. Robb, J. R. Cheeseman, G. Scalmani, V. Barone, G. A. Petersson, H. Nakatsuji, X. Li, M. Caricato, A. V. Marenich, J. Bloino, B. G. Janesko, R. Gomperts, B. Mennucci, H. P. Hratchian, J. V. Ortiz, A. F. Izmaylov, J. L. Sonnenberg, D. Williams-Young, F. Ding, F. Lipparini, F. Egidi, J. Goings, B. Peng, A. Petrone, T. Henderson, D. Ranasinghe, V. G. Zakrzewski, J. Gao, N. Rega, G. Zheng, W. Liang, M. Hada, M. Ehara, K. Toyota, R. Fukuda, J. Hasegawa, M. Ishida, T. Nakajima, Y. Honda, O. Kitao, H. Nakai, T. Vreven, K. Throssell, J. A. Montgomery, Jr., J. E. Peralta, F. Ogliaro, M. J. Bearpark, J. J. Heyd, E. N. Brothers, K. N. Kudin, V. N. Staroverov, T. A. Keith, R. Kobayashi, J. Normand, K. Raghavachari, A. P. Rendell, J. C. Burant, S. S. Iyengar, J. Tomasi, M. Cossi, J. M. Millam, M. Klene, C. Adamo, R. Cammi, J. W. Ochterski, R. L. Martin, K. Morokuma, O. Farkas, J. B. Foresman and D. J. Fox, G16, Gaussian 16, Revision C.01, Gaussian, Inc., Wallingford CT, 2019 Search PubMed.
- A. D. Becke, J. Chem. Phys., 1993, 98, 5648–5652 CrossRef CAS.
- Y. Zhao and D. G. Truhlar, Theor. Chem. Acc., 2008, 120, 215–241 Search PubMed.
- Y. Zhao and D. G. Truhlar, J. Chem. Phys., 2006, 125, 194101 CrossRef PubMed.
- C. Adamo and V. Barone, J. Chem. Phys., 1999, 110, 6158–6170 CrossRef CAS.
- A. Karton, Chem. Phys., 2021, 540, 111013 CrossRef CAS.
- A. Karton and L. Goerigk, J. Comput. Chem., 2015, 622–632 CrossRef CAS PubMed.
- F. Neese and F. Wennmohs, ORCA (version 5.0.3), Max-Planck-Institut für Kohlenforschung Search PubMed.
- F. Neese, Wiley Interdiscip. Rev.: Comput. Mol. Sci., 2012, 2, 73–78 CAS.
- F. Neese, Wiley Interdiscip. Rev.: Comput. Mol. Sci., 2018, 8, e1327 Search PubMed.
- Z. L. Seeger and E. I. Izgorodina, J. Comput. Chem., 2022, 43, 106–120 CrossRef CAS PubMed.
- P. Pracht, F. Bohle and S. Grimme, Phys. Chem. Chem. Phys., 2020, 22, 7169–7192 RSC.
- Jmol: an open-source Java viewer for chemical structures in 3D. https://www.jmol.org/.
- A. V. Marenich, C. J. Cramer and D. G. Truhlar, J. Phys. Chem. B, 2009, 113, 6378–6396 CrossRef CAS PubMed.
- V. S. Bernales, A. V. Marenich, R. Contreras, C. J. Cramer and D. G. Truhlar, J. Phys. Chem. B, 2012, 116, 9122–9129 CrossRef CAS PubMed.
- AIMAll (Version 19.10.12), Todd A. Keith, TK Gristmill Software, Overland Park KS, USA, 2019 (https://aim.tkgristmill.com).
- J. P. Foster and F. Weinhold, J. Am. Chem. Soc., 1980, 102, 7211–7218 CrossRef CAS.
- J. Contreras-García, E. R. Johnson, S. Keinan, R. Chaudret, J.-P. Piquemal, D. N. Beratan and W. Yang, J. Chem. Theory Comput., 2011, 7, 625–632 CrossRef PubMed.
- W. Humphrey, A. Dalke and K. Schulten, J. Mol. Graph., 1996, 14, 33–38 CrossRef CAS PubMed.
- S. Koutsoukos, J. Becker, A. Dobre, Z. Fan, F. Othman, F. Philippi, G. J. Smith and T. Welton, Nat. Rev. Methods Primer, 2022, 2, 1–18 CrossRef.
- M. J. S. Dewar and L. E. Jr. Wade, J. Am. Chem. Soc., 1977, 99, 4417–4424 CrossRef CAS.
- S. Sakai, J. Mol. Struct.: THEOCHEM, 2002, 583, 181–188 CrossRef CAS.
- D. A. Hrovat, B. R. Beno, H. Lange, H.-Y. Yoo, K. N. Houk and W. T. Borden, J. Am. Chem. Soc., 1999, 121, 10529–10537 CrossRef CAS.
- K. A. Black, S. Wilsey and K. N. Houk, J. Am. Chem. Soc., 1998, 120, 5622–5627 CrossRef CAS.
- K. R. J. Lovelock, R. Soc. Open Sci., 2017, 4, 171223 CrossRef PubMed.
- M. R. J. Dack, Chem. Soc. Rev., 1975, 4, 211 RSC.
- T. Singh and A. Kumar, J. Phys. Chem. B, 2008, 112, 12968–12972 CrossRef CAS PubMed.
- P. J. Carvalho, M. G. Freire, I. M. Marrucho, A. J. Queimada and J. A. P. Coutinho, J. Chem. Eng. Data, 2008, 53, 1346–1350 CrossRef CAS.
- A. F. M. Barton, Handbook of Solubility Parameters and Other Cohesion Parameters, CRC Press, Florida, USA, 1983, vol. 1 Search PubMed.
- J. R. Rumble, Jr., Handbook of Chemistry and Physics, CRC Press, Taylor & Francis, Boca Raton, FL, 104th edn, (Internet Version), 2023 Search PubMed.
Footnote |
| † Electronic supplementary information (ESI) available. See DOI: https://doi.org/10.1039/d4cp00156g |
| This journal is © the Owner Societies 2024 |

