 Open Access Article
Creative Commons Attribution 3.0 Unported Licence
Insights into localization, energy ordering, and substituent effect in excited states of azobenzenes from coupled cluster calculations of nuclear spin-induced circular dichroism†
Josefine H.
Andersen‡
 a,
Christof
Hättig
 b,
Sonia
Coriani
 *a and
Petr
Štěpánek
 *c
*c
aDTU Chemistry, Technical University of Denmark, Kemitorvet Building 207, DK-2800 Kongens Lyngby, Denmark. E-mail: soco@kemi.dtu.dk
bArbeitsgruppe Quantenchemie, Ruhr-Universität Bochum, D-44780 Bochum, Germany
cNMR Research Unit, Faculty of Science, University of Oulu, PO Box 3000, FI-90014 Oulu, Finland. E-mail: petr.stepanek@oulu.fi
First published on 17th October 2023
Abstract
Nuclear spin-induced circular dichroism (NSCD) is a molecular effect of differential absorption of left- and right-circularly polarized light due to nuclear spins in the molecule. In this work, new tools for its calculation are presented. Specifically, analytic expressions for the computation of the ![[scr B, script letter B]](https://www.rsc.org/images/entities/char_e13f.gif) K term of NSCD have been derived and implemented for the second-order coupled cluster singles and doubles (CC2) model. NSCD results obtained thereby for three derivatives of azobenzenes have been compared with results from time-dependent density functional theory (TD-DFT). The complementary information that could be obtained from NSCD measurements compared to NMR for these three species is discussed.
K term of NSCD have been derived and implemented for the second-order coupled cluster singles and doubles (CC2) model. NSCD results obtained thereby for three derivatives of azobenzenes have been compared with results from time-dependent density functional theory (TD-DFT). The complementary information that could be obtained from NSCD measurements compared to NMR for these three species is discussed.
1. Introduction
Nuclear magneto-optic (NMO) effects are molecular properties that arise as a consequence of the simultaneous interaction of the molecular electronic cloud with a beam of light and with the nuclear magnetic moments. They manifest as a change in the polarization state of the probing beam of light as it passes through a sample with anisotropically oriented nuclear magnetic moments.1–21The character of the change of the polarization induced in the light beam depends on the NMO effect. Nuclear spin-induced optical rotation (NSOR) is a circular birefringence that rotates the plane of polarization of the light beam.1,4,14,19 The nuclear Cotton–Mouton-like effects are linear birefringences and cause the linearly polarized beam to acquire an ellipticity.2,5,10–12 Nuclear spin-induced circular dichroism (NSCD) is the differential absorption of the left- and right-circularly polarized (LCP, RCP) components.15,17
Of these, NSOR is so far the only experimentally verified NMO effect. To aid in the experimental efforts for pioneering the observation of NSCD, it is useful to develop tools that can estimate the magnitude of the NSCD effect from first principles.
NSCD is particularly different from the other NMO effects mentioned above in that it is a property that only occurs when the wavelength of the light beam corresponds to the energy of a transition between two electronic states. In other words, NSCD only appears in the energy region of electronic absorption bands, which is usually in the visible or near ultraviolet (UV/vis) frequency range. In contrast, the other known NMO effects are birefringences and are also present in dispersive regions.
Broadly speaking, NSCD can be seen as a localized version of classical magnetic circular dichroism (MCD).22–27 In MCD the sample exhibits different coefficients of molar absorption for the LCP and RCP components of light when it is placed in a magnetic field with a component parallel to the path of the propagation of the beam.26 In NSCD, the magnetic field perturbation is not introduced from the outside, but from within the molecule by the individual nuclear magnetic moments. In analogy to MCD, NSCD is then observed when the average magnetization of the sample from the nuclear magnetic moments is at least partially aligned with the direction of the light beam.15
Since NSCD arises from differential absorption coefficients for RCP and LCP, a proper characterization of the excited states is important for its faithful description. In addition, since it also involves interactions with the nuclear magnetic moments via a hyperfine interaction operator (ĥhf), capturing the electronic properties near the nucleus is also essential. This places a high demand on the basis set as well as on the computational method.
The calculation of NSCD spectra has so far only been implemented within the framework of time-dependent (TD-) density functional theory (DFT).15,20 One TD-DFT protocol for NSCD is based on the complex polarization propagator (CPP) method.28,29 This approach allows to simulate directly the absorption spectra with broadened bands and to investigate regions of arbitrary energy without the explicit need to calculate all excited states of lower energy. However, it partly obscures the contributions of individual excited states as the resulting spectrum is a sum of all contributions that are implicitly convoluted with Lorentzian broadening bands. More recently, a TD-DFT quadratic-response-based approach has been developed for calculating the NSCD strengths of individual transitions.20 This approach produces NSCD data in the form of “stick spectra”, i.e., NSCD strengths of a particular nucleus K over a given set of excited states, known as NSCD ![[scr B, script letter B]](https://www.rsc.org/images/entities/char_e13f.gif) K terms.
K terms.
(TD-)DFT methods depend on the choice of functional, which is still often designed in a semi-empirical way for specific properties and/or molecular systems, and, as such, it is hard to improve in a systematic way. The reliable performance of a certain functional for new properties is therefore not assured. Oftentimes, (TD-)DFT methods need to be benchmarked against high-end methods, such as those based on the coupled cluster (CC) ansatz.30 The fully ab initio CC methods do not contain or require a priori assumptions about the nature of the studied system, which are common in the construction of many DFT functionals. Thus, CC methods treat different molecules on more equal footing and provide less biased results compared to DFT, which on the other hand can be sensitive to particular combinations of molecules and functionals. The CC ansatz also offers a clear and systematic path toward the full theoretical limit, though at the price of a steep increase in the computational costs moving up the hierarchy of CC approximations. However, the CC model only provides a good approximation when the system can be well described by a single determinant.
Among the CC approximations, the second-order approximate coupled cluster singles and doubles model (CC2)31–33 has emerged as a cost-effective and relatively accurate34 approach for a variety of molecular properties and UV/vis spectra of medium-to-large molecular systems (with single-reference dominated electronic structure). It is our goal here to present a method to calculate stick spectra of NSCD based on the CC ansatz, with a specific implementation at the CC2 level. The approach gives access to NSCD values for specific excited states, and it can be used for direct investigation of moderately-sized molecules and as a first benchmark for DFT models. It is based on a generalization of the resolution-of-identity CC2 (RI-CC2)32,33 implementation of the MCD ![[scr B, script letter B]](https://www.rsc.org/images/entities/char_e13f.gif) term35 in Turbomole36 to the computation of the NSCD
term35 in Turbomole36 to the computation of the NSCD ![[scr B, script letter B]](https://www.rsc.org/images/entities/char_e13f.gif) K term. The new RI-CC2 protocol is applied to a selection of para-substituted azobenzenes and its results are compared to those obtained with TD-DFT using the BH+HLYP functional.37,38
K term. The new RI-CC2 protocol is applied to a selection of para-substituted azobenzenes and its results are compared to those obtained with TD-DFT using the BH+HLYP functional.37,38
2. Theory
Since NSCD can be considered as magnetic circular dichroism induced by the nuclear spin, the mathematical expressions for its fundamental molecular descriptors can be derived along the lines of the derivation of conventional circular dichroism induced by an external (static) magnetic field. Early attempts to compute the MCD![[scr A, script letter A]](https://www.rsc.org/images/entities/char_e520.gif) ,
, ![[scr B, script letter B]](https://www.rsc.org/images/entities/char_e13f.gif) , and
, and ![[capital script C]](https://www.rsc.org/images/entities/char_e522.gif) terms were based on sum-over-states (SOS) expressions, which were first obtained by Buckingham and Stephens.22 Only the
terms were based on sum-over-states (SOS) expressions, which were first obtained by Buckingham and Stephens.22 Only the ![[scr B, script letter B]](https://www.rsc.org/images/entities/char_e13f.gif) term is of relevance for closed-shell molecular systems with no degenerate ground or excited states.22–25,27 It was later shown39 that the
term is of relevance for closed-shell molecular systems with no degenerate ground or excited states.22–25,27 It was later shown39 that the ![[scr B, script letter B]](https://www.rsc.org/images/entities/char_e13f.gif) term can be obtained from the first-order residues of a quadratic response function involving the electric dipole operator (
term can be obtained from the first-order residues of a quadratic response function involving the electric dipole operator (![[small mu, Greek, circumflex]](https://www.rsc.org/images/entities/i_char_e0b3.gif) ) and, in a non-relativistic context, the orbital Zeeman interaction operator (relative to a common origin O),
) and, in a non-relativistic context, the orbital Zeeman interaction operator (relative to a common origin O),  (
(![[l with combining circumflex]](https://www.rsc.org/images/entities/i_char_006c_0302.gif) iO being the angular momentum operator relative to the origin O). For a given electronic transition from state 0 to state f with an excitation energy of frequency ωf, this is expressed as follows:
iO being the angular momentum operator relative to the origin O). For a given electronic transition from state 0 to state f with an excitation energy of frequency ωf, this is expressed as follows: | (1) |
 | (2) |
![[small mu, Greek, circumflex]](https://www.rsc.org/images/entities/i_char_e0b3.gif) α|f〉 〈f|
α|f〉 〈f|![[small mu, Greek, circumflex]](https://www.rsc.org/images/entities/i_char_e0b3.gif) β|0〉. In the equations above, ω is the frequency of the external electric field (the incident light beam), εαβγ is the Levi–Civita tensor, and implicit summation over repeated indices is implied, where indices α, β, and γ run over the three Cartesian coordinates x, y, and z. The latter summation accounts for isotropic tumbling of the molecules, i.e., eqn (1) and (2) apply to liquid or gas phase samples.
β|0〉. In the equations above, ω is the frequency of the external electric field (the incident light beam), εαβγ is the Levi–Civita tensor, and implicit summation over repeated indices is implied, where indices α, β, and γ run over the three Cartesian coordinates x, y, and z. The latter summation accounts for isotropic tumbling of the molecules, i.e., eqn (1) and (2) apply to liquid or gas phase samples.
In analogy with the case of MCD, and inspired by the CPP formulation of NSCD by Vaara et al.,15 an SOS expression for the NSCD ![[scr B, script letter B]](https://www.rsc.org/images/entities/char_e13f.gif) K term of nucleus K and its connection to the residues of a quadratic response function have been derived by Štěpánek and co-workers.18,20 The approach used a non-relativistic formulation where the orbital hyperfine interaction operator of nucleus K, a.k.a. the paramagnetic (nuclear) spin–(electron) orbit (PSO) operator,
K term of nucleus K and its connection to the residues of a quadratic response function have been derived by Štěpánek and co-workers.18,20 The approach used a non-relativistic formulation where the orbital hyperfine interaction operator of nucleus K, a.k.a. the paramagnetic (nuclear) spin–(electron) orbit (PSO) operator,  , replaces the orbital Zeeman interaction operator in eqn (1)
 | (3) |
 | (4) |
Within CC response theory, computational expressions for the ![[scr B, script letter B]](https://www.rsc.org/images/entities/char_e13f.gif) term of MCD are most conveniently obtained using the derivative approach of eqn (2).35,40,41 Following a similar strategy here for NSCD, we start from eqn (4) and formulate the
term of MCD are most conveniently obtained using the derivative approach of eqn (2).35,40,41 Following a similar strategy here for NSCD, we start from eqn (4) and formulate the ![[scr B, script letter B]](https://www.rsc.org/images/entities/char_e13f.gif) K term as
K term as
 | (5) |
![[scr B, script letter B]](https://www.rsc.org/images/entities/char_e13f.gif) term35,40,41
term35,40,41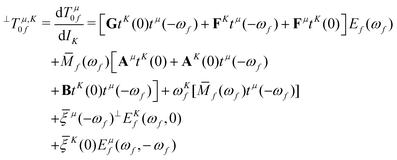 | (6) |
 | (7) |
 , which is the definition of the excited-state expectation value TKff of the operator ĥpsoK,γ. Since ĥpsoK,γ is imaginary, ωKf is zero, unless the final state f is degenerate.
In the equations above, Ef(ωf) and Ēf(−ωf) are the right and left CC excited state vectors, obtained by solving the right and left eigenvalue equations
| [A − ωf1]Ef(ωf) = 0 | (8) |
| Ēf(−ωf)[A − ωf1] = 0 | (9) |
![[scr O, script letter O]](https://www.rsc.org/images/entities/char_e52e.gif) f(ωf,ω
f(ωf,ω![[scr O, script letter O]](https://www.rsc.org/images/entities/char_e52e.gif) ) and Ē
) and Ē![[scr O, script letter O]](https://www.rsc.org/images/entities/char_e52e.gif) f(−ωf, ω
f(−ωf, ω![[scr O, script letter O]](https://www.rsc.org/images/entities/char_e52e.gif) ) are their first-order responses to a general operator
) are their first-order responses to a general operator  , with associated frequency ω
![[scr O, script letter O]](https://www.rsc.org/images/entities/char_e52e.gif) . The eigenvector responses are obtained from solving the linear equations
. The eigenvector responses are obtained from solving the linear equations[A − (ωf + ω![[scr O, script letter O]](https://www.rsc.org/images/entities/char_e52e.gif) )1]E )1]E![[scr O, script letter O]](https://www.rsc.org/images/entities/char_e52e.gif) f(ωf, ω f(ωf, ω![[scr O, script letter O]](https://www.rsc.org/images/entities/char_e52e.gif) ) = −[Bt ) = −[Bt![[scr O, script letter O]](https://www.rsc.org/images/entities/char_e52e.gif) (ω (ω![[scr O, script letter O]](https://www.rsc.org/images/entities/char_e52e.gif) ) + A ) + A![[scr O, script letter O]](https://www.rsc.org/images/entities/char_e52e.gif) ]Ef(ωf) ]Ef(ωf) | (10) |
Ē![[scr O, script letter O]](https://www.rsc.org/images/entities/char_e52e.gif) f(−ωf, ω f(−ωf, ω![[scr O, script letter O]](https://www.rsc.org/images/entities/char_e52e.gif) )[A + (ω )[A + (ω![[scr O, script letter O]](https://www.rsc.org/images/entities/char_e52e.gif) − ωf)1] = −Ēf(−ωf)[Bt − ωf)1] = −Ēf(−ωf)[Bt![[scr O, script letter O]](https://www.rsc.org/images/entities/char_e52e.gif) (ω (ω![[scr O, script letter O]](https://www.rsc.org/images/entities/char_e52e.gif) ) + A ) + A![[scr O, script letter O]](https://www.rsc.org/images/entities/char_e52e.gif) ]. ]. | (11) |
![[scr O, script letter O]](https://www.rsc.org/images/entities/char_e52e.gif) = 0 (as is the case for
= 0 (as is the case for  ) eqn (10) and (11) may diverge in the case where [A − ωf1] is singular, i.e., if the solution vector has a component in the direction of the right and left eigenvectors. To avoid these unphysical divergences, the eigenvector derivatives EKf(ωf,0) and ĒKf(−ωf, 0) are projected onto the orthogonal complement of the undifferentiated eigenvectors, as indicated by the left superscript ⊥.35,40,41 Definitions of the remaining CC building blocks can be found, e.g., in ref. 31, 35, 40, and 42.
From the ![[scr B, script letter B]](https://www.rsc.org/images/entities/char_e13f.gif) K term, the total NSCD ellipticity spectrum of nucleus K, in a molecule with no degenerate ground and excited states can then be computed as20
K term, the total NSCD ellipticity spectrum of nucleus K, in a molecule with no degenerate ground and excited states can then be computed as20
 | (12) |
![[script L]](https://www.rsc.org/images/entities/char_e144.gif) K is a product of physical constants, and gf(ω,ωf) is a broadening function. The ellipticity ηK in eqn (12) is given in μrad and is normalized per unit path length, unit of spin polarization, and unit concentration of the nucleus. The numerical values of
K is a product of physical constants, and gf(ω,ωf) is a broadening function. The ellipticity ηK in eqn (12) is given in μrad and is normalized per unit path length, unit of spin polarization, and unit concentration of the nucleus. The numerical values of ![[script L]](https://www.rsc.org/images/entities/char_e144.gif) K used in the current study are reported in the ESI.†Eqn (12) takes into account the isotropic tumbling of the molecule, i.e., it gives the ellipticity averaged over molecular orientations. In the current work, the
K used in the current study are reported in the ESI.†Eqn (12) takes into account the isotropic tumbling of the molecule, i.e., it gives the ellipticity averaged over molecular orientations. In the current work, the ![[scr B, script letter B]](https://www.rsc.org/images/entities/char_e13f.gif) K term is thus calculated according to eqn (5). The obtained ellipticities can be converted to differential absorption coefficient using well-known relationships from natural optical activity.43
K term is thus calculated according to eqn (5). The obtained ellipticities can be converted to differential absorption coefficient using well-known relationships from natural optical activity.43
Since it will be relevant for the discussion of the results in the next sections, we also report here the exact sum-over-states expression for the ![[scr B, script letter B]](https://www.rsc.org/images/entities/char_e13f.gif) K term
K term
 | (13) |
 | (14) |
![[scr B, script letter B]](https://www.rsc.org/images/entities/char_e13f.gif) K,d) and absorptive (
K,d) and absorptive (![[scr B, script letter B]](https://www.rsc.org/images/entities/char_e13f.gif) K,a) components18
K,a) components18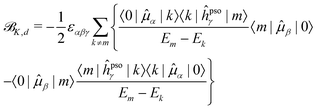 | (15) |
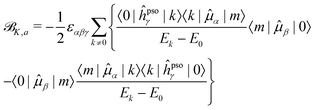 | (16) |
![[scr B, script letter B]](https://www.rsc.org/images/entities/char_e13f.gif) K,a SOS are never smaller than the relative energy of the first excited state, and will progressively increase as energetically higher excited states are considered in the SOS. On the other hand, the energy difference between two excited states in the denominator of the dispersive terms can become very small and result in a very large contribution from this type of term, even dominant in the case of very close-lying excited states. Also, since the
K,a SOS are never smaller than the relative energy of the first excited state, and will progressively increase as energetically higher excited states are considered in the SOS. On the other hand, the energy difference between two excited states in the denominator of the dispersive terms can become very small and result in a very large contribution from this type of term, even dominant in the case of very close-lying excited states. Also, since the ![[scr B, script letter B]](https://www.rsc.org/images/entities/char_e13f.gif) K term is a scalar triple product, i.e., it contains the Levi-Civita tensor, and the PSO operator is imaginary, the dispersive contributions from a pair of excited states k and m to each other's NSCD signal will be identical in magnitude but of opposite sign. Thus, energetically close pairs of excited states may contribute to the NSCD spectrum with a bisignate feature if the contribution to
K term is a scalar triple product, i.e., it contains the Levi-Civita tensor, and the PSO operator is imaginary, the dispersive contributions from a pair of excited states k and m to each other's NSCD signal will be identical in magnitude but of opposite sign. Thus, energetically close pairs of excited states may contribute to the NSCD spectrum with a bisignate feature if the contribution to ![[scr B, script letter B]](https://www.rsc.org/images/entities/char_e13f.gif) K,d due to the interaction of the two states is dominant in the SOS. In MCD, this feature is referred to as a pseudo-
K,d due to the interaction of the two states is dominant in the SOS. In MCD, this feature is referred to as a pseudo-![[scr A, script letter A]](https://www.rsc.org/images/entities/char_e520.gif) term.44
term.44
Since ĥpso and ![[small mu, Greek, circumflex]](https://www.rsc.org/images/entities/i_char_e0b3.gif) are one-electron operators, their matrix elements between two excited states,
are one-electron operators, their matrix elements between two excited states,  , approximately become
 | (17) |
3. Computational details
Three para-substituted azobenzenes were chosen for investigation as systems of both experimental interest and computational feasibility: 4-hydroxyazobenzene (AZO-1, a.k.a. 4-phenylazophenol or p-(phenylazo)phenol), 4-aminoazobenzene (AZO-2, a.k.a. p-aminoazobenzene or aniline yellow), and 4-amino-4′-nitroazobenzene (AZO-3). Fig. 1 shows the azobenzene molecules with numbered atoms for later reference. The geometries were optimized at the MP2/cc-pVTZ level using Turbomole36 and Cartesian coordinates can be found in the ESI.†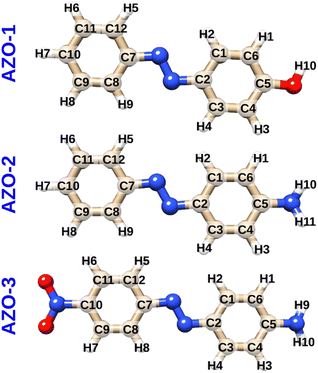 | ||
| Fig. 1 Molecular structures and atom numbering schemes for 4-hydroxyazobenzene (AZO-1), 4-aminoazobenzene (AZO-2), and 4-amino-4′-nitroazobenzene (AZO-3). | ||
The effects of solvation in dimethyl sulfoxide (DMSO), CHCl3, and C6H12 were examined for AZO-3 using the COSMO model.45 Dielectric constants and refractive indices of the solvents are provided in the ESI.†
The NSCD ellipticities were calculated with RI-CC2 and TD-DFT using the weighted core-valence correlation-consistent aug-cc-pwCVDZ basis set46 and development versions of Turbomole36,47 and Dalton,48,49 respectively. For the TD-DFT calculations, the BH+HLYP37,38 functional was applied. The spectra were generated by broadening the stick spectra with a Lorentzian band of half-width-at-half-maximum of 1000 cm−1. Calculations were performed for the most common isotopes with non-zero spin, i.e., 1H and 13C. Calculation for isotopes of nitrogen were not performed.
4. Results and discussion
Our discussion will cover several aspects of the results, and revolve around the character of the considered excited states (ESs), the NSCD spectra, difference densities, and the signs of the individual![[scr B, script letter B]](https://www.rsc.org/images/entities/char_e13f.gif) K terms. Before moving into the analysis, some background on the relation between NSCD and NMR is provided. Then, for each azobenzene species, the CC2 results are considered first. Second, comparisons between CC2 and TD-DFT are carried out. For additional investigation of the origin of conspicuous observations, an SOS study and examination of the NTOs are carried out. Solvent effects on selected excited-state NSCD terms are also discussed.
K terms. Before moving into the analysis, some background on the relation between NSCD and NMR is provided. Then, for each azobenzene species, the CC2 results are considered first. Second, comparisons between CC2 and TD-DFT are carried out. For additional investigation of the origin of conspicuous observations, an SOS study and examination of the NTOs are carried out. Solvent effects on selected excited-state NSCD terms are also discussed.
4.1 Equivalence of nuclei in NSCD
Experimentally, the NSCD requires the presence and proper orientation of the bulk magnetization of the nuclear spins (M). This magnetization emerges as the population average of individual nuclear magnetic moments in an external magnetic field50 and its evolution in time is the basis for nuclear magnetic resonance (NMR) spectroscopy. Since the presence of NSCD requires that this nuclear magnetization vector has a component parallel with the light beam, manipulating the direction of M is essential for the observation of NSCD. In other words, the time evolution of M will directly influence the time evolution of the NSCD.From a semi-classical point of view, the magnetization vector from an ensemble of identical nuclear spins K precesses around the direction of the magnetic field present at the position of the nuclei at a well-defined frequency, called Larmor frequency. This Larmor frequency is proportional to the magnetic field Bloc experienced locally by the nucleus. Bloc is determined by the external magnetic field (B0), modified due to the local electronic structure around the nucleus, giving nuclei in different local environments different Larmor frequencies. These small local differences in Bloc and, hence, the Larmor frequencies are observed in NMR spectroscopy as nuclear shielding, a fundamental NMR property used to distinguish different nuclei in molecules.
The instantaneous local magnetic fields depend on the conformation and surroundings of the molecule and can change in fluids very rapidly due to the molecular motions. However, the nuclear precession frequencies are usually much slower (∼101–102 MHz) than the molecular tumbling. As a consequence, the observed Larmor frequencies are an average of the Larmor frequencies that the nucleus experiences during one period of its precession motion. This means that results of the quantum chemical calculations for properties, whose observation is associated with the precession of magnetization, need to be averaged for the nuclei that can, on the time scale of an NMR experiment, explore different conformations and hence different Bloc and Larmor frequencies.
For the molecules here considered, this is the situation of the carbon and hydrogen atoms that are attached in positions equivalent with respect to the N![[double bond, length as m-dash]](https://www.rsc.org/images/entities/char_e001.gif) N bridge. As an example, the hydrogen nuclei H2 and H4 can, on the timescale of the NMR experiment, exchange their positions due to the rotation of the phenyl ring along the N–C2 bond. This is reflected experimentally in the NMR spectrum of azobenzene, which shows a single peak at identical frequencies for these nuclei.51,52 As noted above, since NSCD is modulated by the time evolution of the magnetization the same way as NMR, the same effect will also apply here. This means that although the calculated results will show different NSCD for these nuclei in the presented static structure, the more appropriate interpretation of the results from the experimental point of view is to average these NSCD signals. This is analogous to a common practice applied in the analysis of calculated NMR chemical shifts.
N bridge. As an example, the hydrogen nuclei H2 and H4 can, on the timescale of the NMR experiment, exchange their positions due to the rotation of the phenyl ring along the N–C2 bond. This is reflected experimentally in the NMR spectrum of azobenzene, which shows a single peak at identical frequencies for these nuclei.51,52 As noted above, since NSCD is modulated by the time evolution of the magnetization the same way as NMR, the same effect will also apply here. This means that although the calculated results will show different NSCD for these nuclei in the presented static structure, the more appropriate interpretation of the results from the experimental point of view is to average these NSCD signals. This is analogous to a common practice applied in the analysis of calculated NMR chemical shifts.
In summary, nuclei that are separable in NMR with chemical shift are also separable in NSCD on the basis of the precession frequency. For this reason, the sum of NSCD for nuclei considered as NMR-equivalent is also reported as this is more relevant to the experimental measurements than the individual, practically unobservable, contributions from an instantaneous structure.
4.2 Similarities between the excited states of the three systems
The three investigated azobenzenes differ in the substituents in para positions with respect to the carbons bound to the azo (N![[double bond, length as m-dash]](https://www.rsc.org/images/entities/char_e001.gif) N) group: AZO-1 has the electron-donating hydroxy group (–OH) on one of the phenyl rings, whereas AZO-2 has an electron-donating amino group (–NH2) in the same position; AZO-3 contains both the electron-donating amino group on one ring and the electron-withdrawing nitro group (–NO2) on the other ring. AZO-1 and AZO-2 are sometimes referred to as electron-donating azobenzenes; AZO-3 is a prototypical push–pull system (electron donor–acceptor azobenzene).
N) group: AZO-1 has the electron-donating hydroxy group (–OH) on one of the phenyl rings, whereas AZO-2 has an electron-donating amino group (–NH2) in the same position; AZO-3 contains both the electron-donating amino group on one ring and the electron-withdrawing nitro group (–NO2) on the other ring. AZO-1 and AZO-2 are sometimes referred to as electron-donating azobenzenes; AZO-3 is a prototypical push–pull system (electron donor–acceptor azobenzene).
Table 1 collects information on the excited states considered for the three azobenzenes. The first excited state (ES1) of all three molecules has nπ* character, with the hole orbital localized on the azo group. ES1 is dark in optical absorption in all three azobenzenes. The second state, ES2, is a delocalized ππ* electronic state, where the π* involves the azo group. This is the bright state in optical absorption, which has a distinct charge-transfer character in AZO-3. In AZO-1, ES3 is a ππ* state mainly localized on the unsubstituted (left) phenyl ring, and ES4 is a ππ* state mainly localized on the substituted (right) phenyl. In AZO-2, ES3 is dominantly on the substituted ring (similar to ES4 of AZO-1), and ES4 is on the unsubstituted one (similar to ES3 of AZO-1). Both ES3 and ES4 are almost dark in optical absorption in AZO-1 and AZO-2. CC2 and TD-DFT yield equivalent descriptions of the characters of the four excited states of AZO-1 and AZO-2. In AZO-3, ES3 is a dark nπ* state at both levels of theory, with the hole localized on the nitro group. The remaining three states of AZO-3 have different energetic ordering for CC2 and TD-DFT. ES4 at CC2 level corresponds to ES6 at TD-DFT level, and ES5 at CC2 level to ES4 at TD-DFT level. Both states have ππ* character, with noticeable localization on either one or the other of the phenyl rings. Finally, ES6 at CC2 level corresponds to ES5 at TD-DFT level; it is of nπ* character and originates from the nitro group with the π* orbital strongly localized on the phenyl linked to the nitro group.
| State n | RI-CC2 | Character (localization) | TD-DFT/BH+HLYP | ||
|---|---|---|---|---|---|
| E n | f | CC2/TD-DFT | E n | f | |
| AZO-1 | |||||
| 1 | 2.959 | 0.000 | nπ* (azo) | 3.015 | 0.000 |
| 2 | 3.796 | 0.868 | ππ* (deloc.) | 3.790 | 0.822 |
| 3 | 4.508 | 0.008 | ππ* (left) | 4.748 | 0.012 |
| 4 | 4.549 | 0.018 | ππ* (right) | 4.838 | 0.003 |
| AZO-2 | |||||
| 1 | 2.964 | 0.000 | nπ* (azo) | 3.031 | 0.000 |
| 2 | 3.589 | 0.919 | ππ* (deloc.) | 3.657 | 0.894 |
| 3 | 4.437 | 0.028 | ππ* (right) | 4.720 | 0.010 |
| 4 | 4.528 | 0.008 | ππ* (left) | 4.781 | 0.014 |
| AZO-3 | |||||
| 1 | 2.866 | 0.000 | nπ* (azo) | 2.956 | 0.000 |
| 2 | 3.339 | 1.043 | ππ* (deloc.) | 3.426 | 1.067 |
| 3 | 3.854 | 0.000 | nπ* (nitro) | 4.155 | 0.000 |
| 4 | 4.352 | 0.004 | ππ* (right)/ππ* (left) | 4.535 | 0.017 |
| 5 | 4.430 | 0.011 | ππ* (left)/nπ* (nitro) | 4.587 | 0.000 |
| 6 | 4.441 | 0.001 | nπ* (nitro)/ππ* (right) | 4.607 | 0.001 |
4.3 NSCD spectra: observed trends
We will now analyze the CC2 NSCD![[scr B, script letter B]](https://www.rsc.org/images/entities/char_e13f.gif) K data and corresponding spectra for the carbon (K = C) and hydrogen (K = H) nuclei of the three compounds. Note that in the plots discussed in the following, the spectra of the various nuclei have been color-coded such that pairs of NMR-equivalent atoms are colored identically.
K data and corresponding spectra for the carbon (K = C) and hydrogen (K = H) nuclei of the three compounds. Note that in the plots discussed in the following, the spectra of the various nuclei have been color-coded such that pairs of NMR-equivalent atoms are colored identically.
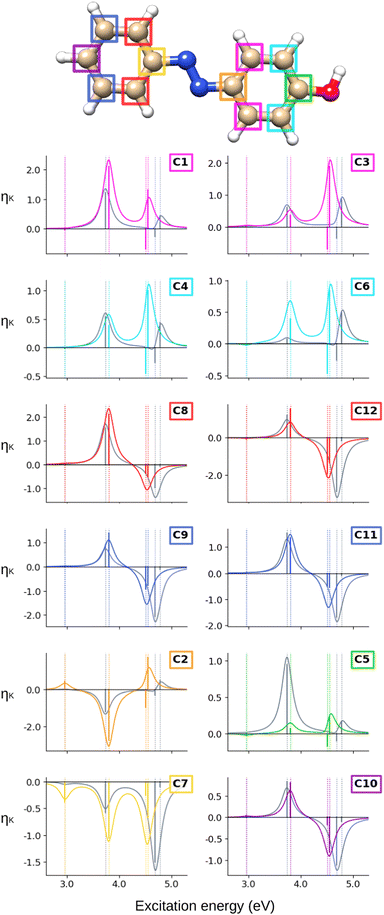
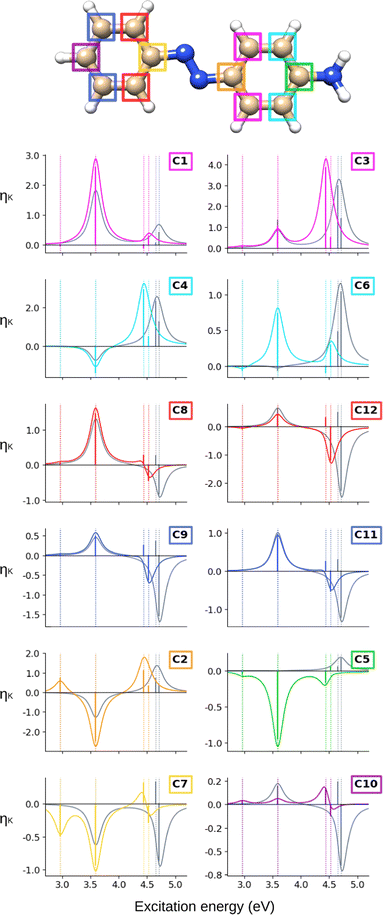
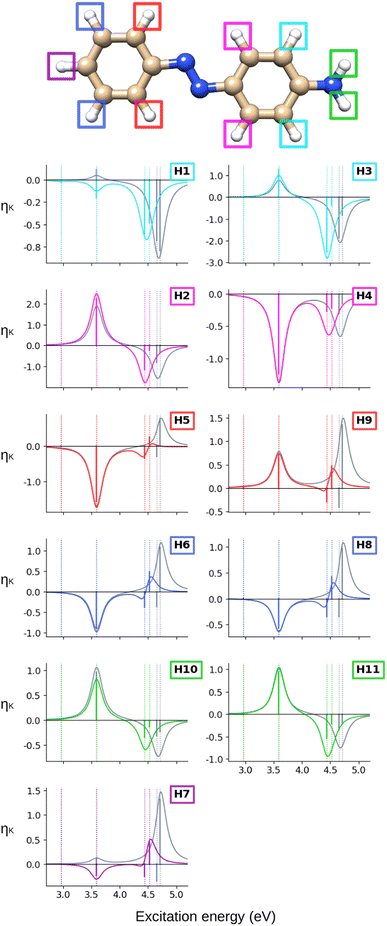
The ![[scr B, script letter B]](https://www.rsc.org/images/entities/char_e13f.gif) C terms and corresponding NSCD spectra of the carbon atoms in AZO-1 are shown in Fig. 2; those of the hydrogen nuclei are in Fig. 3. The corresponding raw data are provided in Table S5 (ESI†).
C terms and corresponding NSCD spectra of the carbon atoms in AZO-1 are shown in Fig. 2; those of the hydrogen nuclei are in Fig. 3. The corresponding raw data are provided in Table S5 (ESI†).
At the CC2 level, the first excited state of AZO-1 is NSCD dark at all nuclei, except for C2 and C7—that is, the nuclei connected to the azo group. This is explained by the fact that ES1 is an n → π* excitation with the hole orbital localized at the azo group, whose transition dipole moment (entering the ![[scr B, script letter B]](https://www.rsc.org/images/entities/char_e13f.gif) K expression) is only non-zero in the direction perpendicular to the molecular plane. At C2,
K expression) is only non-zero in the direction perpendicular to the molecular plane. At C2, ![[scr B, script letter B]](https://www.rsc.org/images/entities/char_e13f.gif) C is positive, whereas it is negative at C7. We attribute the non-negligible NSCD at C2 and C7 to the fact that ES1 is strongly localized on the azo group, see Fig. 5.
C is positive, whereas it is negative at C7. We attribute the non-negligible NSCD at C2 and C7 to the fact that ES1 is strongly localized on the azo group, see Fig. 5.
The ![[scr B, script letter B]](https://www.rsc.org/images/entities/char_e13f.gif) C term and the corresponding spectral band of ES2 are positive for all carbons, except C2 and C7, yet with varying intensities. For ES3 and ES4, all carbons on the unsubstituted phenyl ring have two negative
C term and the corresponding spectral band of ES2 are positive for all carbons, except C2 and C7, yet with varying intensities. For ES3 and ES4, all carbons on the unsubstituted phenyl ring have two negative ![[scr B, script letter B]](https://www.rsc.org/images/entities/char_e13f.gif) C terms, and a resulting negative band. For all carbons of the right ring, ES3 has negative
C terms, and a resulting negative band. For all carbons of the right ring, ES3 has negative ![[scr B, script letter B]](https://www.rsc.org/images/entities/char_e13f.gif) C whereas ES4 has a positive, and larger,
C whereas ES4 has a positive, and larger, ![[scr B, script letter B]](https://www.rsc.org/images/entities/char_e13f.gif) C value. The resulting convoluted band is positive.
C value. The resulting convoluted band is positive.
All in all, the NSCD spectra of the C atoms on the left ring have similar positive/negative bisignate shape, with the exception of C7, featuring instead three negative peaks. On the right ring, the unsubstituted carbons (C1, C3, C4, and C6) also have similar spectral shapes with two positive peaks. C5, the –OH substituted carbon, also shows two positive NSCD bands, though with much lower intensity.
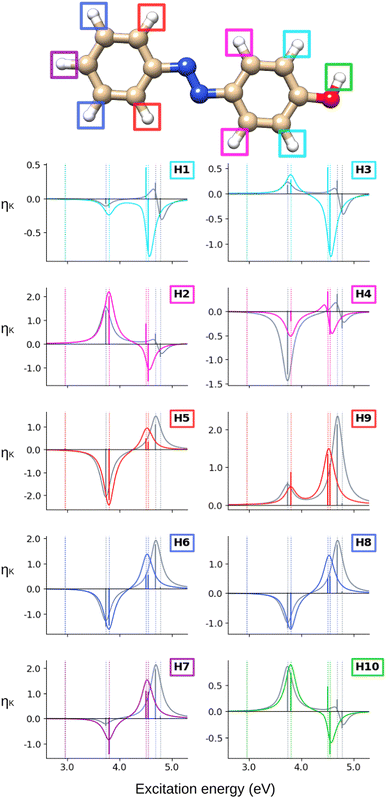
Turning our attention to the (CC2) hydrogen NSCD spectra of AZO-1 in Fig. 3, we observe that ES1 is completely dark for all hydrogens. All hydrogens on the right ring have oppositely signed ![[scr B, script letter B]](https://www.rsc.org/images/entities/char_e13f.gif) H for ES3 and ES4, and the resulting band is negative. All hydrogens on the left ring have two positive
H for ES3 and ES4, and the resulting band is negative. All hydrogens on the left ring have two positive ![[scr B, script letter B]](https://www.rsc.org/images/entities/char_e13f.gif) H for ES3 and ES4 and an overall positive band. The overall spectra of H5, H6, H7, H8 (left ring) are similar, yet modulated; the spectra of the right ring hydrogens are more dissimilar from each other as could be expected due to their different local environment.
H for ES3 and ES4 and an overall positive band. The overall spectra of H5, H6, H7, H8 (left ring) are similar, yet modulated; the spectra of the right ring hydrogens are more dissimilar from each other as could be expected due to their different local environment.
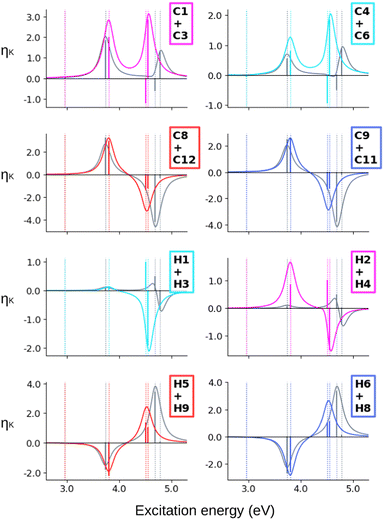
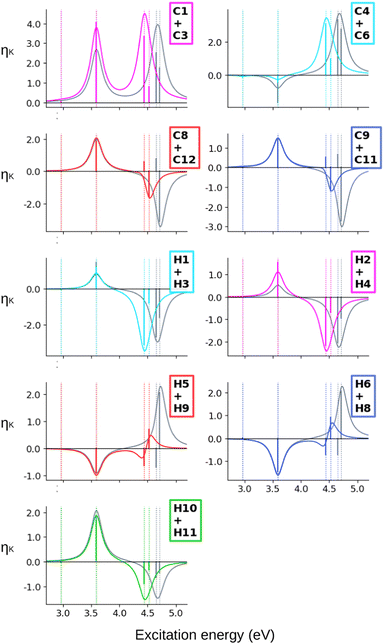
When computing the total NSCD spectra of the NMR-equivalent nuclei, we note that all carbon pairs combine in a constructive way, see Fig. 4. Summing the spectra of the NMR-equivalent H1 + H3, however, yields an almost quenched ES2 signal, whereas ES3 and ES4 combine into a stronger negative band. The NSCD signals of H2 + H4 and H5 + H9 also partly cancel out for ES2, and constructively add up for ES3 and ES4; the NSCD of H6 + H8 are combined constructively for all excited states.
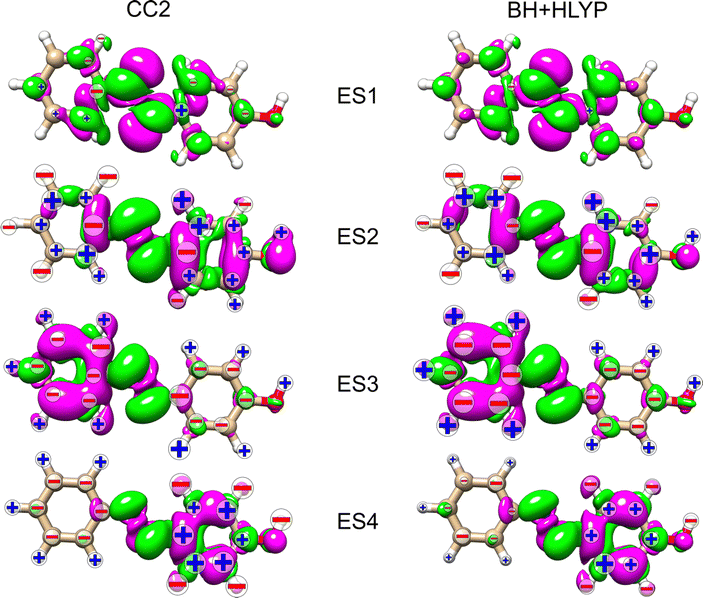
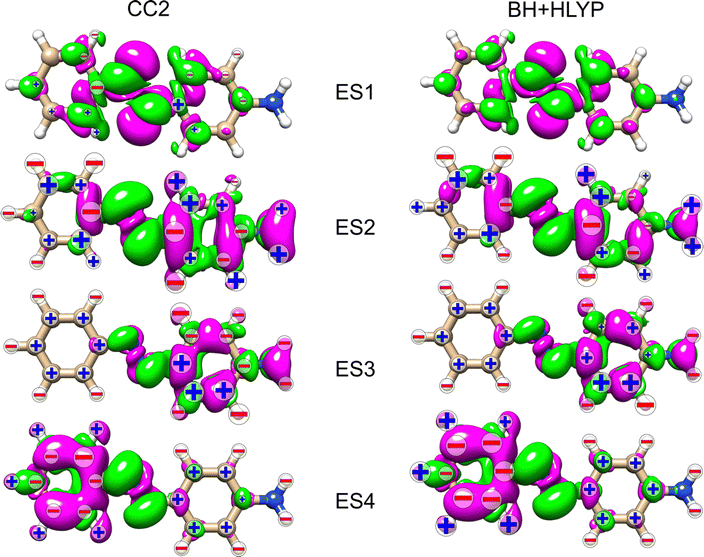
In an attempt to identify any peculiar sign patterns of the NSCD and possible connection between the NSCD and the localization of the difference density of the excited states, we plot in Fig. 5 the difference densities of the four excited states of AZO-1 together with a signed measure of the ![[script L]](https://www.rsc.org/images/entities/char_e144.gif) K
K![[scr B, script letter B]](https://www.rsc.org/images/entities/char_e13f.gif) K term for each nucleus. Different from the results of previous studies on other molecules,20 the NSCD intensities of AZO-1 do not appear to clearly connect to the regions of significant change in electronic density, and moderate NSCD signals can be seen at some distance from the main change in the electron density. Nevertheless, it is observed that in all cases the largest NSCD signal does appear in the regions where the density changes are localized the most. It should also be noted that in the previous study,20 the NSCD signal “leaked” outside of the regions of high difference densities up to a distance of a few bonds, which in the present case represents a significant fraction of the total molecule. For ES3, we note that the NSCDs of all carbons are negative and those of all hydrogens are positive, independent of where the electronic density is concentrated (i.e., on the left ring). In ES4, the difference density is localized on the right ring, and the signs of the carbon and hydrogen
K term for each nucleus. Different from the results of previous studies on other molecules,20 the NSCD intensities of AZO-1 do not appear to clearly connect to the regions of significant change in electronic density, and moderate NSCD signals can be seen at some distance from the main change in the electron density. Nevertheless, it is observed that in all cases the largest NSCD signal does appear in the regions where the density changes are localized the most. It should also be noted that in the previous study,20 the NSCD signal “leaked” outside of the regions of high difference densities up to a distance of a few bonds, which in the present case represents a significant fraction of the total molecule. For ES3, we note that the NSCDs of all carbons are negative and those of all hydrogens are positive, independent of where the electronic density is concentrated (i.e., on the left ring). In ES4, the difference density is localized on the right ring, and the signs of the carbon and hydrogen ![[scr B, script letter B]](https://www.rsc.org/images/entities/char_e13f.gif) K are flipped compared to ES3. We will return to this observed behavior in a following section.
K are flipped compared to ES3. We will return to this observed behavior in a following section.
The NSCD spectra of AZO-2 are shown in Fig. 6 and 7 for carbon and hydrogen, respectively. The underlying raw data can be found in Table S6 (ESI†).
Starting from the carbons’ spectra, it is seen that ES1 is clearly visible (at the CC2 level) on C2 (negative) and C7 (positive), and only slightly discernible on some of the others. For ES2, all carbons on the left ring have positive NSCD, except for C7. On the right ring, the NMR-equivalent C1 and C3 have both positive NSCD, whereas C6+C4 have oppositely signed NSCD for ES2. The substituted C2 and C5 both have negative ![[scr B, script letter B]](https://www.rsc.org/images/entities/char_e13f.gif) C(0 → 2). ES3 and ES4 are slightly more energetically separated than in AZO-1. All carbons on the left ring have oppositely signed
C(0 → 2). ES3 and ES4 are slightly more energetically separated than in AZO-1. All carbons on the left ring have oppositely signed ![[scr B, script letter B]](https://www.rsc.org/images/entities/char_e13f.gif) C terms for these two states. In a few cases, the resulting band is bisignate, yet weak, otherwise it is negative. On the right ring, the NMR-equivalent pairs C1+C3 and C4+C6 have oppositely signed
C terms for these two states. In a few cases, the resulting band is bisignate, yet weak, otherwise it is negative. On the right ring, the NMR-equivalent pairs C1+C3 and C4+C6 have oppositely signed ![[scr B, script letter B]](https://www.rsc.org/images/entities/char_e13f.gif) C for ES3, whereas, for ES4, all carbons on the right ring have positive NSCD.
C for ES3, whereas, for ES4, all carbons on the right ring have positive NSCD.
Looking at the hydrogen NSCD of AZO-2 in Fig. 7, we note that ES1 is dark in NSCD, as also observed for ES1 in AZO-1. For ES3, all hydrogens have negative ![[scr B, script letter B]](https://www.rsc.org/images/entities/char_e13f.gif) H; for ES4, on the other hand, the hydrogens on the left ring have positive
H; for ES4, on the other hand, the hydrogens on the left ring have positive ![[scr B, script letter B]](https://www.rsc.org/images/entities/char_e13f.gif) H while those on the right ring maintain their negative signal. As a result, the spectral shape of the ES3–ES4 band for the left ring hydrogen atoms resembles a pseudo-
H while those on the right ring maintain their negative signal. As a result, the spectral shape of the ES3–ES4 band for the left ring hydrogen atoms resembles a pseudo-![[scr A, script letter A]](https://www.rsc.org/images/entities/char_e520.gif) term.
term.
The combined NSCD of the NMR-equivalent atoms in AZO-2 is shown in Fig. 8. Partial cancellation occurs for ES2 on C4+C6. All other carbon pairs have NSCD terms of the same sign and their signals combine constructively. The NMR-equivalent amino hydrogens, H10 and H11, as well as the H6 + H8 pair on the left ring have almost identical spectra with only minor modulation in intensity, and thus combine constructively in the summed spectra. The NMR-equivalent H5+H9 on the left ring, as well as the pairs H1+H3 and H2+H4 on the right ring have oppositely signed ![[scr B, script letter B]](https://www.rsc.org/images/entities/char_e13f.gif) H for ES2, resulting in partial quenching of the NSCD of ES2 in the combined spectra. The two summed spectra of the left-ring carbons both exhibit a positive/negative spectral shape, and the right-ring combined spectra share a strong positive peak at higher frequencies, thus making the carbons on the two rings distinguishable. This also applies to the hydrogens, where the three right-ring spectra have the same positive/negative feature and the left-ring pairs have negative/pseudo-
H for ES2, resulting in partial quenching of the NSCD of ES2 in the combined spectra. The two summed spectra of the left-ring carbons both exhibit a positive/negative spectral shape, and the right-ring combined spectra share a strong positive peak at higher frequencies, thus making the carbons on the two rings distinguishable. This also applies to the hydrogens, where the three right-ring spectra have the same positive/negative feature and the left-ring pairs have negative/pseudo-![[scr A, script letter A]](https://www.rsc.org/images/entities/char_e520.gif) spectral shapes.
spectral shapes.
As noted for AZO-1, when considering the density difference versus signed measure of the NSCD in Fig. 9, no straightforward connection between the density change and the NSCD emerges. In a cross-comparison between ES3 of AZO-1 and ES4 of AZO-2, the sign pattern of the left ring (where the density difference is dominant) is preserved, whereas it is reversed on the right ring. Conversely, the sign pattern on the left ring of ES3 in AZO-2 is opposite to the one of ES4 in AZO-1. As for the right ring, all hydrogen NSCD signals are negative for both molecules, whereas the carbon NSCD of AZO-2 breaks the pattern with respect to AZO-1.
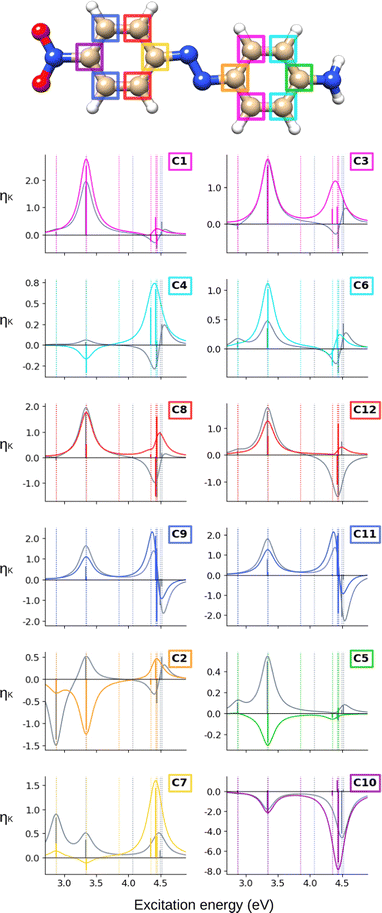
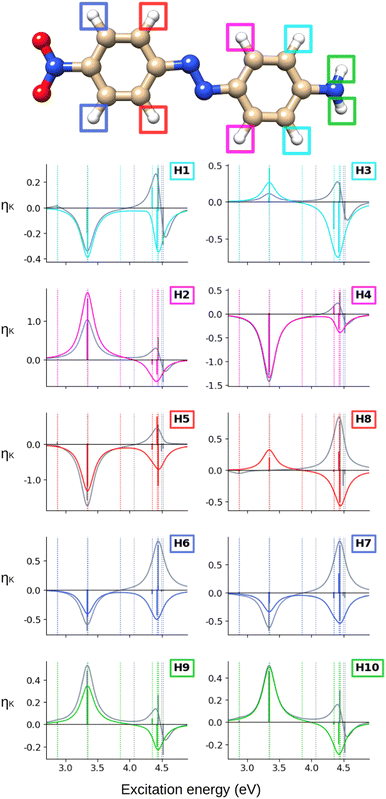
Finally, we analyze the CC2 NSCD results for AZO-3, illustrated in Fig. 10 (carbon) and Fig. 11 (hydrogen). Corresponding numerical values are found in Table S7 (ESI†).
As in the two azobenzenes previously discussed, ES1 is NSCD-dark at most carbons, except C2 (negative) and C7 (positive); the signs of the NSCD terms on these two atoms are opposite to what we saw in AZO-1 and AZO-2. The ![[scr B, script letter B]](https://www.rsc.org/images/entities/char_e13f.gif) C terms of ES2 are positive for the NMR-equivalent pairs C1+C3, C8+C12, and C9+C11. C4 and C6 have oppositely signed
C terms of ES2 are positive for the NMR-equivalent pairs C1+C3, C8+C12, and C9+C11. C4 and C6 have oppositely signed ![[scr B, script letter B]](https://www.rsc.org/images/entities/char_e13f.gif) C for ES2 (C6 is positive). At the remaining carbon nuclei,
C for ES2 (C6 is positive). At the remaining carbon nuclei, ![[scr B, script letter B]](https://www.rsc.org/images/entities/char_e13f.gif) C of ES2 is negative. ES3 is dark to NSCD for all carbons. The
C of ES2 is negative. ES3 is dark to NSCD for all carbons. The ![[scr B, script letter B]](https://www.rsc.org/images/entities/char_e13f.gif) C terms of the closely spaced ES4, ES5, and ES6 combine to give one spectral band at higher energy. For the left-ring carbons, except C7, the NSCD
C terms of the closely spaced ES4, ES5, and ES6 combine to give one spectral band at higher energy. For the left-ring carbons, except C7, the NSCD ![[scr B, script letter B]](https://www.rsc.org/images/entities/char_e13f.gif) C of ES5 and ES6 are oppositely signed and of comparable magnitude. The
C of ES5 and ES6 are oppositely signed and of comparable magnitude. The ![[scr B, script letter B]](https://www.rsc.org/images/entities/char_e13f.gif) C terms of ES5 and ES6 of the carbon atoms on the right ring, on the other hand, are more dissimilar: C1 has relatively small, oppositely signed
C terms of ES5 and ES6 of the carbon atoms on the right ring, on the other hand, are more dissimilar: C1 has relatively small, oppositely signed ![[scr B, script letter B]](https://www.rsc.org/images/entities/char_e13f.gif) C for the two states whereas the
C for the two states whereas the ![[scr B, script letter B]](https://www.rsc.org/images/entities/char_e13f.gif) C of ES6 at its NMR-equivalent C3 is almost quenched, as it is for C4 and C6.
C of ES6 at its NMR-equivalent C3 is almost quenched, as it is for C4 and C6.
At the hydrogens, see Fig. 11, ES1 and ES3 are NSCD-dark. Weak and all-negative NSCD is obtained for ES4 for the left-ring hydrogens. For this state, all NMR-equivalent hydrogens on the right ring have oppositely signed NSCD, although the amino hydrogens are almost dark. All right-ring hydrogens have negative NSCD for ES5 and are nearly dark in ES6. As for the left-ring hydrogens, ES5 and ES6 have oppositely signed ![[scr B, script letter B]](https://www.rsc.org/images/entities/char_e13f.gif) H. The spectral band convoluting ES4–ES6 is always negative. The hydrogens for ES2 have both positive and negative NSCD of medium to high intensities.
H. The spectral band convoluting ES4–ES6 is always negative. The hydrogens for ES2 have both positive and negative NSCD of medium to high intensities.
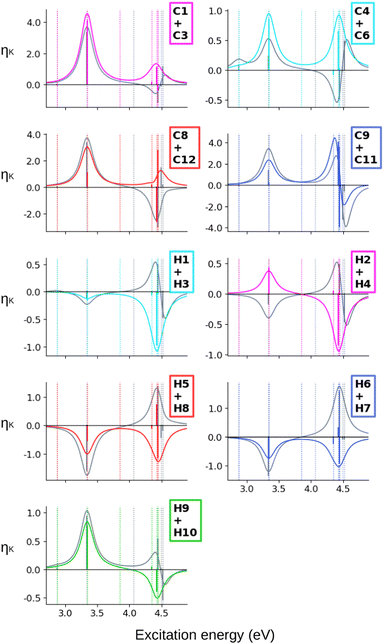
Altogether, the NSCD signals of the NMR-equivalent left-ring pairs C8+C12, and C9+C11 are very similar and both combine constructively for all excited states, see Fig. 12. Upon convolution of the terms of ES4, ES5 and ES6, an asymmetric bisignate spectral feature emerges for C9+C11, whereas a positive band characterizes this spectral region for C8+C12. On the right ring, C4+C6 combine destructively for ES2 and ES4, and constructively for ES5, which results in two positively signed bands. The combination of the NSCDs of C1+C3 enhances the signal of ES2 and partly quenches the NSCD of ES4, yielding a total positive band for ES4–ES6 which is less intense than the one for ES2. All NMR-equivalent hydrogen pairs have oppositely signed ![[scr B, script letter B]](https://www.rsc.org/images/entities/char_e13f.gif) H for at least one excited state in AZO-3. Thus, the summed spectra of the pairs H1+H3, H2+H4, and H5+H8 appear with a damped signal of ES2; ES4 is canceled out for H1+H3, H2+H4, and H9+H10, and the intensities of ES5 and ES6 are reduced in the combined H6+H7 spectrum.
H for at least one excited state in AZO-3. Thus, the summed spectra of the pairs H1+H3, H2+H4, and H5+H8 appear with a damped signal of ES2; ES4 is canceled out for H1+H3, H2+H4, and H9+H10, and the intensities of ES5 and ES6 are reduced in the combined H6+H7 spectrum.
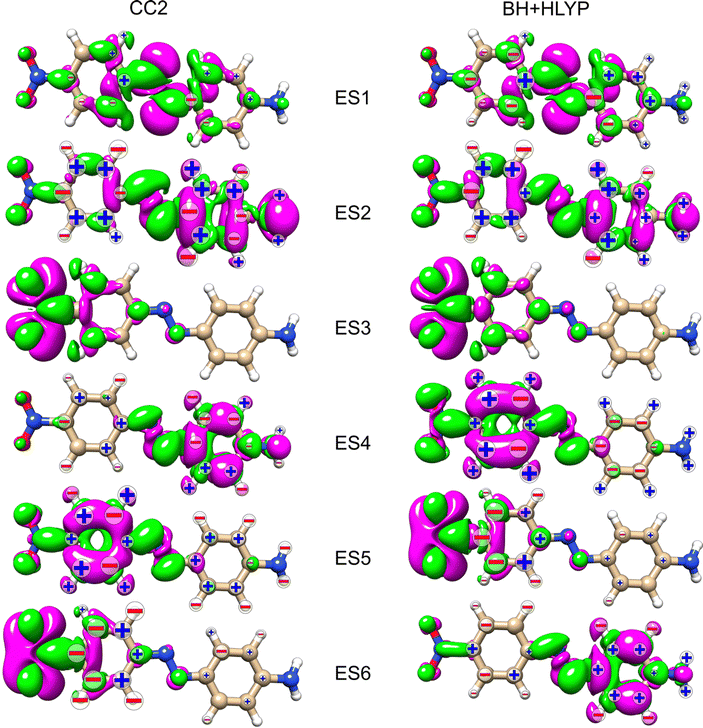
Looking at the density difference plots for AZO-3 in Fig. 13, we note that for CC2 in ES6 (ES5 for TD-DFT), where the density change is localized almost entirely on the nitro group, the NSCD of the left-ring carbons (and hydrogens for CC2) is rather strong, while the NSCD on the right ring is almost quenched. Relatively large NSCD is also observed for ES5 on some of the carbons of the left ring, where the density difference is localized, versus smaller NSCD on the right ring. These are the clearest instances observed in this study suggesting a relationship between the size of the NSCD signal and the difference density of the excited state.
4.4 CC2 versus DFT
We now move on to compare TD-DFT with CC2, looking at the spectra as well as the density difference plots. The TD-DFT NSCD spectra are provided as grey graphs in Fig. 2–4 for AZO-1, Fig. 6–8 for AZO-2, and Fig. 10–12 for AZO-3. Before comparing the NSCD spectra obtained from CC2 and TD-DFT, it is worth noting that the energy splittings of the electronic excitations are different, see Table 1. This can result in the NSCD spectra appearing to be more different than what the numerical results for the![[scr B, script letter B]](https://www.rsc.org/images/entities/char_e13f.gif) K term indicate.
K term indicate.
The first observation when comparing CC2 and TD-DFT for AZO-1 is that the spectral shapes are not strikingly different for most nuclei. The most noticeable differences are the all-zero TD-DFT NSCD signals for the first excited state (C7 is just small here) and the much smaller NSCD for C6 and much larger NSCD of C5 for ES2 at TD-DFT level compared to CC2. Interestingly, as can be seen from Fig. 5, the difference densities of ES2 differ quite significantly between the CC2 and DFT near the C5 and C6, suggesting a possible connection. In all other spectra, TD-DFT and CC2 yield the same sign of the signal of ES2, most often also producing similar intensities. All atoms of the left ring (C7–C12, H5–H8) have the same spectral feature arising from the convolution of ES3 and ES4 when comparing the methods, but closer inspection of the underlying sticks reveals that, at the TD-DFT level, the intensity is almost exclusively in ES3 while with CC2 it is split between the two states. Meanwhile, for all right-ring atoms (C1–C6, H1–H4, H10), the two methods both give NSCD intensities of opposite sign for ES3 and ES4. At the carbon atoms, their convolution yields a single band. Bisignate features are seen for all right-ring hydrogens at TD-DFT level.
Turning our attention to AZO-2, and comparing the CC2 NSCD spectra with the TD-DFT ones (in grey) in Fig. 6 and 7, the overall impression is again that the two methods are in qualitative agreement, albeit with more differences than found for AZO-1. Also for this molecule, TD-DFT yields the first excited state with vanishing NSCD signals, whereas at the CC2 level several atoms have visible spectral transitions. Looking at ES2, TD-DFT ![[scr B, script letter B]](https://www.rsc.org/images/entities/char_e13f.gif) K terms of opposite sign compared to CC2 are obtained for C6, H1, and H7; C5 has a very strong negative peak in the CC2 spectrum versus no observable strength for TD-DFT. In general, the spectra for the –NH2 substituted C5 strongly differ between TD-DFT and CC2. C6 has also nearly zero NSCD at the TD-DFT level for ES2. It is interesting to note here again that the ES2 difference densities in the surroundings of C5 and C6 noticeably differ between the DFT and CC2, similarly as in the case of AZO-1. At the right ring, TD-DFT and CC2 produce equivalent relative NSCD intensities (and sign) for the third and fourth excitation, except for C1, C5, and C6 for which the two methods yield opposite signs of the NSCD
K terms of opposite sign compared to CC2 are obtained for C6, H1, and H7; C5 has a very strong negative peak in the CC2 spectrum versus no observable strength for TD-DFT. In general, the spectra for the –NH2 substituted C5 strongly differ between TD-DFT and CC2. C6 has also nearly zero NSCD at the TD-DFT level for ES2. It is interesting to note here again that the ES2 difference densities in the surroundings of C5 and C6 noticeably differ between the DFT and CC2, similarly as in the case of AZO-1. At the right ring, TD-DFT and CC2 produce equivalent relative NSCD intensities (and sign) for the third and fourth excitation, except for C1, C5, and C6 for which the two methods yield opposite signs of the NSCD ![[scr B, script letter B]](https://www.rsc.org/images/entities/char_e13f.gif) C term of ES3. On the left ring, both methods similarly give oppositely signed
C term of ES3. On the left ring, both methods similarly give oppositely signed ![[scr B, script letter B]](https://www.rsc.org/images/entities/char_e13f.gif) C terms for ES3 and ES4, yet with different relative intensities. This results, at TD-DFT level, in one intense convoluted band (negative for carbon and positive for hydrogen), versus a weaker bisignate spectral band at CC2 level.
C terms for ES3 and ES4, yet with different relative intensities. This results, at TD-DFT level, in one intense convoluted band (negative for carbon and positive for hydrogen), versus a weaker bisignate spectral band at CC2 level.
Considering the summed spectra of AZO-2 in Fig. 8, there is a good overlap of the CC2 and TD-DFT spectra for all right-ring nuclei. For the left ring the weak bisignate feature predicted by CC2 around ES3 and ES4 for the individual carbon nuclei combines to an over-all negative band. As a result, the two methods predict the same positive/negative spectral shape for those nuclei. On the other hand, the combined NSCD for left-ring hydrogens in energy region of ES3 and ES4 provides different signatures, bisignate for CC2 and strong positive for TD-DFT, due to the relative intensities of the two transitions.
AZO-3 is the system where CC2 and TD-DFT differ the most, starting already from the ordering of the excited states. Opposite to what we observed for AZO-1 and AZO-2, TD-DFT yields stronger NSCD signals than CC2 for ES1, mainly at C2 and C7 but also at some of the other carbon nuclei (Fig. 10). The NSCD of ES2 also shows noticeable differences for C7 as well as the right ring carbons C2, C4, C5, and C6, and for H8, which is basically zero for TD-DFT (Fig. 11). ES3 is completely NSCD dark at both levels of theory. ES4–ES6 are closely spaced for both methods, yet differently ordered, as previously mentioned. Because of this, one should take care when comparing the spectral features convoluting those three transitions. In the summed spectra (Fig. 12), all peaks at ES2 exhibit the same sign for CC2 and TD-DFT, except for H2+H4. All in all, the combined TD-DFT NSCD spectra appear rather different from the CC2 ones in correspondence with the higher transitions.
Looking at the density difference plots in Fig. 13, we note that, despite the similar density difference distributions between ES4 (CC2) and ES6 (TD-DFT), there are noticeable differences in the NSCD sign patterns yielded by the two methods. Comparing ES5 (CC2) with ES4 (TD-DFT), we observe that the left-ring nuclei have similar NSCD with the sole exception of H6. The right-ring nuclei, on the other hand, have reversed sign trends (except for the almost dark C5). ES6 (CC2) and ES5 (TD-DFT) have basically identical NSCD sign patterns on the left ring, on which the density difference is concentrated.
4.5 Rationalizing trends: a sum-over-states analysis
To rationalize some of the observed trends, we carried out an SOS decomposition of the CC2![[scr B, script letter B]](https://www.rsc.org/images/entities/char_e13f.gif) K term (cf.eqn (15) and (17)) of selected carbon nuclei over a small number of excited states (twice the number of states under investigation). Bar plots of the SOS terms of the selected nuclei are provided in Fig. S6–S8 (ESI†).
K term (cf.eqn (15) and (17)) of selected carbon nuclei over a small number of excited states (twice the number of states under investigation). Bar plots of the SOS terms of the selected nuclei are provided in Fig. S6–S8 (ESI†).
Starting from AZO-1 and AZO-2, the results for excited state m = 1 (ES1, nπ*) are dominated by the ![[scr B, script letter B]](https://www.rsc.org/images/entities/char_e13f.gif) C,d contribution arising from the interaction with state k = 2 (ES2, ππ*). This can be easily rationalized since: (i) the contribution from 〈1|
C,d contribution arising from the interaction with state k = 2 (ES2, ππ*). This can be easily rationalized since: (i) the contribution from 〈1|![[small mu, Greek, circumflex]](https://www.rsc.org/images/entities/i_char_e0b3.gif) |k〉 will only be sizeable when state k also has nπ* character, so the
|k〉 will only be sizeable when state k also has nπ* character, so the ![[scr B, script letter B]](https://www.rsc.org/images/entities/char_e13f.gif) C,a should be small when k corresponds to a π → π* transition, as in this case; (ii) ϕp2 is very similar to ϕp1, which should lead to a sizeable 〈ϕhk|ĥpso|ϕhm〉 (and hence PSO transition moment between excited states), for those atoms where the occupied NTOs of both states are sizeable, as it happens here around C2 and C7, see Fig. S1 (ESI†). For state 2 of AZO-1, we see in the right phenyl ring (C2) strong interactions with state 4, and in the left ring (C9, C12) strong interactions with state 3. This can also be understood, since state 4 is localized mainly on the right ring, and state 3 is mainly on the left ring. For AZO-2, the situation is turned around, consistent with the fact that the characters of ES3 and ES4 of AZO-2 are flipped with respect to AZO-1. At C5, which is the atom bound to the (different) substituents, the situation is more complicated. Here, the
C,a should be small when k corresponds to a π → π* transition, as in this case; (ii) ϕp2 is very similar to ϕp1, which should lead to a sizeable 〈ϕhk|ĥpso|ϕhm〉 (and hence PSO transition moment between excited states), for those atoms where the occupied NTOs of both states are sizeable, as it happens here around C2 and C7, see Fig. S1 (ESI†). For state 2 of AZO-1, we see in the right phenyl ring (C2) strong interactions with state 4, and in the left ring (C9, C12) strong interactions with state 3. This can also be understood, since state 4 is localized mainly on the right ring, and state 3 is mainly on the left ring. For AZO-2, the situation is turned around, consistent with the fact that the characters of ES3 and ES4 of AZO-2 are flipped with respect to AZO-1. At C5, which is the atom bound to the (different) substituents, the situation is more complicated. Here, the ![[scr B, script letter B]](https://www.rsc.org/images/entities/char_e13f.gif) K term comprises significant contributions from several intermediate states including, for AZO-2, a coupling to the ground state (k = 0). Especially C5 of AZO-1 has strong contributions from higher-lying states, and it is noted that the small number of states included in the SOS does not produce an NSCD signal of any likeness to the analytic value (Table S9 (ESI†)).
K term comprises significant contributions from several intermediate states including, for AZO-2, a coupling to the ground state (k = 0). Especially C5 of AZO-1 has strong contributions from higher-lying states, and it is noted that the small number of states included in the SOS does not produce an NSCD signal of any likeness to the analytic value (Table S9 (ESI†)).
For state 3 in AZO-1, the most important contributions are of ![[scr B, script letter B]](https://www.rsc.org/images/entities/char_e13f.gif) K,d type and come from states 2 and 4. Those from state 2 dominate on the left ring (C9 and C12), and those from state 4 dominate on the right ring (C2 and C5). If we compare the SOS for ES3 of AZO-1 with the SOS terms of ES4 for AZO-2 (∼ES3 of AZO-1), we see that on the left ring (C9, C12) the dominating SOS contributions from state 2 to the respective states of the two azobenzenes have the same sign. Meanwhile, the smaller contributions on the right ring from state 4 to state 3 (AZO-1) and state 3 to state 4 (AZO-2) flip sign. This is because the energy denominator (Em − Ek) changes sign. The dominating contribution from state 3 to state 4 on the right ring (C2 and C5) in AZO-1 also changes sign compared to the contribution from state 4 to state 3 in AZO-2, again because of the energy denominator.
K,d type and come from states 2 and 4. Those from state 2 dominate on the left ring (C9 and C12), and those from state 4 dominate on the right ring (C2 and C5). If we compare the SOS for ES3 of AZO-1 with the SOS terms of ES4 for AZO-2 (∼ES3 of AZO-1), we see that on the left ring (C9, C12) the dominating SOS contributions from state 2 to the respective states of the two azobenzenes have the same sign. Meanwhile, the smaller contributions on the right ring from state 4 to state 3 (AZO-1) and state 3 to state 4 (AZO-2) flip sign. This is because the energy denominator (Em − Ek) changes sign. The dominating contribution from state 3 to state 4 on the right ring (C2 and C5) in AZO-1 also changes sign compared to the contribution from state 4 to state 3 in AZO-2, again because of the energy denominator.
For state 4 in AZO-1, we have again that the ![[scr B, script letter B]](https://www.rsc.org/images/entities/char_e13f.gif) K,d term from state 2 dominates on the right ring (C2, C5), while the
K,d term from state 2 dominates on the right ring (C2, C5), while the ![[scr B, script letter B]](https://www.rsc.org/images/entities/char_e13f.gif) K,d term from state 3 dominates on the left ring (C9, C12). Conversely, in ES3 of AZO-2, the dominating
K,d term from state 3 dominates on the left ring (C9, C12). Conversely, in ES3 of AZO-2, the dominating ![[scr B, script letter B]](https://www.rsc.org/images/entities/char_e13f.gif) K,d contributions are also from state 2 in the right ring, and keep their sign compared to AZO-1, while the dominating contributions in the left ring of AZO-2 (coming now from state 4) flip sign.
K,d contributions are also from state 2 in the right ring, and keep their sign compared to AZO-1, while the dominating contributions in the left ring of AZO-2 (coming now from state 4) flip sign.
As partly anticipated in Section 4.2, the first two excited states in AZO-3 are similar to the first two states in AZO-1 and AZO-2, apart from some additional charge-transfer into the –NO2 group in ES2. ES4 and ES5 are similar to the third and fourth states in AZO-2 up to two small differences: in state 4 the nodal planes are slightly rotated and in state 5 there is some additional charge-transfer to the –NO2 group; states 3 and 6 are local excitations at the –NO2 group.
The SOS NSCD of AZO-3 ES1 is dominated by the ![[scr B, script letter B]](https://www.rsc.org/images/entities/char_e13f.gif) K,d contributions from state 2, but its sign is reversed compared to the corresponding contribution in AZO-1 and AZO-2. For state 2, the contributions are similar to those for state 2 in AZO-2, but with a sign flip for the contribution from state 1 and larger contributions from higher states as well as the ground state, due to the larger ground state dipole moment. Because of its strong localization on the –NO2 group and the nπ* character, ES3 cannot strongly interact with any other state, and the
K,d contributions from state 2, but its sign is reversed compared to the corresponding contribution in AZO-1 and AZO-2. For state 2, the contributions are similar to those for state 2 in AZO-2, but with a sign flip for the contribution from state 1 and larger contributions from higher states as well as the ground state, due to the larger ground state dipole moment. Because of its strong localization on the –NO2 group and the nπ* character, ES3 cannot strongly interact with any other state, and the ![[scr B, script letter B]](https://www.rsc.org/images/entities/char_e13f.gif) K,d and
K,d and ![[scr B, script letter B]](https://www.rsc.org/images/entities/char_e13f.gif) K,a terms are negligible. In ES4, the contributions arising from states 2 and 5 have some similarity to the corresponding contributions in AZO-2, but in AZO-3 there are significant additional contributions from higher states. Due to the similarity of their virtual NTOs and the small energy gap, states 5 and 6 strongly interact. This gives rise to large (pseudo-
K,a terms are negligible. In ES4, the contributions arising from states 2 and 5 have some similarity to the corresponding contributions in AZO-2, but in AZO-3 there are significant additional contributions from higher states. Due to the similarity of their virtual NTOs and the small energy gap, states 5 and 6 strongly interact. This gives rise to large (pseudo-![[scr A, script letter A]](https://www.rsc.org/images/entities/char_e520.gif) )
) ![[scr B, script letter B]](https://www.rsc.org/images/entities/char_e13f.gif) K terms in the left ring where the occupied NTOs of the two states are localized.
K terms in the left ring where the occupied NTOs of the two states are localized.
From the above analysis, we, therefore, conclude that for the valence excitations of these azobenzene compounds in the gas phase, NSCD essentially probes 〈k|ĥpso|m〉/(Ek − Em), i.e., the transition densities between excited states. Where the result is dominated by one or two states that are energetically close to the probed states, we can understand some of the sign patterns, e.g., when states interchange.
4.6 Substituent effects
The substituted carbon atoms counts C2, C7, and C5 in all three azobenzenes, as well as C10 in AZO-3.For the bridged atoms C2 and C7 we make the same (CC2) observations in both AZO-1 and AZO-2, namely that they are bright in ES1, they exhibit similar signals for ES2, where the transition is localized around the N![[double bond, length as m-dash]](https://www.rsc.org/images/entities/char_e001.gif) N group, while at higher energies their respective signals resemble more the ones of their neighbouring carbon nuclei. In AZO-3, on the other hand, the two atoms do not follow each other at ES2. In this case, C2 has a strong signal for ES2 and weaker signals for ES3 and ES4 while the opposite is true for C7, looking at the CC2 results only.
N group, while at higher energies their respective signals resemble more the ones of their neighbouring carbon nuclei. In AZO-3, on the other hand, the two atoms do not follow each other at ES2. In this case, C2 has a strong signal for ES2 and weaker signals for ES3 and ES4 while the opposite is true for C7, looking at the CC2 results only.
With respect to C5 in AZO-1, the (CC2) signals are significantly damped compared to all other spectra, although the sign pattern follows that of its neighbouring C4+C6 pair. Comparing with TD-DFT, the two methods produce the same signed features in the C5 spectrum and damped NSCD around ES3 and ES4, but here TD-DFT suggests a much stronger ES2. Meanwhile, C5 in AZO-2, compared to the aggregated C4+C6 spectrum, has a significantly different CC2 spectrum with a strong, negative NSCD of ES2 and a weak negative convolution of ES3 and ES4. We note that on the TD-DFT level, ES2 is completely NSCD-dark for C5 (AZO-2) and the spectrum at higher energies shows a weak, positive feature, which is more consistent with a hypothesis of the substituent having a damping effect on the NSCD compared to the carbon nuclei in the local environment.
These observations sum up to the following: CC2 and TD-DFT do not predict similar spectra for C5, and the –OH and –NH2 substituents seem to influence the carbon atom to which they are bound, differently. These substituents do not seem to affect the surrounding atoms.
AZO-3, as AZO-2, has an amino group attached to C5. In fact, the two molecules’ C5 have in common the over-all spectral features (for CC2) with two negative features and ES2 being stronger than the (very weak) high-energy region. However, C5 in AZO-2 is visible in ES1, and ES2 is much stronger compared to C5 in AZO-3 which generally has a spectrum of very low intensity.
At the CC2 level, C10, which has no substituent for AZO-2, exhibits a spectrum different from and much weaker than its nearest neighbours while the TD-DFT results indicate similar spectra for all left ring nuclei except C7. Possibly, this carbon (C10) experiences some influence from the N![[double bond, length as m-dash]](https://www.rsc.org/images/entities/char_e001.gif) N group which, in turn, is affected by the amino group in para position on C5, where the two methods produce rather different spectra. It could be that TD-DFT fails to capture some effects arising from the –NH2 nitrogen atom which, on the other hand, are captured by the correlated CC model. This propagation of perturbation along the chain C5–C2–C7–C10 could also be an explanation for the quite different NSCD of all of these atoms between AZO-2 and AZO-3 and between TD-DFT and CC2. The difference between TD-DFT and CC2 appear to be enhanced, especially along C5–C2–C7, when comparing AZO-3 to AZO-2, suggesting that the combination of an electron-donating and electron-withdrawing group challenges the suitability of TD-DFT/BH+HLYP for this application.
N group which, in turn, is affected by the amino group in para position on C5, where the two methods produce rather different spectra. It could be that TD-DFT fails to capture some effects arising from the –NH2 nitrogen atom which, on the other hand, are captured by the correlated CC model. This propagation of perturbation along the chain C5–C2–C7–C10 could also be an explanation for the quite different NSCD of all of these atoms between AZO-2 and AZO-3 and between TD-DFT and CC2. The difference between TD-DFT and CC2 appear to be enhanced, especially along C5–C2–C7, when comparing AZO-3 to AZO-2, suggesting that the combination of an electron-donating and electron-withdrawing group challenges the suitability of TD-DFT/BH+HLYP for this application.
By adding a nitro group to C10 (AZO-3), stark effects are observed. Firstly, the high-energy states are convoluted by the strongest peak observed for all other nuclei in all three molecules. The increase of ![[scr B, script letter B]](https://www.rsc.org/images/entities/char_e13f.gif) C value also applies to the other carbon atoms in the left phenyl ring, especially in the transitions that are localized on the nitro group. The hydrogens seem to be unaffected by the electron-withdrawing group. TD-DFT and CC2 produce similar spectra for C10 but not for C5.
C value also applies to the other carbon atoms in the left phenyl ring, especially in the transitions that are localized on the nitro group. The hydrogens seem to be unaffected by the electron-withdrawing group. TD-DFT and CC2 produce similar spectra for C10 but not for C5.
4.7 Solvent effects
COSMO calculations were carried out for the second excited state of AZO-3 (the charge-transfer transition). The effect of three solvents was examined; C6H12, CHCl3, and DMSO. These solvents represent both polar and nonpolar ones. The NSCD signals from gas-phase and COSMO calculations are plotted in Fig. 14. The results are plotted as bars in the order of increasing polarity, i.e., gas phase < C6H12 < CHCl3 < DMSO. Numerical data are collected in Table S8 and NTOs can be found in Fig. S5 (ESI†).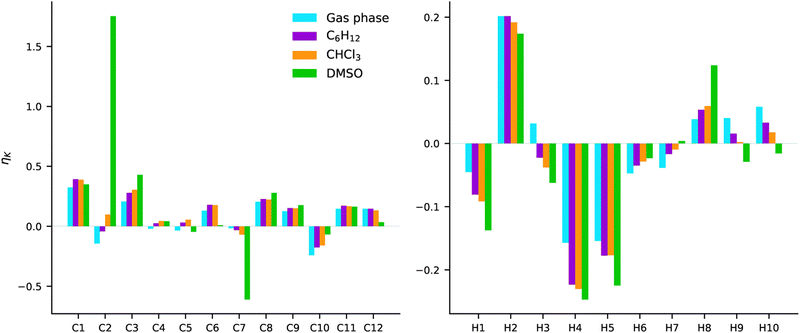 | ||
| Fig. 14 AZO-3. NSCD of excited state 2. RI-CC2/aug-cc-pwCVDZ results from gas phase and COSMO calculations in C6H12, CHCl3, and DMSO. | ||
The most striking observation is the very strong (and oppositely signed) NSCD of C2 and C7 in DMSO. In the other three environments, those same nuclei have signals that are among the weakest calculated for the carbon nuclei.
With respect to the effect of increasing polarity, we observe in several cases, especially for the hydrogens, a systematic increase or decrease in the NSCD strength with increasing polarity. However, there does not appear to be a trend related to molecular structure and to which nuclei exhibit increasing or decreasing NSCD signals.
For most nuclei, the NSCD has the same sign in all environments, with modulation of intensities. The exceptions for hydrogen are H3, H7, and the amino hydrogens H9 and H10. In all mentioned cases, it is either the results obtained in gas-phase or DMSO that deviate from the others. For the amino hydrogens the NSCD is positive in gas phase, C6H12, and CHCl3 with a systematic and striking decrease in intensity. Meanwhile, the signals are negative in DMSO. For these hydrogens, one should note that they can form hydrogen bonds to the oxygens in DMSO and to other AZO-3 molecules if the concentration is high. These effects are not captured by COSMO. Nevertheless, for all cases, the NSCD intensity has a monotonic increase or decrease with the increasing polarity of the solvent. There are three exceptions for the carbon nuclei with respect to producing the same sign in all environments: C2, C4, and C5. For C2 the trend is a monotonic increase in NSCD, while for C4 and C5 there is no clear trend. Both C4 and C5 have very weak signals, which makes them more susceptible to switching signs with even small perturbations of intensities, compared to, e.g., similar fluctuations in C1 which has a stronger overall signal.
All in all, the starkest contrast to the signals computed in gas phase is obtained with the very polar DMSO solvent. The solvent effects seem to be most pronounced on the carbons bound to the N![[double bond, length as m-dash]](https://www.rsc.org/images/entities/char_e001.gif) N group, and the amino hydrogens for which proper description of hydrogen bonding between the molecule and the solvent can be of importance.
N group, and the amino hydrogens for which proper description of hydrogen bonding between the molecule and the solvent can be of importance.
5. Conclusions
We have presented a computational approach for the calculation of the nuclear spin-induced circular dichroism property at the RI-CC2 level of theory. The implementation was demonstrated on a set of derivates of azobenzene, and the results were compared with the NSCD obtained from TD-DFT (BH+HLYP).Comparing TD-DFT and CC2, a main observation is that the former seems to be less sensitive to the substituents. The spectra of the substituted C5 nucleus differed between the two methods for all three compounds, and for TD-DFT these spectra were similar in features to the neighboring, non-substituted carbon atoms. Furthermore, the discrepancies between the correlated and density-based methods have been found to follow the substituent character, especially for the chain of substituted atoms C5–C2–C7–C10. While –OH only influenced C5, the perturbative effect of –NH2 propagated along the chain of substituted atoms. This propagation of discrepancies was amplified when adding a nitro group to C10.
This has implications for the selection of the computational method. Previous theoretical studies of NSCD, which were so far limited to the TD-DFT method, adopted the BH+HLYP functional since this had been proven to provide good results for the related NSOR effect,8,21 and therefore considered to be also suitable for NSCD. However, our study suggests that the functional does not provide a sufficiently good description of the substituent effects and/or the excited states. With the new implementation of CC2, it is possible to benchmark different functionals for this property, keeping in mind that CC2 is not suited for strongly correlated systems.53 CC2 is also known to have issues for Rydberg excited states, doubly excited states, and core excited states, where it is less accurate than for valence excitations of closed-shell single-reference molecules, as those studied in the current work. In problematic spectral regions, a method with connected triples as, e.g., the CC3 model54 is usually needed to improve systematically upon CC2. CCSD is not sufficient for this.34 However, due to the huge computational costs for CC3 and the very large number of response equations that need to be solved for NSCD, such calculations are currently not possible for molecules that could be of experimental interest for NSCD measurements.
The substituent effects were found to be pronounced on the carbon nuclei only. While electron-donating groups appear to have little effect on the NSCD of the neighboring nuclei, the introduction of an electron-withdrawing group (strongly) enhances the strength of the NSCD of the carbon atoms in the local environment. This is especially observed when the transition is localized on the electron-withdrawing group. This relation, if proven more general, might have the potential to enable the experimental identification of the localization of a transition in a molecule with an electron-withdrawing group. The carbons with an electron-donating group exhibit in all cases damped signals at higher energies.
Compared to a previous study,20 no clear cases of the NSCD-bright nuclei following the localization of the excitation were observed, although no strong NSCD was computed for nuclei without any difference density either. ES6 of AZO-3 (at CC2 level) offered the clearest example of this trend, a transition with a density difference strongly localized on the electron-withdrawing nitro group.
Relating our CC2 findings to an expected experiment for these systems, the results for AZO-1 and AZO-2 show that it is possible to distinguish the carbon atoms from the left and right rings based on the spectral shape. The carbons with an electron-donating group can be identified from damped signals, and the atoms connected by the N![[double bond, length as m-dash]](https://www.rsc.org/images/entities/char_e001.gif) N bridge can also be identified and assigned to the left or the right ring based on spectral shape. Distinguishing left from right did not prove to be straightforward for AZO-3.
N bridge can also be identified and assigned to the left or the right ring based on spectral shape. Distinguishing left from right did not prove to be straightforward for AZO-3.
The solvation study suggests that a solvent has the potential to strongly alter the NSCD of certain nuclei. In the presented case, DMSO enhances the NSCD signals of the bridged C2 and C7 significantly while C6H12 and CHCl3 did not bring about any striking changes compared to the gas phase calculations. It is interesting to note that previous studies of the influence of implicit solvent55,56 on the related NSOR effect showed only quantitative difference, affecting proportionally the strength of the signal, but not its sign. This suggests a larger importance of solvent effects for NSCD than for NSOR.
A major finding is that the ordering of the excited states can directly influence the predictions of the NSCD. From the SOS study it was illustrated how, in some situations, the sign of the ![[scr B, script letter B]](https://www.rsc.org/images/entities/char_e13f.gif) C term can flip by interchanging two strongly coupled states. As a result, the predicted NSCD can depend on the ordering of the transitions predicted by the theoretical model which, in turn, depends on the chosen combination of method and basis set. This effect resulted in opposite signs of the NSCD in an entire phenyl group between the equivalent excitations of AZO-1 and AZO-2 and between CC2/ES5 and TD-DFT/ES6 of AZO-3.
C term can flip by interchanging two strongly coupled states. As a result, the predicted NSCD can depend on the ordering of the transitions predicted by the theoretical model which, in turn, depends on the chosen combination of method and basis set. This effect resulted in opposite signs of the NSCD in an entire phenyl group between the equivalent excitations of AZO-1 and AZO-2 and between CC2/ES5 and TD-DFT/ES6 of AZO-3.
From this observation, it can be argued that if the sign of the NSCD depends on the localization of the excited states on the left or right ring as well as their energy order, NSCD can give an idea about the (relative) order of the (left/right localized) excitations. Although this would indeed require further analysis of the NTOs in combination with the NSCD to obtain a well-founded understanding of the observations, the insight into the nature of the excited states obtained from such investigations might provide valuable information in efforts devoted to the development of materials with tailored photophysical properties (e.g., for applications such as organic LEDs, artificial photosynthesis, organic photovoltaic cells, or photocatalysts).
Author contributions
PŠ and SC conceptualized and supervised the project. JHA and CH implemented the methodology. JHA and PŠ carried out the calculations. All authors discussed the science and contributed to the writing of the manuscript.Conflicts of interest
There are no conflicts to declare.Acknowledgements
JHA and SC acknowledge financial support from the Independent Research Fund Denmark – Natural Sciences, RP2 grant no. 7014-00258B. PŠ acknowledges the financial support from the Academy of Finland (Grant 316180). The support from the Kvantum institute (University of Oulu) is acknowledged. The RI-CC2 calculations with Turbomole were carried out on DTU Computing Center resources.57 Additional computational resources were provided by CSC – IT Center for Science (Espoo, Finland) and the Finnish Grid and Cloud Infrastructure project (persistent identifier urn:nbn:fi:research-infras-2016072533).Notes and references
- I. M. Savukov, S. Lee and M. V. Romalis, Nature, 2006, 442, 1021–1024 CrossRef CAS PubMed.
- T. Lu, M. He, D. Chen, T. He and F. Liu, Chem. Phys. Lett., 2009, 479, 14–19 CrossRef CAS.
- S. Ikäläinen, M. V. Romalis, P. Lantto and J. Vaara, Phys. Rev. Lett., 2010, 105, 153001 CrossRef.
- G. Yao, M. He, D. Chen, T. He and F. Liu, Chem. Phys., 2011, 387, 39–47 CrossRef CAS.
- G. Yao, M. He, D. Chen, T. He and F. Liu, Chem. Phys. Chem., 2012, 13, 1325–1331 CrossRef CAS.
- S. Ikäläinen, P. Lantto and J. Vaara, J. Chem. Theory Comput., 2012, 8, 91–98 CrossRef PubMed.
- T. S. Pennanen, S. Ikäläinen, P. Lantto and J. Vaara, J. Chem. Phys., 2012, 136, 184502 CrossRef.
- J. Shi, S. Ikäläinen, J. Vaara and M. V. Romalis, J. Phys. Chem. Lett., 2013, 4, 437–441 CrossRef CAS PubMed.
- L. Fu and J. Vaara, J. Chem. Phys., 2013, 138, 204110 CrossRef PubMed.
- L. Fu, A. Rizzo and J. Vaara, J. Chem. Phys., 2013, 139, 181102 CrossRef PubMed.
- L. Fu and J. Vaara, Chem. Phys. Chem., 2014, 15, 2337–2350 CrossRef CAS.
- L. Fu and J. Vaara, J. Chem. Phys., 2014, 140, 024103 CrossRef PubMed.
- J. Vähäkangas, P. Lantto and J. Vaara, J. Phys. Chem. C, 2014, 118, 23996–24005 CrossRef.
- F. Chen, G. Yao, T. He, D. Chen and F. Liu, Chem. Phys., 2014, 453, 57–61 CrossRef.
- J. Vaara, A. Rizzo, J. Kauczor, P. Norman and S. Coriani, J. Chem. Phys., 2014, 140, 134103 CrossRef.
- M. Straka, P. Štěpánek, S. Coriani and J. Vaara, Chem. Commun., 2014, 50, 15228–15231 RSC.
- F. Chen, G. Yao, Z. Zhang, F. Liu and D. Chen, Chem. Phys. Chem., 2015, 16, 1954–1959 CrossRef CAS PubMed.
- P. Štěpánek, S. Coriani, D. Sundholm, V. A. Ovchinnikov and J. Vaara, Sci. Rep., 2017, 7, 46617 CrossRef.
- Y. Zhu, Y. Gao, S. Rodocker, I. Savukov and C. Hilty, J. Phys. Chem. Lett., 2018, 9, 3323–3327 CrossRef CAS PubMed.
- P. Štěpánek and S. Coriani, Phys. Chem. Chem. Phys., 2019, 21, 18082–18091 RSC.
- P. Štěpánek and A. M. Kantola, J. Phys. Chem. Lett., 2019, 10, 5458–5462 CrossRef.
- A. D. Buckingham and P. J. Stephens, Ann. Rev. Phys. Chem., 1966, 17, 399–432 CrossRef CAS.
- P. N. Schatz and A. J. McCaffery, Q. Rev., Chem. Soc., 1969, 23, 552–584 RSC.
- P. J. Stephens, J. Chem. Phys., 1970, 52, 3489–3516 CrossRef CAS.
- P. J. Stephens, Ann. Rev. Phys. Chem., 1974, 25, 201–232 CrossRef CAS.
- W. R. Mason, A practical guide to magnetic circular dichroism spectroscopy, John Wiley & Sons, Ltd, 2007 Search PubMed.
- T. Kjærgaard, S. Coriani and K. Ruud, Wiley Interdiscip. Rev.: Comput. Mol. Sci., 2012, 2, 443–455 Search PubMed.
- P. Norman, D. M. Bishop, H. J. A. Jensen and J. Oddershede, J. Chem. Phys., 2001, 115, 10323–10334 CrossRef CAS.
- P. Norman, D. M. Bishop, H. J. A. Jensen and J. Oddershede, J. Chem. Phys., 2005, 123, 194103 CrossRef.
- T. Helgaker, P. Jørgensen and J. Olsen, Molecular electronic-structure theory, John Wiley & Sons Ltd, 2000 Search PubMed.
- O. Christiansen, H. Koch and P. Jørgensen, Chem. Phys. Lett., 1995, 243, 409–418 CrossRef CAS.
- C. Hättig and F. Weigend, J. Chem. Phys., 2000, 113, 5154–5161 CrossRef.
- C. Hättig and A. Köhn, J. Chem. Phys., 2002, 117, 6939–6951 CrossRef.
- D. Kánnár and P. G. Szalay, J. Chem. Theory Comput., 2014, 10, 3757–3765 CrossRef.
- S. K. Khani, R. Faber, F. Santoro, C. Hättig and S. Coriani, J. Chem. Theory Comput., 2019, 15, 1242–1254 CrossRef CAS PubMed.
- S. G. Balasubramani, G. P. Chen, S. Coriani, M. Diedenhofen, M. S. Frank, Y. J. Franzke, F. Furche, R. Grotjahn, M. E. Harding, C. Hättig, A. Hellweg, B. Helmich-Paris, C. Holzer, U. Huniar, M. Kaupp, A. Marefat Khah, S. Karbalaei Khani, T. Müller, F. Mack, B. D. Nguyen, S. M. Parker, E. Perlt, D. Rappoport, K. Reiter, S. Roy, M. Rückert, G. Schmitz, M. Sierka, E. Tapavicza, D. P. Tew, C. van Wüllen, V. K. Voora, F. Weigend, A. Wodyński and J. M. Yu, J. Chem. Phys., 2020, 152, 184107 CrossRef CAS PubMed.
- C. Lee, W. Yang and R. G. Parr, Phys. Rev. B: Condens. Matter Mater. Phys., 1988, 37, 785–789 CrossRef CAS.
- A. D. Becke, Phys. Rev. A, 1988, 38, 3098–3100 CrossRef CAS PubMed.
- S. Coriani, P. Jørgensen, A. Rizzo, K. Ruud and J. Olsen, Chem. Phys. Lett., 1999, 300, 61–68 CrossRef CAS.
- S. Coriani, C. Hättig, P. Jørgensen and T. Helgaker, J. Chem. Phys., 2000, 113, 3561–3572 CrossRef CAS.
- R. Faber, S. Ghidinelli, C. Hättig and S. Coriani, J. Chem. Phys., 2020, 153, 114105 CrossRef CAS.
- O. Christiansen, P. Jørgensen and C. Hättig, Int. J. Quantum Chem., 1998, 68, 1–52 CrossRef CAS.
- L. D. Barron, Molecular light scattering and optical activity, Cambridge University Press, 2nd edn, 2004 Search PubMed.
- S. B. Piepho and P. N. Schatz, Group theory in spectroscopy: with applications to magnetic circular dichroism, Wiley-Interscience, 1983 Search PubMed.
- A. Klamt and G. Schüürmann, J. Chem. Soc., Perkin Trans. 2, 1993, 799–805 RSC.
- K. A. Peterson and T. H. Dunning, J. Chem. Phys., 2002, 117, 10548–10560 CrossRef CAS.
- Y. J. Franzke, C. Holzer, J. H. Andersen, T. Begušić, F. Bruder, S. Coriani, F. D. Sala, E. Fabiano, D. A. Fedotov, S. Fürst, S. Gillhuber, R. Grotjahn, M. Kaupp, M. Kehry, M. Krstić, F. Mack, S. Majumdar, B. D. Nguyen, S. M. Parker, F. Pauly, A. Pausch, E. Perlt, G. S. Phun, A. Rajabi, D. Rappoport, B. Samal, T. Schrader, M. Sharma, E. Tapavicza, R. S. Treß, V. Voora, A. Wodyński, J. M. Yu, B. Zerulla, F. Furche, C. Hättig, M. Sierka, D. P. Tew and F. Weigend, J. Chem. Theory Comput., 2023, 19, 6859–6890 CrossRef CAS PubMed.
- K. Aidas, C. Angeli, K. L. Bak, V. Bakken, R. Bast, L. Boman, O. Christiansen, R. Cimiraglia, S. Coriani, P. Dahle, E. K. Dalskov, U. Ekström, T. Enevoldsen, J. J. Eriksen, P. Ettenhuber, B. Fernandez, L. Ferrighi, H. Fliegl, L. Frediani, K. Hald, A. Halkier, C. Hättig, H. Heiberg, T. Helgaker, A. C. Hennum, H. Hettema, E. Hjertenæs, S. Høst, I.-M. Høyvik, M. F. Iozzi, B. Jansík, H. J. A. Jensen, D. Jonsson, P. Jørgensen, J. Kauczor, S. Kirpekar, T. Kjærgaard, W. Klopper, S. Knecht, R. Kobayashi, H. Koch, J. Kongsted, A. Krapp, K. Kristensen, A. Ligabue, O. B. Lutnæs, J. I. Melo, K. V. Mikkelsen, R. H. Myhre, C. Neiss, C. B. Nielsen, P. Norman, J. Olsen, J. M. H. Olsen, A. Osted, M. J. Packer, F. Pawlowski, T. B. Pedersen, P. F. Provasi, S. Reine, Z. Rinkevicius, T. A. Ruden, K. Ruud, V. V. Rybkin, P. Sałek, C. C. M. Samson, A. Sánchez de Merás, T. Saue, S. P. A. Sauer, B. Schimmelpfennig, K. Sneskov, A. H. Steindal, K. O. Sylvester-Hvid, P. R. Taylor, A. M. Teale, E. I. Tellgren, D. P. Tew, A. J. Thorvaldsen, L. Thøgersen, O. Vahtras, M. A. Watson, D. J. D. Wilson, M. Ziolkowski and H. Ågren, Wiley Interdiscip. Rev.: Comput. Mol. Sci., 2014, 4, 269–284 CAS.
- DALTON, a molecular electronic structure program, Release DALTON2017 (2017), see https://daltonprogram.org, 2017.
- J. Keeler, Understanding NMR Spectroscopy, John Wiley & Sons, 2010 Search PubMed.
- K. F. Sheberstov, H.-M. Vieth, H. Zimmermann, K. L. Ivanov, A. S. Kiryutin and A. V. Yurkovskaya, Appl. Magn. Reson., 2018, 49, 293–307 CrossRef CAS PubMed.
- National Institute of Advanced Industrial Science and Technology, SDBSWeb, 2023 https://sdbs.db.aist.go.jp; https://sdbs.db.aist.go.jp/sdbs/cgi-bin/landingpage?sdbsno=1469, accessed 03/04/2023.
- M. Pabst, A. Köhn, J. Gauss and J. F. Stanton, Chem. Phys. Lett., 2010, 495, 135–140 CrossRef CAS.
- H. Koch, O. Christiansen, P. Jørgensen, A. M. Sanchez de Merás and T. Helgaker, J. Chem. Phys., 1997, 106, 1808–1818 CrossRef CAS.
- P. Štěpánek, Phys. Chem. Chem. Phys., 2020, 22, 22195–22206 RSC.
- E. Kamula, J. Vaara and P. Štěpánek, Phys. Chem. Chem. Phys., 2023, 25, 27731–27743 RSC.
- DTU Computing Center, DTU Computing Center resources, 2022, https://doi.org/10.48714/DTU.HPC.0001.
Footnotes |
| † Electronic supplementary information (ESI) available: Cartesian coordinates, transition strengths, numerical NSCD data, NTOs, SOS decomposition. See DOI: https://doi.org/10.1039/d3cp02547k |
| ‡ Present address: Department of Theoretical Chemistry and Biology, School of Engineering Sciences in Chemistry, Biotechnology and Health, KTH Royal Institute of Technology, SE-106 91 Stockholm, Sweden. |
| This journal is © the Owner Societies 2024 |

