Crystalline/amorphous nickel sulfide interface for high current density in alkaline HER: surface and volume confinement matters!†
Prince J. J.
Sagayaraj
and
Karthikeyan
Sekar
 *
*
Sustainable Energy and Environmental Research Laboratory, Department of Chemistry, Faculty of Engineering and Technology, SRM Institute of Science and Technology, Kattankulathur 603203, Tamil Nadu, India. E-mail: karthiks13@srmist.edu.in
First published on 29th May 2024
Abstract
In this work, we demonstrate an interface on porous nickel foam (NN) between crystalline nickel sulfide and amorphous nickel sulfide (NNS/NNSx) adapting simple hydrothermal and facile electrodeposition processes, respectively. The developed electrocatalyst required a low overpotential of 15 mV to deliver a current density of 10 mA cm−2 and the interface intrinsically activates the electrocatalyst with an onset overpotential comparable to that of Pt in an alkaline hydrogen evolution reaction.
Sustainable fuel production has indeed become the attention-grabbing research field over the past decade, envisioning the key goals of the conferences of parties (COP).1,2 Green hydrogen (H2) is one of the most promising fuels, generating carbon neutrality byproducts and could be produced by facile water splitting.3 Despite the progress made in several scalable technologies, the main setbacks that remain are carbon emissions, lower selectivity and the inability to evolve H2 in larger amounts. Electrocatalytic water splitting (EWS) is a highly selective and efficient way of producing green H2, with ‘zero carbon-emission’ and the highest percentage purity. EWS is regulated by two half-cell reactions: (i) the hydrogen evolution reaction (HER) at the cathode, 0 V vs. RHE and (ii) the oxygen evolution reaction (OER) at the anode, 1.23 V vs. RHE.4,5 Supreme EWS catalysts, such as Pt, RuO2, IrO2, Rh, or Pd, effortlessly catalyse the reaction in an acidic medium, but in an alkaline medium, due to the lack of protons, these catalysts perform only moderately and their higher cost, non-durability and challenging large-scale production also provide room for a strategic exploration of earth-abundant transition-metals for alkaline EWS.6 The sluggish 4e− OER process involves ‘3d transition metals’, which undergo surface reconstruction and create OER-active O–OH sites in the anodic potential at pH 14, and the kinetics of this whole reaction are dependent on the other half cell reaction, the HER. But in an alkaline medium, the 2e− HER process is difficult to carry out as the catalyst has to undergo an additional water-dissociation step.7 Transition metal chalcogenides (TMCs) remain new state-of-the-art materials in the developing era of new novel electrocatalysts in an alkaline medium owing to their stability, a unique d-band that could be tuned by varying the surface oxidation states and their earth abundance.8 Nickel sulfides could be controllably synthesised in different phases by varying the precursor, molar ratios of the source, and synthesis temperature. Rhombohedral Ni3S2 is earth abundant (as magnesite) and S atoms show stronger H affinity.9 Varying reports of remarkable TM sulfide catalysts with ampere-level current density have been unveiled with crystal phase management and defect inclusion linked to amorphization of the material.10,11 Amorphous electrocatalysts proved to be an alternative to their own crystalline phase, as the anisotropy induced in the lattice points enables crystal phase flexibility, allowing the incoming atoms or molecules to be adsorbed, feasibly mimicking adsorption promotors. As the structural modifications are in the bulk, the activity gets confined within both the surface and the volume of the material.12 A simple electrodeposition process on a highly crystalline material creates a crystalline/amorphous (CA) interface, wherein the amorphous sites activate the catalyst on the surface and in the bulk, with the increased electrochemical surface area (ECSA) improving electrochemical discharge and desorption kinetics.13
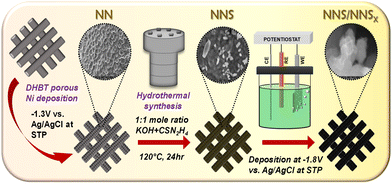
In view of this, we have developed a novel CA interface between crystalline and amorphous nickel sulfide using a simple hydrothermal and electrodeposition process. The synthetic scheme is shown in Fig. 1. Detailed information about the experimental, physical and electrochemical characterisations is provided in the ESI.†
The bare NF (Ni foam) is modified by the dynamic hydrogen bubble template (DHBT) method into NN (Ni on NF) to increase the porosity to facilitate bubble detachment and ensure the wettability of the substrate NN. The field emission scanning microscopy (FE-SEM) images (Fig. S1(a)–(d), ESI†) display bare NF and porous NN with different magnifications. The porous NN showed increased electrochemical activity with a reduced Rct of 5.68 Ω ((Fig. S2(a)–(e), ESI†)) and a greater Ru of 3.58 Ω compared to bare NF (Ru = 2.96 Ω; Rct = 8.91 Ω) confirming the creation of porosity. Hereafter, the whole work is compared with NN as the bare substrate.
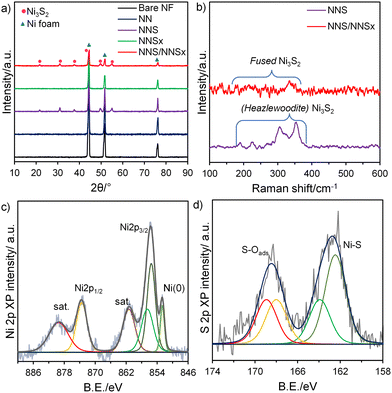
The phase purity and the degree of crystallinity of the synthesised electrocatalysts were confirmed by the X-ray diffraction (XRD) patterns (Fig. 2(a)). All the catalysts showed the characteristic metallic Ni foam peaks diffracted at 2θ values of 44.39°, 51.67°, and 76.09° corresponding to the (111), (200) and (222) planes, respectively (JCPDS 03-065-0380). The peaks of NNS match those of the reference (JCPDS 01-071-1682) in the rhombohedral Ni3S2 crystal system (space group: R32(155)) and heazlewoodite phase, and the reduced intensity of the metallic Ni peak proves that the Ni atoms on the plane have reacted with sulfide atoms to form NNS, indicating a successful sulfidation process. After electrodeposition of NNS/NNSx, the degree of crystallinity is lowered as a result of the creation of a CA interface. NNSx showed no peaks apart from a metallic Ni peak, which denotes its completely amorphous nature. The micro-Raman spectrum (Fig. 2(b)) shows the presence of two A1 stretching and four E bending vibrations of Ni–S belonging to the Ni3S2 phase at 187.6, 202.1, 223.6, 303.6, 324.6 and 350.3 cm−1 for NNS. NNS/NNSx revealed a fused spectrum with contributions from all Ni–S modes, as the amorphous NNSx completely shields the crystalline NNS. The X-ray photoelectron (XP) survey spectra (Fig. S3(a), ESI†) revealed the presence of Ni, S, O, and C elements. Core-level XP scans were performed to study the available valence states of the atoms in NNS/NNSx. The Ni 2p XP spectrum (Fig. 2(c)) has Ni 2p3/2 and Ni 2p1/2 peaks corresponding to binding energy (BE) values of 855.6(±0.2) eV and 873.6(±0.2) eV, respectively, attributed to the presence of Ni in the +2 oxidation state along with the satellite peaks. The Ni 2p3/2 spectrum is further deconvoluted into a peak at 856.8(±0.2) eV, which might arise from NiO formed during the synthesis process. A characteristic BE peak at 852.6(±0.2) eV is noted, assigned to a metallic Ni peak that could be formed due to the reduction of excess Ni2+ ions available during the electrodeposition process. The valence states of S are confirmed from the S 2p spectrum (Fig. 2(d)). Deconvoluted S 2p3/2 and S 2p1/2 peaks at 162.4(±0.2) eV and 163.9(±0.2) eV, respectively, confirmed the presence of disulfide anions S2− forming bonds with Ni2+ atoms on the surface, in good agreement with the XRD and Raman results. The S atom is commonly prone to the formation of oxides on the surface, as the spectra show S–O peaks at 168.1(±0.2) eV and 169.0(±0.2) eV, respectively. The O 1s and C 1s XPS spectra (Fig. S3(b) and (c), ESI†) showed their corresponding peaks with no interaction with NNS/NNSx.
 | ||
| Fig. 2 (a) XRD pattern; (b) Raman spectra for different electrocatalysts; core level XPS spectra of (c) Ni 2p and (d) S 2p for NNS/NNSx. | ||
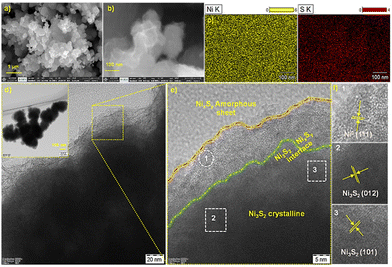
The FE-SEM images of NNS/NNSx (Fig. 3(a) and (b) and Fig. S4(a)–(c), ESI†) display the successful formation of a 3D-sheet-like morphology on porous NN. The uniform distribution of Ni and S atoms on the 3D-sheets is shown by energy dispersive X-ray (EDX) spectra (Fig. S4(d), ESI†). The morphology of NNS (Fig. S5(a), ESI†) is different from that of NNS/NNSx. Here, NN is the Ni source and directs the structure. At 120 °C, S2− anions are liberated from CSN2H4 in an alkaline medium with the evolution of NH3, creating in situ defects, and the anions then form bonds with the Ni2+ atoms generated from NN. The EDX spectra and elemental mapping (Fig. S5(b) and (c), ESI†) showed that the hydrothermal method enabled the formation of crystalline Ni3S2. Transmission electron microscopic (TEM) (Fig. 3(d)) and dark-field scanning (STEM) (Fig. S6(a), ESI†) images of NNS/NNSx evidently depict the formation of NNS on NN from the intensity contrast and the subsequent visibility of thin wrinkled sheets due to the electrodeposition of NNSx. High resolution (HR-TEM) images (Fig. 3(e)) define the formation of a CA interface in NNS/NNSx and the presence of Ni0 on the surface, as confirmed from XPS. The presence of lattice fringes corresponds to the crystalline planes (012) and (101) of NNS, alongside the (111) plane of metallic Ni0 with amorphous sheets. Fig. S6(b) and (c) (ESI†) present the selected area electron diffraction (SAED) patterns with hkl planes calculated for NNS/NNSx and reduced crystallinity, respectively.
 | ||
| Fig. 3 (a) and (b) FESEM images, (c) elemental mapping, (d) TEM and (e) HR-TEM images showing lattice fringes of NNS/NNSx. | ||
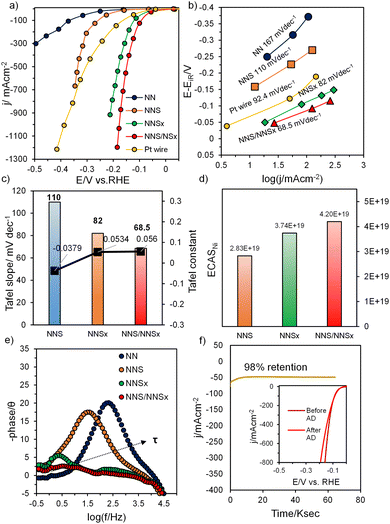
A study of the electrocatalytic HER performance of the material was carried out in a three-electrode cell setup with Ni foam serving as the counter-electrode in 1.0 M KOH. The activity of all electrodes was compared with Pt foil by 100% iR compensated linear sweep voltammogram (LSV) studies and a comparative plot of the overpotential at different current densities reflected the higher HER activity for NNS/NNSx (Fig. S7(a) and (b), ESI†). However, the HER current in LSV comes from both faradaic and non-faradaic processes (double-layer charging current), and the HER activity is again screened by adapting the sampled current voltammetry (SCV) technique, as mentioned in the ESI,† which eliminates non-faradaic current in estimating the activity. Fig. 4(a) shows the SCV plots for all the electrocatalysts derived from their respective CA studies (Fig. S8(a)–(d), ESI†). NNS/NNSx requires a significantly lower overpotential (η) of 15 mV to deliver 10 mA cm−2 while Pt requires 53 mV for 10 mA cm−2. NNSx delivers current at an η10 (37 mV) lower than that of Pt. This superior enhancement in activity is due to the presence of a CA interface in NNS/NNSx and the amorphous nature of NNSx, as confirmed from the results of XRD and HRTEM. The overpotential η10 required for crystalline NNS is 149 mV, which shows even better activity, as the rhombohedral NNS system has higher packing efficiency, with greater probability of forming Hads in close proximity, promoting facile evolution of H2.4 The line graphs for onset overpotential (Fig. S9, ESI†) for NNSx and NNS/NNSx show a lower HER onset overpotential than for Pt, which indicates the improvement in their intrinsic properties (bulk-activity) as the CA interface intrinsically provides space to create more active sites inside the bulk for adsorption, indirectly indicating the increased ECSA. Also, this HER-active electrocatalyst achieves a maximum current density of 1200 mA cm−2 at −0.18 V vs. RHE, whereas NNSx requires −0.21V vs. RHE to deliver a maximum current density of 922 mA cm−2. This catalyst exhibits enhanced HER activity comparable with previously reported NiS catalysts (Table S1, ESI†). As the HER process is kinetically controlled, the Tafel lines (Fig. 4(b)) were extracted from SCV, which show that NNS/NNSx (68.5 mV dec−1) and NNSx (82 mV dec−1) have Tafel slope values lower than Pt (92.4 mV dec−1) proving faster kinetics limited by the Volmer–Heyrovsky step. The amorphous surface accelerates the electrochemical discharge of adsorbed water with further adsorption and electrochemical discharge of another proton evolving H2. Though the reaction proceeds through the slowest step, the increased active sites promote the kinetics of HER. The increased number of electrochemically active sites (ECAS) in NNS/NNSx indicates better intrinsic activity, as seen from the values of the Tafel constant (Fig. 4(c)). The ECAS calculated through integration of the Ni reduction peak (Fig. 4(d) and Fig. S10, ESI†) is in agreement with the activity trend. To explore charge-transfer kinetics, electrochemical impedance spectra (EIS) were performed. The uncompensated resistance (Ru) and charge-transfer resistance (Rct) are in the order NNS/NNSx (2.88 Ω & 0.52 Ω) < NNSx (2.87 Ω & 1.03 Ω) < NNS (3.13 Ω & 8.2 Ω), as calculated from the Nyquist and Bode-absolute impedance plots (Fig. S11(a)–(c), ESI†), respectively. The Bode-phase angle plot (Fig. 4(e)) represents the variation in phase shift (θ) with frequency. All the materials showed a phase shift θ < 45°, which is the characteristic feature of the charge-transfer mechanism (HER is the charge-transfer process involving 2e−). The plot depicts a reducing θ value (NN – 19.8°, NNS – 17.5°, NNSx – 5.5° and NNS/NNSx – 3°) when crystalline NNS is amorphized with NNSx. The sudden decline in the θ value for a CA-interfaced material reflects better intrinsic conductivity during HER electrocatalysis. Also, the increasing RC time constant (τ) shows that the time required to charge 63.2% of the electroactive material increases, which in turn confirms the fact that the ESCA is increased with NNS/NNSx. Furthermore, the admittance value (Y) for NNS/NNSx (0.1818 Ω−1) (Fig. S11(d), ESI†), is higher than those of NNSx (0.102 Ω−1) and NNS (0.064 Ω−1), surpassing the resistivity. In addition, the double-layer capacitance of the electrode materials was calculated using the Cdl method. From the CV curves obtained in the non-faradaic region at different scan rates of 10–200 mV s−1 for NN, NNS, NNSx and NNS/NNSx (Fig. S12(a)–(d), ESI†), a linear Cdl plot was constructed (Fig. S13, ESI†). The double-layer capacitance of the electrocatalysts NN, NNS, NNSx and NNS/NNSx has Cdl values of 9.48, 12.9, 22.7 and 62 mF cm−2, respectively, where NNS/NNSx is revealed to possess a larger ECSA, as the Cdl value is directly related to the ECSA. To investigate the electrochemical robustness of the material, accelerated degradation (AD) by prolonged HER was carried out at pH 14 in 1.0 M KOH to drive the reaction at 50 mA cm−2 at a fixed potential. From Fig. 4(f) the electrode material NNS/NNSx was able to deliver a current density of 50 mA cm−2 for 64![[thin space (1/6-em)]](https://www.rsc.org/images/entities/char_2009.gif) 800 s with 98% retention. This means that the material could be used as a cathode material replacing Pt/C in proton exchange membrane (PEM) electrolysers with long-term stability and durability. Fig. 4(f) inset shows the activity of the material after AD. The SCV curve shows almost the same activity as the before-AD curve, but the kinetics of HER evolution decrease towards the more cathodic vertex potential. But the initial kinetics and the onset overpotential of the material are retained, signifying the stable intrinsic activity and the bulk property.
800 s with 98% retention. This means that the material could be used as a cathode material replacing Pt/C in proton exchange membrane (PEM) electrolysers with long-term stability and durability. Fig. 4(f) inset shows the activity of the material after AD. The SCV curve shows almost the same activity as the before-AD curve, but the kinetics of HER evolution decrease towards the more cathodic vertex potential. But the initial kinetics and the onset overpotential of the material are retained, signifying the stable intrinsic activity and the bulk property.
To study the surface characteristics of NNS/NNSx after AD, XPS was carried out. Fig. S14(a)–(d) (ESI†) show the respective core-level XP spectra of Ni, S, O and C after the HER studies. The Ni spectra showed Ni 2p3/2 and Ni 2p1/2 peaks at BE values of 856.05(±0.2) eV and 874.14(±0.2) eV, respectively, along with satellite peaks. The after-AD peaks showed a positive shift, which indicates the electron transfer from Ni to S during the reduction process. The absence of an Ni0 peak signifies the decreasing electron density on the Ni atom. The deconvoluted Ni 2p3/2 at 857.6(±0.2) eV is due to the formation of Ni(OH)2, which might be formed during the prolonged AD HER. The S spectra showed S 2p at a B.E. of 162.9(±0.2) eV, which is negatively shifted, as the electron density on the S atom with increased electronic interactions during long-term HER. The S–O peak at 168.7(±0.2) eV also shows a negative shift due to the reduction reaction on the surface of the S atom. The O 1s spectra show hydroxide adsorption at 532.4 (±0.2) eV due to long-term exposure to KOH. The C 1s spectra show increased intensity for C–O binding energy with no interaction with the material. Fig. S15(a) and (b) (ESI†) show EIS measurements after stability. From the Nyquist plot and Bode-absolute impedance, NNS/NNSx after AD exhibits a slight increase in the values of Ru and Rct to 4.15 Ω and 1.16 Ω. The Bode-phase angle plot shows an increase in phase shift value (θAD = 5°) and a slight increase in the value of the time constant. These results indicate that for NNS/NNSx after AD in alkaline KOH, the charge-transfer kinetics are lowered and the ESCA tends to be retained as the CA interface self-regulates during HER, confining the bulk and surface properties.
In summary, NNS/NNSx was synthesized via simple hydrothermal and facile electrodeposition through a steady-state technique. This electrocatalyst successfully creates a CA interface between crystalline and amorphous nickel sulfide, as confirmed by HRTEM and XRD results. The porous NN substrate synthesized by DHBT method increases the mass transfer and gas diffusion; then the deposition of wrinkled sheets of nickel sulfide creates a CA interface with more active sites and increased ECSA. This CA-interfaced NNS/NNSx exhibited outstanding HER activity with an ultra-low overpotential of 15 mV for delivery of 10 mA cm−2. Surface and volume confinement enable the material to breach the onset overpotential of the benchmark Pt even after 16 h of stability. Moreover, this strategy of creating a CA interface between crystalline and amorphous phases of metal chalcogenides could be utilized in the future for the development of new novel electrocatalysts with self-constructive properties and bulk electrocatalytic activity.
K. S. would like to thank the Royal Society-Newton International Fellowship Alumni follow-on funding support AL\211016 and AL\221024, SERB Start-up Research Grant (SRG/2023/000658) and Department of Chemistry at SRMIST. P. J. J. S. and K. S. would like to thank Dr. Ananthraj Sengeni for his constant support in electrochemical aspects.
Conflicts of interest
The authors declare no conflict of interest.Notes and references
- L. Nascimento, C. Godinho, T. Kuramochi, M. Moisio, M. den Elzen and N. Höhne, Nat. Rev. Earth Environ., 2024, 5(4), 255–257 CrossRef.
- P. J. Sagayaraj, A. Augustin, M. Shanmugam, B. Honnappa, T. S. Natarajan, K. Wilson, A. F. Lee and K. Sekar, Energy Technol., 2023, 11, 2300563 CrossRef CAS.
- S. Shenoy, C. Chuaicham, K. Sasaki, S. Park, M. Nallal, K. H. Park and K. Sekar, Chem. Commun., 2023, 59, 12451–12454 RSC.
- S. Anantharaj, S. Noda, V. R. Jothi, S. Yi, M. Driess and P. W. Menezes, Angew. Chem., Int. Ed., 2021, 60, 18981–19006 CrossRef CAS PubMed.
- J.-T. Ren, L. Chen, H.-Y. Wang, W.-W. Tian and Z.-Y. Yuan, Energy Environ. Sci., 2024, 17, 49–113 RSC.
- M. N. Lakhan, A. Hanan, A. H. Shar, I. Ali, Y. Wang, M. Ahmed, U. Aftab, H. Sun and H. Arandiyan, Chem. Commun., 2024, 60(39), 5104–5135 RSC.
- L. Gao, X. Cui, C. D. Sewell, J. Li and Z. Lin, Chem. Soc. Rev., 2021, 50, 8428–8469 RSC.
- L. Quan, H. Jiang, G. Mei, Y. Sun and B. You, Chem. Rev., 2024, 124(7), 3694–3812 CrossRef CAS PubMed.
- X. Zheng, X. Han, Y. Zhang, J. Wang, C. Zhong, Y. Deng and W. Hu, Nanoscale, 2019, 11, 5646–5654 RSC.
- J. Y. Zhang, J. Liang, B. Mei, K. Lan, L. Zu, T. Zhao, Y. Ma, Y. Chen, Z. Lv and Y. Yang, Adv. Energy Mater., 2022, 12, 2200001 CrossRef CAS.
- S. Liu, Z. Li, Y. Chang, M. Gyu Kim, H. Jang, J. Cho, L. Hou and X. Liu, Angew. Chem., Int. Ed., 2024, 63, e202400069 CrossRef CAS PubMed.
- S. Anantharaj and S. Noda, Small, 2020, 16, 1905779 CrossRef CAS PubMed.
- X. Yan, L. Tian, M. He and X. Chen, Nano Lett., 2015, 15, 6015–6021 CrossRef CAS PubMed.
Footnote |
| † Electronic supplementary information (ESI) available. See DOI: https://doi.org/10.1039/d4cc01782j |
| This journal is © The Royal Society of Chemistry 2024 |


