 Open Access Article
Creative Commons Attribution 3.0 Unported Licence
Hop natural fiber-reinforced poly(butylene succinate-co-butylene adipate) (PBSA) biodegradable plastics: effect of fiber length on the performance of biocomposites
Nicole
Harder
ab,
Arturo
Rodriguez-Uribe
 a,
Michael R.
Snowdon
a,
Manjusri
Misra
a,
Michael R.
Snowdon
a,
Manjusri
Misra
 *ab and
Amar K.
Mohanty
 ab
ab
aBioproducts Discovery and Development Centre, Department of Plant Agriculture, Crop Science Building, University of Guelph, 50 Stone Road East, Guelph, Ontario N1G 2W1, Canada. E-mail: mmisra@uoguelph.ca
bSchool of Engineering, Thornbrough Building, University of Guelph, 50 Stone Road East, Guelph, Ontario N1G 2W1, Canada
First published on 9th January 2023
Abstract
Hop fibers derived from attrition milling processing are used as reinforcements for poly(butylene succinate-co-butylene adipate) (PBSA) to produce a biodegradable material for single-use applications. The overall performance of the composite was evaluated via mechanical and thermal characterization. The produced fibers with sizes of 0.25 mm, 1 mm, and 2 mm were used at 30 wt% in the composite. The results indicated that the fiber's size distribution plays a crucial role in the performance of biocomposites. The 1 mm fiber-reinforced biocomposite showed better overall performance. This was attributed to a narrower particle size distribution. For these composites, the tensile strength at yield of biocomposites was similar to neat PBSA, with the tensile and flexural moduli and flexural strength improved by 320, 240 and 118%, respectively. The HDT increased from 60 °C in neat PBSA to ∼90 °C for composites, which is a fundamental property to expand PBSA applications.
1. Introduction
Hop products refer primarily to the inflorescences (seed cones) of the female plants of Humulus lupulus L.—belonging to the family of Cannabaceae—which are used in beer brewing to provide aroma and flavor; the rest of the plant (bines) is typically discarded.1–6 However, hop bines are rich in lignocellulosic contents and can be used as a source of short fibers.2,4,6 To date, there are limited reports on the production or use of hop-derived fibers. Existing reports are concerned with the chemical extraction/isolation of hop fibers. For example, Reddy et al. disclosed the extraction of hop fiber by chemical methods and reported a fiber length of ∼1 mm.4 Hop bines have also been subjected to fermentation to produce combustible gases, with Gebhardt et al. reporting the extraction of fibers from the residual material after the fermentation process.7 These authors describe the production of fibers of size in the range of ∼2 to 40 mm—a single-cell unit was reported at ∼ 2 mm.4,7 Haunreiter et al. published the methods to produce 1 mm–length hop fibers by the kraft pulping process, however, the concentration of fine particles (<0.2 mm) was found to be around 20%.2 However, there are no reports related to the production of fibers from hop bines by physical methods such as attrition milling or the evaluation performance of composites reinforced with hop bine-derived fibers.Attrition milling methods are generally used to produce fibers from other biomass sources such as grasses (Miscanthus sp., Switchgrass, etc.) or woody materials (mechanical pulp).8 The cost of these fibers is less than those produced by chemical extraction, and hence, they are preferred as reinforcements for fiber-plastic composites.3 In general, fibers produced by this method are considered short fibers. Short fibers are normally used to manufacture fiber-reinforced thermoplastic composites processed by extrusion and/or injection molding technologies, although other techniques such as compression molding or thermoforming can be used for their manufacture. Most polymers used with natural short fibers or natural particulate materials such as sawdust are polyolefins including polypropylene and polyethylene. These polymers are common for this purpose due to their relatively low melting point that does not exceed the degradation temperature of natural fibers when processed under normal conditions.9,10 Because of the excessive industrial dependence on these polymers, there exists the need to diversify the manufacture of composites.11 Currently, one of the most interesting trends in polymers is the ability to biodegrade or decompose in various environments (soil biodegradation, composting, home composting, and marine biodegradable). In this scenario, poly(butylene succinate-co-butylene adipate) (PBSA) is a biodegradable and compostable polymer with interesting properties for the manufacture of biocomposites.12
PBSA is produced from the co-polymerization of succinic acid (SA) and/or adipic acid (AA) in the presence of butanediol (BDO).13–19 The manufactured PBSA can also be biobased if biobased SA is used.20 There is enormous potential in SA-derived polymers such as bio-polybutylene succinate (BioPBS) and BioPBSA. SA has been traditionally synthesized using petroleum-based maleic anhydride and, most recently, via fermentation of sugars.15,18,19,21–23 Song and Lee in 2006 reported, in general, that the price of SA was between 5 and 9 USD per kilogram.24 They also compared maleic anhydride (petrol-based) and glucose prices (0.977 USD and 0.39 USD, respectively), both precursors for SA. Based on these prices, a comparative price of synthetic SA of 1.027 USD per kilogram and biobased SA of 0.428 USD per kilogram was reported, which seemed quite optimistic for the derivatization of SA via fermentation. However, in practice, SA derived by the fermentation of sugars and respective polymers is more expensive than those derived from synthetic SA or petrol-based polymers. One of the main factors probably affecting the market price is the yield of SA produced by fermentation. The same authors show for the best conditions of SA production a maximum of 100 gram per liter of culture media based on a 78 hour batch glucose-fermentation process using strains of A. succinogenes (FZ53) (a maximum of 10 kg of SA per 100 liters of culture media-water, and a yield of 0.86 g of SA per gram of glucose).22,24 Lomwongsopon and Varrone report that the production of bioplastics (including all types; bio- and non-biodegradable or biobased) represents less than 1% of the total annual production of plastics.21 Interestingly, even with this relatively low global production, the manufacture and marketing of biopolymers show that the process is industrially and commercially feasible and socially accepted.21 The example of lactic acid as a platform for the industrial production of poly(lactic acid) also shows the economic and technical feasibility of the industrial fermentative processes and suggests a bright future for biobased and/or biodegradable plastics.21,25
The study carried out by Perez-Camargo et al. illustrated the synthesis of poly(butylene succinate-co-butylene adipate) (PBSA).19 The synthesis was carried out using biosourced succinic acid (SA), adipic acid (AA), and 1,4-butanediol (BDO) in a molar ratio of 1.1![[thin space (1/6-em)]](https://www.rsc.org/images/entities/char_2009.gif) :
:![[thin space (1/6-em)]](https://www.rsc.org/images/entities/char_2009.gif) 1 (SA/AA
1 (SA/AA![[thin space (1/6-em)]](https://www.rsc.org/images/entities/char_2009.gif) :
:![[thin space (1/6-em)]](https://www.rsc.org/images/entities/char_2009.gif) BDO). The reaction was performed in a two-step process involving polycondensation followed by post-polycondensation. The reaction shows the contribution of the SA and the AA linked with BDO. These authors also showed the variation in the ratio of SA to AA and found a reduced variability without regularity in the trends of the molecular weight of the produced PBSA. All combinations of SA to AA showed a molecular weight (Mw) of ∼50 kg mol−1. Thus, in the event of using only SA in the manufacture of PBSA, the bio-content of this polymer can reach about 50% (Fig. 1).19
BDO). The reaction was performed in a two-step process involving polycondensation followed by post-polycondensation. The reaction shows the contribution of the SA and the AA linked with BDO. These authors also showed the variation in the ratio of SA to AA and found a reduced variability without regularity in the trends of the molecular weight of the produced PBSA. All combinations of SA to AA showed a molecular weight (Mw) of ∼50 kg mol−1. Thus, in the event of using only SA in the manufacture of PBSA, the bio-content of this polymer can reach about 50% (Fig. 1).19
 | ||
| Fig. 1 Structure of PBSA: A copolymer with succinic acid (SA), adipic acid (AA), and 1,4-butanediol (BDO) components. | ||
While the extraction of fibers by chemical methods of hop bine is relatively scarce, their use in composites is even more. A unique case is that reported by Ewurum et al., in which hop fibers were extracted by an alkaline method and further processed with recycled plastics.26
The purpose of this study is to show the technical feasibility of both the production of hop fibers by attrition milling of hop bines and the reinforcement of biocomposites with hop fibers of three different sizes. The work is a comprehensive study of the overall performance of the produced materials, including the mechanical, thermal, and rheological behavior. This paper discloses interesting conclusions regarding the length of the fiber produced and its effects on the overall performance. In the knowledge of the authors, there are no reports regarding the extraction of fibers from hop bines by attrition-milling processing and manufacture of biocomposites and/or studies on the performance. The use of PBSA can also be regarded as a novel approach to producing biocomposites using biodegradable and/or compostable polymers.
2. Materials and methods
2.1. Materials
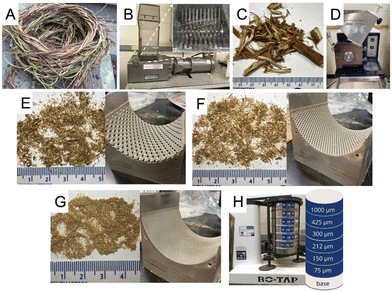
Hop bines were collected from an experimental field located in Simcoe, Ontario (Ontario Crops Research Centre, Ontario Ministry of Agriculture, Food and Rural Affairs). Fig. 2A shows the original by-product as received. Hop bines were shredded using a grinder from JWC Environmental (CA, US) (Fig. 2B). In this process, the material was reduced to particles not longer than 10 cm (Fig. 2C). The material was oven-dried to reduce the moisture content to less than 10% to avoid spoilage during the storage time. Further, the material was ground to sizes less than 0.25 mm, 1 mm, and 2 mm (Fig. 2E–G). This was achieved using a Universal Cutting Mill from Fritsch (Pulverisette 19, Idar-Oberstein Germany) (Fig. 2D) having the capacity of holding different screen sizes, in this case 0.25 mm, 1 mm, and 2 mm, as observed in Fig. 2E–G, respectively. To investigate the particle size distribution of the three different milled fiber types, a RO-TAP™ W.S. TYLER™ RX29 (Fisher Scientific, US) sieving machine was used (Fig. 2H). Although the classification was carried out using screen size sieves of 1000, 425, 300, 212, 150, and 75 microns (μm), the fibers were grouped as follows: larger than 1000 μm (X > 1000 μm), 1000 μm > X > 300 μm, 300 μm > X > 150 μm, and smaller than 150 μm (X < 150 μm).2.2. Composite fabrication
The polymer used in this study, poly(butylene succinate-co-butylene adipate) (PBSA) TH802A, was purchased from Tunhe Blue Ridge (Xinjiang, China). As per Tunhe Blue Ridge, the polymer has a weight average and a number average molecular weight of 90![[thin space (1/6-em)]](https://www.rsc.org/images/entities/char_2009.gif) 000 and 40
000 and 40![[thin space (1/6-em)]](https://www.rsc.org/images/entities/char_2009.gif) 000 daltons respectively. The reported melt flow index (MFI) in the technical data sheet was 16.8 g per 10 min at 190 °C and 2.16 kg, with the melting point listed as 103 °C. Among other available data reported in the technical data sheet (TDS), the crystallinity is reported between 30 and 45%. A complete mechanical and thermal characterization was conducted in our laboratories and presented in the results section. The manufacture of the composites was carried out using 30 wt% of either 0.25 mm, 1 mm, or 2 mm fiber in 70 wt% of the polymer. Reports show that the use of 30 wt% fiber has an optimum balance between bio-content and maximum performance of the final composites, which justifies the use of 30 wt% fiber in this study.27 The nomenclature used for each composite was PBSA/0.25 mm, PBSA/1 mm, and PBSA/2 mm. The fiber obtained was oven-dried to less than 2% or close to 1% before processing-compounding, as determined using a moisture analyzer Sartorious model MA37-1.
000 daltons respectively. The reported melt flow index (MFI) in the technical data sheet was 16.8 g per 10 min at 190 °C and 2.16 kg, with the melting point listed as 103 °C. Among other available data reported in the technical data sheet (TDS), the crystallinity is reported between 30 and 45%. A complete mechanical and thermal characterization was conducted in our laboratories and presented in the results section. The manufacture of the composites was carried out using 30 wt% of either 0.25 mm, 1 mm, or 2 mm fiber in 70 wt% of the polymer. Reports show that the use of 30 wt% fiber has an optimum balance between bio-content and maximum performance of the final composites, which justifies the use of 30 wt% fiber in this study.27 The nomenclature used for each composite was PBSA/0.25 mm, PBSA/1 mm, and PBSA/2 mm. The fiber obtained was oven-dried to less than 2% or close to 1% before processing-compounding, as determined using a moisture analyzer Sartorious model MA37-1.
Furthermore, the processing was performed using a DSM Xplore 15 ml (Xplore Instruments BV, The Netherlands) with a screw length of 150 mm and an aspect ratio of 18 and a barrel with three heating zones. An independent barrel heating temperature profile was used for processing due to the sensitivity of the material to melt at the feeding throat. Thus, a profile of 100, 130, and 140 °C was used for the feeding zone, middle barrel, and die, respectively. The manufacture or molding of the specimens for testing was conducted using the incorporated molten plastic transfer and injection molding device to produce tensile, flexural, and impact bars in compliance with ASTM D638 Type IV, ASTM D790, and ASTM D256. In this process, the mold temperature was kept to 30 °C, and the injection pressure and timing were averaged at 10 bars and 21 seconds, respectively. Similarly, the neat PBSA was injection molded to provide the baseline for composite comparison. The tensile, flexural, and impact bars were the final manufactured forms of biocomposites, with a moisture content of 0.25%. One of the main evaluations of the performance of plastics/composites is the mechanical test. The tensile and flexural properties were measured using a universal testing machine (UTS-3382 by Instron, USA), and the impact tests were performed using a Zwick/Roell HP25 (Germany) impact tester. Five samples for each formulation were notched 42 hours prior to testing per the respective standard. For this test, an Izod hammer with a capacity of 2.75 J was used.
2.3. Density
The density of the neat PBSA and its corresponding composites was measured using a densimeter MDS-300 from Qualitest (USA).2.4. Scanning electron microscopy
The morphology was studied using a Phenom ProX scanning electron microscope of Phenom-World B. V. (The Netherlands) at an accelerating voltage of 10 kV. The samples were cryofractured using liquid nitrogen, broken to expose the surface to be analyzed, and then gold-coated to improve image resolution using a 108 Manual Sputter Coater from Cressington Scientific Instruments with a six-second coating time.2.5. Melt flow index
A melt flow indexer 2000A from Qualitest was used to measure the melt flow rate or index (MFR/MFI) of each sample. For this, the conditions of 2.16 kg of weight at 190 °C were used and performed according to ASTM D1238. Furthermore, rheological studies were performed using an Anton Paar MCR 302 Rheometer. A parallel plate setup was used to perform the tests at 140 °C in an angular frequency (w) from 0.1 to 100 1 s.2.6. Fourier transform infrared
Fourier Transform Infrared-Attenuated Total Reflection (FTIR-ATR) was performed to investigate the chemical composition of the polymer and composites, and the FTIR Potassium Bromide (KBr) pellet method was used for the hop fiber. For this test, a Nicolet 6700 FTIR from Thermo Scientific, USA, was used for the characterization. Scans of 64 were taken for each of the polymer and composite sample, and 260 scans were taken for the hop fiber samples, both with a resolution of 4 cm−1.2.7. Differential scanning calorimetry
Differential scanning calorimetry (DSC) was mainly used to determine the melting point of composites compared to the neat polymer. The DSM-processed samples were run through 3 cycles using a TA Instruments TA Q200. A nitrogen flow at a rate of 50 mL min−1 was used in these experiments. Cycle 1 involved heating of samples from −70 °C to 150 °C at a ramp of 10 °C min−1. The machine remained isothermal at 150 °C for 2 minutes before beginning cycle 2. The temperature was reduced to −70 °C at 5 °C min−1 and kept isothermal for 2 minutes. Cycle 3 involves heating of samples to 150 °C and then allowing them to remain isothermal for 2 minutes before concluding the analysis. The neat PBSA and composite percentage crystallinity was determined using eqn (1) and (2), respectively. | (1) |
 | (2) |
In these equations, ΔHm is the experimental data obtained from the DSC melting peaks’ areas in J g−1,  is the theoretical value of 100% crystalline PBSA of 113.5 J g−1, and (1–Ff) is the weight fraction of the polymer in the composites.15
2.8 Dynamic mechanical analysis
Dynamic mechanical analysis (DMA) was used to investigate the effects of the fiber on the glass transition temperature and mechanical response (storage moduli). For these tests, a Dynamic Mechanical Analyzer Q800 from TA instruments was used. The test was conducted using the multi-frequency strain test mode with a dual cantilever clamp. For this analysis, the frequency and amplitude were 1 Hz and 20 μm, respectively. Liquid nitrogen was used to cool the machine to −80 °C, where then, for 3 minutes, it was isothermal before proceeding to ramp up to 50 °C at 3 °C min−1. The produced data provided the storage modulus and tan delta of each sample. DMA Q800 from TA instruments was also used to analyze the heat deflection temperature of the samples. A 3-point bending clamp was used in the controlled force mode to obtain HDT results as per ASTM D648. Equilibration at 30 °C occurred before the machine continued to ramp up to 100 °C at 2 °C min−1 with a 0.455 MPa load. The process was aborted once a displacement greater than 250 μm was reached.2.9. Thermogravimetric analysis
Thermogravimetric Analysis (TGA) was performed using a TA Q500 Thermo Gravimetric Analyzer from TA Instruments for TGA characterization. The machine was equilibrated at 30 °C before ramping up to 800 °C at 10 °C min−1.3. Results and discussion
3.1. Fiber/particle size distribution
The size of the milling screen had a large effect on the particle size distribution. Fibers milled in a 0.25 mm mesh showed two major fractions of almost 50 wt% each, one in the range of 150 to 300 μm (150 μm < X < 300 μm) and the other consisting of a fine material smaller than 150 μm (Fig. 3A). A material milled with the 1.0 mm size produced almost 70% of the material accumulated in the range of 300 μm to 1 mm. Samples milled in the 2 mm screen size had around 15% of the fraction larger than 1 mm and a distribution under 1 mm similar to the sample milled with a 1 mm mesh. Fig. 3A–C show these trends.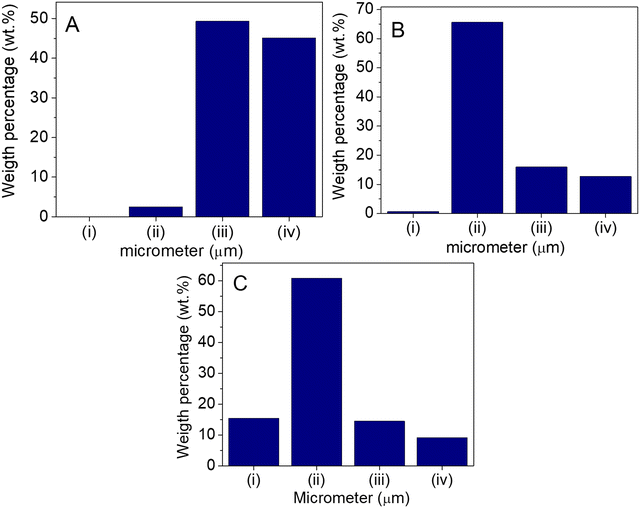 | ||
| Fig. 3 Fiber size distribution of 0.25 mm (A), 1 mm (B), and 2 mm (C) milled fiber in groups larger than 1000 (i), 1000 > x > 300 (ii), 300 > x > 150 (iii), and smaller than 150 (iv) micrometers. | ||
3.2. Mechanical properties
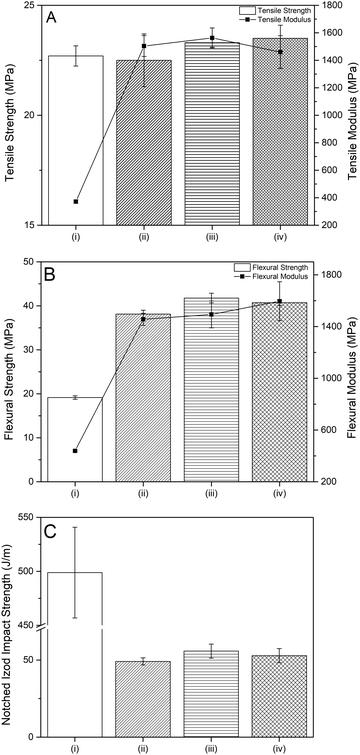
The mechanical characterization involved the tensile, flexural, and impact strength properties, shown in Fig. 4A–C, respectively. The neat PBSA had a tensile stress at a yield of 22.7 MPa. The values for the 0.25 mm, 1 mm, and 2 mm fiber-reinforced composites were 22.5 MPa, 23.3 MPa, and 23.5 MPa, respectively. Other studies observed trends of decreasing tensile strength in varying composites such as with PBAT/miscanthus, bioPBS/talc, and polyhydroxybutyrate (PHB)/agave.28–30 However, a study on PBSA with long and short fibers of polylactic acid (PLA) noticed an increase in tensile strength when the composites were processed using compression molding.31 The 1 mm and 2 mm composites had nearly identical tensile strengths, with the 2 mm composite having a strength 0.9% higher than that of the 1 mm composite. The fiber distribution assisted in the tensile strength as both 1 mm and 2 mm fibers had less particle size dispersion and demonstrated superior results to those of the 0.25 mm fiber. This agrees with PBSA/rice husk composites as the fibers were noticed to agglomerate, causing uneven distribution, which greatly influenced the results.32 The tensile modulus showed a significant increase with the addition of the fibers. The great improvement is expected to be the result of the reinforcement of fibers.28 The PBSA/1 mm composite demonstrated the maximum tensile modulus with a value of 1563 MPa, with an increase of 320% improvement from the neat PBSA. Similar results have been observed in PBAT/miscanthus and PHB/agave composites.28,29 The improved results signify the interaction between the polymer and the fibers. To confirm the interaction, the rule of mixtures was applied. For adhesion between the polymer matrix and the fiber, the elastic modulus property of the composites must fall within an upper and lower bound as follows in eqn (3) and (4), respectively.| Ec(u) = EmVm + EfVf | (3) |
 | (4) |
In these equations, Em is the elastic modulus of the matrix, Vm is the volume fraction of the matrix, Ef is the elastic modulus of the fiber, and Vf is the volume fraction of the fiber.33 The elastic moduli of the polymer and the composites were calculated in this study, while the elastic modulus of the fiber was calculated in a previous study, estimated at 21.09 GPa.4 The volume fraction of the fiber was calculated using the densities of the composites, the matrix, and the fibers, as shown in eqn (5), and the volume fraction of the matrix is equal to (1–Vf).33
 | (5) |
A density of 1.48 g cm−3 was used for the hop fiber in the calculations, as previously reported by Gebhardt et al.7 The bounds and the elastic moduli and volume fractions of the biocomposites are demonstrated in Fig. 5. It can be seen that the biocomposites have elastic moduli within the upper and lower bounds, indicating that some interaction is present. The composites are closer to the lower bound as there is likely limited stress transfer due to the potentially poor interfacial interaction between the polymer matrix and the fiber. The Nocholais–Narkis model, as discussed in a past report, was also analyzed to confirm the interaction.34 The composites demonstrated slightly higher results in the composite-matrix tensile strength ratio than the theoretical value, indicating some adhesion between the matrix and the fiber. Considering both the rule of mixtures and Nocholais–Narkis models, the experimental values are relatively close to the theoretical values, and the interfacial interaction in the composites is somewhat limited yet present.
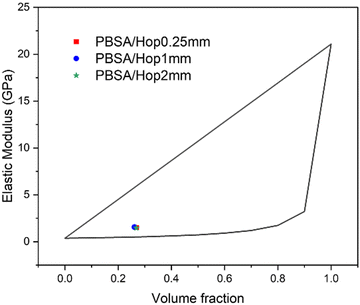 | ||
| Fig. 5 Rule of mixtures showing the experimental results of the elastic modulus property of the composites against the theoretical behavior of the composites. | ||
The flexural strength and modulus greatly increased from the neat PBSA to the composites, unlike the tensile properties. The neat PBSA showed a flexural strength of 19.2 MPa, while the PBSA/1 mm composite provided a maximum flexural strength of 41.8 MPa with a 118% improvement. This large improvement is a result of the added fibers, as they provide the material with greater reinforcement and restrict the mobility of the polymer chain.35 Contradictory to the results, Singh et al. observed little to no increase in strength with bamboo fibers, and Muthuraj et al. observed a decrease in flexural strength with miscanthus fibers, both claiming that compatibility is the most probable cause of these observations.36,37 Therefore, the type of fiber and its compatibility properties influence the trends in flexural strength. The flexural modulus improved by 264%, with the flexural modulus of PBSA/2 mm composite being 1596 MPa compared to the 439 MPa flexural modulus of the neat PBSA. The incorporated fibers have a large influence on the flexural modulus, and natural fibers often generate a greater modulus than that of the neat polymer.37,38 Singh et al. and Nagarajan et al. both reported large increases in the flexural modulus, and both concluded that the high cellulose content of the fiber could be attributed to this improvement.36,39 Properties of the fibers such as their composition, reinforcement effect, orientation, and aspect ratio can all affect flexural properties.36,39
The impact strength of neat PBSA and its composites is depicted in Fig. 4C. There was a significant reduction in the impact strength after the addition of fibers. This was anticipated as studies such as Tserki et al. observed the same trend and stated that any fiber loading would decrease the impact strength, as the impact energy is largely absorbed by the matrix.40 The neat PBSA samples all had partial break impact strength, while the composites all had hinge break impact strength. The best performed composite was the PBSA/1 mm composite; however, only a slight variability was seen in the values of the composites. There was an 89% reduction in impact strength in the PBSA/1 mm composite compared to the neat PBSA. The greater uniform distribution of the 1 mm fiber likely led to the optimal outcome of the PBSA/1 mm composite compared to the others, similar to the tensile properties.39 The neat PBSA material is known as a tough material, and the overall toughness is linked to the performance of impact properties. Adding in brittle natural fibers decreases toughness, causing the interfacial chemical bonds to weaken, reducing the strength as was seen. The weak interfacial adhesion between bonds is correlated with poor compatibility, which continues to hinder the properties of the composites.35,41 Other literature related to PBSA composites reported corresponding trends to what was seen in this present study for all the mechanical properties.32,40
3.3. Thermogravimetric analysis
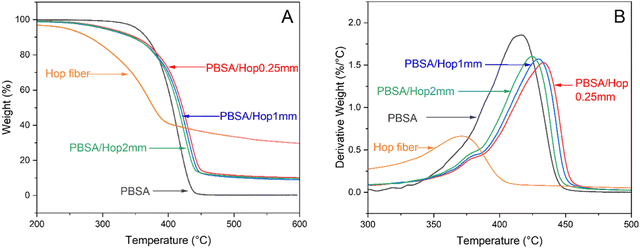
The thermal stability of the neat PBSA, hop fiber, and PBSA/hop fiber composites is shown in Fig. 6. The natural hop fiber had a low onset degradation temperature of 245 °C when 5% weight loss occurred. Nagarajan et al. found that most lignocellulosic fibers have onset degradation at 200 °C, while Singh et al. reported an onset temperature of 250 °C for bamboo fibers, comparable to the hop fiber.36,39 Due to the hydrophilic behavior of the natural fiber, the low weight loss temperature is attributed to the evaporation of the retained moisture and can be seen in any study involving natural fibers.37,41,42 It is believed that the degradation process of natural fibers starts with the decomposition of hemicellulose, cellulose, and then lignin.42 The onset of thermal degradation for the neat PBSA was around 351 °C and at 5% weight loss. In PBSA, the degradation between 250 and 350 °C is assumed to be the decomposition of the chain ends COOH and OH, while the major weight loss from 350 to 440 °C is due to the decomposition of the polyesters.18,43 The onset of degradation for the composites was lower than that of the neat polymer, averaging around 305 °C at 5% weight loss with a 13% reduction. Compared to one another, the composites had fairly similar thermal degradation. No previous analysis of the thermal stability of hop fiber has been done; however, studies using polyesters and natural fibers have reported that the addition of fibers influences the degradation process of biocomposites, causing a decrease in onset degradation temperatures.36,37 Opposed to the onset thermal degradation, the composites were observed to have higher maximum degradation than that of either the neat PBSA or the hop fiber, with a 4% increase compared to the neat PBSA. Interestingly, Muthuraj et al. observed Miscanthus fiber to have a higher maximum degradation temperature than that of both neat polymer and composites, while in this study, the hop fiber showed the lowest maximum degradation temperature.37 However, studies have stated that this observed increase indicates that the combination of the polymer and fiber results in improved thermal stability of the composites at higher temperatures.36,41 The high thermal stability proves that the lignocellulosic fiber did not impact the stability and will allow for a widened range of melt temperatures for the processing of PBSA/hop fiber composites without the risk of degradation.28,36,37 An interesting finding for this composition is that the presence of the fiber improved the thermal stability of the neat PBSA. Dolza et al., for example, showed that the incorporation of 30 wt% of hemp fiber in bio-PBSA resulted in the decrement of the thermal degradation resistance.44 The authors attributed this phenomenon to the degradation of the fiber prior to the degradation of the matrix. However, fiber-plastic interaction may play a critical role in this property.3.4. Differential scanning calorimetry
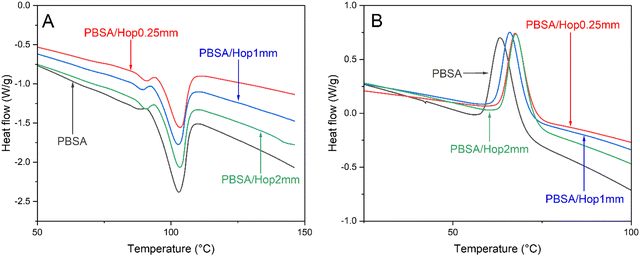
The melting temperature (Tm) and crystallization temperature (Tc) from the DSC of the neat PBSA and the PBSA/hop fiber composites are shown in Fig. 7A and B, respectively. Table 1 summarizes the detailed results of the DSC on the samples for the first cooling and second heating cycles. The melting temperature of the PBSA is around 103 °C. The melting temperature of the PBSA/hop fiber composites did not vary from the neat PBSA, as all samples had an average Tm of around 103 °C, which can be seen in Fig. 6A. The similarity of Tm indicates that the fibers do not greatly impact the melting temperature. Similar conclusions were reported in past studies using composites with Miscanthus, bamboo, and wood fibers.35,36,45 Both PBSA and PBSA/hop composites showed two melting peaks during their second heating cycle, with the first peak being more distinct in the composites. Two peaks are an indication of different crystal lamella formations, creating a heterogeneous crystal morphology.35,37,46 When the interfacial interaction in the morphology is improved, the first peak will reduce due to the new homogenous crystal morphology, this is in agreement with previous reports.30,36,46 The hop fibers did not improve the interaction in the matrix; therefore, heterogeneous crystal formation is enhanced, and the first peak of the melting cycle is more apparent in the composites than in PBSA, which is in agreement with the results reported using Miscanthus fibers.35 The melting enthalpy (ΔHm) values did decrease with the addition of the fibers due to the reduction in weight content of the polymer, as shown in Table 1.35 The crystallization temperature (Tc) of PBSA is around 63 °C and increases with the addition of hop fibers, as the composites have an average Tc of 67 °C. The increase in Tc is likely due to the nucleation effect of the hop fibers, as similar results for natural fibers have been reported in other literature studies.28,37,45 Similar to ΔHm, the crystallization enthalpy (ΔHc) decreased once the fibers were incorporated as the weight percentage of the polymer was reduced, as shown in Table 1.35 Lee and Wang also suggested that the decrease in ΔHc is a result of the polymer chain mobility restricted by the fibers.45 The percentage of crystallinity is shown in Table 1, and it can be seen that the crystallinity percentage increases with the incorporation of the hop fibers. Other literature studies had corresponding results, stating that increased nucleation led to a higher degree of crystallinity, as well as an increase in crystallization temperature.30,46 The crystallinity indicates interfacial interaction between the hop fiber and the PBSA molecular chain and will cause an influence on the mechanical properties of the samples.46,47| T m (°C) | ΔHm (J g−1) | T c (°C) | ΔHc (J g−1) | Crystallinity (%) | |
|---|---|---|---|---|---|
| PBSA | 102.7 | 55.5 | 63.4 | 65.6 | 50.3 |
| PBSA/Hop (0.25 mm) | 103.5 | 42.0 | 67.5 | 50.9 | 54.4 |
| PBSA/Hop (1 mm) | 102.6 | 44.6 | 66.0 | 50.5 | 57.7 |
| PBSA/Hop (2 mm) | 103.2 | 44.9 | 67.7 | 54.1 | 58.2 |
3.5. Dynamic mechanical analysis (storage modulus, tan delta, heat deflection temperature)
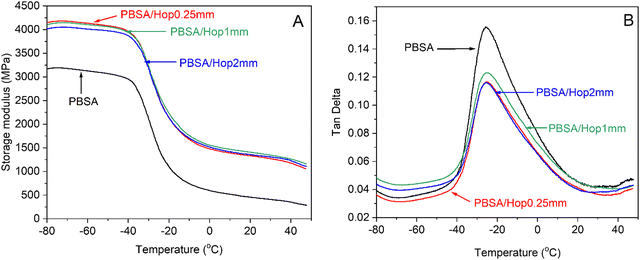
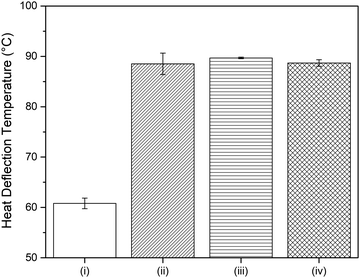
The storage modulus and tan delta for the neat PBSA and its corresponding composites are shown in Fig. 8A and B, respectively. The storage moduli for the 0.25 mm and 1 mm fiber-reinforced composites were similar and higher as compared to 2 mm fiber-reinforced composites. The neat PBSA had a much lower storage modulus than the composites, and this can be associated with the reinforcing effect that the fibers have on the composites.28,48 The higher moduli indicate that the stress response of the composites when transferring between phases is more effective.35 These results agree with the flexural modulus as were analyzed above. There can be seen a sharp reduction in storage modulus as the temperature of the samples reach their glass transition temperatures; the same was observed in PBAT and PBAT/miscanthus as reported by Muthuraj et al.28 At the glass transition temperature, the molecular chain mobility of the materials increases, creating relaxation in the chains.37,49 The glass transitions (Tg) and energy dissipations can be analyzed by the peaks and intensities of the tan delta of the polymeric materials. Tg, determined from DMA, of neat PBSA is about −25.81 °C, and that of the composites were averaged around −25.12 °C. While the tan delta did not significantly change with respect to the detection temperature (the glass transition temperature), the used frequency produced a higher damping response in 1 mm fiber-reinforced composites. The decrease in the tan delta peak is related to the energy loss from the viscous component of the polymer, not the rigid filler.46 However, in this study and a study conducted by Singh et al., addition dampening can be associated with the friction between the fibers when agglomerated.46 The higher tan delta peak indicates the least agglomeration in the PBSA/1 mm composite, also seen in the impact properties as this composite had fewer pullouts of fibers, and therefore, less friction between fibers.The heat deflection temperature measures the maximum thermal limit at which the material deforms at 250 μm with a stress force of 0.455 MPa.35 The HDT for the PBSA and the PBSA/hop composites is shown in Fig. 9. The HDT for the neat PBSA was shown to be 61 °C, while the HDT value increased by 47% to a maximum of 90 °C in the composites. The highest HDT value was attributed to the composite with 1 mm hop fibers; however, the difference in values of the composites was very minimal. Muthuraj et al. observed no distinct difference between the HDT of composites, concluding that this is due to the crystallite size of the composites being negligible.37 The increase in HDT is due to the stiffness of the composites, as the hop fiber provides a reinforcing effect to the polymer, whereas the neat polymer is more flexible.29,37 A variety of biocomposites with natural fibers have been analyzed for HDT, and all demonstrate significant improvement compared to the neat polymer; yet, the percentage of improvement differs based on the type of fiber incorporated.39
3.6. Rheology
Rheological properties regarding the complex viscosity, storage modulus, and loss modulus of the neat PBSA and the PBSA/hop fiber composites were investigated, and the results are displayed in Fig. 10A–C, respectively. The PBSA polymer started showing Newtonian flow behavior when the frequency was low; however, once the frequency started to rise, the PBSA started to decrease in viscosity. The composites demonstrated shear-thinning behavior throughout the frequency range, similar to reports of PBS/PBAT and PBS/PBAT/miscanthus by Muthuraj et al.35 The composites had similar results, with the PBSA/0.25 mm hop fiber composite showing slightly higher results. The shear-thinning behavior is a common observation in melting polymers due to the entanglement of the polymer chain. The chain entanglement restricts the mobility of the chain; however, with the increase in frequency, the chain entanglement is reduced, resulting in a gradual decrease in the complex viscosity.35,47 As shown in the figure and literature, the incorporation of the fibers leads to increased viscosity.50 Similar to what has been observed in other properties, the fibers restrict the mobility of the composites, which would lead to an increase in the viscosity, improving its performance. The storage modulus is the elastic response of a material, while the loss modulus is the viscous response of a material. The energy storage and dissipation can be measured by these rheological characterizations, storage modulus and loss modulus, respectively.39,51 The storage modulus obtained showed similar results as the storage modulus results from the DMA. The most prominent observation is the drastic difference between the neat PBSA and the composites. The composites behaved almost identically, with the 0.25 mm hop fiber composite being slightly higher for both storage and loss modulus.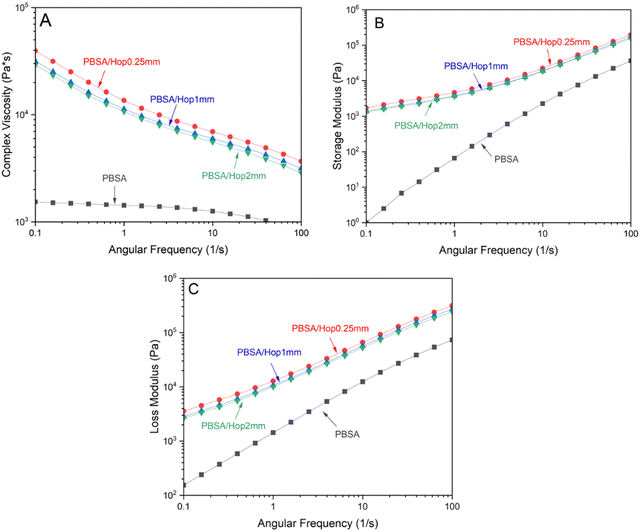 | ||
| Fig. 10 Complex viscosity (A), storage modulus (B), and loss modulus (C) of neat PBSA and PBSA/hop composites in regard to angular frequency. | ||
3.7. Melt flow index
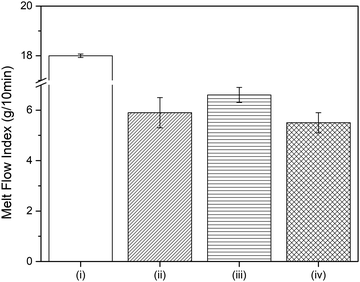
The melt flow index provides accurate indications of the behavior of the material when used for processing, such as in injection molding and blow molding.30 Often, the addition of fibers reduces the MFI of a polymer due to the restriction of flow caused by the reinforcing fibers.30 The measured melt flow index (MFI) for neat PBSA was ∼18 g/10 min, as shown in Fig. 11. With the incorporation of the hop fibers, the MFI decreased to around 5.5 g/10 min in all cases. Nagarajan et al. compared the MFI values of varying lignocellulosic fibers and reported that every type of fiber decreased the MFI in comparison to the neat polymer of its specific composite.39 It has also been reported by Sanadi et al. that the fiber characteristic and the type of fiber will influence its restriction on the polymer.52 Interestingly, the composites manufactured with the fiber produced in the 1 mm mesh showed a slightly higher MFI. This may be attributed to the agglomeration of fine particles, on the one hand, and the natural blocking of the die by larger fibers, on the other.3.8. Fourier transform infrared
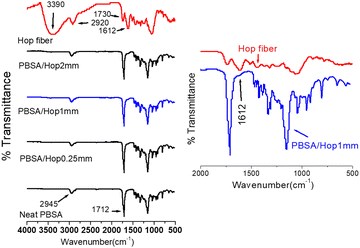
FTIR spectroscopy was performed to determine the chemical composition of the neat PBSA, hop fiber, and composites, as shown in Fig. 12. The neat PBSA has peaks at 2945, 1712, and 1155 cm−1. The vibrations of C–H stretching methylene carbons are represented by the peak at 2945 cm−1 for the PBSA. The prominent peak at 1712 cm−1 in the spectrum can be attributed to a carbonyl carbon. This C![[double bond, length as m-dash]](https://www.rsc.org/images/entities/char_e001.gif) O stretch is from the ester functional groups present in the chemical structure of PBSA.36 The asymmetrical –CO from the peak at 1155 cm−1, along with the carbonyl carbon, confirms the synthesis of the ester groups throughout the structure.18 Similar spectra have been reported for the PBSA polymer.15,18,53 Wu reported a broad peak at 3000–3700 cm−1 in the PBSA and assigned it to the O–H stretching vibration of the COOH and OH end groups.32 However, this peak was not observed in this present study due to the high molar mass of the copolyesters and a low amount of end groups, as previously stated by Debuissy et al.18 The hop fiber has peaks at 3010–3700, 2920, 1730, 1612, and 1054 cm−1. In the hop fiber, the predominant broad peak around 3010–3700 cm−1 indicates –OH stretching vibration and can be due to the hydrophilic behavior of the fiber. This same broad peak has been seen in other hydrophilic natural fibers such as switchgrass and jute fibers.27,54 Groups of C–H in the fiber are represented by the band at 2920 cm−1. Comparable to the PBSA, the hop fiber has a peak at 1730 cm−1 for the C
O stretch is from the ester functional groups present in the chemical structure of PBSA.36 The asymmetrical –CO from the peak at 1155 cm−1, along with the carbonyl carbon, confirms the synthesis of the ester groups throughout the structure.18 Similar spectra have been reported for the PBSA polymer.15,18,53 Wu reported a broad peak at 3000–3700 cm−1 in the PBSA and assigned it to the O–H stretching vibration of the COOH and OH end groups.32 However, this peak was not observed in this present study due to the high molar mass of the copolyesters and a low amount of end groups, as previously stated by Debuissy et al.18 The hop fiber has peaks at 3010–3700, 2920, 1730, 1612, and 1054 cm−1. In the hop fiber, the predominant broad peak around 3010–3700 cm−1 indicates –OH stretching vibration and can be due to the hydrophilic behavior of the fiber. This same broad peak has been seen in other hydrophilic natural fibers such as switchgrass and jute fibers.27,54 Groups of C–H in the fiber are represented by the band at 2920 cm−1. Comparable to the PBSA, the hop fiber has a peak at 1730 cm−1 for the C![[double bond, length as m-dash]](https://www.rsc.org/images/entities/char_e001.gif) O stretching vibrations. This peak and the band at 1054 cm−1 are both from hemicellulose in the fiber.7,29,54 Due to the high-water absorbance of hop fiber, some OH bending occurs at the band of 1612 cm−1, which is comparable to observations seen in hemp fibers, as reported by Haunreiter et al.2 The hop fiber demonstrated very low intensity compared to the polymer and composites. Due to the weak vibrations from the hop fiber spectrum, the fiber had minimal effects on the spectrum for the composites. The peaks of the fiber were diminished and cannot be seen in the FTIR spectra for the composites, as they had nearly identical spectra and characteristics compared to neat PBSA, apart from a slight reduction in the height of peaks. However, the little to no contribution from the fiber to the spectra in the three different composites’ spectra should not be confused with the lack of any compatibility. One interesting feature in the spectra shown in Fig. 12 is that the signal corresponding to the OH stretching vibrations at ∼3390 cm−1 in the hop fiber, despite its intensity, is not clearly visible in the spectra for the composites.33
O stretching vibrations. This peak and the band at 1054 cm−1 are both from hemicellulose in the fiber.7,29,54 Due to the high-water absorbance of hop fiber, some OH bending occurs at the band of 1612 cm−1, which is comparable to observations seen in hemp fibers, as reported by Haunreiter et al.2 The hop fiber demonstrated very low intensity compared to the polymer and composites. Due to the weak vibrations from the hop fiber spectrum, the fiber had minimal effects on the spectrum for the composites. The peaks of the fiber were diminished and cannot be seen in the FTIR spectra for the composites, as they had nearly identical spectra and characteristics compared to neat PBSA, apart from a slight reduction in the height of peaks. However, the little to no contribution from the fiber to the spectra in the three different composites’ spectra should not be confused with the lack of any compatibility. One interesting feature in the spectra shown in Fig. 12 is that the signal corresponding to the OH stretching vibrations at ∼3390 cm−1 in the hop fiber, despite its intensity, is not clearly visible in the spectra for the composites.33
3.9. Morphological analysis by scanning electron microscopy
The cross-sections of the impact tested samples were scanned by scanning electron microscopy, as shown in Fig. 13. Fig. 13A shows the cross-section of neat PBSA in which a delaminated pattern occurs throughout the surface due to the impact. Large waves can be seen and attributed to the impact fractures.55Fig. 13B shows the morphological features of the 0.25 mm fiber-manufactured composites. This image showed the presence of large amounts of pullouts, suggesting that the fiber length was not sufficient to hold the impact. These fibers were rather pulled than broken by the impact, creating large black voids on the surface.45 The yellow arrows in the figure show the site of the empty spaces produced by the pulling of the fiber due to the impact. As well, the space between the fiber and the matrix can be seen in the higher magnification of the PBSA/0.25 mm composite due to the poor interfacial interaction between the materials. Fig. 13C shows the case of composites manufactured with the fiber of 1 mm. In these samples, the absence of pullouts was the main feature to notice. A good interaction was observed between the fiber and the polymer, as shown by the white arrow. There is also virtually no space between the fiber and the matrix, indicating adequate adhesion. The 1 mm fiber had the best overall particle distribution, which is a critical feature that contributes to the morphology results seen here. This was also reported by Nagarajan et al. as they stated that a reduction in particle distance, achieved by well-dispersed particles, can help the toughness increase.47 Other studies have discussed that fibers with superior distribution tend to have fewer fiber pullouts, leading to better morphological properties.48 The PBSA/2 mm composite, shown in Fig. 13D, demonstrates pullouts of fibers, similar to the composite with 0.25 mm fibers. These pullouts are indicated by the yellow arrows. The 2 mm fibers in the composite are more likely to agglomerate due to the polarity of the fibers and polymer. The fibers are hydrophilic, and the polymer is hydrophobic; therefore, the longer length of the fibers may become more attractive to one another and not to the polymer.32,39 The morphology observations agree with the results from the mechanical properties. The poor compatibility seen in the 0.25 mm and 2 mm fibers caused a decrease in impact strength, while the 1 mm fiber had the best overall compatibility, which can be attributed to the better particle distribution and, subsequently, the best overall mechanical properties.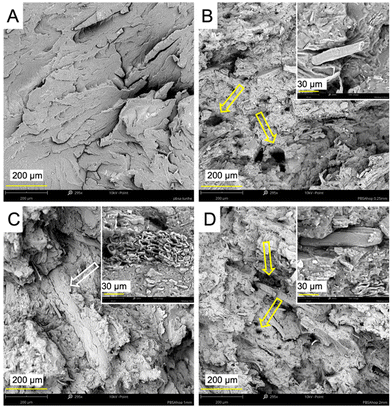 | ||
| Fig. 13 Cross-section of the impact tested specimens. Neat PBSA (A), PBSA/0.25 mm fiber (B), PBAT/1 mm fiber (C), and PBSA/2 mm fiber (D). | ||
4. Conclusions
Biocomposites were prepared using the polymer PBSA and hop fiber. The differing component between the composites was the length of the fiber incorporated, while the composition of 70 wt% PBSA and 30 wt% hop fiber remained the same throughout the composites. The composites were compared using mechanical, thermal, rheological, and morphological properties. Improvements were seen in tensile modulus, flexural strength, and flexural modulus, with no change in tensile strength, whereas there was a reduction in the impact strength. The improvements indicate that the hop fibers can be an effective reinforcement for the corresponding composites. The poor adhesion between the polymer and the fiber is the most probable explanation for the reduction seen. To avoid this difficulty, an additive compatibilizer, which can improve interaction in the matrix, can be incorporated in later studies. A significant increase was demonstrated in the HDT values with the introduction of the fibers, with the highest value being ∼90 °C for the 1 mm fiber composite. The composite with 1 mm hop fiber showed the best outcome in impact strength, flexural strength, and HDT, making it the preferable fiber length out of the composites and the recommended option for later addition of compatibilizers. The homogeneous particle size distribution of the 1 mm fiber enhanced most of the properties compared to the other fiber lengths. This was confirmed by scanning electron microscopy, as the 1 mm fiber composite demonstrated the best interaction with the matrix. The high thermal stability of the PBSA/hop fiber composites is advantageous for different applications for processing. The melting and glass transition temperatures were not affected by the incorporation of the hop fibers, suggesting that the parameters used for the neat PBSA are also suitable for the composites. This research aimed to investigate the potential of using hop fibers in biocomposites for reinforcement, as this material has not yet been researched. The findings suggest that hop fibers can be used in applications for biocomposites and serve as a sustainable alternative for biocomposite development.Author contributions
N. H., A. R., M. S.: methodology, investigation, data analysis, writing – original draft preparation; N. H., A. R., M. S., M. M., A. K. M.: writing – review and editing. A. R., M. S.: supervision; A. K. M. and M. M.: project conceptualization, methodology, administration, resources, funding acquisition and supervision. All authors contributed to the discussion, reviews and approval of the manuscript for publication.Conflicts of interest
The authors declare that they have no known conflict of interest that could have appeared to influence the work reported in this paper.Acknowledgements
The authors would like to thank the following for their financial support to carry out this research: Ontario Ministry of Economic Development, Job Creation and Trade ORF-RE09-078 (Project No. 053970 and 054345); Agriculture and Agri-Food Canada (AAFC), Maple Leaf Food, Canada and Bank of Montreal (BMO), Canada through Bioindustrial Innovation Canada (BIC) Bioproducts AgSci Cluster Program (Project No. 054015, 054449 and 800148); Natural Sciences and Engineering Research Council (NSERC), Canada Discovery Grants (Project No. 401716); and the Ontario Ministry of Agriculture, Food and Rural Affairs (OMAFRA) – University of Guelph, the Bioeconomy Industrial Uses Research Program Theme (Project No. 030486 and 030578).References
- H. Korpelainen and M. Pietiläinen, Econ. Bot., 2021, 75, 302–322 CrossRef.
- K. J. Haunreiter, A. Dichiara and R. Gustafson, Ind. Crops Prod., 2021, 174, 114217 CrossRef CAS.
- Y. Zou, N. Reddy and Y. Yang, J. Appl. Polym. Sci., 2010, 116, 2366–2373 CAS.
- N. Reddy and Y. Yang, Carbohydr. Polym., 2009, 77, 898–902 CrossRef CAS.
- K. Hong, Z. Xu, L. Wang, A. Johnpaul, Y. Cheng, C. Lv and C. Ma, Food Control, 2022, 132, 108499 CrossRef CAS.
- N. Kanai, K. Nishimura, S. Umetani, Y. Saito, H. Saito, T. Oyama and I. Kawamura, ACS Agric. Sci. Technol., 2021, 1, 347–354 CrossRef CAS.
- M. Gebhardt, N. Wanek, A. Lemmer and G. Theodor Gresser, J. Nat. Fibers, 2021, 0, 1–11 Search PubMed.
- H. J. Kim, S. Lee, J. Kim, R. J. Mitchell and J. H. Lee, Bioresour. Technol., 2013, 144, 50–56 CrossRef CAS PubMed.
- Z. Zelca, S. Kukle and J. Kajaks, Mater. Sci. Text. Cloth. Technol., 2016, 6–11 Search PubMed.
- M. Brebu, Polymers, 2020, 12, 166 CrossRef CAS PubMed.
- A. Mohanty, M. Misra, A. Rodriguez-Uribe and S. Vivekanandhan, US Pat., US20160229997A1, 2016 Search PubMed.
- A. K. Mohanty, S. Vivekanandhan, J.-M. Pin and M. Misra, Science, 2018, 362, 536–542 CrossRef CAS PubMed.
- M. Puchalski, G. Szparaga, T. Biela, A. Gutowska, S. Sztajnowski and I. Krucińska, Polymers, 2018, 10, 251 CrossRef PubMed.
- L. Aliotta, A. Vannozzi, I. Canesi, P. Cinelli, M.-B. Coltelli and A. Lazzeri, Polymers, 2021, 13, 218 CrossRef CAS PubMed.
- M. Salomez, M. George, P. Fabre, F. Touchaleaume, G. Cesar, A. Lajarrige and E. Gastaldi, Polym. Degrad. Stab., 2019, 167, 102–113 CrossRef CAS.
- Y. Wang, Y. Zhong, Q. Shi and S. Guo, J. Compos. Sci., 2021, 5, 48 CrossRef CAS.
- B. D. Ahn, S. H. Kim, Y. H. Kim and J. S. Yang, J. Appl. Polym. Sci., 2001, 82, 2808–2826 CrossRef CAS.
- T. Debuissy, E. Pollet and L. Avérous, Eur. Polym. J., 2017, 87, 84–98 CrossRef CAS.
- R. A. Pérez-Camargo, B. Fernández-d’Arlas, D. Cavallo, T. Debuissy, E. Pollet, L. Avérous and A. J. Müller, Macromolecules, 2017, 50, 597–608 CrossRef.
- A. Vinod, M. R. Sanjay, S. Suchart and P. Jyotishkumar, J. Cleaner Prod., 2020, 258, 120978 CrossRef CAS.
- P. Lomwongsopon and C. Varrone, Fermentation, 2022, 8, 47 CrossRef CAS.
- K.-K. Cheng, X.-B. Zhao, J. Zeng and J.-A. Zhang, Biofuels, Bioprod. Biorefin., 2012, 6, 302–318 CrossRef CAS.
- I. Bechthold, K. Bretz, S. Kabasci, R. Kopitzky and A. Springer, Chem. Eng. Technol., 2008, 31, 647–654 CrossRef CAS.
- H. Song and S. Y. Lee, Enzyme Microb. Technol., 2006, 39, 352–361 CrossRef CAS.
- E. Balla, V. Daniilidis, G. Karlioti, T. Kalamas, M. Stefanidou, N. D. Bikiaris, A. Vlachopoulos, I. Koumentakou and D. N. Bikiaris, Polymers, 2021, 13, 1822 CrossRef CAS PubMed.
- L. I. Ewurum, D. Jokic, E. Bar-Ziv and A. G. McDonald, Waste Biomass Valorization, 2022, 13, 4625–4637, DOI:10.1007/s12649-022-01794-x.
- V. Nagarajan, M. Misra and A. K. Mohanty, Ind. Crops Prod., 2013, 42, 461–468 CrossRef CAS.
- R. Muthuraj, M. Misra and A. K. Mohanty, J. Appl. Polym. Sci., 2017, 134, 45448 CrossRef.
- M. K. M. Smith, D. M. Paleri, M. Abdelwahab, D. F. Mielewski, M. Misra and A. K. Mohanty, Green Chem., 2020, 22, 3906–3916 RSC.
- A. Rodriguez-Uribe, T. Wang, A. K. Pal, F. Wu, A. K. Mohanty and M. Misra, Compos., Part C: Open Access, 2021, 6, 100201 CAS.
- L. Meng, C. Gao, L. Yu, G. P. Simon, H. Liu and L. Chen, J. Appl. Polym. Sci., 2016, 133(25), 43530, DOI:10.1002/app.43530.
- C.-S. Wu, Polym. Degrad. Stab., 2012, 97, 64–71 CAS.
- M. G. de Gortari, A. Rodriguez-Uribe, M. Misra and A. K. Mohanty, RSC Adv., 2020, 10, 26917–26927 RSC.
- D. Metın, F. Tihminlioğlu, D. Balköse and S. Ülkü, Composites, Part A, 2004, 35, 23–32 CrossRef.
- R. Muthuraj, M. Misra and A. K. Mohanty, RSC Adv., 2017, 7, 27538–27548 RSC.
- S. Singh, A. K. Mohanty, T. Sugie, Y. Takai and H. Hamada, Composites, Part A, 2008, 39, 875–886 CrossRef.
- R. Muthuraj, M. Misra and A. K. Mohanty, J. Appl. Polym. Sci., 2017, 134(21), 44860, DOI:10.1002/app.44860.
- K. Zhang, M. Misra and A. K. Mohanty, ACS Sustainable Chem. Eng., 2014, 2, 2345–2354 CrossRef CAS.
- V. Nagarajan, A. K. Mohanty and M. Misra, ACS Sustainable Chem. Eng., 2013, 1, 325–333 CrossRef CAS.
- V. Tserki, P. Matzinos and C. Panayiotou, J. Appl. Polym. Sci., 2003, 88, 1825–1835 CrossRef CAS.
- G. M. Arifuzzaman Khan, M. S. Alam Shams, Md. R. Kabir, M. A. Gafur, M. Terano and M. S. Alam, J. Appl. Polym. Sci., 2013, 128, 1020–1029 CrossRef CAS.
- B. Wielage, Th Lampke, G. Marx, K. Nestler and D. Starke, Thermochim. Acta, 1999, 337, 169–177 CrossRef CAS.
- T. Debuissy, E. Pollet and L. Avérous, Polymer, 2016, 99, 204–213 CrossRef CAS.
- C. Dolza, E. Gonga, E. Fages, R. Tejada-Oliveros, R. Balart and L. Quiles-Carrillo, Polymers, 2022, 14, 1968 CrossRef CAS PubMed.
- S.-H. Lee and S. Wang, Composites, Part A, 2006, 37, 80–91 CrossRef CAS.
- S. Singh, A. K. Mohanty and M. Misra, Composites, Part A, 2010, 41, 304–312 CrossRef.
- V. Nagarajan, A. K. Mohanty and M. Misra, ACS Omega, 2016, 1, 636–647 CrossRef CAS PubMed.
- S. Singh and A. K. Mohanty, Compos. Sci. Technol., 2007, 67, 1753–1763 CrossRef CAS.
- R. Muthuraj, M. Misra and A. K. Mohanty, J. Polym. Environ., 2014, 22, 336–349 CrossRef CAS.
- J. George, R. Janardhan, J. S. Anand, S. S. Bhagawan and S. Thomas, Polymer, 1996, 37, 5421–5431 CrossRef CAS.
- F. Chen and J. Zhang, Polymer, 2010, 51, 1812–1819 CrossRef CAS.
- A. R. Sanadi, D. F. Caulfield, R. E. Jacobson and R. M. Rowell, Ind. Eng. Chem. Res., 1995, 34, 1889–1896 CrossRef CAS.
- S.-K. Su and C.-S. Wu, J. Appl. Polym. Sci., 2011, 119, 1211–1219 CrossRef CAS.
- L. Liu, J. Yu, L. Cheng and X. Yang, Polym. Degrad. Stab., 2009, 94, 90–94 CrossRef CAS.
- K. W. Meereboer, A. K. Pal, M. Misra and A. K. Mohanty, ACS Omega, 2021, 6, 20103–20111 CrossRef CAS PubMed.
| This journal is © The Royal Society of Chemistry 2023 |

