 Open Access Article
Utilisation and valorisation of distillery whisky waste streams via biomass electrolysis: electrosynthesis of hydrogen
Robert
Price
 *ab,
Lewis
MacDonald
 a,
Norman
Gillies
b,
Alasdair
Day
b,
Edward
Brightman
 a and
Jun
Li
 a
a
aDepartment of Chemical and Process Engineering, University of Strathclyde, James Weir Building, 75 Montrose Street, Glasgow, G1 1XJ, UK. E-mail: robert.price@strath.ac.uk
bIsle of Raasay Distillery, R&B Distillers Ltd., Borodale House, Isle of Raasay, Kyle, Scotland, IV40 8PB, UK
First published on 6th June 2023
Abstract
Fuel-flexible hydrogen generation methods, such as electrochemical conversion of biomass, offer a route for sustainable production of hydrogen whilst valorising feedstocks that are often overlooked as waste products. This work explores the potential of a novel, two-stage electrolysis process to convert biomass-containing solid (draff/spent barley) and liquid (pot ale and spent lees) whisky co-products, from the Isle of Raasay Distillery, into hydrogen, using a phosphomolybdic acid (H3[PMo12O40] or PMA) catalyst. Characterisation results for whisky distillery co-products will be presented, including thermogravimetric, differential scanning calorimetric, CHN elemental, total organic carbon and chemical oxygen demand analysis data. The results indicated that the characteristics of these co-products align well with those reported across the Scotch whisky distillation sector. Subsequently, the concept of thermal digestion of each co-product type, using the Keggin-type polyoxometalate PMA catalyst to abstract protons and electrons from biomass, will be outlined. UV-visible spectrophotometry was employed to assess the extent of reduction of the catalyst, after digestion of each co-product, and indicated that draff and pot ale offer the largest scope for hydrogen production, whilst digestion and electrolysis of spent lees is not viable due to the low biomass content of this distillation co-product. Finally, details of electrolysis of the PMA–biomass solutions using a proton-exchange membrane electrolysis cell (PEMEC) will be provided, including electrochemical data that help to elucidate the performance-limiting processes of the PEMEC operating on digested biomass–PMA anolytes.
Introduction
The replacement of fossil fuels with ‘green’ hydrogen, produced using renewable electricity, provides an alternative route to decarbonization of sectors, such as transport and domestic/commercial/process heating.1 Typically, electrolysis of steam or water can be employed to produce hydrogen for synthesis of feedstock chemicals,2 sustainable aviation fuel,3 or to be used as a fuel in electrochemical energy conversion and combustion techniques.4 Many companies are active in the research, development and supply of electrolysis systems based upon proton-exchange membrane (PEM), alkaline, anion-exchange membrane (AEM)4 and solid-oxide electrolyte (SOE) electrochemical cells.2 There is also a growing interest in developing novel, more efficient and fuel-flexible hydrogen generation methods, capable of producing large quantities of fuel gas, using feedstocks that would otherwise go to waste.Electrochemical conversion of waste biomass offers a fuel-flexible route to sustainable, net-zero greenhouse gas emissions production of hydrogen whilst valorising waste biomass feedstocks. In recent years, the examination of polyoxometalate (POM) materials as catalysts,5,6 which can digest biomass, has been undertaken. POM materials comprise large, polyanionic MOx clusters, in which M = transition metals such as Mo, W and V,5,7 as well as a variety of cations. Oxygen atoms in the polyanionic clusters are able to act as electron donors (Lewis bases) whilst the unoccupied orbitals of the transition-metal ions are able to act as electron acceptors (Lewis acids).5 Consequently, these materials are highly redox stable, in addition to being very thermally stable, allowing thermal and electrochemical cycling to take place during the digestion of biomass. In this digestion process, electrons can be transferred from biomass to the unoccupied orbitals of the transition-metal ions to reduce the POM material, with protons also being abstracted to balance the charge. Ultimately, the reduced-POM catalyst can undergo electrolysis either in ‘bulk’ electrolyte solutions or in electrochemical membrane reactors to produce high-purity hydrogen gas, whilst regenerating the POM catalyst.8–10
Electrolysis of biomass–POM solutions gives rise to generation of hydrogen from biomass sources and occurs at significantly lower voltages (<950 mV)9 than the standard potential of water electrolysis (1230 mV) or 1500–1600 mV in practical commercial PEM electrolysers,9,11,12 as it avoids the sluggish electrode kinetics of the oxygen evolution reaction, and does not require expensive iridium-based catalysts to function effectively. Consequently, the electricity demand and, thus, the cost per unit volume of hydrogen produced via electrolysis of biomass–POM solutions can be substantially reduced;10 key factors in the investment and deployment of hydrogen production systems.
Our current research focuses on the demonstration of the potential of a novel two-stage electrolysis process (using PEM electrolysis cells) to convert biomass streams into hydrogen, with a Keggin-type structured POM catalyst known as phosphomolybdic acid ((H3[PMo12O40]) or PMA), whose polyanionic cluster is centred with a phosphorus heteroatom.5,7 PMA has been successfully used in the depolymerization of lignin,8,10 degradation of glucose13 and alcohols,14 thermal and photo-irradiative digestion of a variety of biomasses10,15 and subsequent electrolysis in bulk electrolyte solution reactors9 and PEM flow cells,10 as well as in electron-coupled proton buffers for energy storage and conversion.16–18 Therefore, employment of this redox stable and highly water-soluble POM material provides an excellent platform for the evaluation of the potential of whisky co-products as biomass sources for hydrogen production.
Stage one involves thermal digestion of biomass, to reduce the PMA catalyst via removal of protons and electrons from the biomass source. Stage two involves the use of a PEM electrolyzer to reoxidise the reduced PMA catalyst on a carbon felt anode. Upon application of a potential, protons and electrons dissociate from the reduced PMA at the anode. The protons then move through the aqueous PMA solution to the proton-conducting Nafion™ membrane, through which they migrate, whilst electrons flow around an external circuit, both moving towards the cathode. The protons are then reduced by the electrons to form hydrogen at the cathode, with the aid of a platinum catalyst (Pt/C on carbon paper).
In this research, the authors focus on the conversion of whisky co-product streams from the Isle of Raasay Distillery to hydrogen using the previously described two-stage electrolysis process. Three main co-products are generated as a result of the whisky production process, as summarized in Fig. 1. Firstly, draff is a solid co-product of the barley mashing process, the desired product of which is a high sugar-content liquid (known as wort) for fermentation and conversion to alcohol using yeast. Subsequently, this fermented wort (wash) of ∼8 volume% (vol%) ethanol undergoes distillation in a wash still to produce low wines (∼20 vol% ethanol), in addition to an organic-rich, yeast-laden co-product of pot ale. Finally, a spirit distillation is performed on the low wines (and ‘foreshots’ and ‘feints’ from previous spirit distillations) to produce ‘new make’ spirit (∼70 vol% ethanol) for aging (into Scotch whisky), more foreshots and feints (which are distilled along with the following batch of low wines) and a co-product of spent lees.
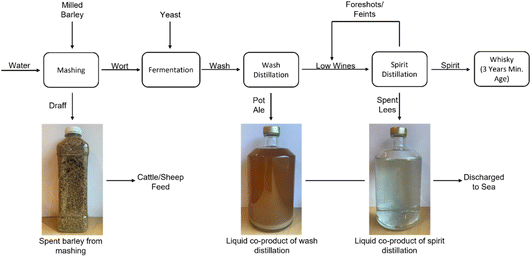 | ||
| Fig. 1 A basic flow-diagram of the whisky production process and the co-products generated as a result. | ||
Initially, characterisation data for whisky co-products will be presented including thermogravimetric, differential scanning calorimetric and carbon–hydrogen–nitrogen analysis of solid (draff/spent barley) and liquid wastes (pot ale and spent lees), in addition to total organic carbon and chemical oxygen demand analyses of liquid samples. Subsequently, the process of thermal digestion of each waste-type, using the Keggin-type polyoxometalate PMA catalyst to abstract protons and electrons from biomass, will be outlined, including assessment of the reduction extent of the PMA catalyst used to digest each biomass source. Finally, details of electrolysis of the PMA–biomass solutions using a PEM flow cell will be covered, including electrochemical data (electrochemical impedance spectroscopy, voltage–current measurements and chronoamperometric operation) in order to determine the optimal operating conditions for the process, in addition to the respective amount of hydrogen produced from each biomass source.
Experimental
Characterisation of catalyst material and whisky distillation co-products
Correction runs (using an empty alumina sample crucible) were performed prior to analysis of all samples and were applied to the experimental data, using Netzsch Proteus analysis software.
![[thin space (1/6-em)]](https://www.rsc.org/images/entities/char_2009.gif) 000 mg L−1 O2 LCK014 cuvette test kits (Hach Lange Gmbh) were employed to determine the COD of pot ale and spent lees co-products, according to procedures specified by the manufacturer.19,20 Finally, the cuvettes for both TOC and COD were inserted into a Hach DR6000 UV-vis spectrophotometer and analysed to determine the TOC and COD of each liquid co-product. Measurements were performed in triplicate for each of three samples of pot ale and spent lees, for both TOC and COD analysis.
000 mg L−1 O2 LCK014 cuvette test kits (Hach Lange Gmbh) were employed to determine the COD of pot ale and spent lees co-products, according to procedures specified by the manufacturer.19,20 Finally, the cuvettes for both TOC and COD were inserted into a Hach DR6000 UV-vis spectrophotometer and analysed to determine the TOC and COD of each liquid co-product. Measurements were performed in triplicate for each of three samples of pot ale and spent lees, for both TOC and COD analysis.
Digestion of biomass samples
Thermal digestion of biomass samples using the PMA catalyst was performed according to the state of the whisky co-product. Samples of solid draff (spent barley) were added to a transparent, yellow-coloured 300 mmol dm−3 solution of PMA in deionised water (DI H2O, 15.0 MΩ cm). In contrast, for samples of pot ale and spent lees (both liquid), the PMA catalyst was added directly into 10.0 cm3 of the whisky co-product and stirred magnetically for 18 hours at 27 °C, until dissolution of the PMA had occurred. Due to the high water of crystallisation content of the PMA catalyst, it is typical to observe a significant increase in the volume of the solution (in this case 5.00 cm3) as a result of dissolution of the catalyst and release of water. Therefore, only a further 10.0 cm3 of liquid co-product was added to achieve a 300 mmol dm−3 concentration solution of PMA.25.0 cm3 of the relevant biomass–PMA solution was decanted into a three-neck, round bottom flask. The flask was attached to a reflux condenser and the side necks were used to introduce a K-type thermocouple (embedded in a sealed bung), to monitor the temperature of the reaction mixture, and a purge of argon from the opposite side. Once sealed, the base of the flask was lowered into a silicone oil heating bath and a purge of argon was initiated to perform the digestion under anaerobic conditions. The oil bath was magnetically stirred at a rate of 800 revolutions per minute (rpm) and was heated to achieve a temperature of 100 °C in the reaction mixture using a hotplate stirrer. The argon purge was halted once the reaction temperature had been reached and the purge line was diverted to a gas syringe in order to collect any gaseous products evolved during the reaction, which proceeded for 4 hours. An image of the thermal digestion apparatus is presented in Fig. 2a.
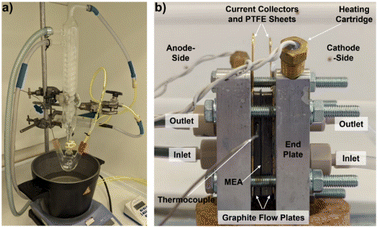 | ||
| Fig. 2 (a) Image of the setup employed to thermally digest biomass using the PMA catalyst and (b) a labelled image of the PEM flow cell used for electrolysis experiments. | ||
Electrochemical analysis and UV-visible spectrophotometry of PMA catalyst
Chronoamperometry was employed to produce PMA solutions exhibiting varying extents of reduction (with respect to the two-electron process observed at 580 mV). A glass H-cell setup was employed for this electrochemical treatment using a Nafion™ 115 (Fuel Cell Store) proton-exchange membrane to separate the working-electrode compartment (containing 30.0 mmol dm−3 PMA in DI H2O) from the counter-electrode compartment (containing 1.00 mol dm−3 phosphoric acid (H3PO4)). The volume of each solution employed was 12.0 cm3. The same working, counter and reference electrodes as described in the aforementioned CV analysis were employed along with the BioLogic SP300 potentiostat. Initially, the PMA solution was reduced by passing 69.5 C of charge at a potential of 250 mV (vs. Ag/AgCl), in order to fully reduce the PMA to provide a point of reference. Then the PMA electrolyte solution was oxidised (in 20% increments) at a potential of 850 mV (vs. Ag/AgCl) to produce a series of solutions that could be used to construct a calibration curve.
Electrochemical analysis of PEM electrolyser operating on H–PMA solutions
Results and discussion
Characterisation of phosphomolybdic acid catalyst and whisky distillation co-products
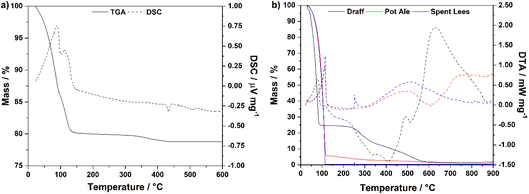
Fig. 3a displays the TGA and DSC data for the PMA catalyst material up to 600 °C in a flow of compressed air. Two distinct mass-loss events are observed in the DSC trace: (i) between 23 °C and 100 °C and (ii) between 100 °C and 151 °C, representing loss of water from the crystal structure (endothermic peaks). The mass loss observed up to 151 °C (19.9%) corresponds to a molar ratio of 1![[thin space (1/6-em)]](https://www.rsc.org/images/entities/char_2009.gif) :
:![[thin space (1/6-em)]](https://www.rsc.org/images/entities/char_2009.gif) 25.1 PMA
25.1 PMA![[thin space (1/6-em)]](https://www.rsc.org/images/entities/char_2009.gif) :
:![[thin space (1/6-em)]](https://www.rsc.org/images/entities/char_2009.gif) H2O, i.e. 25.1 moles of water of crystallisation are present in the structure of this particular batch of catalyst. Therefore, the formula was determined to be: H3[PMo12O40]·25.1H2O. This aligns well with the literature, indicating that PMA may typically contain between 10 and 29 moles of water of crystallisation.21,22 The additional mass loss (1.38%) between 151 °C and 434 °C represents the loss of hydrogen from the molecular structure of PMA as water of constitution.22
H2O, i.e. 25.1 moles of water of crystallisation are present in the structure of this particular batch of catalyst. Therefore, the formula was determined to be: H3[PMo12O40]·25.1H2O. This aligns well with the literature, indicating that PMA may typically contain between 10 and 29 moles of water of crystallisation.21,22 The additional mass loss (1.38%) between 151 °C and 434 °C represents the loss of hydrogen from the molecular structure of PMA as water of constitution.22
Fig. 3b shows plots of TGA and DTA data for draff, pot ale and spent lees collected from the Isle of Raasay Distillery, measured under a flow of compressed air between room temperature and 900 °C. Heating to 130 °C causes evaporation of water and removal of volatile species from all three samples, indicated by the sharp endothermic processes in this region of the DTA trace. According to previous residual alcohol analysis, commissioned by the distillery,23 the pot ale and spent lees contain 0.079 vol% and 0.068 vol% ethanol, respectively. Therefore, this small alcohol fraction will also evaporate upon heating above 78.35 °C (the boiling point of ethanol).24 The corresponding mass losses are summarized in Table 1, along with mass losses after 350 °C and 800 °C. After heating (i.e. drying) to 130 °C, 75.3% of the mass of draff was lost. The literature suggests that as much as 80 weight% (wt%) of draff comprises residual water from the barley-mashing process at a distillery,25–27 therefore the sample of draff from the Isle of Raasay Distillery contains a similar mass percentage of water. Combustion of the primarily lignocellulosic matrix of the draff is indicated by the strongly exothermic processes between approximately 130 °C and 550 °C, before any remaining residues undergo thermal decomposition between 550 °C and 900 °C (strongly endothermic peak).
| Co-product | Mass loss at 130 °C/% | Mass loss at 350 °C/% | Mass loss at 800 °C/% |
|---|---|---|---|
| Draff | 75.3 | 86.6 | 98.4 |
| Pot ale | 94.4 | 97.2 | 99.1 |
| Spent lees | 99.7 | 99.6 | 99.7 |
The remaining masses of pot ale and spent lees, at 130 °C, are 5.6 wt% and 0.30 wt%, respectively. It is expected that pot ale contains between 4 and 7 wt% yeast fraction (from the fermentation process),25 therefore, the 5.6 wt% fraction remaining in the distillery's pot ale agrees well with literature indications.25,28 However, very little residue remains in the spent lees at all. Subsequently, the dead yeast fraction and any remaining organic material in the pot ale and spent lees, respectively, combust between approximately 130 °C and 340 °C (slightly exothermic peaks) followed by thermal decomposition of the residues above 400 °C.
CHN (ultimate) analysis of the residues of the three whisky co-products was also performed to provide insight into the weight fraction of C, H and N, as well as the H/C ratio of these co-product streams. Table 2 provides a summary of the mean CHN weight fractions and H/C ratios for the three co-products. The weight percentage balance in each material is expected to represent oxygen (O) content; sulfur content was not determined but is expected to be negligible. The draff and pot ale residues give rise to similar weight fractions of C (∼47 wt%), H (∼6 wt%) and N (3–4 wt%), however the spent lees appears to contain ∼18 wt% more O than its counterparts. All three materials give rise to similar H/C ratios of ∼1.60. However, it must be noted that although this information is particularly useful in determining the composition of the draff (∼25 wt% biomass by weight according to Table 1), the pot ale and, in particular, spent lees both mainly consist of water. Therefore, evaporation of this water (and volatile species) to produce a ‘dry’ biomass would involve an energy penalty and may not yield sufficient quantities of biomass (in a usable form) to warrant such pre-treatment of co-product streams, prior to biomass digestion.
| Co-product | Draff | Pot ale | Spent lees |
|---|---|---|---|
| Mean C content/wt% | 47.4 | 46.6 | 32.9 |
| Mean H content/wt% | 6.4 | 6.4 | 4.4 |
| Mean N content/wt% | 3.3 | 3.8 | 1.5 |
| Mean O content/wt% | 42.9 | 43.2 | 61.2 |
| Mean H/C ratio | 1.61 | 1.63 | 1.58 |
Subsequently, analysis of the TOC concentration and COD of the liquid co-products, i.e. pot ale and spent lees, was performed in order to compare the composition of these co-products to those expected across the industry, as well as to determine the usable fraction of biomass (for digestion and electrolysis) in solution. Fig. 4a and b display bar graphs of mean TOC and COD values, respectively, along with error bars representing standard deviation (n = 3).
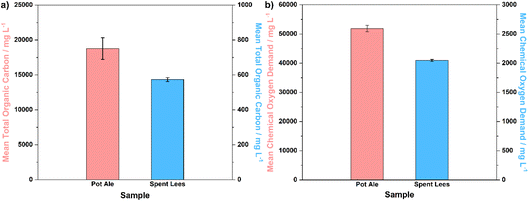 | ||
| Fig. 4 (a) Mean TOC concentrations and (b) mean COD for pot ale and spent lees collected from the Isle of Raasay Distillery, with error bars representing standard deviation (n = 3). | ||
The TOC concentration of pot ale (∼18.8 g L−1) is two orders of magnitude higher than that of spent lees (0.573 g L−1), which is to be expected given the 5.6 wt% total solids fraction (mainly comprising yeast) present in the pot ale. Considering that the spent lees also contains 0.068 vol% ethanol (equivalent to 0.536 g L−1), it can be surmised that a large proportion of the TOC concentration of this sample originates from residual alcohol (with the balance most likely comprising volatile fatty and organic acids).25 The potential for spent lees to act as a biomass source in the digestion and electrolysis process is, therefore, low in comparison to draff or pot ale. The mean COD of pot ale (∼51.9 g L−1) is accordingly higher than that of spent lees (2.05 g L−1), with both values falling at the lower end of the range specified by Bennett et al., for these whisky co-products.29 Overall, it can be concluded that the compositional parameters of draff, pot ale and spent lees examined in this research are typical of those expected in the wider whisky distillation sector in Scotland.25,29–31
Thermal digestion of whisky co-products and assessment of catalyst reduction
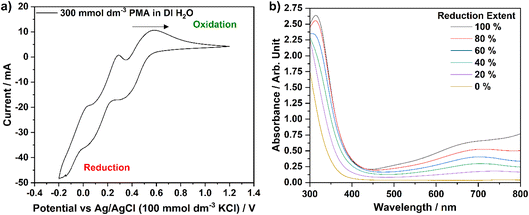
Based upon the molecular mass calculated for H3[PMo12O40]·25.1H2O (∼2.28 kg mol−1 or 2277.54 g mol−1), a 300 mmol dm−3 solution of PMA in DI H2O was prepared for electrochemical analysis. Initially, CV was performed to identify the potentials (vs. a Ag/AgCl reference electrode) of the reduction and oxidation processes that the catalyst exhibits. Fig. 5a shows the CV data obtained for this PMA solution. Three reduction–oxidation peak sets are visible over this voltage range, each of which, nominally, represents a two-electron charge-transfer process.18,32 However, as described by Lewera et al., the first (580 mV vs. Ag/AgCl) and second (290 mV vs. Ag/AgCl) two-electron processes appear to be reversible, whilst the third process (50 mV vs. Ag/AgCl) becomes slightly more complex when the PMA is dissolved in a liquid electrolyte (as opposed to the solid-state response obtained when PMA is deposited onto the surface of a glassy-carbon electrode).32 The complexity may arise from the facile hydrolysis of the phosphomolybdic acid, in comparison to phosphosilicotungstic acid, for example.33 It is only the first two-electron process that is expected be utilised in this research to reduce/oxidise the PMA catalyst, either electrochemically or via biomass electrolysis.In order to reduce PMA by two-electrons (converting the [PMo12O40]3− ion to [PMo12O40]5− in solution), exposure to a potential of 250 mV vs. Ag/AgCl was required, whilst to reoxidise this species, a potential of 850 mV vs. Ag/AgCl was employed. Chronoamperometric experiments were, therefore, subsequently performed in order to produce a series of solutions with different extents of reduction. Solutions of 30.0 mmol dm−3 PMA were held at a potential of 250 mV vs. Ag/AgCl by 69.5 C in order to fully reduce the first redox process by two-electrons. Solutions were then oxidised from this ‘reference’ point at a potential of 850 mV vs. Ag/AgCl until the required amount of charge had been passed to allow solutions with reduction extents of 0, 20, 40, 60 and 80% to be created. UV-visible spectrophotometric analysis of each solution (diluted from 30.0 mmol dm−3 to 120 μmol dm−3 to prevent saturation of the detector) was performed, yielding the graph in Fig. 5b. As the extent of reduction increases from 0% towards 100%, the absorbance peak at 700 nm becomes more intense. Therefore, the absorbance at this wavelength was chosen to create a calibration curve (absorbance at 700 nm vs. percentage reduction), in line with previous work by Liu et al.10
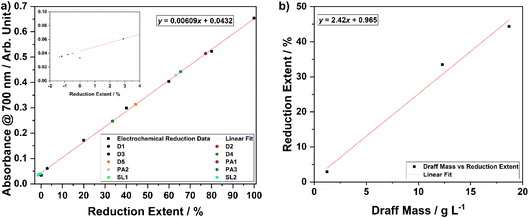
In order to assess the ability of the three whisky co-products to reduce the PMA catalyst in solution, each was digested at 100 °C for 4 hours under an argon atmosphere to ensure anaerobic conditions were maintained. In each case, no off-gas was evolved or collected in the gas syringe during the digestion process. After the digestion process was complete and the solutions were allowed to cool, a Buchner filtration was performed to remove any solid residues of biomass that may interfere with UV-visible spectrophotometry. Samples were then diluted with DI H2O to a concentration of 120 μmol dm−3 (as used for the electrochemically reduced PMA solutions) before undergoing spectrophotometric analysis. The calibration curve (with accompanying line of best fit and equation) produced as a result of the aforementioned chronoamperometric and spectrophotometric analyses is shown in Fig. 6a. Based upon the absorbance value of each of the thermally digested biomass solutions at 700 nm, the equation of the line of best fit was employed to determine the reduction extent of each sample. Data points for each sample are overlain on Fig. 6a and the corresponding percentage reductions are summarised in Table 3.
| Co-product | Biomass or solids loading/g L−1 | Absorbance at 700 nm/arbitrary units | Reduction extent/% |
|---|---|---|---|
| Draff (D1) | 0.123 | 0.0356 | −1.25 |
| Draff (D2) | 0.123 | 0.0381 | −0.837 |
| Draff (D3) | 1.23 | 0.0607 | 2.87 |
| Draff (D4) | 12.3 | 0.248 | 33.6 |
| Draff (D5) | 18.7 | 0.314 | 44.5 |
| Pot ale (PA1) | 44.8 | 0.514 | 77.3 |
| Pot ale (PA2) | 44.8 | 0.429 | 63.4 |
| Pot ale (PA3) | 44.8 | 0.443 | 65.6 |
| Spent lees (SL1) | 2.40 | 0.0347 | −1.40 |
| Spent lees (SL2) | 2.40 | 0.0399 | −0.542 |
The data in Table 3 and Fig. 6a show that digestion of samples of spent lees, which have a dry basis solids loading of 2.40 g L−1 and a TOC content of 0.456 g L−1 (after dilution by a factor of 1.25 due to release of water of crystallisation from PMA dissolution), and samples of draff, containing 0.123 g L−1 of (dry) biomass, results in negligible reduction of the PMA catalyst. This is indicated by the negative values for reduction extent, which are likely to be within experimental error for this calibration curve, due to the small amount of charge transferred from the biomass to the catalyst. As the PMA catalyst is directly dissolved into the spent lees liquid (which has been shown to comprise mostly water and volatiles, including ∼0.429 g L−1 ethanol at this dilution factor), the biomass loading is fixed. Therefore, the potential of spent lees to act as a hydrogen and electron source is inherently low. In contrast, as solid draff can be added to PMA solutions (in DI H2O) in any quantity desired, a greater extent of reduction could be easily achieved by increasing the mass of concentration of draff. This is demonstrated by samples draff #3 (1.23 g L−1), 4 (12.3 g L−1) and 5 (18.7 g L−1 biomass), which give rise to percentage reductions of 2.87%, 33.6% and 44.5%, respectively. It should be noted that the biomass loadings stated for draff have been normalised based upon the water content of the samples determined from TGA (i.e. biomass concentrations recorded in Table 3 are 24.7 wt% of the total mass of draff added). Digestion of the pot ale, with a dry basis solids loading of 44.8 g L−1 and 15.0 g L−1 TOC (after dilution by a factor of 1.25), leads to reduction extents between 63.4% and 77.3%.
Given that the concentration of draff was the most readily altered of the three co-product types, a series of draff–PMA solutions of varying concentration were prepared and digested in order to estimate the mass loading of draff that would be required to fully reduce a 300 mmol dm−3 solution of PMA in DI H2O. Fig. 6b shows a plot of percentage reduction (with respect to the first two-electron process presented in Fig. 5a) versus draff concentration, along with linear fitting data. Based upon this data, it is estimated that 40.9 g L−1 of ‘dry’ draff (or ∼166 g L−1 ‘as received’ draff) would be required to fully reduce PMA by two electrons. Given that the thermal digestion of pot ale (with a 44.8 g L−1 solids loading) yielded between 63.4% and 77.3% reduction of PMA, this implies that draff has a higher potential for hydrogen production, based upon the 40.9 g L−1 of dry basis draff that is predicted to give rise to 100% PMA reduction. Experiments are currently underway to confirm this prediction.
Electrolysis of reduced-PMA solutions using PEMECs
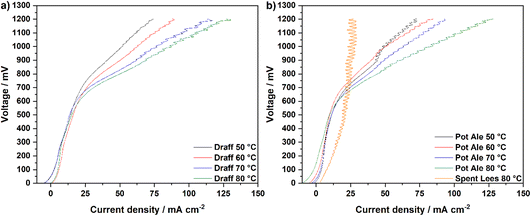
Fig. 7 displays the V–I curves for the PEMECs operating using a draff (D4)–PMA anolyte (a) and pot ale (PA2)–PMA or spent lees (SL2)–PMA anolytes (b). Between 0 mV and 600 mV, a region of activation polarisation is observed before ohmic losses dominate the V–I curve and current increases with voltage in a linear manner above ∼600 mV. The operating voltage was limited to 1200 mV in order to minimise performance contributions from water electrolysis, which can theoretically occur at the thermodynamic potential of 1230 mV.34 However, the stability of the current response begins to reduce above ∼800 mV, possibly arising due to issues with the replenishment of anolyte and catholyte in the respective compartments as a result of the action of the peristaltic pump employed. Furthermore, due to the low reduction extent of the spent lees-PMA anolyte, poor performance of the PEMEC is observed, therefore exacerbating the aforementioned mass-transport issues and showing instability of the current density throughout the measurement. In general, the maximum current density achieved in each test increases as a function of operating temperature, due to the accompanying increase in the conductivity of the PEM and thermal activation of charge-transfer processes.
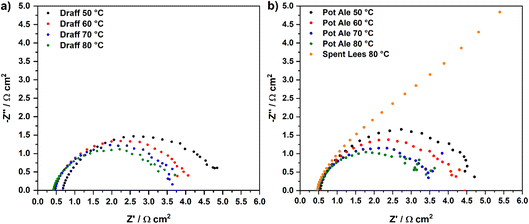
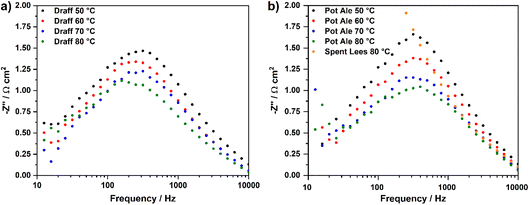
Fig. 8 displays temperature-sweep complex-plane EIS for PEMECs operating on digested draff (D4)–PMA solution (a) and digested pot ale (PA2)–PMA/spent lees (SL2)–PMA solutions (b), whilst Fig. 9 displays Bode-format EIS for the same anolytes. It should be highlighted that although EIS were collected between 100 kHz and 100 mHz, data points below 12 Hz were excluded from plots due to the excessive noise in this frequency region. Considering the complex-plane EIS, series resistances (Rs) of the PEMECs decrease with increasing temperature, as expected, due to the thermal activation of proton conductivity in Nafion™ membranes.35 Slade et al. examined the membrane area resistance of a variety of Nafion™ membranes in 1 mol dm−3 H2SO4 at 25 °C, indicating that a Rs value of 110–130 mΩ cm2 should be expected.36 The Rs values observed here (420–670 mΩ cm2) are significantly higher than these nominal values and this is most likely due to poor contact at the electrode/electrolyte interface. Hot-pressing or calendering is commonly used to produce well-adhered and highly interconnected electrode/electrolyte interfaces in MEAs, however, it was not possible to carry out during the current research campaign, particularly when using thick (1 mm) carbon felt anodes. Therefore, employment of commercial, pre-treated MEAs may yield higher performance in future experiments.
As a consequence of the elevated Rs recorded, the polarisation resistances (Rp) and, therefore, area-specific resistances (ASR) of each PEMEC are also likely to be proportionally larger than expected. The shape of the spectra for the PEMECs operating on draff and pot ale-based solutions are similar, with the total polarisation resistance also showing thermal activation (i.e. a decrease in resistance as a function of increasing operating temperature).
Equivalent circuit fitting (ECF) of the spectra included in Fig. 8 was performed, using circuit models presented in Fig. 10a, and the polarisation resistance values obtained were used to construct an Arrhenius-style plot in Fig. 10b. All resistance values and activation energies (EA) are summarised in Table 4, along with information on the PEMEC used for each experiment. The spectra recorded as a function of temperature for PEMEC1 operating on draff- and pot-ale-based anolytes display three processes: (i) a high-frequency process, Rp1, with a frequency maximum (fmax) = 2000–1200 Hz; (ii) a mid-frequency process, Rp2, (fmax = 400–300 Hz); and (iii) a low-frequency process, Rp3, (fmax = 90–40 Hz). The Rp1 process for PEMEC1, operating on digested draff–PMA and pot ale–PMA anolytes, show temperature independence with negligible EA values. Siracusano et al. observed a similar type of low-resistance, temperature-independent process during water electrolysis experiments. Although the experimental conditions were significantly different in comparison to PMA electrolysis (potential = 1500 mV, using PEMECs comprising Aquivion® membranes, IrRuOx anode catalysts and Pt/C cathode catalysts),37 similar charge-transfer processes at electrode–electrolyte interfaces will occur in PEMECs, therefore, this process may relate to charge transfer.37,38 As PEMECs containing Pt/C-based cathodes were utilised in this research, as well as the aforementioned reports, it is possible that this common characteristic arises from charge transfer in the cathode during hydrogen evolution. Due to the elevated ohmic resistance, and proportionally higher polarisation resistance values, recorded whilst operating at 50 °C with the digested draff–PMA anolyte, this data point was omitted during linear fitting of the Arrhenius-style plots. The Rp2 and Rp3 arcs both exhibit thermal activation giving rise to average EA values of 12.6 kJ mol−1 and 10.8 kJ mol−1, respectively. Given the fmax of the mid-frequency process, Rp2, it may tentatively be assigned to charge transfer at the carbon felt anode, whilst the low-frequency, Rp3, process most likely relates to reactant diffusion limitations. This is exemplified by the fact that the analogous process in the EIS collected for PEMEC2, operating on the digested spent lees–PMA anolyte, exhibits a resistance of 170.7 Ω cm2, due to the low extent of reduction of the spent lees-based anolyte and, consequently, the low concentration of [PMo12O40]5− in solution in comparison to the other anolytes.
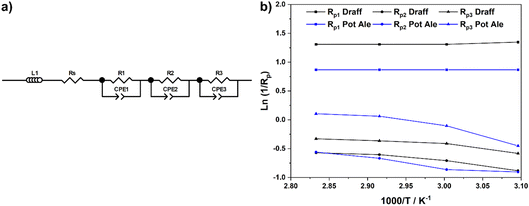 | ||
| Fig. 10 (a) Equivalent circuit model employed to determine fitting parameters for the EIS presented in Fig. 8 and (b) Arrhenius-style plots of ln(1/Rp) versus 1000/T for resistance data obtained from ECF of EIS. | ||
| Parameter | Anolyte | ||||||||
|---|---|---|---|---|---|---|---|---|---|
| Draff D4 (12.3 g L−1) | Pot Ale PA2 (44.8 g L−1) | Spent Lees SL2 (2.40 g L−1) | |||||||
| Temperature | 50 °C | 60 °C | 70 °C | 80 °C | 50 °C | 60 °C | 70 °C | 80 °C | 80 °C |
| Inductance (L)/μH | 1.34 | 1.43 | 1.37 | 1.51 | 1.53 | 1.65 | 1.94 | 1.52 | 0.825 |
| R s/Ω cm2 | 0.67 | 0.47 | 0.47 | 0.42 | 0.54 | 0.51 | 0.5 | 0.48 | 0.46 |
| R p1/Ω cm2 | 0.26 | 0.27 | 0.27 | 0.27 | 0.42 | 0.42 | 0.42 | 0.42 | 0.85 |
| R p2/Ω cm2 | 2.42 | 2.03 | 1.83 | 1.77 | 2.47 | 2.37 | 1.95 | 1.75 | 4.08 |
| R p3/Ω cm2 | 1.79 | 1.51 | 1.44 | 1.39 | 1.57 | 1.11 | 0.94 | 0.90 | 170.7 |
| ASR/Ω cm2 | 5.14 | 4.28 | 4.01 | 3.85 | 5.00 | 4.41 | 3.81 | 3.55 | 176.1 |
| PEM cell ID | PEMEC1 | PEMEC1 | PEMEC2 | ||||||
| Parameter | Anolyte | ||||
|---|---|---|---|---|---|
| Spent lees SL2 | Draff D4 | Draff D5 | Pot ale PA2 | Pot ale PA3 | |
| Biomass or solids loading/g L−1 | 2.40 | 12.3 | 18.7 | 44.8 | 44.8 |
| Reduction extent/% | −0.542 | 33.6 | 44.5 | 63.4 | 65.6 |
| Equivalent charge/C | — | 233 | 308 | 440 | 455 |
| Expected H2 evolved/cm3 | — | 30 | 39 | 56 | 58 |
| Actual charge/C | 3.52 | 112 | 170 | 207 | 256 |
| Cathode off-gas (H2) evolved/cm3 | 1 | 12 | 14 | 23 | 26 |
| Anode off-gas (CO2) evolved/cm3 | 3 | 8 | 4 | 10 | — |
| PEM ID | PEMEC2 | PEMEC2 | PEMEC3 | PEMEC2 | PEMEC4 |
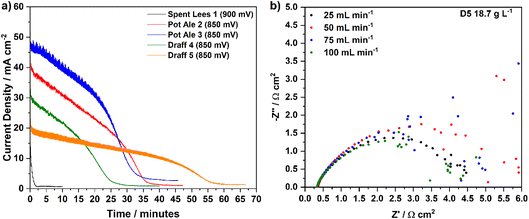
Firstly, the spent lees–PMA anolyte showed negligible reduction according to the calibration curve in Fig. 6a, therefore, chronoamperometry at 900 mV (50 mV higher than for the draff and pot ale samples) resulted in a rapid degradation of the current response to a steady-state level after less than 2 minutes. This confirmed that the spent lees co-product offers very little potential for hydrogen production (generating 1 cm3 of cathode off-gas) and that the slightly higher operating voltage made little difference to the discharge, given the low extent of reduction. In contrast, both the draff and pot ale-based anolyte samples that were reoxidised in the PEM flow cell had much higher reduction extents and evolved more cathode off-gas (assumed to be hydrogen) during chronoamperometry at 850 mV. In particular, it is possible to see more clearly the ‘discharge’ profile of the PEMECs operating on these anolytes in Fig. 10a. Initially a steady-state degradation of the current density is observed, relating to the depletion of [PMo12O40]5− and enrichment of [PMo12O40]3− in solution, accompanied by hydrogen production in the cathode compartment and, possibly, CO2 in the anode compartment. As the concentration of [PMo12O40]5− becomes critically low, a steep decline in current density is observed before the current stabilises at 2–3 mA cm−2, signalling the completion of the reoxidation experiment.
Interestingly, the reaction details summarized in Table 5 indicate that the theoretical amount of charge required to be passed to reach the observed reduction extents of PMA represent approximately double the charge that was actually passed during the experiment. Taking draff (D4) and pot ale (PA2) as examples, 33.6% (233 C) and 63.4% (440 C) reduction of PMA, respectively, was achieved, whereas only 112 C and 207 C were passed during electrolysis of the anolytes, respectively. For the draff (D4) anolyte, 12 cm3 of hydrogen was captured and recorded, whilst 23 cm3 was recorded for the pot ale (PA2) anolyte, however, based upon the reduction extents of PMA achieved, production of 30 cm3 and 56 cm3 from the digested draff–PMA and digested pot ale–PMA anolyte solutions should have been achieved.
Experiments are currently underway to identify the origin of this mismatch in theoretical vs. observed hydrogen yields and charge passed. Notably, after reoxidation of the biomass–PMA anolytes a distinct brown colour was observed within the predominantly transparent yellow coloured solution. This may imply that corrosion and removal of the carbon felt anode material and/or the graphite flow plate could be occurring, which might explain the reduced charge passed during electrochemical production of hydrogen (if a chemical side reaction was occurring in the anode compartment) and may also explain the elevated levels of anode off-gas (possibly CO2) if oxidation of the carbon components of the flow cell was occurring. It is acknowledged that further experimentation and gas analysis is required to verify these theories.
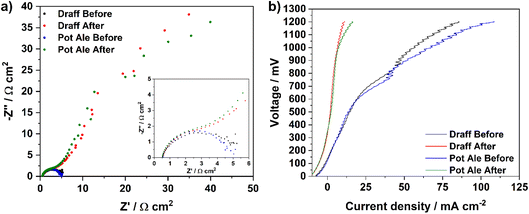
Fig. 12a displays impedance spectra collected before and after chronoamperometric measurements were performed on PEMEC2, operating on the digested draff (D4)–PMA and pot ale (PA2)–PMA anolytes at 80 °C. For both anolytes, the initial spectra exhibit similar ASRs to each other, though these are higher than ASRs observed during EIS of equivalent anolytes employed for PEMEC1 (possibly relating to slight differences in compression and therefore contacting in each cell). However, after the chronoamperometric measurements, a high-resistance arc evolves in the low-frequency region for both samples, most likely relating to mass-transport limitations arising from depletion of the [PMo12O40]5− in solution, which is to be expected and serves as confirmation that reoxidation of the catalyst has occurred. This is further reinforced by the characteristics of the V–I curves (Fig. 12b) collected before and after chronoamperometry for PEMEC2 operating on these anolyte solutions. Despite the noise observed in the higher voltage region of the V–I curves collected before chronoamperometry (due to the pulsating flow generated by the peristaltic pump), collection of EIS at 850 mV falls into the pseudo-linear region of these curves, which are dominated by ohmic losses within the PEMEC. However, after reoxidation of the anolytes, an EIS collected at the same voltage would result in perturbation of the cell closer to the concentration polarisation (mass-transport limited) region of the V–I curve, explaining the observation of a high-resistance arc in the low-frequency region of the post-chronoamperometry EIS.
Conclusions
Whisky co-products (namely draff, pot ale and spent lees) collected from the Isle of Raasay Distillery were characterised by simultaneous thermal analysis (STA) and carbon–hydrogen–nitrogen (CHN) analysis, as well as being analysed for total organic carbon concentration (TOC) and chemical oxygen demand (COD). These analyses indicated that the characteristics of the three co-products agreed well with those reported for the Scotch whisky distillation sector. Importantly, solids content (0.30 wt%) and total organic carbon concentration (0.573 g L−1) of the spent lees liquid was determined to be too low to offer significant potential as a biomass source for thermal digestion and electrolysis with a H3[PMo12O40]·25.1H2O (PMA) catalyst. In comparison, the pot ale liquid yielded a 5.60 wt% solids loading, containing 18.8 g L−1 of total organic carbon, primarily due to the presence of a dead yeast fraction from fermentation, whilst the draff (containing 75.3 wt% water), offered a lignocellulose-rich biomass source whose concentration (in the acid catalyst solution) could be more easily altered than those of the liquid wastes.Thermal digestion of each co-product using a 300 mmol dm−3 solution of PMA (either dissolved directly into the liquid co-products or into deionised water for addition of solid draff) was performed under an inert atmosphere at 100 °C for 4 hours. Subsequent determination of reduction extent of the PMA catalyst, using UV-visible spectroscopy, found negligible reduction with respect to the first two-electron process identified during cyclic voltammetry of PMA, when employed to digest the spent lees co-product. Digestion of pot ale, containing 44.8 g L−1 of dry matter or 15.0 g L−1 TOC (assuming pot ale to have a density of 1.00 kg L−1 and taking account of the dilution factor of 1.25 employed during digestion) resulted in reduction extents between 63.4% and 77.3%, whilst a draff loading (dry basis) of 18.7 g L−1 resulted in a reduction extent of 44.5%. Based upon a plot of reduction extent versus draff loading (dry basis), it is anticipated that a draff concentration of 40.9 g L−1 should give rise to 100% reduction of the PMA catalyst. This suggests that there is a higher potential for hydrogen production from draff, than pot ale, through the thermal digestion and electrolysis method. Experiments are currently underway to verify this estimation.
Finally, electrolysis experiments using a proton-exchange membrane (PEM) flow-cell setup were performed on each digested biomass–PMA anolyte to determine the yields of off-gas from the anode (carbon dioxide) and cathode (hydrogen). This confirmed that the volume of gas collected from the cathode compartment increased as a function of the extent of reduction of the PMA in each anolyte, in this case: pot ale > draff > spent lees. However, by increasing the draff concentration to 40.9 g L−1 (to achieve the theoretical 100% PMA reduction), it is expected that the hydrogen production potential would be greatest for the draff co-product stream. Electrochemical analysis of PEM electrolysis cells (PEMECs) operating on the digested biomass–PMA anolytes indicated that three rate-limiting polarisation processes could be identified within the electrochemical impedance spectra collected: (i) a high-frequency process (∼2000 Hz) possibly relating to charge transfer during hydrogen evolution at the cathode, (ii) a mid-frequency process (∼400 Hz) tentatively assigned to charge transfer at the anode and (iii) a low-frequency process (90–40 Hz) most-likely relating to mass transport and reactant diffusion issues in the anolyte. This information provides valuable indications as to where electrolysis performance can be enhanced to improve hydrogen yields and efficiency, particularly given the fact that only 47–56% of the theoretical charge was passed during the electrolysis experiments.
Conflicts of interest
There are no conflicts of interest to declare.Acknowledgements
The authors wish to thank Dr Gavin S. Peters (University of St Andrews) for performing TGA and DSC measurements of the whisky co-products, Orfhlaith McCullough (London Metropolitan University) for carrying out CHN analysis, Dr Mara Knapp and Marcella McIlroy (University of Strathclyde) for assistance in the preparation and analysis of TOC and COD samples, as well as Liam Kirkwood and Cameron Gemmell for modification and commissioning of flow-cell test setups. In addition, many thanks go to Dr Ian Heywood and the KTP West of Scotland Centre for support. Knowledge Transfer Partnerships (KTPs) aim to help businesses improve their competitiveness and productivity through better use of knowledge, technology and skills within the UK knowledge base. This KTP was co-funded by UKRI through Innovate UK and R&B Distillers Ltd.References
- V. Masson-Delmotte, P. Zhai, H.-O. Pörtner, D. Robert, J. Skea, P. R. Shukla, A. Pirani, W. Moufouma-Okia, C. Péan, R. Pidcock, S. Connors, J. B. R. Matthews, Y. Chen, X. Zhou, M. I. Gomis, E. Lonnoy, T. Maycock, M. Tignor and T. Waterfield, Global warming of 1.5 °C. An IPCC Special Report on the impacts of global warming of 1.5 °C above pre-industrial levels and related global greenhouse gas emission pathways, in The Context of Strengthening the Global Response to the Threat of Climate Change, Sustainable Development, and Efforts to Eradicate Poverty, IPCC, 2018 Search PubMed.
- J. B. Hansen, Faraday Discuss., 2015, 182, 9–48 RSC.
- Department for Transport, Sustainable Aviation Fuels Mandate, 2021 Search PubMed.
- M. Götz, J. Lefebvre, F. Mörs, A. McDaniel Koch, F. Graf, S. Bajohr, R. Reimert and T. Kolb, Renewable Energy, 2016, 85, 1371–1390 CrossRef.
- S. S. Wang and G. Y. Yang, Chem. Rev., 2015, 115, 4893–4962 CrossRef CAS PubMed.
- N. L. Z. Z. Adil, T. S. T. Saharuddin, L. N. Ozair and F. W. Harun, IOP Conf. Ser.: Mater. Sci. Eng., 2021, 1173, 012073 CAS.
- D. L. Long, R. Tsunashima and L. Cronin, Angew. Chem., Int. Ed., 2010, 49, 1736–1758 CrossRef CAS PubMed.
- X. Du, H. Zhang, K. P. Sullivan, P. Gogoi and Y. Deng, ChemSusChem, 2020, 13, 4318–4343 CrossRef CAS PubMed.
- H. Oh, Y. Choi, C. Shin, T. V. T. Nguyen, Y. Han, H. Kim, Y. H. Kim, J.-W. Lee, J.-W. Jang and J. Ryu, ACS Catal., 2020, 10, 2060–2068 CrossRef CAS.
- W. Liu, Y. Cui, X. Du, Z. Zhang, Z. Chao and Y. Deng, Energy Environ. Sci., 2016, 9, 467–472 RSC.
- E. Fabbri, A. Habereder, K. Waltar, R. Kötz and T. J. Schmidt, Catal. Sci. Technol., 2014, 4, 3800–3821 RSC.
- S. Song, H. Zhang, X. Ma, Z. Shao, R. T. Baker and B. Yi, Int. J. Hydrogen Energy, 2008, 33, 4955–4961 CrossRef CAS.
- Y. Li, W. Liu, Z. Zhang, X. Du, L. Yu and Y. Deng, Commun. Chem., 2019, 2, 67 CrossRef CAS.
- F. Sheng, Q. Yang, D. Cui, C. Liu, Y. Sun, X. Wang and W. Su, Energy Fuels, 2020, 34, 10282–10289 CrossRef CAS.
- M. Li, T. Wang, M. Zhao and Y. Wang, Int. J. Hydrogen Energy, 2022, 47, 15357–15369 CrossRef CAS.
- L. G. Bloor, R. Solarska, K. Bienkowski, P. J. Kulesza, J. Augustynski, M. D. Symes and L. Cronin, J. Am. Chem. Soc., 2016, 138, 6707–6710 CrossRef CAS PubMed.
- L. MacDonald, B. Rausch, M. D. Symes and L. Cronin, Chem. Commun., 2018, 54, 1093–1096 RSC.
- M. D. Symes and L. Cronin, Nat. Chem., 2013, 5, 403–409 CrossRef CAS PubMed.
- Hach Lange Gmbh, Working Procedure: LCK387: Total Organic Carbon, 2017 Search PubMed.
- Hach Lange Gmbh, Working Procedure: LCK014 COD, 2019 Search PubMed.
- P. Singh, K. Kumari and R. Patel, J. Pharm. Appl. Chem., 2017, 3, 53–56 CrossRef.
- A. Micek-Ilnicka, J. Mol. Catal. A: Chem., 2009, 308, 1–14 CrossRef CAS.
- A. Day, Personal communication.
- R. L. Brown and S. E. Stein, in NIST Chemistry WebBook, NIST Standard Reference Database Number 6, ed. P. J. Linstrom and W. G. Mallard, National Institute of Standards and Technology, Gaithersburg MD, 2023 Search PubMed.
- J. C. Akunna and G. M. Walker, in The Alcohol Textbook, ed. G. M. Walker, C. Abbas, W. M. Ingledew and C. Pilgrim, Ethanol Technology Institute, Duluth, Georgia, 6th edn, 2017, pp. 529–537, ch. 34 Search PubMed.
- J. Bennett, PhD thesis, University of Abertay Dundee, 2013.
- S. I. Mussatto, G. Dragone and I. C. Roberto, J. Cereal Sci., 2006, 43, 1–14 CrossRef CAS.
- J. S. White, K. L. Stewart, D. L. Maskell, A. Diallo, J. E. Traub-Modinger and N. A. Willoughby, ACS Omega, 2020, 5, 6429–6440 CrossRef CAS PubMed.
- J. Bennett, G. M. Walker, D. Murray, J. C. Akunna and A. Wardlaw, in Distilled Spirits – Future Challenges, New Solutions: Proceedings of the Worldwide Distilled Spirits Conference, ed. I. Goodall, R. Fotheringham, D. Murray, R. A. Speers and G. M. Walker, Context, Packington, 2015, pp. 303–312 Search PubMed.
- C. Edwards, C. C. McNerney, L. A. Lawton, J. Palmer, K. Macgregor, F. Jack, P. Cockburn, A. Plummer, A. Lovegrove and A. Wood, Resour., Conserv. Recycl., 2022, 179, 106114 CrossRef CAS PubMed.
- J. Graham, B. Peter, G. M. Walker, A. Wardlaw and E. Campbell, in Distilled Spirits – Science and Sustainability: Proceedings of the Worldwide Distilled Spirits Conference, ed. G. M. Walker, I. Goodall, R. Fotheringham and D. Murray, Nottingham University Press/The Institute of Brewing and Distilling, Nottingham, 2012, pp. 1–7 Search PubMed.
- A. Lewera, M. Chojak, K. Miecznikowski and P. J. Kulesza, Electroanalysis, 2005, 17, 1471–1476 CrossRef CAS.
- M. Sadakane and E. Steckhan, Chem. Rev., 1998, 98, 219–237 CrossRef CAS PubMed.
- S. Wang, A. Lu and C. J. Zhong, Nano Convergence, 2021, 8, 4 CrossRef CAS PubMed.
- K. D. Kreuer, M. Schuster, B. Obliers, O. Diat, U. Traub, A. Fuchs, U. Klock, S. J. Paddison and J. Maier, J. Power Sources, 2008, 178, 499–509 CrossRef CAS.
- S. Slade, S. A. Campbell, T. R. Ralph and F. C. Walsh, J. Electrochem. Soc., 2002, 149, A1556–A1564 CrossRef CAS.
- S. Siracusano, S. Trocino, N. Briguglio, V. Baglio and A. S. Arico, Materials, 2018, 11, 1368 CrossRef PubMed.
- J. C. Garcia-Navarro, M. Schulze and K. A. Friedrich, J. Power Sources, 2019, 431, 189–204 CrossRef CAS.
| This journal is © The Royal Society of Chemistry 2023 |

