Strontium-induced phase, energy band and microstructure regulation in Ba1−xSrxTiO3 photocatalysts for boosting visible-light photocatalytic activity†
Received
25th February 2023
, Accepted 24th March 2023
First published on 24th March 2023
Abstract
A polyacrylamide gel method has been developed for fabrication of Ba1−xSrxTiO3 (BST, x = 0.1–0.5) photocatalysts. When x = 0.1–0.2, the BST photocatalyst is in a tetragonal phase, and when x is other value, the BST photocatalyst is in a cubic phase. The microstructure of BST photocatalysts changes from an irregular polyhedron in the tetragonal phase to cuboid in the cubic phase. The change of the phase structure makes the color parameter b* value of BST photocatalysts change from negative to positive, and the Eg value and photocatalytic activity increase with the increase of the x value. The optimum catalyst content, drug concentration, pH value and illumination time for the degradation of tetracycline hydrochloride (TC-HCl) by BST photocatalysts were 1 g L−1, 20 mg L−1, 6.77 and 120 min, respectively. The degradation pathway of TC-HCl and the toxicity of the intermediate products were also analyzed. This technique of phase structure, microstructure, energy band engineering and photocatalytic activity regulation is helpful for the development of other similar photocatalysts.
1. Introduction
Photocatalytic technology driven by light energy is a common and efficient green technology used to degrade dyes, persistent organic pollutants (POPs), and drugs, and reduce heavy metal ions.1–6 At present, titanium dioxide (TiO2) and strontium titanate (SrTiO3) have been used in industrial applications as photocatalysts, but they can only respond to UV light because of their large band gap (Eg), and the UV content of sunlight is only about 7%, which greatly limits their application in the field of photocatalysis.7–10 Therefore, the development of novel semiconductor photocatalysts that can respond to visible light has become a key problem to solve the degradation of pollutants.11–15
Barium titanate (BaTiO3) is also an ABO3 perovskite photocatalyst with industrial potential for photocatalytic degradation of dyes, drugs and POPs due to its high photocatalytic activity.16–18 However, BaTiO3 also faces the disadvantages of high Eg value, difficulty in responding to visible light and low efficiency of charge carrier separation and transfer, which limit its application in the field of photocatalysis.19 To improve the visible light utilization rate of BaTiO3 photocatalysts, researchers made the following efforts: (1) BaTiO3 with a special defect structure was constructed under extreme conditions to make it respond to visible light and degrade pollutants.20 (2) Ion doping BaTiO3 improves its Eg value to make it respond to visible light and degrade pollutants.21,22 (3) BaTiO3-based heterojunction photocatalysts were constructed by combining with other excellent semiconductors to enhance interfacial charge carrier transfer and transport capacity and degrade pollutants.23,24
Among these methods, ion doping BaTiO3 can effectively adjust the Eg value of BaTiO3 and make it respond to visible light. Recently, the use of strontium ions to occupy the A-site ions of BaTiO3 to form Ba1−xSrxTiO3 (BST) photocatalysts can be widely used in the photocatalytic decomposition of water to produce hydrogen and dye degradation.25–32 However, no researchers have yet regulated the phase structure, morphology and photocatalytic activity of BST photocatalysts for photocatalytic degradation of tetracycline hydrochloride (TC-HCl) under simulated sunlight irradiation by adjusting the content of strontium ions. The polyacrylamide gel method is an effective method to synthesize ion-doped semiconductor photocatalysts, but it has not been used to synthesize BST photocatalysts.33,34 Therefore, it is of great significance to synthesize BST photocatalysts by the polyacrylamide gel method and study the evolution of the phase structure, microstructure, energy band structure and photocatalytic activity of BST photocatalysts induced by strontium ions.
In this paper, we propose to synthesize strontium-induced BST photocatalysts by the polyacrylamide gel method, and then enhance their photocatalytic activity by regulating the phase structure, microstructure and energy band structure of the BST photocatalysts by adjusting the content of strontium ions. The effects of the x value, catalyst content, drug concentration, pH value and irradiation time on the photocatalytic activity of the BST photocatalysts were investigated with tetracycline hydrochloride (TC-HCl) as the degradation target for drugs. The main active species that play a key role in the photocatalysis process were detected through capture experiments and free radical detection experiments. The degradation pathways and the toxicity of intermediates for the photocatalytic degradation of TC-HCl by BST photocatalysts were also estimated by high-performance liquid chromatography-tandem mass spectrometry (HPLC-MS) and the Toxicity Estimation Software Tool (T.E.S.T.). A possible photocatalytic mechanism of BST photocatalysts has been proposed based on photocatalytic experiments, verification experiments of active species and energy band theory.
2. Experimental section
2.1 Synthesis of BaxSr1−xTiO3 photocatalysts
Anhydrous barium nitrate (Ba(NO3)2), anhydrous strontium nitrate (Sr(NO3)2) and tetrabutyl titanate (C16H36O4Ti) were purchased from Chengdu Aike Reagent Co., LTD. Citric acid (C6H8O7), glucose (C6H12O6), acrylamide (C3H5NO), N,N′- methylene bisacrylamide (C7H10N2O2) and ammonia (NH3·H2O) were purchased from Tianjin Kemeiou Reagent Co., LTD. The reagents mentioned above were not further purified and used directly in the process.
To obtain the Ba1−xSrxTiO3 (BST) photocatalysts with molar ratios of nBa![[thin space (1/6-em)]](https://www.rsc.org/images/entities/char_2009.gif) :
:![[thin space (1/6-em)]](https://www.rsc.org/images/entities/char_2009.gif) nSr = 9
nSr = 9![[thin space (1/6-em)]](https://www.rsc.org/images/entities/char_2009.gif) :
:![[thin space (1/6-em)]](https://www.rsc.org/images/entities/char_2009.gif) 1, 8
1, 8![[thin space (1/6-em)]](https://www.rsc.org/images/entities/char_2009.gif) :
:![[thin space (1/6-em)]](https://www.rsc.org/images/entities/char_2009.gif) 2, 7
2, 7![[thin space (1/6-em)]](https://www.rsc.org/images/entities/char_2009.gif) :
:![[thin space (1/6-em)]](https://www.rsc.org/images/entities/char_2009.gif) 3, 6
3, 6![[thin space (1/6-em)]](https://www.rsc.org/images/entities/char_2009.gif) :
:![[thin space (1/6-em)]](https://www.rsc.org/images/entities/char_2009.gif) 4 and 5
4 and 5![[thin space (1/6-em)]](https://www.rsc.org/images/entities/char_2009.gif) :
:![[thin space (1/6-em)]](https://www.rsc.org/images/entities/char_2009.gif) 5, appropriate amounts of Ba(NO3)2, Sr(NO3)2 and C16H36O4Ti were weighed, and the corresponding samples were named BST1, BST2, BST3, BST4 and BST5, respectively. The corresponding volume of tetrabutyl titanate was measured with a measuring cylinder and added into Ba(NO3)2 and Sr(NO3)2 solutions dissolved in 20 mL deionized water. Then, 4.7282 g citric acid, 20 g glucose, 9.5958 g acrylamide and 1.9192 g methylene diacrylamide were added to the above solution, and deionized water was added in time to make it reach 100 mL. Finally, a precursor solution with 0.015 mol L−1 metal ion concentration was formed. After the precursor solution was stirred at room temperature for 2 hours until clear, a small amount of ammonia was added to adjust the pH value of the solution to 11, and the temperature was increased to about 100 °C until a jelly-like gel was formed. The gel was dried at 120 °C for 24 hours and then cooled. After grinding, the target product was obtained by sintering at 950 °C in a tube furnace for 5 hours. The related synthesis process of the BST photocatalysts is shown in Fig. 1.
5, appropriate amounts of Ba(NO3)2, Sr(NO3)2 and C16H36O4Ti were weighed, and the corresponding samples were named BST1, BST2, BST3, BST4 and BST5, respectively. The corresponding volume of tetrabutyl titanate was measured with a measuring cylinder and added into Ba(NO3)2 and Sr(NO3)2 solutions dissolved in 20 mL deionized water. Then, 4.7282 g citric acid, 20 g glucose, 9.5958 g acrylamide and 1.9192 g methylene diacrylamide were added to the above solution, and deionized water was added in time to make it reach 100 mL. Finally, a precursor solution with 0.015 mol L−1 metal ion concentration was formed. After the precursor solution was stirred at room temperature for 2 hours until clear, a small amount of ammonia was added to adjust the pH value of the solution to 11, and the temperature was increased to about 100 °C until a jelly-like gel was formed. The gel was dried at 120 °C for 24 hours and then cooled. After grinding, the target product was obtained by sintering at 950 °C in a tube furnace for 5 hours. The related synthesis process of the BST photocatalysts is shown in Fig. 1.
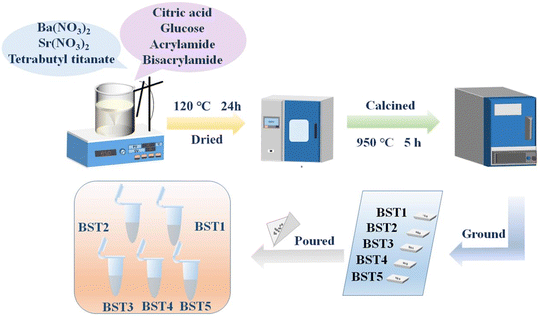 |
| | Fig. 1 The synthesis process of BST photocatalysts. | |
2.2 Material characterization
The phase evolution process of the BST photocatalysts was characterized by means of a DX-2007BH X-ray powder diffractometer (XRD) with Cu Kα radiation. The functional groups of the BST photocatalysts were studied using a Fourier transform infrared (FTIR) spectrophotometer (FTIR 650) in a wavenumber range of 400–4000 cm−1. The charge states, electronic energy levels and compositions of the BST photocatalysts were measured using a KRATOS X SAM 800 X-ray photoelectron spectrometer (XPS). The surface morphologies of the BST photocatalysts were observed using an SU8010 field-emission scanning electron microscope (FE-SEM) and JEM 2100F transmission electron microscope (TEM). Ultraviolet-visible (UV-vis) diffuse reflectance spectra (DRS) of the BST photocatalysts were measured using a UV1901 UV-visible spectrophotometer with BaSO4 used as a reference.
2.3 Photocatalytic experiments
To study the effects of phase transition, band structure change and morphology evolution on the photocatalytic activity of the BST photocatalysts, tetracycline hydrochloride (TC-HCl) was selected as the target degradation drug to perform the photocatalytic experiments. The initial drug concentration, catalyst content and pH value were 10–50 mg L−1, 1 g L−1 and 3–13, respectively. At the beginning of the experiment, a half hour adsorption experiment was performed to eliminate the effect of adsorption on the photocatalytic activity of the BST photocatalysts. After the photocatalytic experiment began, samples were taken every half an hour until the experiment was completed 2 hours later. The above extracted samples were marked with time numbers and the absorbance curves of the samples at time t were measured using a UV-1800 UV-visible spectrophotometer. Disodium ethylenediamine tetraacetic acid (EDTA-2Na), 2-propanol (IPA) and 1,4-benzoquinone (BQ) were used to perform capture experiments to determine the contribution of holes, hydroxyl radicals, and superoxide radicals to photocatalysis. The holes (room temperature, X-band (9.34 GHz)), hydroxyl radicals (5,5-dimethyl-1-pyrroline N-oxide (DMPO)), and superoxide radicals (5-tert-butoxycarbonyl 5-methyl-1-pyrroline N-oxide (BMPO)) are also confirmed by the electron spin/paramagnetic resonance (ESR/EPR) experiments on a Bruker A300 spectrometer. High-performance liquid chromatography-tandem mass spectrometry (HPLC-MS) was performed to explore the degradation ways and products of the BST photocatalysts for the degradation of TC-HCl by a positive ionization mode with a full scan range from m/z 50 to 1000. Detailed experimental parameters are described in the literature.35
3. Results and discussion
3.1 Phase structure and purity
The introduction of strontium ions into BaTiO3 results in the transformation of the phase structure, which can be observed by XRD. Fig. 2(a) displays the XRD patterns of the BST photocatalysts. With the increase of the x value, the position of the diffraction peaks of the BST photocatalysts does not change obviously. However, after magnifying the diffraction peaks in the range of 40–50° (Fig. 2(b)), it is found that the BST photocatalysts with x = 0.1 and 0.2 has two peaks belonging to the tetragonal phase with the Joint Committee on Powder Diffraction Standards (JCPDS) card no. 44-0093, while the BST photocatalysts with x = 0.3–0.5 have only one peak and the peak position shifts to a higher angle with the increase of the x value, belonging to the cubic phase, which can be referred to JCPDS card no. 39-1395.36,37 The results show that the BST photocatalysts change from the tetragonal phase to the cubic phase with the increase of x values. Fig. 2(c) shows the lattice parameters of the BST photocatalysts. The lattice parameters of the BST photocatalysts can be estimated by eqn (1) and (2):| |  | (1) |
| |  | (2) |
where, d is the interplanar spacing, (h, k, l) are the crystal indices, and (a, c) are the lattice parameters. The tetragonality (c/a ratio) of the BST1 and BST2 photocatalysts was 0.9963 and 0.9992, respectively. The radius of the strontium ions is smaller than that of barium ions, and the incorporation of BaTiO3 significantly affects the lattice parameters of the BST photocatalysts. With the increase of the x value, the lattice parameter (a) of the BST photocatalysts decreases. The crystallite size (D) of the BST photocatalysts can be obtained by eqn (3):| |  | (3) |
where k is the shape factor, and it takes the value of 2.08. β is the full-width at half maximum (FWHM). The FWHM of the BST photocatalysts is the sum of the Gaussian (G) (FWHM)G and Lorentzian (L) (FWHM)L components.| |  | (4) |
| |  | (5) |
λ and θ are the X-ray wavelength and the Bragg diffraction angle, respectively. The crystallite sizes of the BST1, BST2, BST3, BST4 and BST5 photocatalysts are 78.56, 102.51, 92.49, 89.42 and 72.08 nm, respectively. With the increase of the x value, the crystallite size of the BST photocatalyst increases first and then decreases. The change of the crystallite size is mainly attributed to the phase transformation of the BST photocatalyst caused by different Sr ion contents.
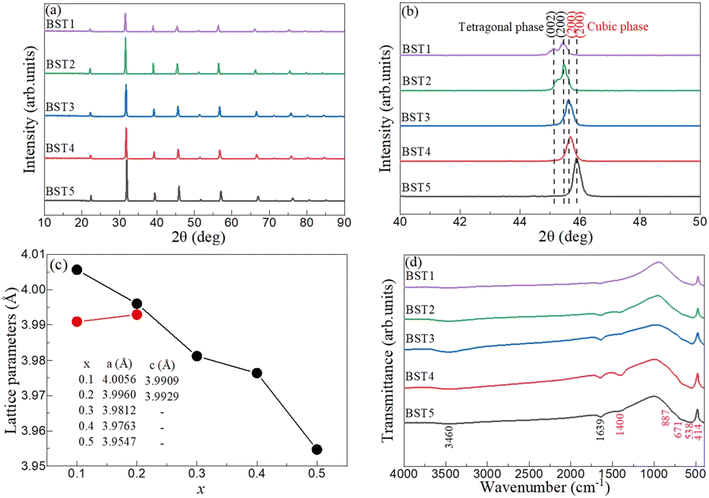 |
| | Fig. 2 (a) XRD patterns, (b) XRD enlarged drawing, (c) lattice parameters and (d) FTIR spectra of the BST photocatalysts. | |
The chemical environment of the BST photocatalyst was characterized by FTIR. Fig. 2(d) displays the FTIR spectra of the BST photocatalysts. Two special vibration modes at 3460 and 1639 cm−1 exist in all samples, which are attributed to the stretching vibration of O–H and the bending vibration of H–O–H, respectively.38–41 The main reason for the above two peaks is the use of KBr during the test, which tends to absorb moisture from the air. A weak characteristic peak at 1400 cm−1 indicates that the sample contains a small amount of C–O functional groups.42–44 The four characteristic peaks at 887, 671, 538 and 414 cm−1 in the range of 400–1000 cm−1 were attributed to the Ba–O stretching vibration, the Sr–Ti–O bonds, the Ti–O vibrations, and metal–oxygen bonds, respectively.45–47
3.2 XPS analysis
The composition, binding energies and charge states of the BST photocatalysts were further characterized by XPS. Fig. 3(a) displays the XPS survey scan spectra of the BST1, BST3 and BST5 photocatalysts. The survey scan spectra of the BST1, BST3 and BST5 photocatalysts display the characteristic peaks of the elements required by the target except for C, which can be attributed to the C–O functional group and the calibration peak of the XPS instrument.48 The details of the high resolution spectra of C 1s for the BST photocatalysts will be discussed later. Fig. 3(b) demonstrates the Ba 3d spectra of the BST1, BST3 and BST5 photocatalysts. The Ba 3d photoelectron peaks of the BST1, BST3 and BST5 photocatalysts have two components in the BST photocatalysts designated as the Ba 3d5/2 peak at around 778.13 eV and the Ba 3d3/3 peak at around 793.49 eV.49 The Sr 3d spectra of the BST1, BST3 and BST5 photocatalysts are presented in Fig. 3(c)–(e). The photoelectron peaks of Sr 3d for the BST1, BST3 and BST5 photocatalysts were well split off from the other photoelectron peaks, and the photoelectron peaks of Sr 3d3/2 and Sr 3d5/2 had asymmetric profiles.50,51Fig. 3(f)–(h) reveal the Ti 2p spectra of the BST1, BST3 and BST5 photocatalysts. In Fig. 3(f)–(h), the deconvolution of the Ti 2p signal obtained from the BST1, BST3 and BST5 photocatalysts presents the peaks at 457.74, 458.45 and 463.49 eV. The photoelectron peaks at 457.74 and 463.49 eV are assigned to Ti 2p3/2 and Ti 2p1/2, respectively. The photoelectron peak at 458.45 eV can be attributed to the satellite peak.52
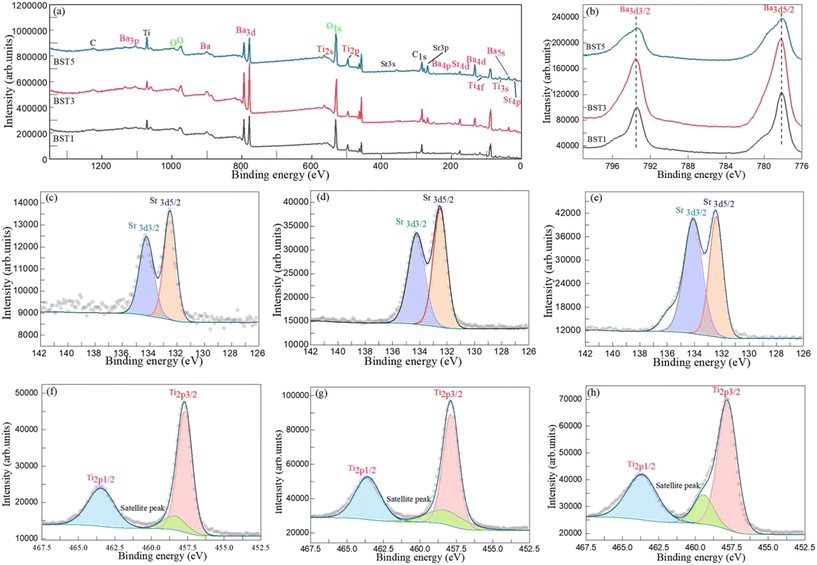 |
| | Fig. 3 (a) XPS survey scan spectra and (b) Ba 3d spectra of the BST1, BST3 and BST5 photocatalysts. Sr 3d spectra of the (c) BST1, (d) BST3 and (e) BST5 photocatalysts. Ti 2p spectra of the (f) BST1, (g) BST3 and (h) BST5 photocatalysts. | |
Fig. 4(a)–(c) display the C 1s spectra of the BST1, BST3 and BST5 photocatalysts. The C1s spectra can be fitted into three photoelectron peaks at 284.82, 286.44 and 289.09 eV by the Avantage software. The first spike is mainly due to the calibration peak used by the XPS instrument.48 The second peak is mainly due to the presence of a small amount of C–OH functional groups in the BST photocatalyst.53 The last peak is the presence of a small number of O![[double bond, length as m-dash]](https://www.rsc.org/images/entities/char_e001.gif) C–OH functional groups in the BST photocatalyst.35 This result was consistent with the FTIR results, which confirmed the presence of C–O functional groups in the BST photocatalysts. The O 1s spectra of the BST1, BST3 and BST5 photocatalysts are displayed in Fig. 4(d)–(f). The O 1s spectra can also be fitted into three photoelectron peaks, which are located at 528.94, 531.44 and 534.18 eV, respectively. The peaks at 528.94, 531.44 and 534.18 eV are assigned to the lattice oxygen of SrTiO3 (OLSTO), the lattice oxygen of BaTiO3 (OLBTO) and the adsorbed oxygen, respectively.54,55 Simultaneously, the adsorbed oxygen may contain a small amount of oxygen in the C–O functional group.56
C–OH functional groups in the BST photocatalyst.35 This result was consistent with the FTIR results, which confirmed the presence of C–O functional groups in the BST photocatalysts. The O 1s spectra of the BST1, BST3 and BST5 photocatalysts are displayed in Fig. 4(d)–(f). The O 1s spectra can also be fitted into three photoelectron peaks, which are located at 528.94, 531.44 and 534.18 eV, respectively. The peaks at 528.94, 531.44 and 534.18 eV are assigned to the lattice oxygen of SrTiO3 (OLSTO), the lattice oxygen of BaTiO3 (OLBTO) and the adsorbed oxygen, respectively.54,55 Simultaneously, the adsorbed oxygen may contain a small amount of oxygen in the C–O functional group.56
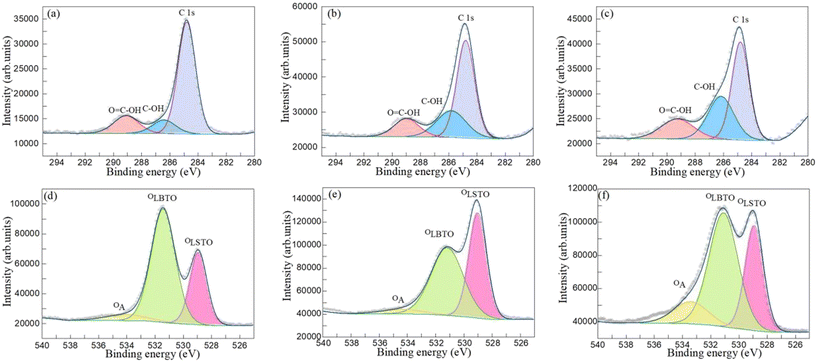 |
| | Fig. 4 C 1s spectra of the (a) BST1, (b) BST3 and (c) BST5 photocatalysts. O 1s spectra of the (d) BST1, (e) BST3 and (f) BST5 photocatalysts. | |
3.3 Microstructural analysis
Fig. 5 displays the SEM photographs of the BST1, BST3 and BST5 photocatalysts. When x = 0.1, some particles in the BST photocatalysts are irregularly triangular, some are approximately spherical, and some are tetragonal as presented in Fig. 5(a). When x = 0.3, the regular tetragonal becomes more and more numerous and the growth of particles becomes obvious as displayed in Fig. 5(b). When x reaches 0.5, the large particles become larger and have been transformed into regular cuboid or cubic particles. Combined with the XRD and SEM results, it is found that the crystal structure of the BST photocatalysts changes from the tetragonal phase to the cubic phase, and the morphology changes from irregular spherical particles to regular cubic particles.
 |
| | Fig. 5 SEM photographs of the (a) BST1, (b) BST3 and (c) BST5 photocatalysts. | |
Fig. 6(a) shows the TEM photograph of the BST5 photocatalyst. The BST5 photocatalyst is mainly composed of some regular cuboids or cubes of different sizes, which is consistent with the SEM observation results. The HRTRM characterization (Fig. 6(b)) of large particles shows that the diffraction pattern at the spacing of 0.28 nm corresponds to the (110) crystal plane of Ba0.5Sr0.5TiO3. Fig. 6(c)–(h) displays the BF-TEM photograph and the corresponding elemental mapping photographs of the BST5 photocatalyst. In Fig. 6(c)–(i), each element is evenly distributed in the BST photocatalysts, indicating that the Sr ions occupy the positions of Ba ions to form Ba0.5Sr0.5TiO3, rather than the solid solution of BaTiO3 and SrTiO3.
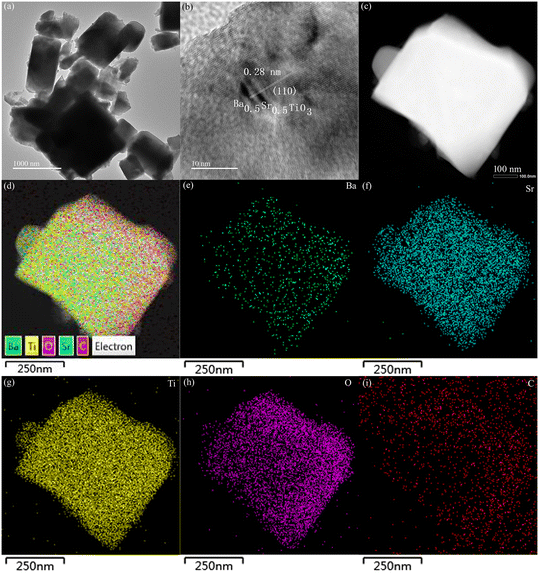 |
| | Fig. 6 (a) TEM, (b) HRTEM, and (c) BF-TEM photographs and (d)–(i) the corresponding elemental mapping photographs of the BST5 photocatalyst. | |
3.4 Optical properties
Fig. 7(a) shows the DRS of the BST photocatalysts. With an increasing wavelength, the reflectance drops sharply in the wavelength range of 190–250 nm, while remaining almost constant in the wavelength range of 250–380 nm. In the wavelength range of 380–420 nm, the reflectance increases sharply with the increasing wavelength, and then slowly increases to 900 nm with the increase of wavelength. With the increase of x, the reflectance increases first and then decreases in the wavelength range of 200–380 nm. Based on the DRS and formula (6), the color parameters (L*, a*, b*) of the BST photocatalysts can be calculated and are given in Table 1:| | 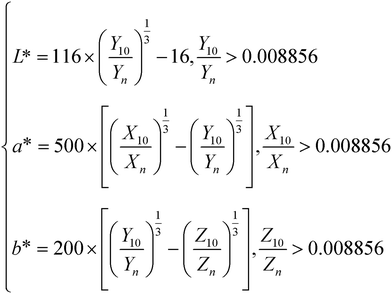 | (6) |
where, (Xn, Yn, Zn) = (94.81, 100, 107.32). Based on formula (7), (X10, Y10, Z10) can be estimated:| | 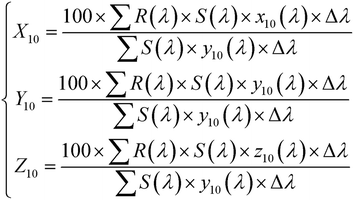 | (7) |
where, λ, (x10(λ), y10(λ), z10(λ)), S(λ), R(λ) and Δλ are the wavelength, the color matching function, the relative spectral power distribution, the reflectance, and 1 nm, respectively. It can be seen from Table 1 that the lowest value of L* is 94.322, indicating that the BST photocatalyst is white. When x = 0.4, L* is the largest. When x = 0.1–0.2, the a* value is negative, and when x = 0.3–0.5, the a* value is positive. This result further confirms that the phase transition of the BST photocatalysts has a great influence on color parameters.
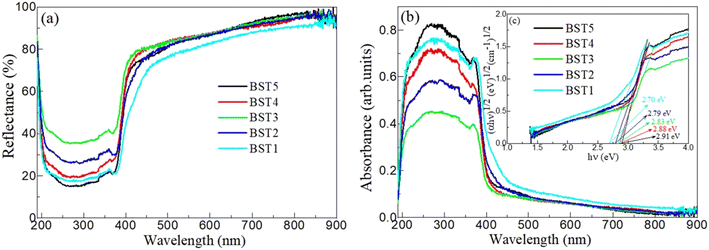 |
| | Fig. 7 (a) DRS, (b) ABS and (c) Eg values of the BST photocatalysts. | |
Table 1 Color parameters (L*, a*, b*) and Eg values of the BST photocatalysts
| Sample |
Color parameters |
E
g value (eV) |
|
L* |
a* |
b* |
| BST1 |
94.322 |
−0.528 |
8.837 |
2.70 |
| BST2 |
96.349 |
−0.174 |
6.259 |
2.79 |
| BST3 |
96.738 |
0.584 |
3.521 |
2.83 |
| BST4 |
96.893 |
0.037 |
4.178 |
2.88 |
| BST5 |
96.408 |
0.203 |
6.185 |
2.91 |
According to the DRS and the Kubelka–Munk (K–M) formula (8), the absorption spectra (ABS) of the BST photocatalysts are displayed in Fig. 7(b).
| |  | (8) |
R is the reflectance of the BST photocatalysts,
α is the absorption coefficient of the BST photocatalysts, and
S is the scattering coefficient of the BST photocatalysts. The results reveal that the BST photocatalysts have a high UV optical absorption coefficient at 190–400 nm and a weak visible optical absorption coefficient at 400–800 nm. In the ultraviolet range, the BST5 photocatalysts have the highest optical absorption coefficient, while the BST1 photocatalysts have the highest optical absorption coefficient in the visible range. This finding further demonstrates that the BST photocatalysts have visible light response capability.
Based on the Tauc relation (9), the relationship between (αhv)1/2 and hv of the BST photocatalysts is displayed in Fig. 7(c).
where
E =
hv is the photon energy,
A is a constant, and
Eg is the optical band gap value of the BST photocatalysts, that is, the focus value of the slope at the steepest point of the curve and the horizontal coordinate. For the indirect band gap semiconductor,
n = 1/2. The
Eg values of the BST1, BST2, BST3, BST4 and BST5 photocatalysts are 2.70, 2.79, 2.83, 2.88 and 2.91 eV, respectively. Compared with BaTiO
3 (Fig. S1
†), the
Eg value of the BST photocatalysts has been greatly reduced. With the increase of the
x value, the
Eg value of the BST photocatalysts increases gradually. The results also confirm that the
Eg value of BaTiO
3 can be regulated by the partial substitution of A-site ions for Sr ions in BaTiO
3.
3.5 Enhanced photocatalytic performances
3.5.1 Effect of the x value on photocatalytic activity.
TC-HCl is an antibiotic that is difficult to be degraded naturally, and was selected as a target degradation drug to gain insight into the photocatalytic activity of the BST photocatalysts. Fig. 8(a) displays the degradation efficiency for TC-HCl on the BST photocatalysts. After half an hour of adsorption, the adsorption percentage of the BST5 photocatalyst reached almost 20%, but TC-HCl was no longer adsorbed by increasing the adsorption time, indicating that the adsorption equilibrium was reached within half an hour. With the increase of illumination time, the photocatalytic activity of the BST photocatalysts was enhanced. Meanwhile, a comparison experiment was also performed, and the degradation percentage was about 30% after 120 minutes of light exposure. With the increase of the x value, the degradation percentage of the BST photocatalysts also increased.
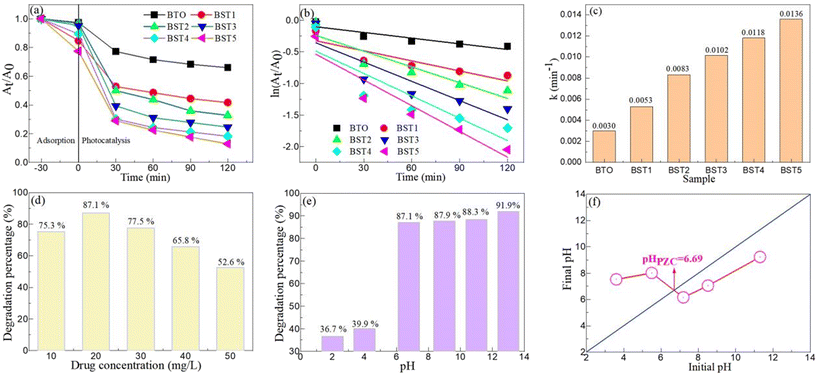 |
| | Fig. 8 (a) The degradation efficiency for TC-HCl on the BST photocatalysts. (b) Plots of ln![[thin space (1/6-em)]](https://www.rsc.org/images/entities/char_2009.gif) (At/A0) vs. irradiation time of the BST photocatalysts for the degradation of TC-HCl. (c) The apparent degradation rate constant (k) value of the BST photocatalysts for the degradation of TC-HCl. Effects of (d) drug concentration and (e) pH value on the degradation of TC-HCl on the BST5 photocatalyst. (f) PZC of the BST5 photocatalyst. (At/A0) vs. irradiation time of the BST photocatalysts for the degradation of TC-HCl. (c) The apparent degradation rate constant (k) value of the BST photocatalysts for the degradation of TC-HCl. Effects of (d) drug concentration and (e) pH value on the degradation of TC-HCl on the BST5 photocatalyst. (f) PZC of the BST5 photocatalyst. | |
The first order kinetic curve can better reflect the photocatalytic activity of the BST photocatalysts:
where
At is the absorbance of TC-HCl at time
t,
A0 is the initial absorbance of TC-HCl, and
k is the kinetic rate constant.
Fig. 8(b) displays the plots of ln
![[thin space (1/6-em)]](https://www.rsc.org/images/entities/char_2009.gif)
(
At/
A0)
vs. irradiation time of the BST photocatalysts for the degradation of TC-HCl. There is a linear dependence between ln
![[thin space (1/6-em)]](https://www.rsc.org/images/entities/char_2009.gif)
(
At/
A0) and irradiation time. The
k values of the BST photocatalysts for the degradation of TC-HCl are presented in
Fig. 8(c). The
k values of the BaTiO
3, BST1, BST2, BST3, BST4 and BST5 photocatalysts are 0.0030, 0.0053, 0.0083, 0.0102, 0.0118 and 0.0136 min
−1, respectively. The photocatalytic degradation rate of the BST5 photocatalyst is 4.53 times that of BaTiO
3.
3.5.2 Effect of drug concentration on photocatalytic activity.
Fig. 8(d) reveals the effect of drug concentration on the degradation of TC-HCl on the BST5 photocatalyst. The catalyst content and drug concentration were 1 g L−1 and 10–50 mg L−1, respectively. With the increase of drug concentration, the photocatalytic degradation percentage of the BST5 photocatalyst first increased and then decreased. The optimal drug concentration was 20 mg L−1, and the degradation percentage was 87.1%. The main reason why the degradation percentage of the BST5 photocatalyst decreased with the increase of drug concentration was that the large number of drugs attached to the surface of the BST5 photocatalyst increased the path length of the photon entering the reaction solution.57–59 Similarly, the optimal content of the catalyst (1 g L−1) can be determined as shown in Fig. S2.†
3.5.3 Effect of the pH value on photocatalytic activity.
Fig. 8(e) displays the effect of the pH value on the degradation of TC-HCl on the BST5 photocatalyst. When the pH of the reaction solution is not adjusted, the initial pH of the reaction solution is 6.77. When the pH value of the reaction solution was adjusted to acidic conditions, the degradation percentage of TC-HCl by the BST5 photocatalyst was not more than 40%. However, after adjusting the pH value of the reaction solution to alkaline conditions, the BST5 photocatalyst has a high photocatalytic activity, and the photocatalytic percentage increases slowly with the increase of the pH value. To explain this phenomenon, the point of zero charge (PZC) experiment was performed and is displayed in Fig. 8(f). It can be seen from the figure that the PZC value of the BST5 photocatalyst is 6.69. Sharifian60 and Gao61et al. reported that the PZC value of SrTiO3 synthesized by different methods was close to 8.5. Klusáčková62et al. believed that the PZC value of BaTiO3 was between 6 and 7. When an Sr ion partially occupies the A-site ion in BaTiO3, the PZC value is close to the PZC value of BaTiO3. When the pH of the reaction solution is greater than the PZC value, the surface charge of the BST5 photocatalyst is negative, which will be easy to react with TC-HCl and improve the photocatalytic activity of the BST5 photocatalyst.63
3.6 Stability and free radical detection
3.6.1 Stability.
As an efficient photocatalyst, whether it can be recycled is an important index to evaluate its practicability. To perform the cyclic stability experiment of the photocatalyst, the photocatalyst will be filtered, dried and sintered after each photocatalysis, and then the next photocatalytic experiment will be performed. Fig. 9(a) shows the cycle index on TC-HCl degradation onto the BST5 photocatalyst. After five cycles, the photocatalytic degradation percentage of the BST5 photocatalyst decreased by 8.6%. This decrease is mainly caused by the loss of the photocatalyst during the cycle, the decrease of surface active sites and the decrease of light permeability.64,65
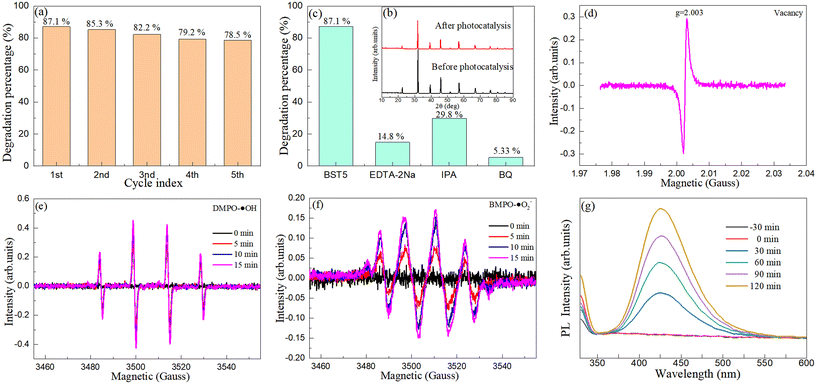 |
| | Fig. 9 (a) Cycle index on TC-HCl degradation onto the BST5 photocatalyst. (b) XRD patterns of the BST5 photocatalyst before and after degradation of TC-HCl. (c) Trapping experiment of the BST5 photocatalyst for the degradation of TC-HCl. ESR/EPR spectra of the BST5 photocatalyst for the (d) oxygen vacancy, (e) hydroxyl radical and (f) superoxide radical. (g) The emission spectra with 2-hydroxyterephthalic acid for the degradation of TC-HCl in the presence of the 1 g L−1 BST5 photocatalyst. | |
To further determine the stability of the BST5 photocatalyst, XRD characterization of the BST5 photocatalyst before and after the photocatalysis was performed. Fig. 9(b) displays the XRD patterns of the BST5 photocatalyst before and after the degradation of TC-HCl. The position of the diffraction peak of the BST5 photocatalyst did not change before and after the photocatalysis. Although the intensity of the diffraction peak changed, the phase purity of the BST5 photocatalyst did not change, indicating that the BST5 photocatalyst was stable. Combined with the above experiments, it is proved that the BST5 photocatalyst can be recycled and is stable. In addition, the XPS spectra (Fig. S3†) of the BST5 photocatalyst after photocatalysis are measured, which also show that the BST5 photocatalyst is stable.
3.6.2 Capture experiments.
The photocatalytic experiments revealed that the BST5 photocatalyst had high photocatalytic activity in the degradation of TC-HCl. To confirm the role of the free radical in the photocatalytic process, the capture experiments were performed. During the experiment, 1 mmol EDTA-2Na, IPA or BQ was added to the reaction solution to confirm the role of holes, hydroxyl radicals and superoxide radicals in the photocatalytic process, and the other processes were consistent with the photocatalytic experiment. Fig. 9(c) presents the trapping experiment of the BST5 photocatalyst for the degradation of TC-HCl. When EDTA-2Na, IPA and BQ were added to the reaction solution, the photocatalytic degradation percentage of the BST5 photocatalyst dropped sharply, and the maximum value was no more than 40%, indicating that the holes, hydroxyl radicals and superoxide radicals played key roles in the whole photocatalytic process.
3.6.3 ESR/EPR characterization.
ESR and EPR experiments were performed to further confirm the dominant role of oxygen vacancies, hydroxyl radicals and superoxide radicals in the degradation of TC-HCl by the BST5 photocatalyst. Fig. 9(d)–(f) displays the ESR/EPR spectra of the BST5 photocatalyst for the oxygen vacancies, hydroxyl radicals and superoxide radicals. The EPR spectra of the BST5 photocatalyst are presented in Fig. 9(d). A symmetric and sharp peak at g = 2.003 was observed, indicating the presence of a large number of oxygen vacancies in the BST5 photocatalyst.66,67 This result is consistent with that observed in the O1s spectra by XPS. The EPR spectra of the BST5 photocatalyst for the hydroxyl radicals and superoxide radicals are displayed in Fig. 9(e) and (f). Almost no hydroxyl radical and superoxide radical signals were detected when there was no exposure to simulated sunlight. The signals of the hydroxyl radicals and superoxide radicals were enhanced significantly when the solution was irradiated by simulated sunlight, and their intensities increased with the increase of illumination time. ESR/EPR experiments confirmed that the oxygen vacancy, hydroxyl radical and superoxide radical were the main active species during the degradation of TC-HCl by the BST5 photocatalyst.
3.6.4 Hydroxyl free radical detection.
Hydroxyl radicals can also be detected by adding 2-hydroxyterephthalic acid to the reaction solution.68–70Fig. 9(g) reveals the emission spectra with 2-hydroxyterephthalic acid for the degradation of TC-HCl in the presence of the 1 g L−1 BST5 photocatalyst with the excitation wavelength of 320 nm. A distinct emission peak at 425 nm can be observed. The intensity of the emission peak increases with the increasing of the illumination time of simulated sunlight. The results further confirmed that the hydroxyl radical is the main active species in the degradation of TC-HCl by the BST5 photocatalyst.
3.6.5 HPLC-MS analysis and toxicity estimation.
HPLC-MS and the Toxicity Estimation Software Tool (T.E.S.T.) were used to detect the intermediate products of TC-HCl degradation and evaluate the toxicity of TC-HCl and the intermediate products, respectively. Fig. S4–S6† display the relevant results and the degradation pathway of TC-HCl in the presence of the BST5 photocatalyst. The results confirm that TC-HCl can be degraded into CO2, H2O and NH4+ under the action of the BST5 photocatalyst and simulated sunlight. By toxicity estimation, the toxicity of some intermediates decreased and some products remained. Therefore, during the photocatalytic degradation of TC-HCl by the BST5 photocatalyst, the illumination time should be extended to reduce the toxicity of the reaction products.
3.7 Photocatalytic mechanism
With the increase of the x value, the Eg value of the BST photocatalyst increases, the morphology changes from an irregular polyhedron to a regular cuboid, and the phase structure changes from a tetragonal phase to a cubic phase, and the percentage of photocatalytic degradation also increases. Optical property analysis and free radical detection experiments confirmed that the BST photocatalysts have visible light response ability, and the oxygen vacancies, holes, hydroxyl radicals and superoxide radicals are the main active species in the degradation process of TC-HCl. Based on the above conclusions and the band theory, the conduction and valence band potentials of the BST photocatalysts were obtained on the basis of eqn (11) and (12):where, the Eg values of the BST1, BST2, BST3, BST4 and BST5 photocatalysts are 2.70, 2.79, 2.83, 2.88 and 2.91 eV, respectively (Ee = 4.5 eV). The absolute electronegativity (X) values of the BST1, BST2, BST3, BST4 and BST5 photocatalysts are 5.1103, 5.0917, 5.0731, 5.0547 and 5.0363, respectively, which can be calculated by eqn (13):| |  | (13) |
The ECB values of the BST1, BST2, BST3, BST4 and BST5 photocatalysts are −0.7397, −0.8033, −0.8419, −0.8853 and −0.9187 eV, respectively, while the EVB values of the BST1, BST2, BST3, BST4 and BST5 photocatalysts are 1.9603, 1.9867, 1.9881, 1.9947 and 1.9913 eV, respectively. Therefore, a photocatalysis mechanism of the BST photocatalysts is presented in Fig. 10. The Eg values of the BST photocatalysts are relatively large, which make it difficult for the BST photocatalysts to respond to visible light. However, there are a few C–O functional groups and oxygen vacancies in the BST photocatalysts, which makes the transfer and separation of electrons and holes in the BST photocatalysts possible. When the simulated sunlight shines on the surface of the BST photocatalysts, the electrons in their valence band are excited to transition to the impurity level formed by the C–O functional group or vacancy, and then transition to the conduction band of the BST photocatalysts under the action of the impurity level, leaving holes in the valence band.
| | | Ba1−xSrxTiO3 + hv → e− + h+ | (14) |
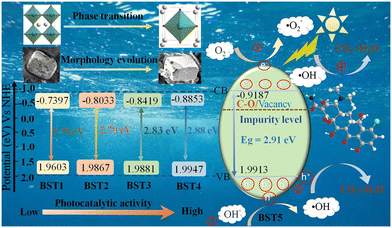 |
| | Fig. 10 The photocatalysis mechanism of the BST photocatalysts. | |
In the valence band of the BST photocatalysts, the following reactions can occur due to the redox potentials of OH−/˙OH being +1.89 V versus NHE.71,72
In addition, the holes can directly react with TC-HCl to produce non-toxic and harmless small molecular organic compounds.
| | | hVB+ + TC-HCl → CO2 + H2O + NH4+ | (16) |
In the conduction band of the BST photocatalysts, electrons can react with oxygen in the reaction solution to form superoxide free radicals due to the redox potential of O2/˙O2− being −0.13 V.73–75
It is worth noting that the free electrons of the conduction band can also react with O2/H2O2 to form hydroxyl radicals.
| | | ˙O2− + 2H+ + eCB− → H2O2 | (18) |
| | | 2eCB− + O2 + 2H+ → H2O2 | (19) |
| | | eCB− + H2O2 → ˙OH + OH− | (20) |
| | | ˙O2− + H2O2 → ˙OH + OH− + O2 | (21) |
Finally, both the hydroxyl radicals generated by the conduction band and the valence band can react with TC-HCl to produce non-toxic and harmless products.
| | | ˙OH + TC-HCl → CO2 + H2O + NH4+ | (22) |
Due to the difference of the phase structure, surface morphology, Eg value, C–O functional group and oxygen vacancy concentration of the BST photocatalysts, the percentage of the photocatalytic degradation of the BST photocatalysts increases with the increase of the x value. Therefore, it can be concluded that the BST photocatalysts with a cubic phase have a similar cuboid morphology, large Eg values and high photocatalytic activity.
4. Conclusion
The BST photocatalysts with different Sr contents were produced by the polyacrylamide gel method and adjusting the pH of the reaction solution to 11. When x = 0.3–0.5, the BST photocatalyst changes from a tetragonal phase at x = 0.1–02 to a cubic phase. The phase transition changes the value of b* in the color parameter of the BST photocatalysts from the negative of the tetragonal phase to the positive of the cubic phase. The Eg value or photocatalytic degradation percentage of the BST photocatalyst is linearly dependent on the x value. The optimal drug concentration, catalyst content, pH value and reaction time were 20 mg L−1, 1 g L−1, 6.77 and 120 min, respectively. The capture experiment and free radical detection experiment revealed that the hole, vacancy, hydroxyl radical and superoxide radical were the main active species in the degradation of TC-HCl by the BST photocatalysts under simulated sunlight irradiation. Their synergistic effect endow the BST photocatalysts with high charge carrier transfer and separation efficiency and photocatalytic activity. HPLC-MS and toxicity analysis revealed the photocatalytic degradation pathway of TC-HCl and the toxicity of the intermediate products. Based on the results of various experimental characterization and energy band theory, a reasonable explanation of the mechanism of photocatalysis has been proposed. This phase structure, energy band and photocatalytic regulation technique provides technical support and theoretical basis for the synthesis of other similar photocatalysts.
Author contributions
Yan Han, Shifa Wang: experiment, data analysis and paper writing. Shifa Wang, Leiming Fang, and Dengfeng Li: supervision and paper revision. Maoyuan Li, Huajing Gao, Mengjun Han, and Hua Yang: experimental testing and analysis. Jagadeesha Angadi V., A. F. Abd El-Rehim, and Atif Mossad Ali: writing – review and editing.
Conflicts of interest
The authors declare that they have no competing interests.
Acknowledgements
This work was supported by the NSAF joint Foundation of China (U2030116), the National Natural Science Foundation of China (12075215), the Science and Technology Research Program of Chongqing Education Commission of China (KJQN202201204 and KJZD-K202001202), the Chongqing Key Laboratory of Geological Environment Monitoring and Disaster Early-warning in Three Gorges Reservoir Area (No. ZD2020A0401), the Talent Introduction Project (09924601) of Chongqing Three Gorges University and the Deanship of Scientific Research at King Khalid University for funding this work through large group Research Project under grant number RGP2/325/44.
References
- A. A. Yadav, Y. M. Hunge and V. L. Mathe,
et al. Photocatalytic degrad-ationof salicylic acid using BaTiO3 photocatalyst under ultraviolet light illu-mination, J. Mater. Sci.: Mater. Electron., 2018, 29, 15069–15073 CrossRef CAS
 .
.
- T. T. Cheng, H. J. Gao and G. R. Liu,
et al. Preparation of core-shell heterojunction photocatalysts by coating CdS nanoparticles onto Bi4Ti3O12 hierarchical microspheres and their photocatalytic removal of organic pollutants and Cr(VI) ions, Colloids Surf., A, 2022, 633, 127918 CrossRef CAS
 .
.
- P. Demircivi and E. B. Simsek, Visible-light-enhanced photoactivity of per-ovskit-e-type W-doped BaTiO3 photocatalyst for photodegradation of tetracycline, J. Alloys Compd., 2019, 774, 795–802 CrossRef CAS
 .
.
- M. Han, S. Wang and X. Chen,
et al. Spinel CuB2O4 (B= Fe, Cr, and Al) oxides for selective adsorption of Congo red and photocatalytic removal of antibiotics, ACS Appl. Nano Mater., 2022, 5, 11194–11207 CrossRef CAS
 .
.
- S. K. Ray, J. Cho and J. Hur, A critical review on strategies for improving efficiency of BaTiO3-based photocatalysts for wastewater treatment, J. Environ. Manage., 2021, 290, 112679 CrossRef CAS PubMed
 .
.
- L. X. Li, H. J. Gao and Z. Yi,
et al. Comparative investigation on synthesis, morphological tailoring and photocatalytic activities of Bi2O2CO3 nanostructures, Colloids Surf., A, 2022, 644, 128758 CrossRef CAS
 .
.
- D. Chen, Y. Cheng and N. Zhou,
et al. Photocatalytic degradation of organic pollutants using TiO2-based photocatalysts: A review, J. Cleaner Prod., 2020, 268, 121725 CrossRef CAS
 .
.
- R. Daghrir, P. Drogui and D. Robert, Modified TiO2 for environmental photocatalytic applications: a review, Ind. Eng. Chem. Res., 2013, 52, 3581–3599 CrossRef CAS
 .
.
- A. C. Wardhana, A. Yamaguchi and S. Shoji,
et al. Visible-light-driven photocatalysis via reductant-to-band charge transfer in Cr (III) nanocluster-loaded SrTiO3 system, Appl. Catal., B, 2020, 270, 118883 CrossRef
 .
.
- Y. Kim, M. Watanabe and J. Matsuda,
et al. Tensile strain for band engineering of SrTiO3 for increasing photocatalytic activity to water splitting, Appl. Catal., B, 2020, 278, 119292 CrossRef CAS
 .
.
- L. X. Li, X. F. Sun and T. Xian,
et al. Template-free synthesis of Bi2O2CO3 hierarchical nanotubes self-assembled from ordered nanoplates for promising photocatalytic application, Phys. Chem. Chem. Phys., 2022, 24, 8279–8295 RSC
 .
.
- T. R. Sobahi and M. S. Amin, Photocatalytic oxidation of atrazine using BaTiO3-MWCNT nanocomposites under visible light, Ceram. Int., 2021, 47, 14366–14374 CrossRef CAS
 .
.
- Y. F. Gu, B. B. Guo and Z. Yi,
et al. Morphology modulation of hollow-shell ZnSn(OH)6 for enhanced photodegradation of methylene blue, Colloids Surf., A, 2022, 653, 129908 CrossRef CAS
 .
.
- T. T. Cheng, H. J. Gao and R. S. Li,
et al. Flexoelectricity-induced enhan-cement in carrier separation and photocatalytic activity of a photocatalyst, Appl. Surf. Sci., 2021, 566, 150669 CrossRef CAS
 .
.
- S. Kumar, M. Sharma and S. Powar,
et al. Impact of remnant surface polarization on photocatalytic and antibacterial performance of BaTiO3, J. Eur. Ceram. Soc., 2019, 39, 2915–2922 CrossRef CAS
 .
.
- Y. Wang, X. Sun and T. Xian,
et al. Photocatalytic purification of simulated dye wastewater in different pH environments by using BaTiO3/Bi2WO6 heterojunction photocatalysts, Opt. Mater., 2021, 113, 110853 CrossRef CAS
 .
.
- S. F. Wang, C. Yu and X. Y. Chen,
et al. Synthesis and characterization of BaTiO3/TiO2 heterojunction photocatalyst for novel application in photocatalytic degradation of TBBPA under simulated sunlight irradiation, ChemistrySelect, 2022, 6, e202202764 Search PubMed
 .
.
- D. Masekela, N. C. Hintsho-Mbita and B. Ntsendwana,
et al. Thin films (FTO/BaTiO3/AgNPs) for enhanced piezo-photocatalytic degradation of methylene blue and ciprofloxacin in wastewater, ACS Omega, 2022, 7, 24329–24343 CrossRef CAS PubMed
 .
.
- S. Selvarajan, P. Malathy and A. Suganthi,
et al. Fabrication of mesoporous BaTiO3/SnO2 nanorods with highly enhanced photocatalytic degradation of organic pollutants, J. Ind. Eng. Chem., 2017, 53, 201–212 CrossRef CAS
 .
.
- R. Djellabi, M. F. Ordonez and F. Conte,
et al. A review of advances in multifunctional XTiO3 perovskite-type oxides as piezo-photocatalysts for environmental remediation and energy production, J. Hazard. Mater., 2022, 421, 126792 CrossRef CAS PubMed
 .
.
- P. Demircivi and E. B. Simsek, Visible-light-enhanced photoactivity of perovskite-type W-doped BaTiO3 photocatalyst for photodegradation of tetracycline, J. Alloys Compd., 2019, 774, 795–802 CrossRef CAS
 .
.
- I. C. Amaechi, A. Hadj Youssef and D. Rawach,
et al. Ferroelectric Fe-Cr codoped BaTiO3 nanoparticles for the photocatalytic oxidation of azo dyes, ACS Appl. Nano Mater., 2019, 2, 2890–2901 CrossRef CAS
 .
.
- S. Joshi, R. K. Canjeevaram Balasubramanyam and S. J. Ippolito,
et al. Straddled band aligned CuO/BaTiO3 heterostructures: role of energetics at nanointerface in improving photocatalytic and CO2 sensing performance, ACS Appl. Nano Mater., 2018, 1, 3375–3388 CrossRef CAS
 .
.
- P. Jia, Y. Li and Z. Zheng,
et al. A dual optimization approach for photoreduction of CO2 to alcohol in g-C3N4/BaTiO3 system: Heterojunction construction and ferroelectric polarization, Appl. Surf. Sci., 2022, 602, 154310 CrossRef CAS
 .
.
- K. Liu, L. Mi and H. Wang,
et al. Preparation of Ba1-xSrxTiO3 by the sol-gel assisted solid phase method: Study on its formation mechanism and photocatalytic hydrogen production performance, Ceram. Int., 2021, 47, 22055–22064 CrossRef CAS
 .
.
- S. L. Lei, J. Yu and S. K. Bao,
et al. High-performance heterostructured CdS/Ba1−xSrxTiO3 system with unique synergism for photocatalytic H2 evolution, Appl. Catal., A, 2015, 493, 58–67 CrossRef CAS
 .
.
- J. Wu, N. Qin and E. Z. Lin,
et al. Enhancement of piezocatalytic activity at the ferro-paraelectric phase transition of Ba1-xSrxTiO3 nanopowders, Mater. Today Energy, 2021, 21, 100732 CrossRef CAS
 .
.
- Y. Wang, M. Zhang and J. Liu,
et al. Domain wall free polar structure enhanced photodegradation activity in nanoscale ferroelectric BaxSr1-xTiO3, Adv. Energy Mater., 2020, 10, 2001802 CrossRef CAS
 .
.
- S. Liu, Z. Liu and Y. Meng, Doping regulates pyro-photo-electric catalysis to achieve efficient water splitting in Ba1−xSrxTiO3 through solar energy and thermal resources, New J. Chem., 2022, 46, 17292–17302 RSC
 .
.
- Z. Liu, Z. Qiao and Z. Guo,
et al. Doping Sr and introducing oxygen vacancies in Ba0.7Sr0.3TiO3-x synergistically promote the pyro-photo-electric catalysis performance, ChemCatChem, 2022, 14, e202200357 CAS
 .
.
- L. Ju, X. Tang and L. Kou, Polarization boosted catalysis: progress and outlook, Microstructures, 2022, 2, 2022008 Search PubMed
 .
.
- S. Chen, P. Zhu and L. Mao,
et al. Piezocatalytic medicine: An emerging frontier using piezoelectric materials for biomedical applications, Adv. Mater., 2023, 2208256, DOI:10.1002/adma.202208256
 .
.
- S. Wang, H. Gao and C. Chen,
et al. Irradiation assisted polyacrylamide gel route for the synthesize of the Mg1-xCoxAl2O4 nano-photocatalysts and its optical and photocatalytic performances, J. Sol-Gel Sci. Technol., 2019, 92, 186–199 CrossRef CAS
 .
.
- M. Rahimian, E. Saebnoori and S. A. Hassanzadeh-Tabrizi, Synthesis and characterization of nano-ceramic pigment Co0.5Zn0.5Al2O4 via polyacrylamide gel method, Pigm. Resin Technol., 2020, 49, 189–195 CrossRef CAS
 .
.
- S. Wang, M. Li and H. Gao,
et al. Construction of CeO2/YMnO3 and CeO2/MgAl2O4/YMnO3 photocatalysts and adsorption of dyes and photocatalytic oxidation of antibiotics: Performance prediction, degradation pathway and mechanism insight, Appl. Surf. Sci., 2023, 608, 154977 CrossRef CAS
 .
.
- S. Kongtaweelert, D. C. Sinclair and S. Panichphant, Phase and morphology investigation of BaxSr1−xTiO3 (x= 0.6, 0.7 and 0.8) powders, Curr. Appl. Phys., 2006, 6, 474–477 CrossRef
 .
.
- Y. Wang, Z. Y. Shen and Y. M. Li,
et al. Optimization of energy storage density and efficiency in BaxSr1-xTiO3 (x≤0.4) paraelectric ceramics, Ceram. Int., 2015, 41, 8252–8256 CrossRef CAS
 .
.
- S. Wang, H. Gao and Y. Jin,
et al. Defect engineering in novel broad-band gap hexaaluminate MAl12O19 (M= Ca, sr, Ba)-Based photocatalysts Boosts Near ultraviolet and visible
light-driven photocatalytic performance, Mater. Today Chem., 2022, 24, 100942 CrossRef CAS
 .
.
- H. J. Gao, S. F. Wang and L. M. Fang,
et al. Nanostructured spinel-type M (M= Mg, Co, Zn) Cr2O4 oxides: novel adsorbents for aqueous Congo red removal, Mater. Today Chem., 2021, 22, 100593 CrossRef CAS
 .
.
- H. Liu, S. Wang and H. Gao,
et al. A simple polyacrylamide gel route for the synthesis of MgAl2O4 nanoparticles with different metal sources as an efficient adsorbent: Neural network algorithm simulation, equilibrium, kinetics and thermodynamic studies, Sep. Purif. Technol., 2022, 281, 119855 CrossRef CAS
 .
.
- J. Li, S. Wang and G. Sun,
et al. Facile preparation of MgAl2O4/CeO2/Mn3O4 heterojunction photocatalyst and enhanced photocatalytic activity, Mater. Today Chem., 2021, 19, 100390 CrossRef CAS
 .
.
- N. G. Imam, M. AbouHasswa and N. Okasha, Synchrotron X-ray absorption fine structure study and dielectric performance of Li0.5Fe2.5O4/BaTiO3 multiferroic, J. Mater. Sci.: Mater. Electron., 2021, 32, 21492–21510 CrossRef CAS
 .
.
- T. S. Soliman, M. F. Zaki and M. M. Hessien,
et al. The structure and optical properties of PVA-BaTiO3 nanocomposite films, Opt. Mater., 2021, 111, 110648 CrossRef CAS
 .
.
- A. G. A. Darwish, Y. Badr and M. E. Shaarawy,
et al. Influence of the Nd3+ ions content on the FTIR and the visible up-conversion luminescence properties of nano-structure BaTiO3, prepared by sol–gel technique, J. Alloys Compd., 2010, 489, 451–455 CrossRef CAS
 .
.
- R. K. Goyal, P. Tamhane and S. Tambat, Improvement in dielectric properties of the three-phase GN–BaTiO3–PEK nanocomposites with and without silane coupling agent, J. Mater. Sci.: Mater. Electron., 2021, 32, 28468–28479 CrossRef CAS
 .
.
- E. R. Silva, J. V. Nicolini and L. Yamauchi Jr,
et al. Carbon-based electrode loaded with Y-doped SrTiO3 perovskite as support for enzyme immobilization in biosensors, Ceram. Int., 2020, 46, 3592–3599 CrossRef
 .
.
- N. C. Pramanik, N. Anisha and P. A. Abraham,
et al. Preparation of BaxSr1−xTiO3 (x=0-1) nanoparticles by wet-chemical decomposition of Ti-complex and study their dielectric properties, J. Alloys Compd., 2009, 476, 524–528 CrossRef CAS
 .
.
- S. F. Wang, C. Zhang and G. Sun,
et al. Fabrication of a novel light emission material AlFeO3 by a modified polyacrylamide gel route and characterization of the material, Opt. Mater., 2013, 36, 482–488 CrossRef CAS
 .
.
- H. Jena, V. K. Mittal and S. Bera,
et al. X-ray photoelectron spectroscopic investigations on cubic BaTiO3, BaTi0.9Fe0.1O3 and Ba0.9Nd0.1TiO3 systems, Appl. Surf. Sci., 2008, 254, 7074–7079 CrossRef CAS
 .
.
- J. Wang, T. Wang and Z. Zhao,
et al. Regulation of oxygen vacancies in SrTiO3 perovskite for efficient photocatalytic nitrogen fixation, J. Alloys Compd., 2022, 902, 163865 CrossRef CAS
 .
.
- S. Fuentes, E. Chávez and L. Padilla-Campos,
et al. Influence of reactant type on the Sr incorporation grade and structural characteristics of Ba1-xSrxTiO3 (x=0-1) grown by sol–gel-hydrothermal synthesis, Ceram. Int., 2013, 39, 8823–8831 CrossRef CAS
 .
.
- M. Oku, K. Wagatsuma and S. Kohiki, Ti 2p and Ti 3p X-ray photoelectron spectra for TiO2, SrTiO3 and BaTiO3, Phys. Chem. Chem. Phys., 1999, 1, 5327–5331 RSC
 .
.
- D. B. Pal, A. K. Rathoure and A. Singh, Investigation of surface interaction in rGO-CdS photocatalyst for hydrogen production: an insight from XPS studies, Int. J. Hydrogen Energy, 2021, 46, 26757–26769 CrossRef CAS
 .
.
- S. Wang, H. Gao and X. Yu,
et al. Nanostructured SrTiO3 with different morphologies achieved by mineral acid-assisted hydrothermal method with enhanced optical, electrochemical, and photocatalytic performances, J. Mater. Sci.: Mater. Electron., 2020, 31, 17736–17754 CrossRef
 .
.
- S. Wang, S. Tang and H. Gao,
et al. Microstructure, optical, photoluminescence properties and the intrinsic mechanism of photoluminescence and photocatalysis for the BaTiO3, BaTiO3/TiO2 and BaTiO3/TiO2/CeO2 smart composites, Opt. Mater., 2021, 118, 111273 CrossRef CAS
 .
.
- G. Philippot, K. M. Jensen and M. Christensen,
et al. Coupling in situ synchrotron radiation with ex situ spectroscopy characterizations to study the formation of Ba1-xSrxTiO3 nanoparticles
in supercritical fluids, J. Supercrit. Fluids, 2014, 87, 111–117 CrossRef CAS
 .
.
- Q. Qin, Y. Guo and D. Zhou,
et al. Facile growth and composition-dependent photocatalytic activity of flowerlike BiOCl1-xBrx hierarchical microspheres, Appl. Surf. Sci., 2016, 390, 765–777 CrossRef CAS
 .
.
- Q. Wang, T. Wang and G. Qu,
et al. High-efficient removal of tetrabromobisphenol A in aqueous by dielectric barrier discharge: Performance and degradation pathways, Sep. Purif. Technol., 2020, 240, 116615 CrossRef CAS
 .
.
- S. Wang, X. Chen and L. Fang,
et al. Double heterojunction CQDs/CeO2/BaFe12O19 magnetic separation photocatalysts: Construction, structural characterization, dye and POPs removal, and the interrelationships between magnetism and photocatalysis, Nuclear Analysis, 2022, 1, 100026 CrossRef
 .
.
- K. Sharifian, V. Mahdikhah and S. Sheibani, Ternary Ag@ SrTiO3@ CNT plasmonic nanocomposites for the efficient photodegradation of organic dyes under the visible light irradiation, Ceram. Int., 2021, 47, 22741–22752 CrossRef CAS
 .
.
- H. Gao, H. Yang and S. Wang, Hydrothermal synthesis, growth mechanism, optical properties and photocatalytic activity of cubic SrTiO3 particles for the degradation of cationic and anionic dyes, Optik, 2018, 175, 237–249 CrossRef CAS
 .
.
- M. Klusáčková, R. Nebel and P. Krtil,
et al. Photo-electrochemical activity and selectivity of nanocrystalline BaTiO3 electrodes in water oxidation, Electrochem. Sci. Adv., 2021, 1, e2000005 Search PubMed
 .
.
- Y. R. Girish, G. Alnaggar and A. Hezam,
et al. Facile and rapid synthesis of solar-driven TiO2/g-C3N4 heterostructure photocatalysts for enhanced photocatalytic activity, J. Sci.: Adv. Mater. Devices, 2022, 7, 100419 CAS
 .
.
- N. Kumaresan, K. Ramamurthi and R. R. Babu,
et al. Hydrothermally grown ZnO nanoparticles for effective photocatalytic activity, Appl. Surf. Sci., 2017, 418, 138–146 CrossRef CAS
 .
.
- S. F. Yang, C. G. Niu and D. W. Huang,
et al. SrTiO3 nanocubes decorated with Ag/AgCl nanoparticles as photocatalysts with enhanced visible-light photocatalytic activity towards the degradation of dyes, phenol and bisphenol A, Environ. Sci.: Nano, 2017, 4, 585–595 RSC
 .
.
- D. Zhang, H. Liu and C. Su,
et al. Combustion synthesis of highly efficient Bi/BiOBr visible light photocatalyst with synergetic effects of oxygen vacancies and surface plasma resonance, Sep. Purif. Technol., 2019, 218, 1–7 CrossRef CAS
 .
.
- P. Xia, B. Cheng and J. Jiang,
et al. Localized π-conjugated structure and EPR investigation of g-C3N4 photocatalyst, Appl. Surf. Sci., 2019, 487, 335–342 CrossRef CAS
 .
.
- K. Das, R. Bariki and S. K. Pradhan,
et al. Boosting the photocatalytic performance of Bi2Fe4O9 through formation of Z-scheme heterostructure with In2S3: Applications towards water decontamination, Chemosphere, 2022, 306, 135600 CrossRef CAS PubMed
 .
.
- K. Das, R. Bariki and S. K. Pradhan,
et al. Facile synthesis and applicati-on of CdS/Bi20TiO32/Bi4Ti3O12 ternary heterostructure: A synergistic multi-he-terojunction photocatalyst for enhanced endosulfan degradation and hydrogen evolution reaction, Appl. Catal., B, 2022, 303, 120902 CrossRef CAS
 .
.
- S. Obregón, M. A. Ruíz-Gómez and D. B. Hernández-Uresti, Direct evidence of the photocatalytic generation of reactive oxygen species (ROS) in a Bi2W2O9 layered-structure, J. Colloid Interface Sci., 2017, 506, 111–119 CrossRef PubMed
 .
.
- Z. He, H. Yang and J. Sunarso,
et al. Novel scheme towards interfacial charge transfer between ZnIn2S4 and BiOBr for efficient photocatalytic removal of organics and chromium (VI) from water, Chemosphere, 2022, 303, 134973 CrossRef CAS PubMed
 .
.
- S. Wang, D. Li and C. Yang,
et al. A novel method for the synthesize of nanostructured MgFe2O4 photocatalysts, J. Sol-Gel Sci. Technol., 2017, 84, 169–179 CrossRef CAS
 .
.
- Z. He, H. Fareed and H. Yang,
et al. Mechanistic insight into the charge carrier separation and molecular oxygen activation of manganese doping BiOBr hollow microspheres, J. Colloid Interface Sci., 2023, 629, 355–367 CrossRef CAS PubMed
 .
.
- C. Yu, S. Wang and K. Zhang,
et al. Visible-light-enhanced photocatalytic activity of BaTiO3/γ-Al2O3 composite photocatalysts for photodegradation of tetracycline hydrochloride, Opt. Mater., 2023, 135, 113364 CrossRef CAS
 .
.
- M. Li, S. Wang and H. Gao,
et al. Selective removal of antibiotics over MgAl2O4/C3N4/YMnO3 photocatalysts: Performance prediction and mechanism insight, J. Am. Ceram. Soc., 2023, 106, 2420–2442 CrossRef CAS
 .
.
|
| This journal is © The Royal Society of Chemistry 2023 |
 *a,
Maoyuan
Li
a,
Huajing
Gao
a,
Mengjun
Han
a,
Hua
Yang
 b,
Leiming
Fang
*c,
Jagadeesha
Angadi V.
 d,
A. F. Abd
El-Rehim
ef,
Atif Mossad
Ali
eg and
Dengfeng
Li
 *h
*h
![[thin space (1/6-em)]](https://www.rsc.org/images/entities/char_2009.gif) :
:![[thin space (1/6-em)]](https://www.rsc.org/images/entities/char_2009.gif) nSr = 9
nSr = 9![[thin space (1/6-em)]](https://www.rsc.org/images/entities/char_2009.gif) :
:![[thin space (1/6-em)]](https://www.rsc.org/images/entities/char_2009.gif) 1, 8
1, 8![[thin space (1/6-em)]](https://www.rsc.org/images/entities/char_2009.gif) :
:![[thin space (1/6-em)]](https://www.rsc.org/images/entities/char_2009.gif) 2, 7
2, 7![[thin space (1/6-em)]](https://www.rsc.org/images/entities/char_2009.gif) :
:![[thin space (1/6-em)]](https://www.rsc.org/images/entities/char_2009.gif) 3, 6
3, 6![[thin space (1/6-em)]](https://www.rsc.org/images/entities/char_2009.gif) :
:![[thin space (1/6-em)]](https://www.rsc.org/images/entities/char_2009.gif) 4 and 5
4 and 5![[thin space (1/6-em)]](https://www.rsc.org/images/entities/char_2009.gif) :
:![[thin space (1/6-em)]](https://www.rsc.org/images/entities/char_2009.gif) 5, appropriate amounts of Ba(NO3)2, Sr(NO3)2 and C16H36O4Ti were weighed, and the corresponding samples were named BST1, BST2, BST3, BST4 and BST5, respectively. The corresponding volume of tetrabutyl titanate was measured with a measuring cylinder and added into Ba(NO3)2 and Sr(NO3)2 solutions dissolved in 20 mL deionized water. Then, 4.7282 g citric acid, 20 g glucose, 9.5958 g acrylamide and 1.9192 g methylene diacrylamide were added to the above solution, and deionized water was added in time to make it reach 100 mL. Finally, a precursor solution with 0.015 mol L−1 metal ion concentration was formed. After the precursor solution was stirred at room temperature for 2 hours until clear, a small amount of ammonia was added to adjust the pH value of the solution to 11, and the temperature was increased to about 100 °C until a jelly-like gel was formed. The gel was dried at 120 °C for 24 hours and then cooled. After grinding, the target product was obtained by sintering at 950 °C in a tube furnace for 5 hours. The related synthesis process of the BST photocatalysts is shown in Fig. 1.
5, appropriate amounts of Ba(NO3)2, Sr(NO3)2 and C16H36O4Ti were weighed, and the corresponding samples were named BST1, BST2, BST3, BST4 and BST5, respectively. The corresponding volume of tetrabutyl titanate was measured with a measuring cylinder and added into Ba(NO3)2 and Sr(NO3)2 solutions dissolved in 20 mL deionized water. Then, 4.7282 g citric acid, 20 g glucose, 9.5958 g acrylamide and 1.9192 g methylene diacrylamide were added to the above solution, and deionized water was added in time to make it reach 100 mL. Finally, a precursor solution with 0.015 mol L−1 metal ion concentration was formed. After the precursor solution was stirred at room temperature for 2 hours until clear, a small amount of ammonia was added to adjust the pH value of the solution to 11, and the temperature was increased to about 100 °C until a jelly-like gel was formed. The gel was dried at 120 °C for 24 hours and then cooled. After grinding, the target product was obtained by sintering at 950 °C in a tube furnace for 5 hours. The related synthesis process of the BST photocatalysts is shown in Fig. 1.


![[double bond, length as m-dash]](https://www.rsc.org/images/entities/char_e001.gif) C–OH functional groups in the BST photocatalyst.35 This result was consistent with the FTIR results, which confirmed the presence of C–O functional groups in the BST photocatalysts. The O 1s spectra of the BST1, BST3 and BST5 photocatalysts are displayed in Fig. 4(d)–(f). The O 1s spectra can also be fitted into three photoelectron peaks, which are located at 528.94, 531.44 and 534.18 eV, respectively. The peaks at 528.94, 531.44 and 534.18 eV are assigned to the lattice oxygen of SrTiO3 (OLSTO), the lattice oxygen of BaTiO3 (OLBTO) and the adsorbed oxygen, respectively.54,55 Simultaneously, the adsorbed oxygen may contain a small amount of oxygen in the C–O functional group.56
C–OH functional groups in the BST photocatalyst.35 This result was consistent with the FTIR results, which confirmed the presence of C–O functional groups in the BST photocatalysts. The O 1s spectra of the BST1, BST3 and BST5 photocatalysts are displayed in Fig. 4(d)–(f). The O 1s spectra can also be fitted into three photoelectron peaks, which are located at 528.94, 531.44 and 534.18 eV, respectively. The peaks at 528.94, 531.44 and 534.18 eV are assigned to the lattice oxygen of SrTiO3 (OLSTO), the lattice oxygen of BaTiO3 (OLBTO) and the adsorbed oxygen, respectively.54,55 Simultaneously, the adsorbed oxygen may contain a small amount of oxygen in the C–O functional group.56


![[thin space (1/6-em)]](https://www.rsc.org/images/entities/char_2009.gif) (At/A0) vs. irradiation time of the BST photocatalysts for the degradation of TC-HCl. There is a linear dependence between ln
(At/A0) vs. irradiation time of the BST photocatalysts for the degradation of TC-HCl. There is a linear dependence between ln![[thin space (1/6-em)]](https://www.rsc.org/images/entities/char_2009.gif) (At/A0) and irradiation time. The k values of the BST photocatalysts for the degradation of TC-HCl are presented in Fig. 8(c). The k values of the BaTiO3, BST1, BST2, BST3, BST4 and BST5 photocatalysts are 0.0030, 0.0053, 0.0083, 0.0102, 0.0118 and 0.0136 min−1, respectively. The photocatalytic degradation rate of the BST5 photocatalyst is 4.53 times that of BaTiO3.
(At/A0) and irradiation time. The k values of the BST photocatalysts for the degradation of TC-HCl are presented in Fig. 8(c). The k values of the BaTiO3, BST1, BST2, BST3, BST4 and BST5 photocatalysts are 0.0030, 0.0053, 0.0083, 0.0102, 0.0118 and 0.0136 min−1, respectively. The photocatalytic degradation rate of the BST5 photocatalyst is 4.53 times that of BaTiO3.

.
.
.
.
.
.
.
.
.
.
.
.
.
.
.
.
.
.
.
.
.
.
.
.
.
.
.
.
.
.
.
.
.
.
.
.
.
.
.
.
.
.
.
.
.
.
.
.
.
.
.
.
.
.
.
.
.
.
.
.
.
.
.
.
.
.
.
.
.
.
.
.
.
.
.


