Modulating hardness in Sc2(Ru5−xTMx)B4 through empirical considerations and computational analysis†
Jacob C.
Hickey
 ab and
Jakoah
Brgoch
*ab
aDepartment of Chemistry, University of Houston, Houston, Texas 77204, USA. E-mail: jbrgoch@uh.edu
bTexas Center for Superconductivity, University of Houston, Houston, Texas 77024, USA
First published on 4th January 2022
Abstract
Ternary and higher-order borides remain an underexplored area in the search for hard materials. The difficulties associated with purely systematic experimental investigations have largely hindered the consideration of such complex phases. Here, traditional design rules are merged with computation-based methods to direct synthetic efforts, addressing this challenge. The compound Sc2Ru5B4 was selected to demonstrate this approach. The phase was first prepared using arc melting, and the crystal structure was resolved with single-crystal X-ray diffraction. Vickers microhardness indentation revealed that Sc2Ru5B4 is a hard metal, and the mechanical properties can be enhanced by substituting Ru for the isoelectronic but more electron-dense Os following an empirical understanding of hardness in borides. Analyzing the ensuing density of states (DOS) of Sc2(Ru4Os)B4 indicates the Fermi level nevertheless falls in an unfavorable position requiring a reduction in the electron count to optimize the electronic structure. The subsequent synthesis of Sc2(Ru4TM)B4 (TM = Ta, W, Re, and Ir) alters the electron count moving the Fermi level from the peak. At the same time, Vickers indentation measurements, combined with DFT-level stress–strain calculations and a bonding analysis, show that shifting the Fermi level reduces the occupation of antibonding interactions, which also increases the hardness. These data suggest that electron density, Fermi level position, and chemical bonding are essential markers when developing high hardness materials.
Introduction
Transition metal borides are an intriguing class of structural materials due to their exceptional mechanical properties, including high hardness, high bulk modulus, and high shear modulus.1,2 Hard metal borides are found in various tools and abrasives like drill bits or sandpaper, and they are essential to the aerospace and military industries. The resulting extensive research on binary metal borides like TiB2,3,4 ZrB2,5 ReB2,6,7 and WB48 for these applications has all but eliminated discoveries in the binary phase space.9,10 Thus, a transition to the underexplored ternary and higher-order boride systems may prove beneficial to advance the development of high hardness materials.11There are multiple routes for discovering complex, high hardness borides. Exploratory materials synthesis is among the most common, where known compounds are selected from crystal structure repositories, like the Inorganic Crystal Structure Database (ICSD), based on reported design criteria. This generally includes combining transition metals with high valence electron density with short, covalent bond forming elements.2,12 The compounds are then prepared using high-temperature synthetic approaches and characterized with Vickers microhardness (HV) indentation measurements. Many new high hardness materials have been reported using this valuable, albeit time-consuming, approach.9 Materials with an already known hardness can also be improved through solid solution hardening, work hardening, and grain-boundary optimization.13–15 For example, incorporating ≈50% W in ReB2 yields a ≈16% increase in HV.16 Multicomponent alloys, sometimes termed high entropy alloys (HEA), containing five or more elements are an extreme version of solid solutions that have similarly gained attention due to their remarkable mechanical properties.17–19 For instance, five-component metal diborides prepared in the AlB2-type structure have been shown to possess impressive hardness and oxidation resistance that is generally better than their binary components.17 Sintering the boron-doped HEA (VNbMoTaW)99B1 at various temperatures has also shown the ability to modulate the grain size and maximize HVvia grain boundary strengthening.20 Solid solutions can likewise stabilize phases at ambient conditions that are otherwise inaccessible. HfB12 generally requires high temperature (1600 °C) and pressure (6.5 GPa), but it can be prepared using easier reaction conditions when mixed with other transition metals.21,22 These examples represent some of the many ways to enhance a compound's mechanical properties using an empirical understanding of solid state chemistry.
Computation-based methods including machine learning, molecular dynamics, and density functional perturbation theory have also been used to study hard materials.14 For example, machine learning models are capable of directly and quantitatively predicting HV at room temperature and high temperature using experimentally measured hardness values reported in the literature as the training data set.23,24 Research has shown that machine learning can further balance a material's hardness and ductility by also modeling fracture toughness.25,26 Million atom molecular dynamics (MD) simulations provided a route to model deformation mechanism upon indentation and generated calculated HV values that adequately agree with experimental results.14 MD simulations are also helpful for probing a material's tendency to retain hardness at elevated temperatures. Researchers have additionally employed more computationally expensive approaches to discover complex hard materials by employing density functional theory (DFT).14 For instance, the bulk (B) and shear (G) moduli can be calculated with DFT and then entered into semi-empirical models to predict hardness.27–29 DFT-based techniques can likewise be combined with powerful structure prediction methods like Crystal Structure Analysis by Particle Swarm Optimization (CALYPSO)30 to predict thermodynamically stable and metastable hard materials.31 Finally, crystal orbital Hamilton population (COHP) calculations can be used to optimize bonding by varying the valence electron count (VEC) en route to materials with stronger chemical interactions.32,33 The observed change in the occupied bonding states can then be correlated with the bond strength and ultimately the experimentally measured HV.
The work presented herein considers the idea of combining both the classical, empirical, experimental-based methods for hard materials discovery and optimization with the computational-based approaches. First, solid solutions with differing electron densities are tested to vary the hardness, and then the electronic structure is analyzed to tune the chemical bonding. This information is ultimately used in tandem to optimize HV. The system employed to demonstrate this approach is Sc2(Ru5−xTMx)B4 (TM = Ta, W, Re, Os, and Ir). This phase is suitable for this study because multiple elements and electron densities can be achieved through TM solid solution formation.34,35 The initial substitution of Ru for isovalent Os in Sc2(Ru5−xOsx)B4 (x = 1.0–5.0) systematically changes the electron density while varying the VEC by exchanging the 5d transition metal modulates the Fermi level as a way to access an electronically advantageous pseudogap and optimize the bonding. The changes in crystal chemistry and electronic structure are subsequently connected to the materials’ Vickers hardness. Finally, DFT calculated stress–strain curves provide fundamental insight into the composition-property relationship necessary to improve the design criteria for developing novel hard materials.
Experimental and computational methods
Synthesis and characterization
Samples of Sc2Ru5B4, Sc2(Ru5−xOsx)B4 (x = 1–5), and Sc2(Ru4TM)B4 (TM = Ta, W, Re, and Ir) were prepared by arc melting the elements in the desired stoichiometric ratios under flowing argon on a water-cooled copper hearth. The starting materials, Sc (HEFA Rare Earth Canada Co. Ltd, 99.999%), W (Alfa Aesar, 99.9%), Os (Alfa Aesar, 99.95%), Ru (Alfa Aesar, 99.95%), Ta (Alfa Aesar, 99.98%), Re (Alfa Aesar, 99.997%), Ir (Alfa Aesar, 99.95%), and crystalline boron (Alfa Aesar, 98%) were weighed out (total mass ≈0.20 g), pressed into 6 mm pellets, and melted using a current of 25 A to 90 A (depending on the TM) until homogenous melting occurred. The ingots were flipped and remelted at least twice to ensure sample homogeneity. The weight loss after arc melting each sample was <5%. Additional synthesis with excess boron loaded did not improve phase purity or reduce the presence of the secondary phases.The ingots were split into two pieces. One half was crushed, and single crystals from two of the samples (Sc2Ru5B4 and Sc2(Ru4Re)B4) were picked with the aid of a ZEISS Stemi 508 optical microscope. Single-crystal data were collected on a Bruker Apex II platform diffractometer fitted with a 4K CCD APEX II detector and a Mo Kα radiation source. Data for Sc2Ru5B4 were acquired at 296 K using six sets (2266 frames total) of Omega scans at different Phi settings, with scan widths of 0.5° in ω and an exposure time of 30 s frame−1. Reflections for Sc2(Ru4Re)B4 were obtained at 296 K using a narrow-frame algorithm with scan widths of 0.3° in ω and an exposure time of 30 s frame−1 (3 sets of 424 frames). The data were integrated with the Bruker Apex II program, and the intensities were corrected for polarization, Lorentz factor, air absorption, and absorption from the difference in path length through the faceplate of the detector. TWINLABS36 was used to scale the data and apply an absorption correction. The ShelXle program package (version 6.12)37 was used for structure solution and refinement of both compounds, with a full-matrix least-squares on Fo2. The crystal of Sc2(Ru4Re)B4 was twinned and integrated as such using Bruker Nonius SAINT. The single-crystal refinement statistics, refined atomic positions, and refined harmonic displacement parameters are provided in Tables S1–S3 (ESI†), respectively. The final crystal structure solutions, in CIF format, have been sent to The Cambridge Crystallographic Data Centre (CCDS) and can be obtained from the CCDC using the depository numbers 2118063 (Sc2Ru5B4) and 2118062 (Sc2(Ru4Re)B4).
The remainder of this first half was ground into a fine powder with a CerCo Diamonite™ mortar and pestle for powder X-ray diffraction analysis using a PANalytical X’Pert powder diffractometer equipped with Cu Kα radiation (λ = 1.54184 Å). The diffractograms were analyzed by the Le Bail refinement method performed with the General Structure Analysis System (GSAS) software and the EXPGUI interface.38,39 VESTA was used to visualize the crystal structures.40
The other half of the ingots were used for Vickers microindentation measurements. The samples were mounted in EpoxiCure™ 2 Epoxy Resin and then polished using a Diamond polishing plate, SiC polishing plates (800–1200 grit), 7 μm, 3 μm, and 1 μm diamond paste until a mirror finish was obtained. An average of ten indentations at 0.49 N (50 kgf) load and five indentations for 0.98, 1.96, 2.94, and 4.9 N (100, 200, 300, and 500 kgf) loads were made using a LECO AMH55, LM810AT Vickers microhardness indenter. The indentations were analyzed using the LECO Cornerstone AMH55 L software to calculate HV.
The surface morphology of the mounted, polished ingots was also analyzed using a JEOL 6330F field emission scanning electron microscope (FE-SEM) with an emission current of 12 μA and an accelerating voltage of 15 eV. The micrographs were used to analyze the elemental distribution, while the approximate composition was analyzed using energy-dispersive X-ray spectroscopy (EDS). The epoxy surfaces were coated with colloidal graphite paste before analysis to minimize charging.
Density functional theory
The electronic structure of Sc2Ru5B4 and Sc2(Ru4TM)B4 (TM = Ta, W, Mo, Re, Os, and Ir) was obtained using DFT. These calculations employed the Vienna ab initio simulation package (VASP),41,42 which is a plane-wave basis set with projector-augmented-wave (PAW) pseudopotentials used to describe the electronic wave functions.43 The Perdew–Burke–Ernzerhof generalized gradient approximation (PBE-GGA) functional was applied to account for exchange and correlation.44 The energy cutoff was set to 500 eV, with the electronic and ionic convergence criterion set to 1 × 10⁻⁸ eV and 1 × 10⁻⁶ eV, respectively. A Monkhorst–Pack k-point grid with a minimum of 1000 k-points/atom was used to ensure correct sampling of the first Brillouin zone.45 The dynamic stability of the converged structures was checked with phonon dispersion calculations generated using the PHONOPY package.46 These calculations employed the modified Parlinski–Li–Kawazoe ab initio force constant method.46 The force constant matrix was constructed using the Hellmann–Feynman forces obtained by VASP calculations on a 1 × 1 × 2 supercell with symmetry independent atoms displaced by ±0.02 Å.The calculations of the substitutional analogs required a multi-step process to evaluate the site preference for transition metal atoms in Sc2(Ru4TM)B4 (TM = Ta, W, Re, Os, and Ir). First, all symmetry operations were removed from the Sc2Ru5B4 parent crystal structure. Each Ru atom was then systematically replaced with the corresponding transition metal atom producing ten unique structures with a composition of Sc2(Ru4.5TM0.5)B4. Every structure was then optimized, and the models with the lowest total energy were identified. Once the substitutional site preference for each TM was identified, compounds with the composition Sc2(Ru4TM)B4 were generated by calculating 1 × 1 × 2 supercells using the “Supercell” software.47 Twelve models for each solid solution were optimized, and the lowest energy models were determined. The energetic difference between the generated supercell models for each solid solution was <25 meV per atom. Nevertheless, the calculations indicate the lowest total energy model places the TM atom on Wyckoff site 4g, which is in agreement with the single-crystal structure solution for Sc2(Ru4Re)B4 (Table S1, ESI†). The exception is when TM = Ir, which showed a calculated site preference where Ir will occupy the 2c Wyckoff site. The lowest total energy models for Sc2(Ru4TM)B4 were selected for subsequent DOS and COHP analysis.
Finally, stress–strain calculations were performed to determine the ideal strength of Sc2Ru5B4 and Sc2(Ru4TM)B4. The unit cells were strained incrementally with a 0.02 Å step size for all stress–strain calculations.48,49 The uniaxial tensile stress–strain curves were calculated along six high symmetry crystallographic directions, while uniaxial shear stress–strain curves were calculated by applying shear deformation on 26 different slip systems. The resulting stress and strain values were plotted to generate tensile and shear stress–strain curves for Sc2(Ru4TM)B4.
Results and discussion
Synthesis and characterization of Sc2Ru5B4
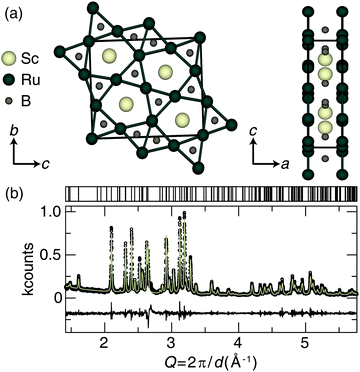
The preparation of Sc2Ru5B4 was achieved by arc melting the elements in the desired ratios. The crystal structure of Sc2Ru5B4, shown in Fig. 1a, was first published by Rogol in 1984 and reported to adopt space group P2/m (space group no. 10) with a monoclinic angle of only β = 90.01(7)°.34 An initial analysis of the powder X-ray diffractograms for the sample here did not indicate monoclinic peak splitting. Therefore, single-crystal X-ray diffraction was first used to re-examine the crystal structure of the newly prepared sample. The resulting single-crystal crystallographic data are provided in Table S1 (ESI†). Indeed, the new crystal structure solution shows that Sc2Ru5B4 adopts a primitive orthorhombic crystal structure (space group Pbam; no. 55) that is nearly identical to the previously published structure, although all angles are now 90° and the bond lengths are slightly different. The unit cell still consists of layers of ruthenium atoms forming a planar pentagonal- and trigonal-connected network. Between these layers sit the Sc and B atoms. The nonregular pentagonal Ru prisms are edge-connected, and scandium resides in the center of the pentagonal Ru-prisms, while the boron occupies the center of trigonal prisms formed by the Ru layers. The refined powder X-ray diffractogram of Sc2Ru5B4, displayed in Fig. 1b, indicates the product is nearly phase pure with only minor unidentified impurities. The unit cell parameters of the experimentally refined powder data for Sc2Ru5B4 are a = 8.4865(2) Å, b = 2.9930(1) Å, c = 9.9714(2) Å, in agreement with the single-crystal refinement.The bulk elemental distribution of Sc2Ru5B4 in the product was also evaluated by analyzing the backscattered electron (BSE) micrographs. Sample homogeneity is essential for obtaining reliable Vickers microhardness data and should be confirmed before indentation. The polished sample contained the target phase and a minor secondary phase as a lighter region in the BSE. Checking the chemical composition of the backscattered images (Fig. S1a, ESI†) by EDS analysis shows the darker region of the sample is the target phase, Sc2Ru5B4, with an estimated transition metal ratio of Sc1.92(2)Ru5.08(2). Lighter elements like boron are notoriously tricky to analyze by EDS quantitatively; therefore, only the transition metal ratios have been estimated here.50 The lighter regions of the sample appear to correspond to a binary Ru–B phase.
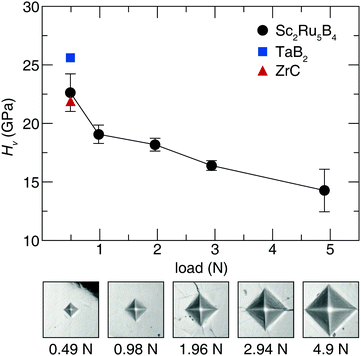
Acquiring the applied load hardness curve is necessary to capture the relationship between composition and hardness, which provides insight into the indentation size effect of this phase.51 Therefore, Vickers microindentation measurements were performed at five applied loads. The hardness values for Sc2Ru5B4, plotted in Fig. 2, indicate the material is reasonably hard with an HV of 23(2) GPa at 0.49 N applied load. The hardness then decreases ≈40% from 0.49 N load to 4.9 N load. This response is comparable with most Vickers hardness measurements in accordance with the indentation size effect.23,52 The hardness of Sc2Ru5B4, although not superhard, is comparable to industry-standard materials like ZrC53 and TaB2,54 which have HV values of ≈22 GPa and ≈26 GPa, respectively, at 0.49 N. Given the reasonably impressive mechanical properties of this phase with the comparatively lighter elements, applying chemical substitution through solid solution formation could be viable for enhancing the hardness of this material following the conventional understanding of hardness in borides.2
Improving the hardness in Sc2(Ru5−xOsx)B4via solid solution
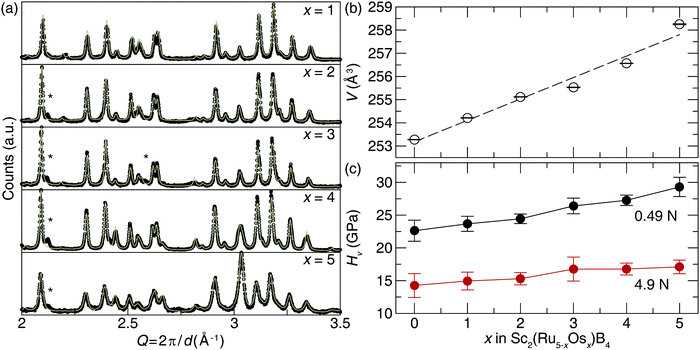
Transition metals with higher electron density can be incorporated into Sc2Ru5B4 to produce solid solutions with enhanced hardness following traditional design rules. Substituting Ru atoms with isovalent Os atoms following Sc2(Ru5−xOsx)B4 (x = 1–5) was achieved by arc melting the appropriate ratios of elements to increase the electron density. The refined powder X-ray diffractograms, plotted in Fig. 3a, demonstrate that when x = 1, 2, and 3, the product was obtained nearly phase pure with minor unidentified impurities. Further increasing the Os content in Sc2(Ru5−xOsx)B4 (x = 4 and 5) resulted in the formation of the target phase and small peaks indexing to Os and other minor unidentified impurities. Refinements of all five products show they are isostructural with Sc2Ru5B4, while substituting Ru atoms for larger Os atoms increases the lattice parameters shifting the diffraction peaks to lower Q-spacing. This trend is confirmed by plotting the refined unit cell volume, which shows a linear increase in volume following Vegard's law (Fig. 3b).Sample homogeneity and elemental composition of Sc2(Ru5−xOsx)B4 were again determined by analyzing the BSE micrographs. The metallic ratios were obtained via EDS have nominal compositions of Sc2.53(3)Ru3.70(1)Os0.77(4), Sc2.5(1)Ru2.8(1)Os1.7(4), Sc2.48(4)Ru1.90(3)Os2.62(3), Sc2.3(2)Ru0.9(1)Os3.8(1), and Sc2.4(2)Os4.6(2). Although there are small inconsistencies between the experimental and nominal loaded transition metal ratios, the semi-quantitative analysis supports the incorporation of Os as desired. EDS analysis of the Sc2(RuOs4)B4 and Sc2Os5B4 samples reveal the presence of Ru-rich secondary phases—Sc0.8(1)Ru3.8(2)Os1.0(1) and Sc1.0(1)Ru1.4(2)Os1.3(1) in Sc2(Ru4Os)B4 and Sc2(Ru3Os2)B4, and an Os-rich secondary phase of Sc3.1(1)Ru1.0(2)Os4.4(2) in Sc2(Ru2Os3)B4. There are also Os inclusions in both samples. Nevertheless, large regions of the target phases in all samples are present, allowing indentation measurements. Fig. 3c shows the resulting Vickers microindentation measurements for the solid solutions Sc2(Ru5−xOsx)B4 at 0.49 and 4.9 N loads. The hardness increases as Os content increases for both applied loads. At high load the Vickers microhardness increases moderately from 14.3(2) GPa at x = 0 to 17.1(1) GPa at x = 5. The low load hardness increases nearly 25% with hardness values of 23(2) GPa at x = 0 and 29(1) GPa at x = 5.
These data support that the hardness of Sc2Ru5B4 can be raised by substituting Ru for Os atoms. Substituting isovalent Os for Ru atoms does not affect the overall electronic structure of the compounds. Thus, the observed increase in hardness of the continuous solid solution Sc2(Ru5−xOsx)B4 stems solely from the difference in electron density between the Os and Ru atoms. This design principle is utilized to increase the hardness of various boride systems and is demonstrated here.
Influence of 5d transition metal substitution on vickers hardness of Sc2(Ru5−xTMx)B4
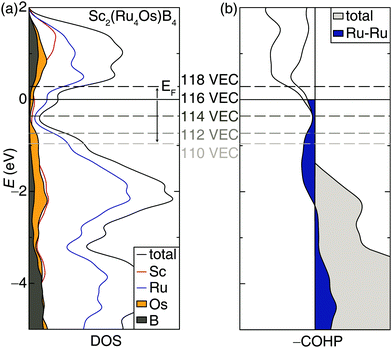
Incorporating elements with high electron density through solid solutions is an accepted design strategy route to increase transition metal borides’ hardness. An alternative electronic-based approach can also be used to increase the hardness.14 Accordingly, the rigid band approximation was used to identify other 5d transition metals that may be substituted into the structure to increase hardness. Analyzing the electronic structure of Sc2(Ru4Os)B4 shows the DOS calculated with DFT, plotted in Fig. 4a, has a significant number of bands crossing the Fermi level supporting metallic behavior. Interestingly, a pseudogap is present just below the Fermi level (EF) and could be accessed to increase phase stability.55 A shift of the EF towards the pseudogap centered at −0.36 eV can be achieved by reducing the valence electron count from 116 VEC to 114 VEC.The changes in chemical bonding character as a function of VEC can also be correlated to mechanical properties.32,33 Analyzing the calculated crystal orbital Hamilton population (−COHP) curves, which decomposes the band-structure energy into pairwise bonding and antibonding contributions, for Sc2(Ru4Os)B4 indicates EF falls in a region dominated by antibonding interactions stemming primarily from the Ru–Ru interactions. Applying the same rigid band approximation shows that reducing the VEC should decrease the occupation of antibonding orbitals, leading to an optimized electron count when VEC ≈ 114.
The desired valence electron counts were experimentally obtained by synthesizing Sc2(Ru4TM)B4 (TM = Ta, W, Re, and Ir) with the specific transition metals used to vary the VEC. Fig. 5 illustrates that all compounds, except Sc2(Ru4Ta)B4, are nearly phase pure based on powder X-ray diffraction with only minor unidentified peaks. Refining the X-ray diffractograms using the Le Bail method confirms that the solid solutions are all isostructural to the Sc2Ru5B4 parent phase. The refined lattice parameters are provided in Table S4 (ESI†). The TM solubility limit was found to be near 20% for these 5d transition metals; every attempt to increase the transition metal concentration beyond x = 1 resulted in discernable impurity peaks in their corresponding diffractograms. Examining the BSE (Fig. S1b–f, ESI†) and resulting EDS data revealed the nominal transition metal ratios for each solid solution as Sc2.38(4)Ru4.3(1)Ta0.37(4), Sc2.44(3)Ru3.8(1)W0.8(1), Sc2.52(3)Ru3.79(2)Re0.69(4), and Sc2.50(2)Ru3.9(1)Ir0.6(1). Despite the minor discrepancies between the experimental and nominal loaded transition metal ratios, the refined diffractograms in combination with EDS results verify that 5d transition metals can be substituted into Sc2Ru5B4 without the emergence of significant secondary phases, except for when TM = Ta. The electronic structure supports the synthetic challenges associated with preparing Sc2(Ru4Ta)B4 as a pure phase material. The Fermi level of Sc2(Ru4Ta)B4 falls below the pseudogap on a large shoulder in the DOS, suggesting electronic instabilities for this composition. Thus, the VEC of 110 corresponds to the lower substitution limit in Sc2(Ru4TM)B4.
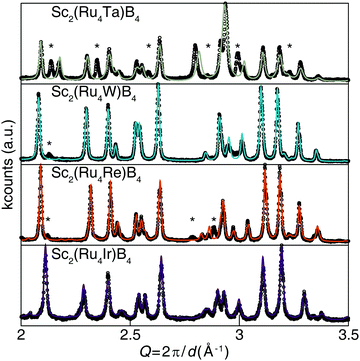 | ||
| Fig. 5 Powder X-ray diffractograms of the solid solution Sc2(Ru4TM)B4 (TM = Ta, W, Re, and Ir) and the associated Le Bail refinements. | ||
The Vickers hardness data, plotted in Fig. 6, was determined for Sc2(Ru4TM)B4 (TM = Ta, W, Re, and Ir). The Sc2(Ru4TM)B4 hardness first increases at low applied load, going from Os to Re. This follows the reduction of the VEC to 114 and placing EF in the minimum of the pseudogap. It also corresponds with a reduction in the number of occupied antibonding interactions within the crystal structure. Further reducing the VEC by substituting W into the structure shows virtually no change in the HV stemming from a similar electronic structure between TM = Re and TM = W. The percent loss in hardness going from Sc2(Ru4Re)B4 to Sc2(Ru4Ta)B4, however, is ≈21%. On the other side, a similar drop in hardness of ≈26% is also observed from Sc2(Ru4Re)B4 to Sc2(Ru4Ir)B4. The significant drop in hardness in these compounds can be related to the expected Fermi level position moving from a deep pseudogap for Sc2(Ru4Re)B4 to shoulders in the DOS for Sc2(Ru4Ta)B4 and Sc2(Ru4Ir)B4. Moreover, when TM = Ir, even more electrons are in the system populating antibonding orbitals. These data confirm that the hardness of Sc2Ru5B4 can be increased by tuning its electronics through 5d transition metal substitution.
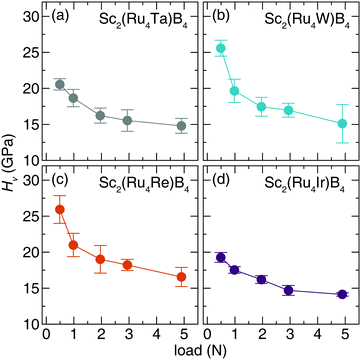 | ||
| Fig. 6 Vickers microindentation measurements of (a) Sc2(Ru4Ta)B4 (b) Sc2(Ru4W)B4. (c) Sc2(Ru4Re)B4 (d) Sc2(Ru4Ir)B4 from low (0.49 N) load to high load (4.9 N). | ||
Furthermore, the Vicker's microhardness of Sc2(Ru5−xTMx)B4 (TM = Ru, Re, and Os) can be compared to the hardness of previously reported borides, shown in Table 1. This analysis focuses particularly on systems with a similar boron content, providing context for the experimental data reported here and illustrating the diversity of mechanical responses in borides. For instance, the hardness of WB4 at 0.49 N and the solid solutions Zr0.5W0.5B4 and W0.93Ta0.02Cr0.05B4 far exceed the measured hardness values of Sc2(Ru5−xTMx)B4. Sc2Os5B4 still has a higher hardness than many other reported ternary tetraborides. In fact, the hardness of Sc2(Ru5−xTMx)B4 at 0.49 N load lies between the softest (ErRh4B4) and hardest (YCrB4) ternary tetraborides, which have a hardness of ≈11 GPa and ≈38 GPa at 0.98 N and 0.49 N loads, respectively. These results demonstrate that Sc2(Ru5−xTMx)B4 has reasonably high hardness values compared to other ternary tetraborides and reaffirms the capability to discover hard borides in the ternary phase space.
Correlating hardness and shear stress of Sc2(Ru4TM)B4
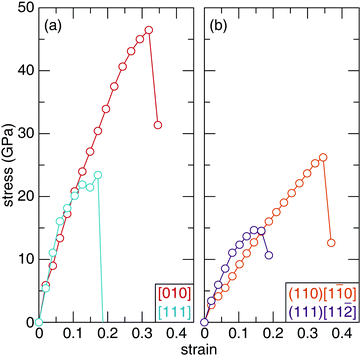
The structural-mechanical properties of Sc2Ru5B4 and Sc2(Ru4TM)B4 (TM = Ta, W, Re, Os, and Ir) were further investigated using ab initio stress–strain calculations to understand the evolution of the materials’ response. Stress–strain evaluating various crystallographic directions and planes under tensile and shear strain curves illustrate the relationship between stress and strain by gradually increasing the deforming force (stress) on the sample until failure (strain).62The uniaxial tensile stress–strain curve for the highest and lowest stress symmetry directions of Sc2Ru5B4 are visualized in Fig. 7a. The observed stress varies as the crystal structure is strained along different crystallographic orientations. The anisotropic response to tension coincides with the anisotropy observed in the orthorhombic crystal structure of Sc2Ru5B4. Upon the initial deformation, the tensile stress–strain curves experience a brief, near-linear increase until 0.1 strain. As the applied strain is increased, the stress in both directions begins to vary. For example, the lowest stress that Sc2Ru5B4 can withstand occurs along the [111] direction, which reaches a maximum of ≈23 GPa at 0.17 strain. The highest tensile strength occurs for the [010] direction reaching ≈46.5 GPa at 0.32 strain. These data resemble the general expected trend for tensile stress–strain curves of polycrystalline materials.63 The complete tensile strength calculations for Sc2Ru5B4 are provided in Table S5 (ESI†).
The mechanical behavior of Sc2Ru5B4 was also evaluated under uniaxial shear stress for 26 different crystallographic slip planes. Since Vickers hardness indentations are governed by plastic rather than elastic deformation, the irreversible motion of atoms occurs via shear stress.64 The weakest slip systems correspond to the failure of a material and thus, can be correlated to the experimental Vickers microhardness.65 The complete shear strength calculations for Sc2Ru5B4 are provided in Table S6 (ESI†). The weakest shear stress in Sc2Ru5B4, shown in Fig. 7b, occurs for the (111)[11![[2 with combining macron]](https://www.rsc.org/images/entities/char_0032_0304.gif) ] slip plane with the stress of ≈15 GPa at 0.14 strain. Conversely, the strongest shear strength is achieved for the (110)[1
] slip plane with the stress of ≈15 GPa at 0.14 strain. Conversely, the strongest shear strength is achieved for the (110)[1![[1 with combining macron]](https://www.rsc.org/images/entities/char_0031_0304.gif) 0] slip plane with a value of ≈26 GPa at 0.35 strain. To put these values into perspective, the softest shear stress of OsB2 is 9.2 GPa at 0.2 strain in the (001)[100] direction.66 Both OsB2 and Sc2Ru5B4 have relatively similar shear stress and thus, should have similar mechanical properties. Indeed, both compounds are considered hard materials with Vickers hardness within the standard deviation of one another.67
0] slip plane with a value of ≈26 GPa at 0.35 strain. To put these values into perspective, the softest shear stress of OsB2 is 9.2 GPa at 0.2 strain in the (001)[100] direction.66 Both OsB2 and Sc2Ru5B4 have relatively similar shear stress and thus, should have similar mechanical properties. Indeed, both compounds are considered hard materials with Vickers hardness within the standard deviation of one another.67
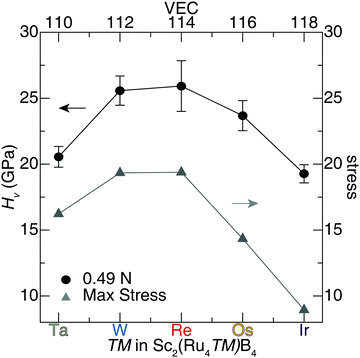
A similar analysis can be applied to the calculated uniaxial shear stress–strain curves for Sc2(Ru4TM)B4. The maximum shear stress of the softest shear slip system for each solid solution and their corresponding hardness values are plotted in Fig. 8. The complete results for shear stress of the solid solution Sc2(Ru4TM)B4 are compiled in Tables S7–S11 (ESI†). These shear stress–strain calculations indicate that the solid solution Sc2(Ru4Re)B4 achieves the highest stress of the weakest slip system along the (100)[011], which has ideal stress of ≈19 GPa at 0.16 strain. Moreover, the observed shear stress of Sc2(Ru4W)B4 for the (010)[![[1 with combining macron]](https://www.rsc.org/images/entities/char_0031_0304.gif) 00] is nearly identical to Sc2(Ru4Re)B4 with a <1% difference. Any additional variation to the transition metal in Sc2(Ru4TM)B4 (i.e., TM = Ta, Os, Ir) will result in a significant drop in stress. For instance, the softest shear plane in Sc2(Ru4Ir)B4 is achieved for the (010)[101] shear slip system with ideal stress of ≈8.9 GPa. Comparing the max stress of the weakest slip system in Sc2Ru5B4 with the shear stress values of Sc2(Ru4TM)B4 indicates the ideal stress of Sc2Ru5B4 is slightly higher than Sc2(Ru4Os)B4 with a ≈3% difference.
00] is nearly identical to Sc2(Ru4Re)B4 with a <1% difference. Any additional variation to the transition metal in Sc2(Ru4TM)B4 (i.e., TM = Ta, Os, Ir) will result in a significant drop in stress. For instance, the softest shear plane in Sc2(Ru4Ir)B4 is achieved for the (010)[101] shear slip system with ideal stress of ≈8.9 GPa. Comparing the max stress of the weakest slip system in Sc2Ru5B4 with the shear stress values of Sc2(Ru4TM)B4 indicates the ideal stress of Sc2Ru5B4 is slightly higher than Sc2(Ru4Os)B4 with a ≈3% difference.
An assessment of the weakest slip systems for each solid solution shows that when TM = Ta, W, Re, or Ir, the softest planes occur along the faces of the unit cells. The weakest planes occur along the body diagonal for the isovalent compounds, Sc2(Ru4Os)B4 and Sc2Ru5B4. However, considering the next softest plane for the latter two compositions, the softest planes also reside along a face. The similarity between the softest shear stress planes is expected since these compositions differ by only a low concentration of transition metal atoms. Furthermore, a clear trend is observed for the calculated shear stress of the solid solution Sc2(Ru4TM)B4, such that the maximum stress increases with transition metal substitution from Ta to Re in Sc2(Ru4TM)B4 and then experiences a significant drop from Re to Ir substitution. This trend is also evident in the experimental hardness values of Sc2(Ru4TM)B4, where the hardness decreases as you shift away from the ideal composition, Sc2(Ru4Re)B4. Although shear stress values are slightly lower than anticipated, an apparent correlation emerges between the maximum stress of Sc2(Ru4TM)B4 and their corresponding Vickers hardness. These results reinforce the capability to predict relative experimental hardness values of solid solutions by calculating shear stress–strain curves via DFT.
Conclusions
In summary, combining computational modeling with experimental methods remains a viable option for strengthening the hardness of a material. Sc2Ru5B4 is ideal to evaluate such an approach because of the versatile crystal chemistry inherent in this phase. Vickers microhardness measurements establish that Sc2Ru5B4 is a hard material and that its hardness can be increased by substituting Ru atoms for Os. This somewhat expected result follows conventional design rules for hard materials where the increasing electron density of a system should improve the mechanical properties. This work also shows that exchanging Os for a different 5d transition metal can also increase the material's hardness. The rationale behind these results is elucidated by analyzing a DFT-generated DOS curve of Sc2(Ru4Os)B4. The Fermi level of Sc2(Ru4Os)B4 lies on a disadvantageous peak, and a bonding analysis reveals the occupation of antibonding metal–metal contacts. Modulating the composition to access a more energetically favorable pseudogap by tuning the VEC results in improved hardness. Moreover, analyzing DFT calculated shear stress–strain curves reaffirms the capability to approximate general trends of the experimental hardness of Sc2(Ru4TM)B4. The approach developed in this work confirms that manipulating the position of the Fermi level is a practical technique to enhance the hardness of materials, especially when combined with classical consideration of materials development and reinforces the importance of validating computational modeling with experimental results.Conflicts of interest
There are no conflicts to declare.Acknowledgements
The authors gratefully acknowledge the generous financial support provided by the University of Houston Division of Research through a High Priority Area Research Seed Grant. Additional support was provided by the Welch Foundation (E-1981) and the Texas Center for Superconductivity at the University of Houston (TcSUH).References
- R. W. Cumberland, M. B. Weinberger, J. J. Gilman, S. M. Clark, S. H. Tolbert and R. B. Kaner, Osmium Diboride, An Ultra-Incompressible, Hard Material, J. Am. Chem. Soc., 2005, 127, 7264–7265 CrossRef CAS PubMed.
- M. T. Yeung, R. Mohammadi and R. B. Kaner, Ultraincompressible, Superhard Materials, Annu. Rev. Mater. Res., 2016, 46, 465–485 CrossRef CAS.
- N. Kalfagiannis, G. Volonakis, L. Tsetseris and S. Logothetidis, Excess of Boron in TiB2 Superhard Thin Films: A Combined Experimental and Ab Initio Study, J. Phys. D: Appl. Phys., 2011, 44, 1–7 CrossRef.
- F. W. Vahldiek, Electrical Resistivity, Elastic Modulus, and Debye Temperature of Titanium Diboride, J. Less-Common Met., 1967, 12, 202–209 CrossRef CAS.
- L. Bsenko and T. Lundstrom, The High-Temperature Hardness of ZrB2 and HfB2, J. Less-Common Met., 1974, 34, 273–278 CrossRef CAS.
- H. Chung, M. B. Weinberger, J. B. Levine, A. Kavner, J. Yang, S. H. Tolbert and R. B. Kaner, Synthesis of Ultra-Incompressible Superhard Rhenium Diboride at Ambient Pressure, Science, 2007, 316, 436–439 CrossRef CAS PubMed.
- N. Dubrovinskaia, L. Dubrovinsky and V. L. Solozhenko, Comment on Synthesis of Ultra-Incompressible Superhard Rhenium Diboride at Ambient Pressure, Science, 2007, 318, 1550d CrossRef PubMed.
- R. Mohammadi, A. T. Lech, M. Xie, B. E. Weaver, M. T. Yeung, S. H. Tolbert and R. B. Kaner, Tungsten Tetraboride, An Inexpensive Superhard Material, Proc. Natl. Acad. Sci. U. S. A., 2011, 108, 10958–10962 CrossRef CAS PubMed.
- J. B. Levine, S. H. Tolbert and R. B. Kaner, Advancements in the Search for Superhard Ultra-Incompressible Metal Borides, Adv. Funct. Mater., 2009, 19, 3519–3533 CrossRef CAS.
- G. Akopov, M. T. Yeung and R. B. Kaner, Rediscovering the Crystal Chemistry of Borides, Adv. Mater., 2017, 29, 1–29 CrossRef PubMed.
- Y. B. Kuz’ma, N. S. Bilonizhko, S. I. Mykhalenko, G. F. Stepanchikova and N. F. Chaban, The Interaction of Transition and Rare Earth Metals with Boron, J. Less Common Met, 1979, 67, 51–57 CrossRef.
- G. Akopov, L. E. Pangilinan, R. Mohammadi and R. B. Kaner, Perspective: Superhard Metal Borides: A look Forward, APL Mater., 2018, 6, 1–6 Search PubMed.
- M. Xie, R. Mohammadi, C. L. Turner, R. B. Kaner, A. Kavner and S. H. Tolbert, Exploring Hardness Enhancement in Superhard Tungsten Tetraboride-Based Solid Solutions Using Radial X-Ray Diffraction, Appl. Phys. Lett., 2015, 107, 1–5 Search PubMed.
- A. M. Tehrani and J. Brgoch, Hard and Superhard Materials: A Computational Perspective, J. Solid State Chem., 2019, 271, 47–58 CrossRef.
- C. T. Liu, C. L. White and J. A. Horton, Effect of Boron on Grain-Boundaries in Ni3Al, Acta Metall., 1985, 33, 213–229 CrossRef CAS.
- A. T. Lech, C. L. Turner, J. Lei, R. Mohammadi, S. H. Tolbert and R. B. Kaner, Superhard Rhenium/Tungsten Diboride Solid Solutions, J. Am. Chem. Soc., 2016, 138, 14398–14408 CrossRef CAS PubMed.
- J. Gild, Y. Zhang, T. Harrington, S. Jiang, T. Hu, M. C. Quinn, W. M. Mellor, N. Zhou, K. Vecchio and J. Luo, High-Entropy Metal Diborides: A New Class of High-Entropy Materials and a New Type of Ultrahigh Temperature Ceramics, Sci. Rep., 2016, 6, 1–10 CrossRef PubMed.
- J.-W. Yeh, S. K. Chen, S.-J. Lin, J.-Y. Gan, T.-S. Chin, T.-T. Shun, C.-H. Tsau and S.-Y. Chang, Nanostructured High-Entropy Alloys with Multiple Principal Elements: Novel Alloy Design Concepts and Outcomes, Adv. Eng. Mater., 2004, 6, 299–303 CrossRef CAS.
- Y. Zhang, T. T. Zuo, Z. Tang, M. C. Gao, K. A. Dahmen, P. K. Liaw and Z. P. Lu, Microstructures and Properties of High-Entropy Alloys, Prog. Mater. Sci., 2014, 61, 1–93 CrossRef CAS.
- S. W. Xin, X. Shen, C. C. Du, J. Zhao, B. R. Sun, H. X. Xue, T. T. Yang, X. C. Cai and T. D. Shen, Bulk Nanocrystalline Boron-Doped VNbMoTaW High Entropy Alloys with Ultrahigh Strength, Hardness, and Resistivity, J. Alloys Compd., 2021, 853, 1–11 CrossRef.
- G. Akopov, M. T. Yeung, C. L. Turner, R. L. Li and R. B. Kaner, Stabilization of HfB12 in Y1−xHfxB12 Under Ambient Pressure, Inorg. Chem., 2016, 55, 5051–5055 CrossRef CAS PubMed.
- J. F. Cannon and P. B. Farnsworth, High Pressure Synthesis of ThB12 and HfB12, J. Less Common Met, 1983, 92, 359–368 CrossRef CAS.
- Z. Zhang, A. Mansouri Tehrani, A. O. Oliynyk, B. Day and J. Brgoch, Finding the Next Superhard Material through Ensemble Learning, Adv. Mater., 2021, 33, 1–8 Search PubMed.
- Z. Zhang and J. Brgoch, Determining Temperature-Dependent Vickers Hardness with Machine Learning, J. Phys. Chem. Lett., 2021, 12, 6760–6766 CrossRef CAS PubMed.
- H. Niu, S. Niu and A. R. Oganov, Simple and Accurate Model of Fracture Toughness of Solids, J. Appl. Phys., 2019, 125, 1–6 CrossRef.
- E. Mazhnik and A. R. Oganov, A Model of Hardness and Fracture Toughness of Solids, J. Appl. Phys., 2019, 126, 1–11 CrossRef.
- N. Miao, B. Sa, J. Zhou and Z. Sun, Theoretical Investigation on the Transition-Metal Borides with Ta3B4-Type Structure: A Class of Hard and Refractory Materials, Comput. Mater. Sci., 2011, 50, 1559–1566 CrossRef CAS.
- X.-Q. Chen, H. Niu, D. Li and Y. Li, Modeling Hardness of Polycrystalline Materials and Bulk Metallic Glasses, Intermetallics, 2011, 19, 1275–1281 CrossRef CAS.
- A. L. Ivanovskii, Hardness of Hexagonal AlB2-Like Diborides of s, p and d Metals from Semi-Empirical Estimations, Int. J Refract. Hard, 2013, 36, 179–182 CrossRef CAS.
- Y. Wang, J. Lv, L. Zhu and Y. Ma, CALYPSO: A Method for Crystal Structure Prediction, Comput. Phys. Commun., 2012, 183, 2063–2070 CrossRef CAS.
- X. Zhang, Y. Wang, J. Lv, C. Zhu, Q. Li, M. Zhang, Q. Li and Y. Ma, First-Principles Structural Design of Superhard Materials, J. Chem. Phys., 2013, 138, 1–9 Search PubMed.
- J. P. Scheifers, R. D.-T. Nguyen, Y. Zhang and B. P. T. Fokwa, Direct Correlation of Mechanical Hardness and Chemical Bonding in Intermetallic Double Perovskite Borides Sc2Ir6−xPdxB, J. Phys. Chem. C, 2020, 124, 26062–26067 CrossRef CAS.
- J. Zhang, A. M. Tehrani and J. Brgoch, Tailoring the Mechanical Properties of Earth-Abundant Transition Metal Borides via Bonding Optimization, J. Phys. Chem. C, 2020, 124, 4430–4437 CrossRef.
- P. Rogl, The Crystal Structure of Sc2Ru5B4, J. Solid State Chem., 1984, 55, 262–269 CrossRef CAS.
- L. P. Salamakha, O. Sologub, B. Stöger, P. F. Rogl, M. Waas, V. B. Kapustianyk and E. Bauer, ScRu2B3 and Sc2RuB6: Borides Featuring a 2D Infinite Boron Clustering, Inorg. Chem., 2017, 56, 10549–10558 CrossRef CAS PubMed.
- G. M. Sheldrick, TWINLABS. University of Göttingen, Göttingen, Germany, 2008 Search PubMed.
- C. B. Hubschle, G. M. Sheldrick and B. Dittrich, ShelXle: A Qt Graphical User Interface for SHELXL, J. Appl. Cryst., 2011, 44, 1281–1284 CrossRef PubMed.
- B. H. Toby, EXPGUI, A Graphical User Interface for GSAS, J. Appl. Cryst., 2001, 34, 210–213 CrossRef CAS.
- B. H. Toby and R. B. Von Dreele, GSAS-II: The Genesis of a Modern Open-Source All Purpose Crystallography Software Package, J. Appl. Crystallogr., 2013, 46, 544–549 CrossRef CAS.
- K. Momma and F. Izumi, VESTA 3 For Three-Dimensional Visualization of Crystal, Volumetric and Morphology Data, J. Appl. Crystallogr., 2011, 44, 1272–1276 CrossRef CAS.
- G. Kresse and J. Furthmuller, Efficient Iterative Schemes for Ab Initio Total-Energy Calculations Using a Plane-Wave Basis Set, Phys. Rev. B: Condens. Matter Mater. Phys., 1996, 54, 169–186 CrossRef PubMed.
- G. Kresse and D. Joubert, From Ultrasoft Pseudopotentials to the Projector Augmented-Wave Method, Phys. Rev. B: Condens. Matter Mater. Phys., 1999, 59, 1758–1775 CrossRef CAS.
- P. E. Blochl, Projector Augmented-Wave Method, Phys. Rev. B: Condens. Matter Mater. Phys., 1994, 50, 17953–17979 CrossRef PubMed.
- J. P. Perdew, Density Functional Theory and the Band Gap, Int. J. Quantum Chem., 1985, 28, 497–523 CrossRef.
- H. J. Monkhorst and J. D. Pack, Special Points for Brillouin-Zone Integrations, Phys. Rev. B: Condens. Matter Mater. Phys., 1976, 13, 5188–5192 CrossRef.
- A. Togo and I. Tanaka, First Principles Phonon Calculations in Materials Science, Scr. Mater., 2015, 108, 1–5 CrossRef CAS.
- K. Okhotnikov, T. Charpentier and S. Cadars, Supercell Program: A Combinatorial Structure-Generation Approach for the Local-Level Modeling of Atomic Substitutions and Partial Occupancies in Crystals, J. Cheminf., 2016, 8, 1–15 Search PubMed.
- Y. Li, J. Hao, H. Liu, S. Lu and J. S. Tse, High-Energy Density and Superhard Nitrogen-Rich B-N Compounds, Phys. Rev. Lett., 2015, 115, 1–5 Search PubMed.
- M. Zhang, M. Lu, Y. Du, L. Gao, C. Lu and H. Liu, Hardness of FeB4: Density Functional Theory Investigation, J. Chem. Phys., 2014, 140, 174505 CrossRef PubMed.
- B. J. Inkson, Scanning Electron Microscopy (SEM) and Transmission Electron Microscopy (TEM) for Materials Characterization. in Materials Characterization Using Nondestructive Evaluation (NDE) Methods, ed. E., Ltd, 2016, pp. 17–43 Search PubMed.
- G. M. Pharr, E. G. Herbert and Y. Gao, The Indentation Size Effect: A Critical Examination of Experimental Observations and Mechanistic Interpretations, Annu. Rev. Mater. Res., 2010, 40, 271–292 CrossRef CAS.
- J. G. Swadener, E. P. George and G. M. Pharr, The Correlation of the Indentation Size Effect Measured With Indenters of Various Shapes, J. Mech. Phys. Solids, 2002, 50, 681–694 CrossRef.
- S. E. Landwehr, G. E. Hilmas, W. G. Fahrenholtz, I. G. Talmy and S. G. DiPietro, Microstructure and Mechanical Characterization of ZrC–Mo Cermets Produced by Hot Isostatic Pressing, Mater. Sci. Eng., A, 2008, 497, 79–86 CrossRef.
- X. Zhang, G. E. Hilmas and W. G. Fahrenholtz, Synthesis, Densification, and Mechanical Properties of TaB2, Mater. Lett., 2008, 62, 4251–4253 CrossRef CAS.
- P. Ravindran and R. Asokamani, Correlation Between Electronic structure, Mechanical Properties and Phase Stability in Intermetallic Compounds, Bull. Mater. Sci., 1997, 20, 613–622 CrossRef CAS.
- S. Okada and T. Atoda, Preparation of Single Crystals of a New Boride Cr2B3 by the Aluminium-Flux Technique and Some of its Properties, J. Less Common Met, 1985, 113, 331–339 CrossRef CAS.
- G. Akopov, M. T. Yeung, C. L. Turner, R. Mohammadi and R. B. Kaner, Extrinsic Hardening of Superhard Tungsten Tetraboride Alloys with Group 4 Transition Metals, J. Am. Chem. Soc., 2016, 138, 5714–5721 CrossRef CAS PubMed.
- R. Mohammadi, M. Xie, A. T. Lech, C. L. Turner, A. Kavner, S. H. Tolbert and R. B. Kaner, Toward Inexpensive Superhard Materials: Tungsten Tetraboride-Based Solid Solutions, J. Am. Chem. Soc., 2012, 134, 20660–20668 CrossRef CAS PubMed.
- M. Ade and H. Hillebrecht, Ternary Borides Cr2AlB2, Cr3AlB4, and Cr4AlB6: The First Members of the Series (CrB2)nCrAl with n = 1, 2, 3 and a Unifying Concept for Ternary Borides as MAB-Phases, Inorg. Chem., 2015, 54, 6122–6135 CrossRef CAS PubMed.
- T. Shishido, K. Kudou, S. Okada, J. Ye, M. Oku, H. Horiuchi and T. Fukuda, Electrical Resistivity, Oxidation Resistivity and Hardness of Single Crystal Compounds in the Er–Rh–B System, J. Alloys Compd., 1998, 280, 65–70 CrossRef CAS.
- G. Akopov, H. Yin, I. Roh, L. E. Pangilinan and R. B. Kaner, Investigation of Hardness of Ternary Borides of the YCrB4, Y2ReB6, Y3ReB7, and YMo3B7 Structural Types, Chem. Mater., 2018, 30, 6494–6502 CrossRef CAS.
- D. Roylance, Stress–Strain Curves, Massachusetts Institute of Technology Study, Cambridge. 2001 Search PubMed.
- G. N. Haidemenopoulos, Physical Metallurgy: Principles and Design, Taylor & Francis Group, Boca Raton. 2018 Search PubMed.
- J. J. Gilman, Chemistry and Physics of Mechanical Hardness, John Wiley & Sons, Inc., New York, NY USA. 2009 Search PubMed.
- A. M. Tehrani, A. Lim and J. Brgoch, Mechanism for Unconventional Nonlinear Elasticity, Phys. Rev. B: Condens. Matter Mater. Phys., 2019, 100, 1–6 Search PubMed.
- J. Yang, H. Sun and C. Chen, Is Osmium Diboride An Ultra-Hard Material, J. Am. Chem. Soc., 2008, 130, 7200–7201 CrossRef CAS PubMed.
- M. Hebbache, L. Stuparević and D. Živković, A New Superhard Material: Osmium Diboride OsB2, Solid State Commun., 2006, 139, 227–231 CrossRef CAS.
Footnote |
| † Electronic supplementary information (ESI) available. CCDC 2118062 and 2118063. For ESI and crystallographic data in CIF or other electronic format see DOI: 10.1039/d1tc05320e |
| This journal is © The Royal Society of Chemistry 2022 |

