 Open Access Article
Creative Commons Attribution 3.0 Unported Licence
Feasibility of switchable dual function materials as a flexible technology for CO2 capture and utilisation and evidence of passive direct air capture†
Loukia-Pantzechroula
Merkouri
a,
Tomas
Ramirez Reina
 *ab and
Melis S.
Duyar
 *a
*a
aDepartment of Chemical and Process Engineering, University of Surrey, Guildford, GU2 7XH UK. E-mail: m.duyar@surrey.ac.uk; t.ramirezreina@surrey.ac.uk
bDepartment of Inorganic Chemistry and Materials Sciences Institute, University of Seville-CSIC, 41092, Seville, Spain
First published on 11th August 2022
Abstract
The feasibility of a Dual Function Material (DFM) with a versatile catalyst offering switchable chemical synthesis from carbon dioxide (CO2) was demonstrated for the first time, showing evidence of the ability of these DFMs to passively capture CO2 directly from the air as well. These DFMs open up possibilities in flexible chemical production from dilute sources of CO2, through a combination of CO2 adsorption and subsequent chemical transformation (methanation, reverse water gas shift or dry reforming of methane). Combinations of Ni Ru bimetallic catalyst with Na2O, K2O or CaO adsorbent were supported on CeO2–Al2O3 to develop flexible DFMs. The designed multicomponent materials were shown to reversibly adsorb CO2 between the 350 and 650 °C temperature range and were easily regenerated by an inert gas purge stream. The components of the flexible DFMs showed a high degree of interaction with each other, which evidently enhanced their CO2 capture performance ranging from 0.14 to 0.49 mol kg−1. It was shown that captured CO2 could be converted into useful products through either CO2 methanation, reverse water–gas shift (RWGS) or dry reforming of methane (DRM), which provides flexibility in terms of co-reactant (hydrogen vs. methane) and end product (synthetic natural gas, syngas or CO) by adjusting reaction conditions. The best DFM was the one containing CaO, producing 104 μmol of CH4 per kgDFM in CO2 methanation, 58 μmol of CO per kgDFM in RWGS and 338 μmol of CO per kgDFM in DRM.
1. Introduction
Global warming is increasing at an alarming rate, as carbon dioxide (CO2) emissions reached 33 Gt in 2021.1 Efforts, such as the Paris Agreement in 2015, are continuously made in attempt to control greenhouse gas concentrations and thus the extent of global warming,2 while there is a need to achieve net zero CO2 emissions by 2050 and have a substantial decrease in CO2 emissions after 2030.3 A solution to control CO2 emissions is Carbon Capture, Utilisation and Storage (CCUS).4 The current state-of-the-art technologies in terms of CO2 capture include the widely commercialised amine absorption systems.5–8 An alternative to amine absorption is solid adsorption, e.g. metal organic frameworks MOFs, zeolites, and alkali/alkaline oxides/carbonates. During adsorption, CO2 is either chemisorbed or physisorbed onto the adsorbent's surface until breakthrough, or saturation, is reached. The desorption of a concentrated CO2 stream usually occurs via a pressure or temperature swing process.5,9 The CO2 utilisation step involves the use of CO2 to produce added-value chemicals and fuels and is appealing because of the need for carbon in the chemical industry to produce chemicals. Currently CO2 is used mainly in the production of urea (∼160 Mt per year). However, CO2 being a highly stable molecule thermodynamically, catalysts are needed for its conversion into various products.8,10–12As far as the CO2 catalytic upgrading routes are concerned, the dry reforming of methane (DRM),13–15 the reverse water–gas shift (RWGS)16–19 and the CO2 methanation reactions16,20,21 have attracted substantial attention in recent years. In DRM (eqn (1)), two of the most harmful greenhouse gases (CO2 and CH4) react to form syngas, which is a mixture of carbon monoxide (CO) and hydrogen (H2). DRM can be used for biogas upgrading purposes because biogas is mainly a mixture of CO2 and methane (CH4). DRM requires high temperatures and catalysts developed for DRM are susceptible to deactivation via coke formation.8,13 In RWGS (eqn (2)), hydrogen is used to reduce CO2 to CO while producing water as byproduct. CO is an important chemical reagent for industrial chemicals synthesis such as through carbonylation reactions. Careful catalyst design is necessary, to ensure selectivity towards CO and to overcome the competition with the CO2 methanation reaction. H2/CO ratio can be adjusted via the RWGS reaction to increase conversion while yielding a specific mixture of CO and H2 (known as syngas) that can then be used for downstream chemicals production via methanol synthesis or Fischer–Tropsch synthesis.8,10,16,22 CO2 methanation (eqn (3)), which is another CO2 hydrogenation reaction, can be used for the production of CH4, or synthetic natural gas. This reaction attracted a lot of attention both in the 1970s, during the oil crisis, and nowadays, because of its possible use in power to gas schemes. As CO2 methanation is favoured at lower temperatures, active catalysts are needed for overcoming significant kinetic limitations.8,10,23 The aforementioned reactions are presented below.
DRM:
| CO2 + CH4 ⇌ 2CO + 2H2 ΔH298 K = +247 kJ mol−1 | (1) |
RWGS:
| CO2 + H2 ⇌ CO + H2O ΔH298 K = +41 kJ mol−1 | (2) |
CO2 methanation:
| CO2 + 4H2 ⇌ CH4 + 2H2O ΔH298 K = −165 kJ mol−1 | (3) |
The use of Dual Function Materials (DFMs) integrates CO2 capture and utilisation to lower the energy demands, and thus the cost of CCU processes through a process intensification approach.24 They are designed to work in cyclic operation, i.e. in successive CO2 capture and reduction cycles based on a spill over mechanism.25–27 DFMs are able to capture the CO2 from a flue gas stream or air and then to catalyse it to produce various chemicals based on the co-reactant used. The most studied catalytic materials are the noble metals, like ruthenium (Ru) and rhodium (Rh) due to their increased catalytic activity in the DRM, RWGS and CO2 methanation reactions. However, their high cost can be prohibitive and efforts are made to use cheaper, but highly active materials, such as nickel (Ni). The most studied reaction for the DFMs application to date is CO2 methanation.28–31 This reaction offers an isothermal solution to the DFMs system because the exothermicity of the CO2 methanation can supply the required heat for the CO2 desorption and its spill-over onto the catalytic sites.24,27,32 The development of DFMs in the RWGS and DRM is still in its infancy, but several studies in RWGS33–37 and DRM38–41 have shown potential and are worthy of notice because the DFMs overcome their current limitations. A comprehensive summary of all DFMs studied can be found in some recent reviews.28–31,42
In our previous study, we examined the feasibility of using a switchable catalyst to catalyse the CO2 methanation, RWGS, and DRM reactions that offers flexibility in terms of CO2 utilisation in a changing energy landscape,43 while other studies exist in literature.44,45 It was shown that a combination of Ni and Ru onto a ceria oxide–alumina oxide support (CeO2–Al2O3) was able to efficiently catalyse all three reactions (“switching” between them) by simply changing the reaction conditions, i.e. the co-reactant and the temperature. Herein, we present the flexible DFMs, which combine one of three adsorbents (Na2O, K2O or CaO) with the Ni–Ru switchable catalyst. This study is the proof of concept for switchable DFMs. CeO2 was used as a support in combination with the widely used in DFMs Al2O3 due to its excellent redox properties and its important role in the CO2 adsorption and conversion to various products.43,44,46,47 The addition of Ru to Ni was chosen due to its ease of transformation between its oxides and metallic species which is carried out at low temperatures and is helpful when CO2 capture is performed in a realistic oxidising environment. Their combination has also been effective to enable product versatility since their strong interaction leads to electronically rich surfaces which are active sites for reactants activation.43,44
The switchable DFMs system integrates the benefits of DFMs, as described earlier, with switchable catalysts. The flexibility in chemical synthesis offers a solution to the changing energy sector in the near-term future and resilience against the fluctuation in the supply and demand of chemicals. It is known that there is a seasonal and annual demand change; for example, methane is currently used for residential heating in the winter, but hydrogen is considered for use as residential fuel in the future.48 Flexible DFMs allow versatile process designs that can work in different modes. For instance, synthetic natural gas may be produced when excess renewable electricity exists or when more heating is needed during winter, while by simply changing the reactor conditions, syngas or CO may be produced to act as a building block in the chemical industry for the production of dimethyl ether, urea, methanol and hydrocarbons. Herein we demonstrate the feasibility of switchable DFMs for the first time, while exploring the adsorption of CO2 at different temperatures and evaluating the design principles needed to develop DFMs for switchable operation.
2. Experimental
2.1. Dual function materials synthesis
The three DFMs of this study were prepared by sequential impregnation. The adsorbents were impregnated onto the CeO2–Al2O3 support and then, the two transition metals, Ni and Ru, were impregnated onto the supported adsorbents, as it was previously shown that impregnating metals on adsorbents resulted in better DFMs performance.24Table 1 shows the designed materials composition and the abbreviations used in this work.| Material | Abbreviation | Catalyst loading (wt%) | Adsorbent loading (wt%) |
|---|---|---|---|
| Na2O/CeO2–Al2O3 | Na | — | 11.9 wt% Na2O |
| K2O/CeO2–Al2O3 | K | — | 11.9 wt% K2O |
| CaO/CeO2–Al2O3 | Ca | — | 11.9 wt% CaO |
| Ni–Ru/CeO2–Al2O3 | NiRu | 15 wt% Ni, 1 wt% Ru | — |
| Ni–Ru, Na2O/CeO2–Al2O3 | NiRuNa | 15 wt% Ni, 1 wt% Ru | 10 wt% Na2O |
| Ni–Ru, K2O/CeO2–Al2O3 | NiRuK | 15 wt% Ni, 1 wt% Ru | 10 wt% K2O |
| Ni–Ru, CaO/CeO2–Al2O3 | NiRuCa | 15 wt% Ni, 1 wt% Ru | 10 wt% CaO |
Supported adsorbents were prepared by initially mixing the required amounts of the CeO2–Al2O3 support (SCFa-160 Ce20 Puralox, Sasol) and NaNO3 (Fluka), KNO3 (Sigma Aldrich), and Ca(NO3)2·4H2O (Sigma Aldrich) with deionised water. The suspensions were then mixed at room temperature with a magnetic stirrer and the excess water was removed in a rotary evaporator under reduced pressure. Afterwards, they were dried overnight at 120 °C and calcined at 400 °C for 4 hours (5 °C min−1). The resulting supported adsorbents were the Na2O/CeO2–Al2O3, K2O/CeO2–Al2O3, and CaO/CeO2–Al2O3.
A similar impregnation procedure was performed when synthesising the three DFMs. The required amounts of Ni(NO3)2·6H2O (Acros Organics) and Ru(NO)(NO3)3 solution (1.5 w/v Ru, Alfa Aesar) were mixed with the supported adsorbents in order to obtain 15 wt% Ni and 1 wt% Ru. These were mixed with excess deionised water, which was then removed in a rotary evaporator under reduced pressure, dried overnight at 120 °C, and calcined at 500 °C for 3 hours (5 °C min−1). The amount of adsorbent precursor used for the supported adsorbents was adjusted to give a final DFMs loading of 10 wt% of the respective oxides and so the resulting supported adsorbents had 11.9 wt% Na2O, K2O, and CaO. Therefore, the prepared DFMs were the 15 wt% Ni, 1 wt% Ru–10 wt% Na2O/CeO2–Al2O3, the 15 wt% Ni, 1 wt% Ru–10 wt% K2O/CeO2–Al2O3, and the 15 wt% Ni, 1 wt% Ru–10 wt% CaO/CeO2–Al2O3. In some experiments, the 15 wt% Ni, 1 wt% Ru/CeO2–Al2O3 switchable catalyst, whose synthesis method was described in,43 was used as a reference material so as to show the impact of the addition of the adsorbents. In order for the supported adsorbents to have the same heat treatment as DFMs, they were recalcined at 500 °C for 3 hours (5 °C min−1). For the sake of simplicity, the supported adsorbents were called Na, K, and Ca, the DFMs, NiRuNa, NiRuK, and NiRuCa, and the switchable catalyst NiRu.
2.2. Characterisation
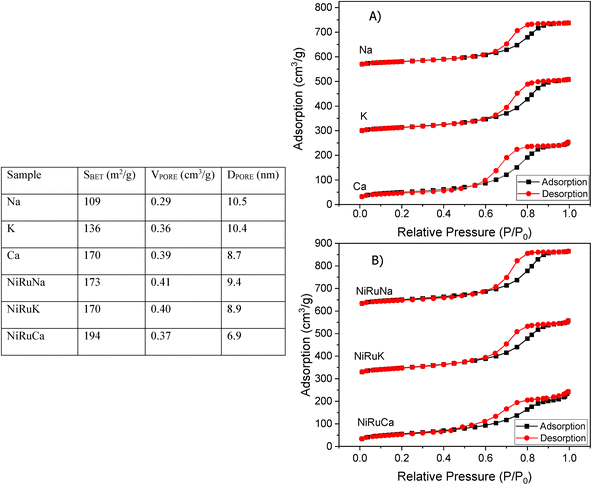
The Brunauer–Emmett–Teller (BET) equation and the Barett–Joyner–Halenda (BJH) methods were used to obtain the specific surface area and pore volume of the materials. Initially, degassing at 250 °C in vacuum for 4 hours took place and then, the textural properties of the materials were determined by nitrogen adsorption–desorption measurements at −195 °C in a Micrometrics 3Flex apparatus.X-ray Diffraction (XRD) was performed on fresh supported adsorbents and on fresh, reduced, and spent DFMs in a X'Pert Powder from PANalytical apparatus. The diffraction patterns were obtained at 30 mA and 40 kV by using Cu Kα radiation (λ = 0.154 nm). The 2θ° angle was increased every 450 seconds by 0.05° in the range of 10–90°.
Scanning Electron Microscopy (SEM) was carried out on the fresh supported adsorbents and DFMs by using a JEOL JSM-7100F instrument, which also had an Energy Dispersive X-ray Spectroscope (EDS) analyser. Carbon paint was used to fix the samples to the holder and gold coating was conducted to eliminate the charging effects.
Transmission Electron Microscopy (TEM) was carried out on the reduced DFMs in a Talos F200I instrument from ThermoFisher with an electron source of 200 kV. The DFMs were reduced ex situ at 800 °C for 1 hour at a 50 ml min−1 total flow rate of a 10% H2/N2 mixture. To prepare the TEM samples, the materials were dispersed in ethanol in an ultrasonic bath, dropped onto copper grids coated with lacey carbon film and dried. Prior to sample insertion in the instrument, the specimen holder with the sample was dried in a UV furnace.
H2-Temperature Programmed Reduction (H2-TPR) was performed on the fresh (after calcination) DFMs in fixed bed quartz reactor. The data were logged by using the Quadera software package and the H2 consumption was observed in an online mass spectrometer (Omni-Star GSD 320). A 10% H2/Ar mixture with a total flow of 50 ml min−1 was passed through the reactor with 50 mg of sample while the temperature was raised from room temperature to 950 °C with 10 °C min−1 rate.
CH4-Temperature Programmed Surface Reaction (CH4-TSPR) was conducted on the fresh NiRuCa sample in a fixed bed reactor similar to H2-TPR experiments. In this experiment, 30 mg of fresh (after calcination) NiRuCa was used and the temperature was increased from room temperature to 950 °C (10 °C min−1) with a pure CH4 feed of 30 ml min−1. No N2 was used in the feed in order the mass to charge ratio (m/z) of 28 to be solely attributed to CO.
CO2-Temperature Programmed Desorption (CO2-TPD) was carried out on fresh DFMs and adsorbents in a fixed bed quartz reactor. In the CO2-TPD experiments, 50 mg of sample were initially reduced in situ at 800 °C for 1 hour with a 10% H2/N2 mixture and a total flow of 50 ml min−1 (10 °C min−1). After cooling down to 40 °C with a N2 purge, a 50 ml min−1 flow of a 10% CO2/N2 mixture was used for 45 minutes to saturate the samples. Subsequently, 50 ml min−1 of N2 was introduced through the reactor to remove the weakly adsorbed CO2 for 30 minutes and, finally, the temperature was raised to 800 °C at a 10 °C min−1 rate. The mass to charge ratio (m/z) of 44 corresponding to CO2 was recorded using an online mass spectrometer (Omni-Star GSD 320) during the temperature ramp.
Thermogravimetric Analysis (TGA) was performed on the reduced and post-reaction DFMs in an SDT650 apparatus from TA Instruments in order to measure the amount of carbon depositions. A flow of 100 mL min−1 of air was employed while the temperature was raised from room temperature to 950 °C at a 10 °C min−1 rate.
2.3. Performance testing
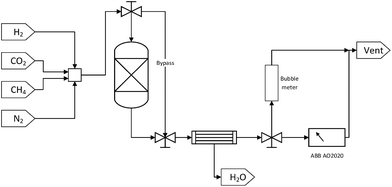
Each DFM was tested for methanation, RWGS and DRM applications in that order. Initially, 250 mg of sample were reduced in situ at 800 °C for 1 hour at a 50 ml min−1 total flow rate of a 10% H2/N2 mixture (10 °C min−1). Then, the temperature was decreased to 350 °C with a N2 purge stream in order to perform a cycle of CO2 capture-N2 purge-CO2 methanation. The CO2 capture step was performed in the ‘reactor’ mode with a 10% CO2/N2 mixture of 50 ml min−1 total flow rate for 20 minutes. After the 20 minutes had elapsed, a 10 minute N2 purge step was carried out, resulting in the removal of the weakly adsorbed CO2 and ensuring no cross-mixing of CO2 and H2. This purge step was continued until a zero CO2 reading in the gas analyser was obtained so as to demonstrate that the produced gases were formed from the captured CO2. Subsequently, in the ‘bypass’ mode, a mixture containing 10% of H2 in N2 was introduced through the system until its reading in the analyser was stabilised and then the stream was switched to pass through the reactor. This constituted the reaction step which was performed for 20 minutes. Once the CO2 capture-N2 purge-CO2 methanation cycle was carried out at 350 °C, the temperature was increased to 650 °C at a 10 °C min−1 rate. A cycle of CO2 capture-N2 purge-RWGS and a cycle of CO2 capture-N2 purge-DRM followed as described above, but in the case of DRM, CH4 instead of H2 was used as co-reactant. A N2 purge step was also used following the CO2 methanation reaction and prior to the heating-up step for 10 minutes, as well as after the RWGS reaction and before the CO2 capture step in order to obtain zero readings in the gas analyser.
It is worth noting that the N2 flow remained the same throughout the experiment as in all the CO2 capture and reaction steps, making up 90% of the feed mixture in every case. The exact flow rate of N2 (i.e. 45 mL min−1) was measured at the beginning of the experiment so that it could be used as internal standard. This meant that when the total flow rates in CO2 capture and reaction steps were measured with the bubble meter, the exact flow rates of CO2 and co-reactant, either H2 or CH4, were calculated by subtracting the known N2 flow rate from the corresponding total flow rate. Moreover, all the total volumetric flow rate measurements and the stabilisation of the gases percentage were performed in the ‘bypass’ mode to make sure that the DFMs were exposed to the desired gases only during the CO2 capture, N2 purge, and reaction steps.
In addition, the percentages of CO2, CH4, CO, and H2 in the outlet stream shown in the gas analyser were recorded every 5 seconds throughout the experiment and it was assumed that the remaining volume percentage in the mixture was N2. Hence, the volumetric flow rates of all gases were calculated according to the following formula, where the brackets represent the volumetric percentage of each gas, i.e. CO2, CH4, CO, and H2, the F the flow rate (mL min−1), and the subscript ‘i’ the respective gas. The amount of products (in mL) was calculated based on the area under the curve at a flow rate (mL min−1) vs. time (min) graph.
 | (4) |
3. Results and discussion
3.1. Performance testing
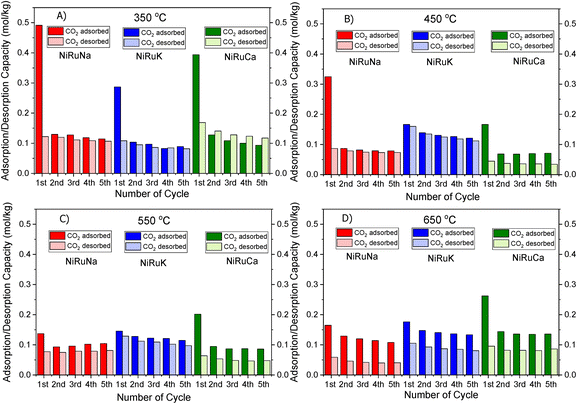 | ||
| Fig. 2 CO2 Adsorption/desorption cycles of NiRuNa, NiRuK and NiRuCa at (A) 350 °C, (B) 450 °C, (C) 550 °C and (D) 650 °C. | ||
| DFM | Adsorption temperature (°C) | Adsorption capacity (mmol gDFM−1) | Ref. |
|---|---|---|---|
| 15% Ni–1%Ru, 10% Na2O/CeO2–Al2O3 | 350 | 0.49 | This work |
| 450 | 0.32 | ||
| 550 | 0.14 | ||
| 650 | 0.16 | ||
| 15% Ni–1% Ru, 10% K2O/CeO2–Al2O3 | 350 | 0.29 | This work |
| 450 | 0.17 | ||
| 550 | 0.15 | ||
| 650 | 0.18 | ||
| 15% Ni–1% Ru, 10% CaO/CeO2–Al2O3 | 350 | 0.39 | This work |
| 450 | 0.17 | ||
| 550 | 0.20 | ||
| 650 | 0.26 | ||
| 1% Ru–10% Ni, 10% Na2CO3/Al2O3 | 350 | 0.27 | 56 |
| 550 | 0.18 | ||
| 1% Ce–10% Ni, 10% Na2CO3/Al2O3 | 350 | 0.16 | 56 |
| 550 | 0.18 | ||
| 1% Ru–10% Ni, 6.1% “Na2O”/Al2O3 | 320 | 0.52 | 25 |
| 10% Ni, 6.1% “Na2O”/Al2O3 | 320 | 0.40 | 25 |
| 5% Ru, 10% CaO/Al2O3 | 320 | 0.60 | 24 |
| 5% Ru, 10% Na2CO3/Al2O3 | 320 | 0.55 | 27 |
| 5% Ru, 6.1% “Na2O”/CeO2 | 320 | 0.37 | 57 |
| 5% Ru, 7.01% “K2O”/Al2O3 | 320 | 0.49 | 57 |
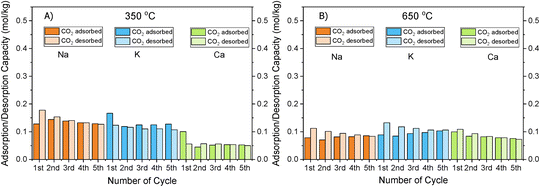
Fig. 1 shows that the DFMs designed in this study were able to reversibly adsorb CO2 in the temperature range of 350–650 °C, making them suitable for the flexible DFMs scenario. They all displayed relatively high adsorption capacities without the requirement of high regeneration temperatures as the desorption was carried out by an inert gas purge. Concerning the NiRuNa sample, a drop in the adsorption capacity was demonstrated with rising temperature, except when the temperature reached 650 °C. A similar trend was also observed in the NiRuCa sample. A pattern was not easily detected in the NiRuK sample, but it was noted that it had the best performance at intermediate temperatures, in accordance with the CO2-TPD results presented later. As a general outcome of this study, NiRuNa seemed to perform best at low temperatures, NiRuK at intermediate temperatures, and NiRuCa at high temperatures, in agreement with other findings49,50 and following the logics of Pearson's hard/soft acid–base interactions. Nevertheless, these results indicated that it would be possible to use all of these materials as flexible DFMs at this temperature range. Indeed, the fact that the working adsorption capacity at 650 °C was even better than that of the DFMs at 350 °C was unexpected. However, it can be explained by a change in mechanism of CO2 capture or a kinetic limitation, which had been overcome at 650 °C, as steeper slopes at higher temperatures are observed in Fig. S1.†
As can be seen in Fig. 1, a substantial amount of CO2 was adsorbed during the first cycle for all DFMs, which was not the case in the supported adsorbents or the switchable catalyst. Especially at 350 °C, the adsorption capacity of the DFMs was higher than the supported adsorbents and the catalyst together, indicative of a synergy between those materials took place, which enhanced the CO2 adsorption capacity. In other words, CO2 was not adsorbed only onto the adsorbents and the catalysts, a fact that has already been established in literature.51,52 Consequently, these results indicate that when adsorbents and catalysts are in close proximity, they benefit from each other, especially at high temperatures that the mechanism is kinetically activated. In fact, previous studies25,52 demonstrated that both Ni and Ru were adsorbing CO2 when combined in a DFM, which meant that spill over and methanation took place over onto both Ni and Ru sites. The findings showcase the importance of having one material performing both the CO2 adsorption and reduction, rather than two different materials being mixed together. There can also be a role of CeO2 in CO2 adsorption because CeO2 is known to promote CO2 adsorption. After all, ceria is well known for its excellent redox properties35,46,53,54 and further mechanistic studies need to be done in the future. Nevertheless, it was believed that a small quantity of CO2 was used to oxidise the reduced ceria species and form CO.
Fig. S1–S3† show the amount of CO2 adsorbed per mg of sample during those five cycles at different temperatures. All the materials demonstrated that the adsorption was performed in two steps. An initial fast adsorption of CO2 took place, accounting for the substantial weight gain at the beginning of each capture cycle. The second step was a slower one, evident from the change in slope. In addition, it was observed that the supported adsorbents were able to reach equilibrium and reversibly adsorb CO2 onto the adsorbents’ sites, meaning that they had managed to adsorb and desorb the same CO2 amounts, which was not the case with the DFMs. An interesting observation was that there were different slopes for the “slow CO2 adsorption step” in all DFMs when comparing the uptake behaviour at 650 °C to that at 350 °C, pointing to a kinetically limited capture mechanism that becomes favourable at higher temperatures. The different CO2 adsorption mechanism at 350 °C and 650 °C could not be fully attributed to the former being weak chemisorption and the latter Ca, Na, K carbonate formation, because our TGA results shown in Fig. S2† demonstrated that the supported adsorbents reversibly adsorbed CO2 at these temperatures. Hence, the formation of stable Ca, Na, K carbonates was not the main mechanism at this high temperature. Additionally, based on the CO2-TPD results shown below, these DFMs had a negligible amount of strong basic sites that could have favoured the carbonate formation. Therefore, it was found that the change in slope was not attributed to the adsorbents, but to the Ni–Ru species, as can be seen by comparing Fig. S1–S3† at 650 °C. This result also showcased that the catalytic component of the DFMs contributed to the CO2 adsorption too, since various carbonate species have been reported for Ni–Ce catalysts in literature,55 and highlighted the importance of a synergy between these two components. Nevertheless, a DRIFTS study is under way to identify the species responsible for this behaviour and for clarifying the differences in adsorption mechanisms.
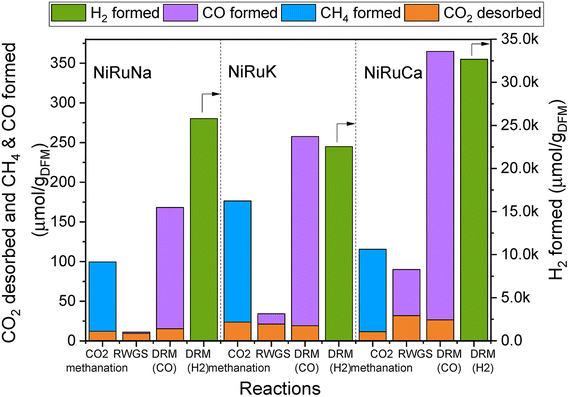 | ||
| Fig. 4 Results of feasibility study of flexible DFMs, showing the amount of CO2 desorbed and products formation in each reaction for NiRuNa, NiRuK and NiRuCa. | ||
Fig. 4 reveals the feasibility of switchable DFMs, where 100% selectivity in conversion of captured CO2 to either methane or CO is obtained for all 3 cases (methanation, RWGS and DRM) and for all DFMs investigated herein. In all cases, the CO2 was captured at the desired temperature and was subsequently converted into CH4, CO, and syngas, depending on the temperature and the co-reactant used. It was demonstrated that the formation of by-products via side reactions was prevented except for the DRM scenario where DFMs were shown to also catalyse methane cracking once captured CO2 was consumed. In this case, a surplus of H2 was obtained which could be useful depending on the envisaged application. A small amount of CO2 was desorbed during all reactions. However, it appeared that this was not temperature dependent because it was found that approximately the same amount of CO2 was desorbed in all three reactions. This is interpreted as an indication that some fraction of adsorption sites was not in sufficient proximity with the catalytic sites, and so the adsorbed CO2 ended up being desorbed. Therefore, there is room for improvement both in material design by fine-tuning the DFMs nanostructure and in reaction engineering by adding another catalyst bed to convert the residual CO2 or improving mass transfer by reactor design, for instance, by using microchannel reactors or micro-monoliths.58,59 No CO2 was detected during the heating ramp between methanation and RWGS, demonstrating that the entire amount of CO2 adsorbed had either been converted into CH4 or was desorbed.
It was observed that all DFMs were more active in the DRM reaction compared to RWGS. NiRuK was the best performing DFM in the CO2 methanation followed by NiRuCa and NiRuNa. In both RWGS and DRM, NiRuCa was the best DFM and after that, it was NiRuK and NiRuNa. It was concluded that the performance of the DFMs strongly depended on the materials basicity and their CO2 desorption ability at the selected temperature, as observed in the CO2-TPD profiles later on. Additionally, it was shown that the proximity of the adsorption and catalytic sites was a more vital parameter compared to the adsorption capacity. This was evident in the case of NiRuNa, which had the highest CO2 capacity at 350 °C, yet had the worst performance in the CO2 methanation reaction, indicating an unsatisfactory interaction between the Na and Ni–Ru species. In terms of overall performance, DFMs can be ranked in the order NiRuCa > NiRuK > NiRuNa.
In terms of product signals, as observed in Fig. S4–S6,† an initial spike in the products was detected, demonstrating a fast reaction between the captured CO2 and the excess co-reactant (H2 or CH4), followed by a slower decrease in their signals. Additionally, it was observed that the reactions took place in the first 10 minutes, allowing space for further optimisation of the process by minimising the reaction time. It is worth noting, however, that in order for two reactors to run in parallel in the DFM technology, the CO2 capture and reduction steps need to have the same duration and if this is not the case, alternative configurations are required. Typically, in adsorption systems, regeneration is the slow step that necessitates boosting via temperature or pressure swing. Therefore, the fast reaction (which is also regeneration) time observed in DFMs is a major advantage for designing industrially applicable systems.
An interesting finding was that of the CO formation during the capture steps, an indication that CO2 may have been reduced by Ce3+, or even by Ni and Ru species, leading to CO formation and Ce4+. These species were re-reduced when H2 was either flowing or being generated in the subsequent steps.35,41 This would in turn mean that the materials were able to sequentially be oxidised and reduced throughout the duration of the experiment without any structure alteration, as shown by the post-characterisation of the spent materials. Another explanation for the CO formation during the capture step would have been the occurrence of the reverse Boudouard reaction between the CO2 and some carbon species, resulting in CO production. The occurrence of RWGS between the available CO2 and the chemisorbed H2 could not be excluded too, as only a small amount of CO was formed during the CO2 capture step at 350 °C, which was not the case at 650 °C. In addition to the CO formation, there was an amount of H2 produced during the capture step. This might have happened because of H2 being chemisorbed in a previous step, and thus being displaced by CO2. Alternatively, H2 might have been produced from the oxidation of Ce3+ species with some leftover H2O species coming from previous reactions including the initial DFMs reduction, CO2 methanation and RWGS. Due to the increased complexity of these materials, further mechanistic studies are required to verify exact mechanisms and based on their results, optimisation and redesign of such experiments can take place in the future. In particular, it is necessary to test DFMs also under real flue gas and active direct air capture conditions to assess their performance for a range of realistic applications. In this study, we show that the DFMs passively capture CO2 from the ambient air and are able to convert it into CH4 or syngas via CO2 methanation and DRM respectively, which is a strong indication that they can tolerate oxygen and some moisture.
By observing the CO and H2 profiles of the NiRuNa during RWGS, an unexpected result emerged. It appeared that even when no CO and H2 were produced during that reaction, the H2 signal decreased and no CH4 was formed. However, during the subsequent CO2 capture step, these gases were indeed detected. Therefore, it was assumed that there had not been enough heat produced during that step so as to release the products of the endothermic RWGS. Once a small amount of heat was produced during the next exothermic adsorption step, these gases were able to be released, and thus detected by the gas analyser. As a result, the DFM's sites were once again free to adsorb CO2 during the capture step.
During DRM, the DFMs were able to initially convert the captured CO2 into syngas, as illustrated by the CO and H2 signals. However, methane cracking was observed for all DFMs as a significant amount of CH4 was used and H2 was produced. This was anticipated because the captured CO2 had initially been converted into syngas and, as time went by and its availability was limiting, the CH4 was decomposed into carbon and H2. This phenomenon had already been reported during the post-breakthrough stage.39 As a result, the H2/CO ratio was higher than its stoichiometric value of 1 and a H2 rich syngas was produced, which could be useful in CO2 applications that require a higher H2/CO ratio. A good strategy for limiting the carbon formation would have been to decrease the DRM duration, as it had taken place predominantly in the first 5 to 10 minutes, because allowing this step to occur for longer would serve no purpose. In a realistic scenario, the stoichiometric amount of CH4 would have been added to the system based on the CO2 uptake to control the ratio of CO2 and CH4. In general, as CH4 cracking was observed after DRM reaction (Fig. S4–S6†), pulsing a controllable amount of CH4 to minimise the extent of cracking and coke formation would have been the way forward from an engineering perspective. Nevertheless, previous reports38–40 demonstrated that the carbon formed during the DRM reaction was able to be regenerated during the subsequent CO2 capture step via the endothermic reverse Boudouard reaction. The occurrence of the reverse Boudouard reaction would have been expected for these materials too if a CO2 capture step had occurred after the DRM step.
Table 3 shows a comparative analysis of these switchable DFMs with similar materials in literature.28 It can be observed that the designed DFMs of this work have similar performance to the ones in literature who were prepared by the same synthesis method, impregnation. Hence, studies that directly compare the various DFMs synthesis methods should be carried out, with an emphasis on understanding the structure–activity relationships. It is worth mentioning that in this work, a longer N2 purge step had been carried out in between the CO2 capture and reaction steps compared to other studies, which definitely had decreased the product formation. However, this took place just to confirm the spill over mechanism of DFMs and their ability to convert the adsorbed CO2 into various products. So, this is not how the DFM technology would necessarily work in industry, although a N2 purge step would potentially be needed when O2-containing CO2 capture feed would be used to avoid the mixing of O2 and H2. Besides fine-tuning the synthesis method of DFMs, reaction engineering optimisation, design and technoeconomic assessment are also necessary to scale up DFMs.
| DFM | Reaction temperature (°C) | Product formation (μmol gDFM−1) | Ref. |
|---|---|---|---|
| 15% Ni–1%Ru, 10% Na2O/CeO2–Al2O3 | 350 | Meth. CH4: 87 | This work |
| 650 | RWGS CO: 2 | ||
| 650 | DRM CO: 153 | ||
DRM H2: 25![[thin space (1/6-em)]](https://www.rsc.org/images/entities/char_2009.gif) 774 774 |
|||
| 15% Ni–1% Ru, 10% K2O/CeO2–Al2O3 | 350 | Meth. CH4: 153 | This work |
| 650 | RWGS CO: 13 | ||
| 650 | DRM CO: 239 | ||
DRM H2: 22![[thin space (1/6-em)]](https://www.rsc.org/images/entities/char_2009.gif) 512 512 |
|||
| 15% Ni–1% Ru, 10% CaO/CeO2–Al2O3 | 350 | Meth. CH4: 104 | This work |
| 650 | RWGS CO: 58 | ||
| 650 | DRM CO: 338 | ||
DRM H2: 32![[thin space (1/6-em)]](https://www.rsc.org/images/entities/char_2009.gif) 639 639 |
|||
| 1% Ru–10% Ni, 10% Na2CO3 /Al2O3 | 350 | Meth. CH4: 266 | 56 |
| 550 | Meth. CH4: 145 | ||
| 1% Ce–10% Ni, 10% Na2CO3 /Al2O3 | 350 | Meth. CH4: 172 | 56 |
| 550 | Meth. CH4: 125 | ||
| 1% Ru–10% Ni, 6.1% “Na2O”/Al2O3 | 320 | Meth. CH4: 280 | 25 |
| 5% Ru, 10% CaO/Al2O3 | 320 | Meth. CH4: 500 | 24 |
| 5% Ru, 10% Na2CO3 /Al2O3 | 320 | Meth. CH4: 1050 | 27 |
| 5% Ru, 6.1% “Na2O”/CeO2 | 320 | Meth. CH4: 320 | 57 |
| 5% Ru, 7.01% “K2O”/Al2O3 | 320 | Meth. CH4: 467 | 57 |
| Ni/CaO | 500 | Meth. CH4: 13![[thin space (1/6-em)]](https://www.rsc.org/images/entities/char_2009.gif) 500 500 |
41 |
| 700 | RWGS CO: 400 | ||
| 700 | DRM CO: 20![[thin space (1/6-em)]](https://www.rsc.org/images/entities/char_2009.gif) 200 200 |
||
DRM H2: 131![[thin space (1/6-em)]](https://www.rsc.org/images/entities/char_2009.gif) 700 700 |
|||
| Ca1Ni0.1Ce0.033 | 650 | RWGS CO: 7300 | 35 |
3.2. Characterisation
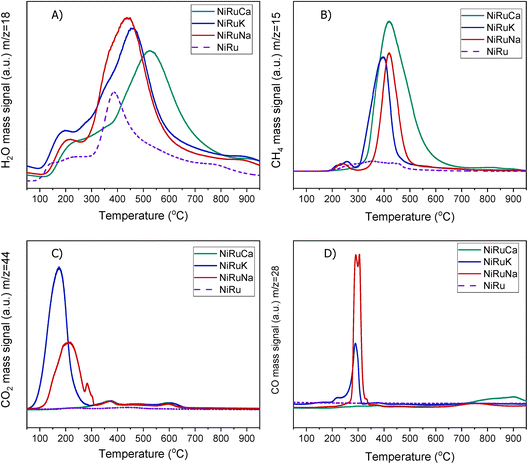 | ||
| Fig. 5 H2-TPR study for NiRuNa, NiRuK, NiRuCa and NiRu: (A) H2O, (B) CH4, (C) CO2 and (D) CO signals. | ||
A striking finding was the detection of CO and CH4 in the DFMs compared to the NiRu catalyst, as seen in Fig. 5B and D. By looking at the CO2, H2O, and H2 signals, besides the CH4, it can be seen that after their synthesis, all DFMs synthesised in this work were able to adsorb CO2 directly and passively from the atmospheric air and convert it into CH4via the CO2 methanation reaction. CO formation was also observed on NiRuK and NiRuNa. Therefore, Ni and Ru, which were already reduced by these temperatures (i.e. 440 °C for NiRuNa, 455 °C for NiRuK, and 520 °C for NiRuCa) were used to produce CH4 and H2O from the atmospheric CO2 captured on adsorbent sites using the H2 feed during the H2-TPR study. Desorption of CO2 and generation of other products of CO2 reduction were also detected mainly at low temperatures, in agreement with the CO2-TPD results and the different types of basic sites, as presented later. Consequently, the main peak of the DFMs in the H2O signal profiles corresponded to the H2O from the methanation reaction, holding promise for using DFMs for flexible chemicals synthesis from CO2 in the air.
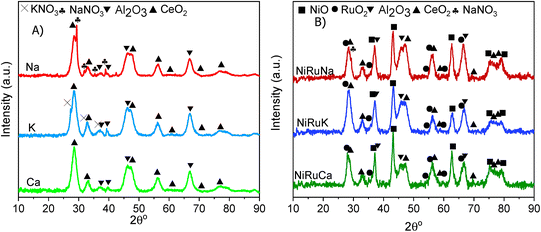
As seen in Fig. S7,† which presented similar peaks to the H2O signal, the NiRuNa and NiRuK samples had a similar pattern since three distinct peaks were observed. The NiRuCa sample showed a broader reduction pattern up to 350 °C, but two peaks were seen over that temperature. By observing the H2O signals of the three DFMs in Fig. 5A, it can be seen that the first peak at 200 °C corresponded to the reduction of Ru4+ to metallic Ru. These were located at a higher temperature compared to the reference material, indicating a better interaction of the Ru species with the other species.60 Moreover, a broad reduction zone located at 440 °C for the NiRuNa, another at 455 °C for the NiRuK, and another one at 520 °C for the NiRuCa were detected. In all those reduction events, a shoulder at the lower temperature range was displayed, attributed to the medium-sized NiOx species interacting with the CeO2 particles.61,62 The slow decrease of the signal over 800 °C corresponded to the reduction of a small amount of bulk CeO2 species,63 confirming the reduced XRD profiles, which showed that surface CeO2 species were the main CeO2 species in the samples.
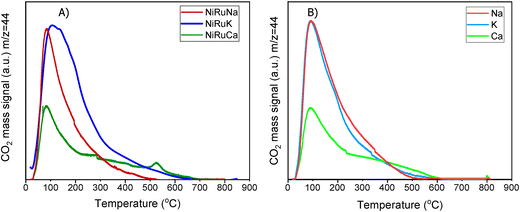
Fig. 6 demonstrates the CO2-TPD results of DFMs and supported adsorbents, while Fig. S8† shows the corresponding results of the reference Ni–Ru switchable catalyst. All the materials displayed mainly weak and medium basic sites. By comparing the DFMs with the NiRu catalyst, it was noted that the addition of the adsorbents contributed to the formation of medium basic sites. Therefore, it was shown that the adsorbents were in a dispersed form rather than bulk species, meaning that the DFMs would behave like intermediate-temperature adsorbents and reversibly adsorb CO2 at intermediate temperatures in agreement with literature.65 Although the CO2-TPD profiles of the DFMs had been mainly influenced by the supported adsorbents, by comparing the DFMs and supported adsorbents profiles, it was observed that the addition of Ni and Ru to the supported adsorbents suppressed the medium basic sites. This meant that, to some extent, Ni and Ru covered a small amount of adsorption sites during impregnation.50 Although NiRuK displayed a higher intensity signal for medium basic sites (300–700 °C) than NiRuNa, the CO2-TPD profiles of these materials were similar to each other. As regards the NiRuCa sample, a different profile was observed with a smaller amount of weak basic sites and more medium-strong ones, in agreement with its CO2 signal profile in the H2-TPR study as well as the TGA study at high temperatures.
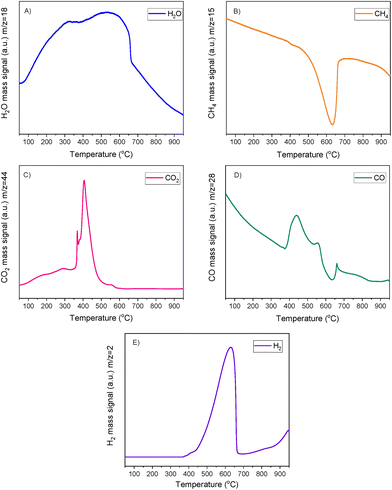
Fig. 7 shows the CH4-TPSR results. Overall, it was demonstrated that the DFM's oxidation (since the sample used was after calcination) did not shut down its activity for DRM which was remarkable. In agreement with the H2-TPR results, atmospheric CO2 was adsorbed onto the DFM and was gradually released until a peak at 400 °C was observed. A peak at higher temperature analogous to the H2-TPR and CO2-TPD results was not identified, meaning that CO2 was fully consumed during low temperature reaction. A CO peak was also seen at this temperature (400 °C). Additionally, CH4 cracking took place starting at 350–400 °C and peaked at 635 °C, as observed from the H2 and CH4 signals. Therefore, it was shown that in a CH4-rich environment and in the temperature range of 400–600 °C, CH4 cracking supplied the H2 needed for the reduction of Ni and Ru which was feasible at these temperatures. Thus, DRM was able to take place because of the available CH4 and atmospheric CO2. However, after the consumption of CO2, excessive CH4 cracking took place, which was expected based on our isothermal experiment results shown in section 3.1.2. It is worth mentioning that RWGS and reverse Boudouard reactions could also be responsible for some CO formation as well.
Based on these results, it was confirmed that a DRM temperature reduction to 400 °C could be feasible. It may also be possible to lower the temperature of DRM using other driving forces for reaction.66,67 It should be kept in mind that the DFMs operate under dynamic conditions, meaning that a deviation from the well-known steady state conditions is possible. A significant RWGS temperature reduction would require a catalyst that is not active for the methanation reaction, thus being beyond the aim of the present study which focuses on switchable performance with 100% selectivity depending on reaction conditions. As CO2 methanation and RWGS have the same reactants, the reaction parameter changed to achieve a different product formation is temperature. So, if the RWGS temperature is significantly reduced, then 100% CO selectivity may not be achieved. The initial temperature of RWGS and DRM, i.e. 650 °C was considered useful for this validation study since higher temperatures are more representative of the current industrial reformers that operate close to equilibrium conversions at 900–1000 °C.68 However, investigating the DFM behaviour at a temperature higher than 650 °C was considered to be unnecessary, because the DFMs had 100% selectivity in these reactions. In fact, it would have had a negative effect due to reduced CO2 adsorption and sintering, let alone the increase of operating costs in a potential scale up.
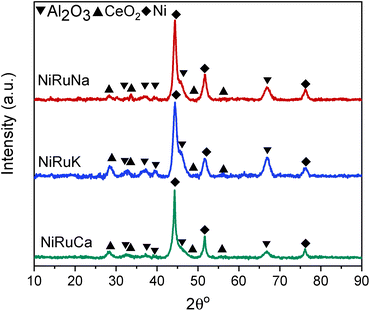
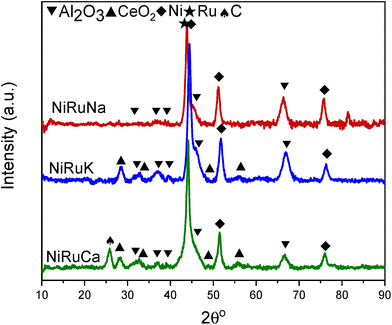
Upon reduction at 800 °C, as observed in Fig. 10, the CeO2 peaks either disappeared or were significantly lower in intensity. As a result, it was concluded that surface CeO2 species were mainly present in the samples, which was in agreement with the H2-TPR results presented previously for Ce–Al supported catalysts.73 No ceria aluminate (CeAlO3) species were seen, which is consistent with the use of a reduction temperature of 800 °C.69 Metallic Ni peaks were also detected in the reduced DFM XRD patterns (JCPDS 01-070-1849). In contrast, metallic Ru peaks were not observed, which led us to believe that Ru was well dispersed and/or a Ni–Ru alloy was formed; however, due to the low Ru weight content (1 wt%) compared to Ni (15 wt%), no shift of Ni peaks could be discerned in the XRD patterns.21,74
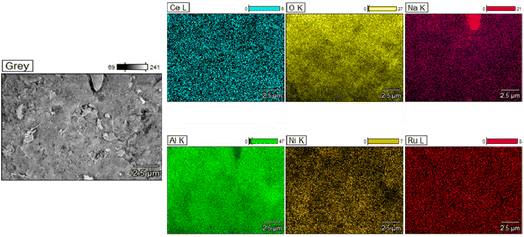
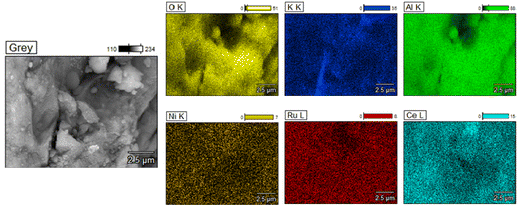
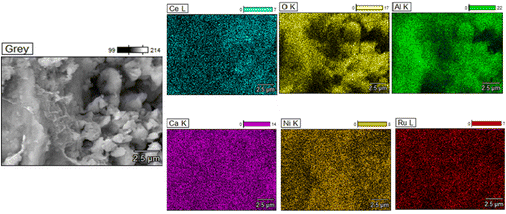
Additionally, TEM images of the three reduced DFMs are presented in Fig. 14. These images revealed the nanostructure of these materials with Ni and Ru having a particle diameter of less than 10 nm overall. In general, a good dispersion of their active catalytic phases was achieved in accordance with their EDX profiles.
3.3. Post reaction characterisation
As shown in Fig. S4–S6,† CH4 cracking took place in the feasibility study of the switchable DFMs that resulted in the formation of coke, and hence XRD and TGA were carried out on the spent catalysts to characterise and quantify the carbon species.Fig. 15 shows the XRD patterns of the post-reaction NiRuNa, NiRuK, and NiRuCa samples. The patterns were similar to their reduced ones presented in Fig. 10, displaying the characteristic peaks of Ni, CeO2, and Al2O3. No carbon peak was observed in the spent NiRuNa and NiRuK XRD profiles, meaning that the type of carbon formed was soft with a poorer degree of crystallinity. However, this was not the case with the NiRuCa, as a carbon peak at 2θ° = 26 was observed, signifying the formation of a harder carbon potentially requiring higher regeneration temperatures. A slight shift of the Ni peak to lower angles appeared on the NiRuNa and NiRuCa samples indicating the formation of a NiRu alloy, which was not the case with their reduced materials.21 Hence, it was concluded that a NiRu alloy was formed during reduction even though it was not evident from their XRD patterns. Such alloy plays a key role in the catalytic conversion process.
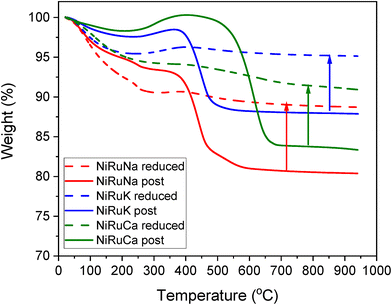
Thermogravimetric analysis during temperature programmed oxidation (TPO) was also used to quantify the carbon formed on post-reaction DFMs after the feasibility testing, especially expected from the performance during the DRM step. In order to accurately measure the amount of carbon, ex situ reduced DFMs were also tested under the same conditions. Therefore, the weight loss due to the atmospheric CO2 and moisture adsorption and material degradation, as well as the weight gain due to the oxidation of the materials, were also taken into account. The results are presented in Fig. 16. In all the samples, an initial weight loss took place up to 200–300 °C because of the weakly adsorbed atmospheric CO2 and moisture. A higher weight loss was seen in the reduced materials because they were able to absorb a higher amount of atmospheric impurities. Moreover, a weight gain was observed at the 300–400 °C temperature range, which was associated with the oxidation of the remaining Ni and Ru particles. At temperatures higher than 400 °C, a significant weight loss was detected, showing the carbon oxidation. The coke oxidation was completed by 500 °C for the NiRuNa and NiRuK samples, while a higher temperature was needed for the NiRuCa sample, confirming the existence of softer carbon species in the former samples and of harder ones in the latter. The formation of soft carbon was an intriguing result as it will likely allow an easier regeneration process in the future. Overall, the amount of carbon formed during the DRM reaction was 0.083 gC/gSample for NiRuNa, 0.072 gC/gSample for NiRuK and 0.075 gC/gSample for NiRuCa, showing a similar extent of CH4 cracking for the three DFMs.
4. Conclusions
In this work, a series of advanced universal materials for the integrated CO2 capture and conversion were designed. The combination of an adsorbent and a switchable catalyst led to the development of switchable DFMs that were shown for the first time to be able to capture CO2 at various temperatures and, depending on the reaction conditions, to convert it into different added-value chemicals through the CO2 methanation, RWGS, and DRM catalytic upgrading routes. This proof of concept is a milestone in the development of carbon negative technologies to combat the increased CO2 emissions and the resulting global warming. Switchable DFMs can be adapted to the current infrastructure as a CCU unit, while offering a solution to the highly variable energy sector.The designed DFMs of this work were highly dispersed and nanostructured porous materials and their species, located in close proximity, showed a high degree of interaction with each other. The H2-TPR experiments demonstrated that these materials were able to passively adsorb atmospheric CO2 through direct air capture and to convert it into synthetic natural gas. The CO2 adsorption–desorption studies of the selected DFMs surprisingly proved that they were able to reversibly adsorb CO2 at different temperatures, making them ideal for a flexible DFM scenario. A synergy between the species also took place, contributing to their increased adsorption capacities. Overall, the CO2 adsorption capacities of the DFMs were in accordance with their basicity profiles, as revealed by the CO2-TPD results. NiRuCa was the best DFM, producing 104 μmol of CH4 per kgDFM in CO2 methanation, 58 μmol of CO per kgDFM in RWGS and 338 μmol of CO per kgDFM in DRM. It was also concluded that the DFMs displayed a complex CO2 capture behaviour over different types of adsorption sites, which will necessitate mechanistic studies for understanding their behaviour during DFM operation. CO2 capture under realistic flue gas conditions with O2, steam and SO2 was out of the scope of this manuscript, even if some degree of oxygen tolerance is expected given their behaviour during H2-TPR. Future studies dealing with these impurities similar to literature76 are highly recommended as a future direction.
The feasibility study of performing CO2 capture and then either CO2 methanation, RWGS or DRM reactions was demonstrated, providing a new tool for devising low emission chemical production schemes in the near term when availability of green hydrogen will be increasing and the demand for different products (such as synthetic natural gas vs. syngas or CO) will be variable. Our findings make it possible to adapt to uncertainty by designing flexible chemical production schemes from CO2 emissions, whether they are captured from stationary sources or the ambient atmosphere.
Conflicts of interest
There are no conflicts to declare.Author contributions
Loukia-Pantzechroula Merkouri: conceptualisation, methodology, formal analysis, investigation, writing – original draft, visualisation. Tomas Ramirez Reina: conceptualisation, resources, writing – review & editing, supervision, funding acquisition. Melis S. Duyar: conceptualisation, resources, writing – review & editing, supervision, funding acquisition.Acknowledgements
Financial support for this work was provided by the Department of Chemical and Process Engineering and the Doctoral College of the University of Surrey. This work was partially sponsored by the European Commission through the H2020-MSCA-RISE-2020 BIOALL project (Grant Agreement: 101008058). The TEM instrument was funded by EPSRC grant EP/V036327/1. SASOL is kindly acknowledged for providing the CeAl support. The authors would like to acknowledge the help of the department's lab technicians Ben Gibbons, Thomas Chamberlain and Panagiotis Sarikas for their continued support in the lab activities of L.-P. Merkouri. L.-P. Merkouri also thanks Andreas Iakovidis of Mechanical Engineering Sciences and Dr Vlad Stolojan of the Department of Electrical and Electronic Engineering for their assistance with SEM and TEM respectively.References
- IEA, Global energy review – CO2 emissions 2021. https://www.iea.org/reports/global-energy-review-2021/co2-emissions (accessed April 4, 2022).
- United Nations Framework Convention on Climate Change. Adoption of the Paris Agreement.Paris, 2015.
- J. Rogelj, M. Den Elzen, N. Höhne, T. Fransen, H. Fekete and H. Winkler, et al., Paris Agreement climate proposals need a boost to keep warming well below 2 °c, Nature, 2016, 534, 631–639, DOI:10.1038/nature18307.
- J. C. M. Pires, F. G. Martins, M. C. M. Alvim-Ferraz and M. Simões, Recent developments on carbon capture and storage: An overview, Chem. Eng. Res. Des., 2011, 89, 1446–1460, DOI:10.1016/j.cherd.2011.01.028.
- A. Samanta, A. Zhao, G. K. H. Shimizu, P. Sarkar and R. Gupta, Post-combustion CO 2 capture using solid sorbents: A review, Ind. Eng. Chem. Res., 2012, 51, 1438–1463, DOI:10.1021/ie200686q.
- K. Damen, M. V. Troost, A. Faaij and W. Turkenburg, A comparison of electricity and hydrogen production systems with CO 2 capture and storage. Part A: Review and selection of promising conversion and capture technologies, Prog. Energy Combust. Sci., 2006, 32, 215–246, DOI:10.1016/j.pecs.2005.11.005.
- A. B. Rao and E. S. Rubin, A technical, economic, and environmental assessment of amine-based CO2 capture technology for power plant greenhouse gas control, Environ. Sci. Technol., 2002, 36, 4467–4475, DOI:10.1021/es0158861.
- A. Al-Mamoori, A. Krishnamurthy, A. A. Rownaghi and F. Rezaei, Carbon Capture and Utilization Update, Energy Technol., 2017, 5, 834–849, DOI:10.1002/ente.201600747.
- M. K. Mondal, H. K. Balsora and P. Varshney, Progress and trends in CO2 capture/separation technologies: A review, Energy, 2012, 46, 431–441, DOI:10.1016/j.energy.2012.08.006.
- W. Wang, S. Wang, X. Ma and J. Gong, Recent advances in catalytic hydrogenation of carbon dioxide, Chem. Soc. Rev., 2011, 40, 3703–3727, 10.1039/c1cs15008a.
- A. T. Najafabadi, CO 2 chemical conversion to useful products : An engineering insight to the latest advances toward sustainability, Int. J. Energy Res., 2013, 37, 485–499, DOI:10.1002/er.
- E. le Saché and T. R. Reina, Analysis of Dry Reforming as direct route for gas phase CO2 conversion. The past, the present and future of catalytic DRM technologies, Prog. Energy Combust. Sci., 2022, 89 DOI:10.1016/j.pecs.2021.100970.
- D. Pakhare and J. Spivey, A review of dry (CO2) reforming of methane over noble metal catalysts, Chem. Soc. Rev., 2014, 43, 7813–7837, 10.1039/c3cs60395d.
- M. C. J. Bradford and M. A. Vannice, CO2 reforming of CH4, Catal. Rev. - Sci. Eng., 1999, 41, 1–42, DOI:10.1081/CR-100101948.
- M. Usman, W. M. A. Wan Daud and H. F. Abbas, Dry reforming of methane: Influence of process parameters - A review, Renewable Sustainable Energy Rev., 2015, 45, 710–744, DOI:10.1016/j.rser.2015.02.026.
- M. Liu, Y. Yi, L. Wang, H. Guo and A. Bogaerts, Hydrogenation of carbon dioxide to value-added chemicals by heterogeneous catalysis and plasma catalysis, Catalysts, 2019, 9, 275, DOI:10.3390/catal9030275.
- H. Yang, Z. Xu, M. Fan, R. Gupta, R. B. Slimane and A. E. Bland, et al., Progress in carbon dioxide separation and capture: A review, J. Environ. Sci., 2008, 20, 14–27, DOI:10.1016/S1001-0742(08)60002-9.
- Y. A. Daza and J. N. Kuhn, CO2 conversion by reverse water gas shift catalysis: Comparison of catalysts, mechanisms and their consequences for CO2 conversion to liquid fuels, RSC Adv., 2016, 6, 49675–49691, 10.1039/c6ra05414e.
- Q. Zhang, L. Pastor-Pérez, S. Gu and T. R. Reina, Transition metal carbides (TMCS) catalysts for gas phase CO2 upgrading reactions: A comprehensive overview, Catalysts, 2020, 10, 1–23, DOI:10.3390/catal10090955.
- P. Frontera, A. Macario, M. Ferraro and P. L. Antonucci, Supported catalysts for CO2 methanation: A review, Catalysts, 2017, 7, 1–28, DOI:10.3390/catal7020059.
- F. Lange, U. Armbruster and A. Martin, Heterogeneously-Catalyzed Hydrogenation of Carbon Dioxide to Methane using RuNi Bimetallic Catalysts, Energy Technol., 2015, 3, 55–62, DOI:10.1002/ente.201402113.
- R. M. Bown, M. Joyce, Q. Zhang, T. R. Reina and M. S. Duyar, Identifying Commercial Opportunities for the Reverse Water Gas Shift Reaction, Energy Technol., 2021, 9, 2100554, DOI:10.1002/ente.202100554.
- J. Gao, Q. Liu, F. Gu, B. Liu, Z. Zhong and F. Su, Recent advances in methanation catalysts for the production of synthetic natural gas, RSC Adv., 2015, 5, 22759–22776, 10.1039/c4ra16114a.
- M. S. Duyar, M. A. A. Treviño and R. J. Farrauto, Dual function materials for CO2 capture and conversion using renewable H2, Appl. Catal., B, 2015, 168–169, 370–376, DOI:10.1016/j.apcatb.2014.12.025.
- M. A. Arellano-Treviño, N. Kanani, C. W. Jeong-Potter and R. J. Farrauto, Bimetallic catalysts for CO2 capture and hydrogenation at simulated flue gas conditions, Chem. Eng. J., 2019, 375, 121953, DOI:10.1016/j.cej.2019.121953.
- S. Wang, E. T. Schrunk, H. Mahajan and R. J. Farrauto, The role of ruthenium in CO2 capture and catalytic conversion to fuel by dual function materials (DFM), Catalysts, 2017, 7, 1–13, DOI:10.3390/catal7030088.
- M. S. Duyar, S. Wang, M. A. Arellano-Treviño and R. J. Farrauto, CO2 utilization with a novel dual function material (DFM) for capture and catalytic conversion to synthetic natural gas: An update, J. CO2 Util., 2016, 15, 65–71, DOI:10.1016/j.jcou.2016.05.003.
- L. P. Merkouri, T. R. Reina and M. S. Duyar, Closing the Carbon Cycle with Dual Function Materials, Energy Fuels, 2021, 35, 19859–19880, DOI:10.1021/acs.energyfuels.1c02729.
- P. Melo Bravo and D. P. Debecker, Combining CO2 capture and catalytic conversion to methane, Waste Disposal and Sustainable Energy, 2019, 1, 53–65, DOI:10.1007/s42768-019-00004-0.
- I. S. Omodolor, H. O. Otor, J. A. Andonegui, B. J. Allen and A. C. Alba-Rubio, Dual-Function Materials for CO 2 Capture and Conversion: A Review, Ind. Eng. Chem. Res., 2020, 59, 17612–17631, DOI:10.1021/acs.iecr.0c02218.
- S. Sun, H. Sun, P. T. Williams and C. Wu, Recent advances in integrated CO 2 capture and utilization: a review, Sustainable Energy Fuels, 2021, 5, 4546–4559, 10.1039/d1se00797a.
- C. Jeong-Potter and R. Farrauto, Feasibility Study of Combining Direct Air Capture of CO2 and Methanation at Isothermal Conditions with Dual Function Materials, Appl. Catal., B, 2020, 119416, DOI:10.1016/j.apcatb.2020.119416.
- L. Hu and A. Urakawa, Continuous CO2 capture and reduction in one process: CO2 methanation over unpromoted and promoted Ni/ZrO2, J. CO2 Util., 2018, 25, 323–329, DOI:10.1016/j.jcou.2018.03.013.
- S. Sun, Z. Lv, Y. Qiao, C. Qin, S. Xu and C. Wu, Integrated CO2 capture and utilization with CaO-alone for high purity syngas production, Carbon Capture Sci. Technol., 2021, 1, 100001, DOI:10.1016/j.ccst.2021.100001.
- H. Sun, J. Wang, J. Zhao, B. Shen, J. Shi and J. Huang, et al., Dual functional catalytic materials of Ni over Ce-modified CaO sorbents for integrated CO2 capture and conversion, Appl. Catal., B, 2019, 244, 63–75, DOI:10.1016/j.apcatb.2018.11.040.
- L. F. Bobadilla, J. M. Riesco-García, G. Penelás-Pérez and A. Urakawa, Enabling continuous capture and catalytic conversion of flue gas CO2 to syngas in one process, J. CO2 Util., 2016, 14, 106–111, DOI:10.1016/j.jcou.2016.04.003.
- B. Shao, G. Hu, K. A. M. Alkebsi, G. Ye, X. Lin and W. Du, et al., Heterojunction-redox catalysts of Fe: XCoyMg10CaO for high-temperature CO2capture and in situ conversion in the context of green manufacturing, Energy Environ. Sci., 2021, 14, 2291–2301, 10.1039/d0ee03320k.
- S. Jo, J. H. Lee, J. H. Woo, T.-Y. Kim, H.-J. Ryu and B. Hwang, et al., Coke-promoted Ni/CaO catal-sorbents in the production of cyclic CO and syngas, Sustainable Energy Fuels, 2022, 6, 81–88, 10.1039/d1se01136g.
- S. M. Kim, P. M. Abdala, M. Broda, D. Hosseini, C. Copéret and C. Müller, Integrated CO2 Capture and Conversion as an Efficient Process for Fuels from Greenhouse Gases, ACS Catal., 2018, 8, 2815–2823, DOI:10.1021/acscatal.7b03063.
- S. Tian, F. Yan, Z. Zhang and J. Jiang, Calcium-looping reforming of methane realizes in situ CO2 utilization with improved energy efficiency, Sci. Adv., 2019, 5, eaav5077, DOI:10.1126/sciadv.aav5077.
- S. B. Jo, J. H. Woo, J. H. Lee, T. Y. Kim, H. I. Kang and S. C. Lee, et al., CO2green technologies in CO2capture and direct utilization processes: methanation, reverse water-gas shift, and dry reforming of methane, Sustainable Energy Fuels, 2020, 4, 5543–5549, 10.1039/d0se00951b.
- A. I. Tsiotsias, N. D. Charisiou, I. V. Yentekakis and M. A. Goula, The Role of Alkali and Alkaline Earth Metals in the CO2 Methanation Reaction and the Combined Capture and Methanation of CO2, Catalysts, 2020, 10, 35, DOI:10.3390/eccs2020-07567.
- L.-P. Merkouri, E. le Sache, L. Pastor-Perez, M. S. Duyar and T. R. Reina, Versatile Ni-Ru catalysts for gas phase CO 2 conversion : Bringing closer dry reforming, reverse water gas shift and methanation to enable end-products flexibility, Fuel, 2022, 315, 123097, DOI:10.1016/j.fuel.2021.123097.
- E. Le Saché, L. Pastor-Pérez, B. J. Haycock, J. J. Villora-Picó, A. Sepúlveda-Escribano and T. R. Reina, Switchable Catalysts for Chemical CO2 Recycling: A Step Forward in the Methanation and Reverse Water-Gas Shift Reactions, ACS Sustainable Chem. Eng., 2020, 8, 4614–4622, DOI:10.1021/acssuschemeng.0c00551.
- Q. Zhang, J. J. Villora-pico, M. Joyce and A. Sepúlveda-escribano, Ni-Phosphide catalysts as versatile systems for gas-phase CO 2 conversion : Impact of the support and evidences of structure-sensitivity, Fuel, 2022, 323, 1–12, DOI:10.1016/j.fuel.2022.124301.
- K. Chang, H. Zhang, M. J. Cheng and Q. Lu, Application of Ceria in CO2 Conversion Catalysis, ACS Catal., 2020, 10, 613–631, DOI:10.1021/acscatal.9b03935.
- P. Boldrin, E. Ruiz-Trejo, J. Mermelstein, J. M. Bermúdez Menéndez, T. R. Reina and N. P. Brandon, Strategies for Carbon and Sulfur Tolerant Solid Oxide Fuel Cell Materials, Incorporating Lessons from Heterogeneous Catalysis, Chem. Rev., 2016, 116, 13633–13684, DOI:10.1021/acs.chemrev.6b00284.
- IEA. Global Hydrogen Review 2021 2021. https://www.iea.org/reports/global-hydrogen-review-2021 (accessed May 4, 2022).
- S. Cimino, F. Boccia and L. Lisi, Effect of alkali promoters (Li, Na, K) on the performance of Ru/Al2O3 catalysts for CO2 capture and hydrogenation to methane, J. CO2 Util., 2020, 37, 195–203, DOI:10.1016/j.jcou.2019.12.010.
- A. Bermejo-López, B. Pereda-Ayo, J. A. González-Marcos and J. R. González-Velasco, Ni loading effects on dual function materials for capture and in situ conversion of CO2 to CH4 using CaO or Na2CO3, J. CO2 Util., 2019, 34, 576–587, DOI:10.1016/j.jcou.2019.08.011.
- L. Proaño, E. Tello, M. A. Arellano-Trevino, S. Wang, R. J. Farrauto and M. Cobo, In situ DRIFTS study of two-step CO 2 capture and catalytic methanation over Ru,“Na 2 O”/Al 2 O 3 Dual Functional Material, Appl. Surf. Sci., 2019, 479, 25–30, DOI:10.1016/j.apsusc.2019.01.281.
- L. Proaño, M. A. Arellano-Treviño, R. J. Farrauto, M. Figueredo, C. Jeong-Potter and M. Cobo, Mechanistic assessment of dual function materials, composed of Ru-Ni, Na2O/Al2O3 and Pt-Ni, Na2O/Al2O3, for CO2 capture and methanation by in situ DRIFTS, Appl. Surf. Sci., 2020, 533, 147469, DOI:10.1016/j.apsusc.2020.147469.
- L. Pastor-Pérez, E. Le Saché, C. Jones, S. Gu, H. Arellano-Garcia and T. R. Reina, Synthetic natural gas production from CO2 over Ni-x/CeO2-ZrO2 (x = Fe, Co) catalysts: Influence of promoters and space velocity, Catal. Today, 2018, 317, 108–113, DOI:10.1016/j.cattod.2017.11.035.
- T. R. Reina, S. Ivanova, M. A. Centeno and J. A. Odriozola, The role of Au, Cu & CeO2 and their interactions for an enhanced WGS performance, Appl. Catal., B, 2016, 187, 98–107, DOI:10.1016/j.apcatb.2016.01.031.
- K. Jalama, Carbon dioxide hydrogenation over nickel-, ruthenium-, and copper-based catalysts: Review of kinetics and mechanism, Catal. Rev. - Sci. Eng., 2017, 59, 95–164, DOI:10.1080/01614940.2017.1316172.
- A. Bermejo-López, B. Pereda-Ayo, J. A. González-Marcos and J. R. González-Velasco, Alternate cycles of CO2storage andin situhydrogenation to CH4on Ni-Na2CO3/Al2O3: influence of promoter addition and calcination temperature, Sustainable Energy Fuels, 2021, 5, 1194–1210, 10.1039/d0se01677b.
- M. A. Arellano-Treviño, Z. He, M. C. Libby and R. J. Farrauto, Catalysts and adsorbents for CO2 capture and conversion with dual function materials: Limitations of Ni-containing DFMs for flue gas applications, J. CO2 Util., 2019, 31, 143–151, DOI:10.1016/j.jcou.2019.03.009.
- O. H. Laguna, M. I. Domínguez, S. Oraá, A. Navajas, G. Arzamendi and L. M. Gandía, et al., Influence of the O2/CO ratio and the presence of H2O and CO2 in the feed-stream during the preferential oxidation of CO (PROX) over a CuOx/CeO2-coated microchannel reactor, Catal. Today, 2013, 203, 182–187, DOI:10.1016/j.cattod.2012.04.021.
- M. González-Castaño, T. R. Reina, S. Ivanova, L. M. Martínez Tejada, M. A. Centeno and J. A. Odriozola, O2-assisted Water Gas Shift reaction over structured Au and Pt catalysts, Appl. Catal., B, 2016, 185, 337–343, DOI:10.1016/j.apcatb.2015.12.032.
- O. U. Valdés-Martínez, V. A. Suárez-Toriello, J. d. l. Reyes, B. Pawelec and J. L. G. Fierro, Support effect and metals interactions for NiRu/Al2O3, TiO2 and ZrO2 catalysts in the hydrodeoxygenation of phenol, Catal. Today, 2017, 296, 219–227, DOI:10.1016/j.cattod.2017.04.007.
- L. Pastor-Perez, R. Buitrago-sierra and A. Sepulveda-Escribano, CeO2-promoted Ni/activated carbon catalysts for the water-gas shift (WGS reaction, Int. J. Hydrogen Energy, 2014, 9, 17589–17599, DOI:10.1016/j.ijhydene.2014.08.089.
- L. Pastor-Pérez and A. Sepúlveda-Escribano, Multicomponent NiSnCeO2/C catalysts for the low-temperature glycerol steam reforming, Appl. Catal., A, 2017, 529, 118–126, DOI:10.1016/j.apcata.2016.10.022.
- S. C. Rood, H. B. Ahmet, A. Gomez-Ramon, L. Torrente-Murciano, T. R. Reina and S. Eslava, Enhanced ceria nanoflakes using graphene oxide as a sacrificial template for CO oxidation and dry reforming of methane, Appl. Catal., B, 2019, 242, 358–368, DOI:10.1016/j.apcatb.2018.10.011.
- Q. Pan, J. Peng, T. Sun, S. Wang and S. Wang, Insight into the reaction route of CO2 methanation: Promotion effect of medium basic sites, Catal. Commun., 2014, 45, 74–78, DOI:10.1016/j.catcom.2013.10.034.
- P. Gruene, A. G. Belova, T. M. Yegulalp, R. J. Farrauto and M. J. Castaldi, Dispersed calcium oxide as a reversible and efficient CO2sorbent at intermediate temperatures, Ind. Eng. Chem. Res., 2011, 50, 4042–4049, DOI:10.1021/ie102475d.
- A. Ali Khan and M. Tahir, Construction of an S-Scheme Heterojunction with Oxygen-Vacancy-Rich Trimetallic CoAlLa-LDH Anchored on Titania-Sandwiched Ti3C2Multilayers for Boosting Photocatalytic CO2Reduction under Visible Light, Ind. Eng. Chem. Res., 2021, 60, 16201–16223, DOI:10.1021/acs.iecr.1c03242.
- B. Tahir, M. Tahir and N. A. S. Amin, Ag-La loaded protonated carbon nitrides nanotubes (pCNNT) with improved charge separation in a monolithic honeycomb photoreactor for enhanced bireforming of methane (BRM) to fuels, Appl. Catal., B, 2019, 248, 167–183, DOI:10.1016/j.apcatb.2019.01.076.
- J. M. Lavoie, Review on dry reforming of methane, a potentially more environmentally-friendly approach to the increasing natural gas exploitation, Front. Chem., 2014, 2, 1–17, DOI:10.3389/fchem.2014.00081.
- E. Le Saché, S. Johnson, L. Pastor-Pérez, B. A. Horri and T. R. Reina, Biogas upgrading via dry reforming over a Ni-Sn/CeO2-Al2O3 catalyst: Influence of the biogas source, Energies, 2019, 12(6), 1007, DOI:10.3390/en12061007.
- K. Tao, L. Shi, Q. Ma, D. Wang, C. Zeng and C. Kong, et al., Methane reforming with carbon dioxide over mesoporous nickel-alumina composite catalyst, Chem. Eng. J., 2013, 221, 25–31, DOI:10.1016/j.cej.2013.01.073.
- S. Wang, R. J. Farrauto, S. Karp, J. H. Jeon and E. T. Schrunk, Parametric, cyclic aging and characterization studies for CO2 capture from flue gas and catalytic conversion to synthetic natural gas using a dual functional material (DFM), J. CO2 Util., 2018, 27, 390–397, DOI:10.1016/j.jcou.2018.08.012.
- A. Bermejo-López, B. Pereda-Ayo, J. A. González-Marcos and J. R. González-Velasco, Mechanism of the CO2 storage and in situ hydrogenation to CH4. Temperature and adsorbent loading effects over Ru-CaO/Al2O3 and Ru-Na2CO3/Al2O3 catalysts, Appl. Catal., B, 2019, 256, 117845, DOI:10.1016/j.apcatb.2019.117845.
- T. Stroud, T. J. Smith, E. Le Saché, J. L. Santos, M. A. Centeno and H. Arellano-Garcia, et al., Chemical CO2 recycling via dry and bi reforming of methane using Ni-Sn/Al2O3 and Ni-Sn/CeO2-Al2O3 catalysts, Appl. Catal., B, 2018, 224, 125–135, DOI:10.1016/j.apcatb.2017.10.047.
- D. Kutyła, K. Kołczyk-Siedlecka, A. Kwiecińska, K. Skibińska, R. Kowalik and P. Żabińsk, Preparation and characterization of electrodeposited Ni-Ru alloys : morphological and catalytic study, J. Solid State Electrochem., 2019, 23, 3089–3097, DOI:10.1007/s10008-019-04374-7.
- Q. Zheng, R. Farrauto and A. Chau Nguyen, Adsorption and Methanation of Flue Gas CO2 with Dual Functional Catalytic Materials: A Parametric Study, Ind. Eng. Chem. Res., 2016, 55, 6768–6776, DOI:10.1021/acs.iecr.6b01275.
- S. Cimino, E. M. Cepollaro and L. Lisi, Sulfur tolerance and self-regeneration mechanism of Na-Ru/Al2O3 dual function material during the cyclic CO2 capture and catalytic methanation, Appl. Catal., B, 2022, 317, 121705, DOI:10.1016/j.apcatb.2022.121705.
Footnote |
| † Electronic supplementary information (ESI) available. See DOI: https://doi.org/10.1039/d2nr02688k |
| This journal is © The Royal Society of Chemistry 2022 |

