 Open Access Article
Creative Commons Attribution 3.0 Unported Licence
Carbon dot-based fluorescent antibody nanoprobes as brain tumour glioblastoma diagnostics†
Mattia
Ghirardello
 a,
Radhe
Shyam
a,
Xia
Liu
b,
Teodoro
Garcia-Millan
a,
Imke
Sittel
a,
Javier
Ramos-Soriano
a,
Kathreena M.
Kurian
a,
Radhe
Shyam
a,
Xia
Liu
b,
Teodoro
Garcia-Millan
a,
Imke
Sittel
a,
Javier
Ramos-Soriano
a,
Kathreena M.
Kurian
 *b and
M. Carmen
Galan
 *a
*a
aSchool of Chemistry, University of Bristol, Bristol, UK. E-mail: m.c.galan@bristol.ac.uk
bBristol Medical School, Public Health Sciences, Southmead Hospital, University of Bristol, Bristol, UK. E-mail: kathreena.kurian@bristol.ac.uk
First published on 3rd March 2022
Abstract
The development of efficient and sensitive tools for the detection of brain cancer in patients is of the utmost importance particularly because many of these tumours go undiagnosed until the disease has advanced and when treatment is less effective. Current strategies employ antibodies (Abs) to detect Glial Fibrillary Acid Protein (GFAP) in tissue samples, since GFAP is unique to the brain and not present in normal peripheral blood, and it relies on fluorescent reporters. Herein we describe a low cost, practical and general method for the labelling of proteins and antibodies with fluorescent carbon dots (CD) to generate diagnostic probes that are robust, photostable and applicable to the clinical setting. The two-step protocol relies on the conjugation of a dibenzocyclooctyne (DBCO)-functionalised CD with azide functionalised proteins by combining amide conjugation and strain promoted alkyne–azide cycloaddition (SPAAC) ligation chemistry. The new class of Ab-CD conjugates developed using this strategy was successfully used for the immunohistochemical staining of human brain tissues of patients with glioblastoma (GBM) validating the approach. Overall, these novel fluorescent probes offer a promising and versatile strategy in terms of costs, photostability and applicability which can be extended to other Abs and protein systems.
1. Introduction
Overall less than 20% of brain tumour patients are alive 5 years after diagnosis, in part because they present late with large inoperable tumours.1 There is an urgent need to develop new sensitive tests of brain tumours to help general practitioners in primary care.2 The most common malignant primary brain tumour called glioblastoma is characterised by abnormal blood vessels resulting in a leaky Blood–Brain Barrier (BBB).3 Glial Fibrillary Acid Protein (GFAP) is unique to the brain and not present in normal peripheral blood. Antibodies targeting GFAP are used to diagnose gliomas in tissue samples. There is evidence that GFAP crosses the leaky BBB and is an early non-specific peripheral blood biomarker which predates the clinical diagnosis of glioblastoma.4 However, GFAP levels are too low for routine detection by commonly used protein diagnostic tests such as ELISA, and more sensitive methods for its identification are needed.5Fluorescent labelling of proteins is a common strategy to investigate their role and function in cells, tissues and organisms.6 Traditional efforts rely on the use of molecular dyes, which are usually expensive and predisposed to photobleaching. Alternatively, fluorescent nanoparticles can be tuned to exhibit high stability, sensitivity and specificity for their desired target without the limitations of organic fluorophores and as a result these nanoprobes have found many applications as more robust tools in the areas of bioimaging, drug delivery and diagnostics.7
Among the different types of luminescent nanomaterials, carbon dots have emerged as a new class of carbon-based fluorescent nanomaterials with semi-spherical morphology, unique optical and physico-chemical properties such as chemical inertness, high water solubility, resistance to photobleaching, low cost of fabrication, and very low cytotoxicity.8 These carbon based fluorescent nanomaterials have been hailed as alternative probes to semiconductor quantum dots which have been linked to heavy metal toxicity which restricted their use in vivo applications.9 As a results, the use of carbon-based nanomaterials in biology as a platform for gene delivery,10 cell imaging,11 diagnosis,12 and as theranostics13 has raised a lot of interest.
CDs can be easily produced via the thermal degradation of readily available substances such as citric acid and ethylenediamine furnishing CDs with high fluorescent quantum yield. The fluorescent excitation and emission pattern of CDs can be tuned by changing the synthetic conditions, variables such as the kind of solvent, temperature and the ratio of precursors used during the preparation may provide different nanoparticles able to emit in different spectral regions.8b Therefore, the combination of these features makes of CDs excellent candidates for their use as fluorophores for Abs labelling. However, despite the great advantages offered by CDs for many biosensing applications including examples for GFAP detection,14 their use as fluorophores for Abs labelling is still underdeveloped and Ab conjugation strategies to CDs have not been fully developed for direct clinical applications.15
To this extent, we envisioned the use of fluorescent carbon dots (CDs) for the development of cheap and photostable probes for Abs functionalization that can be used for the detection of GFAP in clinical samples.
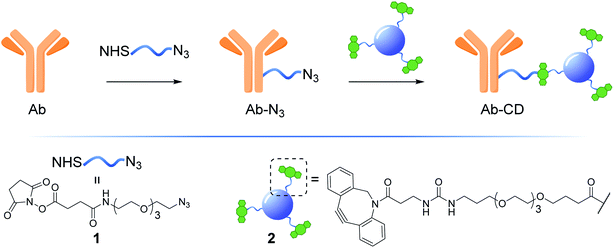
Herein, we describe the development of a practical, low cost and general strategy for the labelling of Abs with fluorescent CDs. This first generation of Ab-CD conjugates combines EDC and strain promoted alkyne–azide cycloaddition (SPAAC) ligation chemistry to generate a new class of Ab-CD conjugates which are robust and photostable (Fig. 1). Moreover, the clinical versatility of the novel Ab-probes is demonstrated in the immunohistochemical staining of human brain tissues of patients with glioblastoma GBM.
2. Results and discussion
2.1 Synthesis of dibenzocyclooctyne (DBCO)-functionalised fluorescent carbon dots
The synthesis of dibenzocyclooctyne (DBCO)-functionalised CD 2 ready to be conjugated to azido-decorated Abs started from acid functionalised CD 3, which were prepared in one pot from citric acid and ethylenediamine under microwave irradiation (domestic microwave oven, 300 W) following a modified procedure by Mondal et al.16 (Fig. 2A). The reaction mixture was dissolved in distilled H2O and precipitated in an excess of acetone several times to give acid-functionalized CDs, which after dialysis and centrifugal filtration (10 kDa molecular weight cut-off membrane) afforded blue emitting nanoparticles with a narrow size distribution as evidenced by fluorescence measurements (Fig. 2B). Indeed, TEM revealed the presence of quasi-spherical nanoparticles with an average size between 2–5 nm (N = 262) and a lattice interspacing of 0.34 nm (Fig. 2C) which correlate to a graphite core structure.17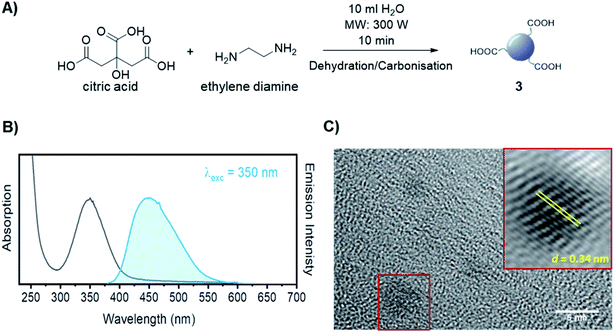 | ||
| Fig. 2 (A) Synthetic approach for the synthesis of acidic coated CDs 3. (B) Absorption and emission spectra of CD 3. (C) TEM image of CD 3. Lattice interspacing (d) for single dots is included. | ||
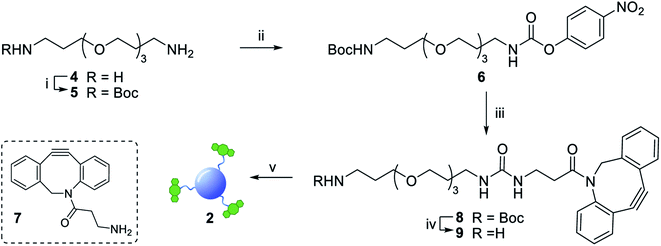
Functionalization of CD 3 with DBCO-linker 9, which was prepared in 4 steps and 47% overall yield, afforded DBCO-CDs 2 (Scheme 1). In brief, mono-amine protection of commercially available 4,7,10-trioxa-1,13-tridecanediamine 4 with Boc2O in CH2Cl2 gave 518 in 99% yield. The free amine in 5 was then reacted with 4-nitrophenyl chloroformate to form activated carbamate 6, which could then be treated with commercial DBCO-amine 7 to give 8 in 55% yield over the 2 steps. Boc deprotection in the presence of TFA/CH2Cl2 afforded 9 ready for CD conjugation. HATU mediated nanoparticle functionalization of acid coated CD 3 with 9 was carried out using a 1![[thin space (1/6-em)]](https://www.rsc.org/images/entities/char_2009.gif) :
:![[thin space (1/6-em)]](https://www.rsc.org/images/entities/char_2009.gif) 0.5 w/w ratio of 3:9, which was found to be optimum to ensure the nanoparticles remained in solution despite the hydrophobic coating. Furthermore, 1H, HSQC and Diffusion Ordered (DOSY) NMR spectroscopy analysis demonstrated the successful conjugation of DBCO moieties on the CD (see ESI Fig. S11–S13†). Moreover, the quantum yield measurements for CD 3 and DBCO-coated 9 was found to be 0.46 and 0.34, respectively (Fig. S20 in ESI†).
0.5 w/w ratio of 3:9, which was found to be optimum to ensure the nanoparticles remained in solution despite the hydrophobic coating. Furthermore, 1H, HSQC and Diffusion Ordered (DOSY) NMR spectroscopy analysis demonstrated the successful conjugation of DBCO moieties on the CD (see ESI Fig. S11–S13†). Moreover, the quantum yield measurements for CD 3 and DBCO-coated 9 was found to be 0.46 and 0.34, respectively (Fig. S20 in ESI†).
2.2 Protein conjugation strategy
There are several antibody-drug conjugation strategies available which include: amide formation, periodate oxidation of carbohydrates in the Fc region and subsequent functionalization of the novel aldehyde function produced within the glycosidic moiety, click reactions involving 1,3-dipolar cycloadditions, thiol maleimide conjugations and thiol-mediated alkylation among others.19 Among those, the EDC/NHS-promoted amide formation by targeting primary amines found on lysine residues, appears to be one of the most common and direct approaches for nanoparticle loading.14a,20 Control over the Ab/nanoparticle loading ratio to avoid the over functionalization of the Ab, as well as the type and length of spacer molecule between the probe and Ab are essential to avoid loss of protein's pharmacokinetic properties. Moreover, excessive labelling may also interfere with the antigen-biding event. In this context, an Ab/drug ratio of around 1![[thin space (1/6-em)]](https://www.rsc.org/images/entities/char_2009.gif) :
:![[thin space (1/6-em)]](https://www.rsc.org/images/entities/char_2009.gif) 4 is found to be optimal21 and this parameter was considered in the preparation of our Ab-CD conjugates. NHS activated conjugation represents the golden standard as it allows for a fast and reliable Abs covalent functionalization, NHS-functionalised molecules react with solvent exposed primary amines such as lysine residues on the surface of the Abs.22 Taking into account the above considerations, NHS-linker 1 (for its preparation see ESI Section 3.3†)23 featuring an azido motif that can selectively react with the DBCO-CD 2. Moreover, both 1 and 2 were designed with a triethylene glycol spacer to help with water solubility and to reduce steric hindrance between the Ab and the surface of the CD.
4 is found to be optimal21 and this parameter was considered in the preparation of our Ab-CD conjugates. NHS activated conjugation represents the golden standard as it allows for a fast and reliable Abs covalent functionalization, NHS-functionalised molecules react with solvent exposed primary amines such as lysine residues on the surface of the Abs.22 Taking into account the above considerations, NHS-linker 1 (for its preparation see ESI Section 3.3†)23 featuring an azido motif that can selectively react with the DBCO-CD 2. Moreover, both 1 and 2 were designed with a triethylene glycol spacer to help with water solubility and to reduce steric hindrance between the Ab and the surface of the CD.
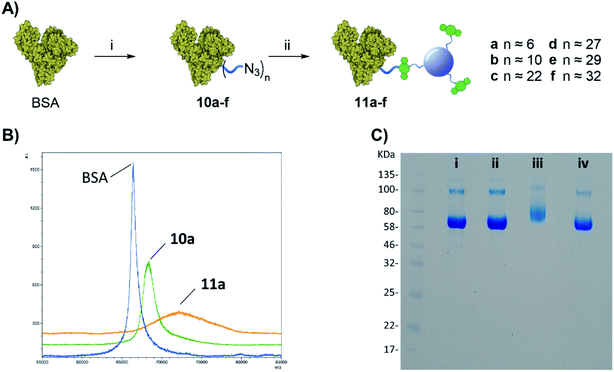
Once the protein is decorated with the azido functionalities, chemoselective Cu-free click conjugation with DBCO-CD 2 was attempted in PBS by mixing 10a (BSA with 6 N3-linker units) and 2 at room temperature for 16 h. A 5-fold excess of 2 in weight with respect to the protein was used to ensure all the available N3 moieties were conjugated. Following spin filtration (30 kDa cut-off membrane) to remove the excess of 2, BSA-CD conjugate 11a was obtained as determined by MALDI (Fig. 3B). The conjugation of CDs to BSA caused a shift toward larger molecular weights and a broadening of the peak as expected from protein conjugation with a disperse nanoparticle system such as our CDs.25
Gel electrophoresis was also used to further confirm the effective BSA-CDs conjugation, by allowing us to compare the MW of the different protein adducts (Fig. 3C). Whereas the addition of 6 low molecular weight (MW) N3-linkers on 10a did not show any significant changes on the gel when compared to with native BSA (Fig. 2C, i vs. ii), a noticeable increase in MW was shown for the BSA-CD adduct 11a (Fig. 3C, i vs. iii), which further validates the MALDI data. Gel electrophoresis analysis of BSA-N3 derivatives 10b–f was also possible (see ESI Fig. S22†).
Moreover, to exclude the possibility of non-specific BSA adsorption on CD nanoparticles, unfunctionalized BSA, which lacks azido motifs, and DBCO-CDs were pre-mixed together and run on the same well showing no MW changes with respect to BSA alone (Fig. 3C, ivs. iv) which demonstrated the chemospecific labelling of the protein via SPAAC reaction.
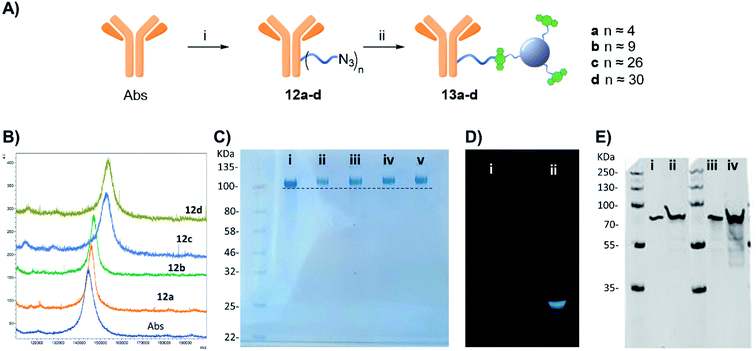
Furthermore, western blot analysis using human GFAP with 13a (functionalised with 4 linker units) was used to demonstrate the novel anti-GFAP Ab-CD 13a adducts retained their ability to recognise the target antigen. To that end, a goat anti-rabbit secondary antibody equipped with a near IR probe was used on the western blot, confirming the presence of the rabbit anti-GFAP Abs bound to the human GFAP antigen (Fig. 4E).27
2.3 Anti-GFAP Abs-CD immunostaining of clinical tissue brain cancer patient samples
GFAP immunostaining is the most commonly used method to examine the distribution of astrocytes and the hypertrophy of astrocytes in response to neural degeneration or injury as in the development of glioblastoma.4 To demonstrate the versatility of our CD-based Ab labels for diagnosis applications, we have examined GFAP in 13 formalin-fixed paraffin embedded biopsy brain tumour samples from different patients (12 glioblastoma, IDH wildtype, WHO Grade 4 and 1 negative control schwannoma, WHO Grade I, see ESI: Table S3†) using our conjugated antibody 13a (Fig. 5). We identified immunofluorescence within all the glioblastoma cases (as assessed by a consultant neuropathologist KMK) using the conjugated anti-GFAP antibody 13a (Fig. 5A and B, for the complete set of pictures see ESI Fig. S27†). We identified the correct pattern of cytoplasmic staining (blue) of the GFAP intermediate filament in the glioblastoma cell cytoplasm (Fig. 5A and B). The intensity and extent of GFAP immunopositivity showed inter and intra-tumoural heterogeneity in keeping with known biological variation between cases. The negative control schwannoma showed no positive staining using the conjugated GFAP antibody as expected (Fig. 5C). There was no variation of GFAP staining with age, sex or molecular parameters within the small cohort as expected. In addition, control labelling experiments of glioblastoma samples with CD-DBCO 2 without the Abs, showed no labelling further demonstrating that Abs-CD 13a is responsible for the labelling observed (see ESI, Fig. S26a†).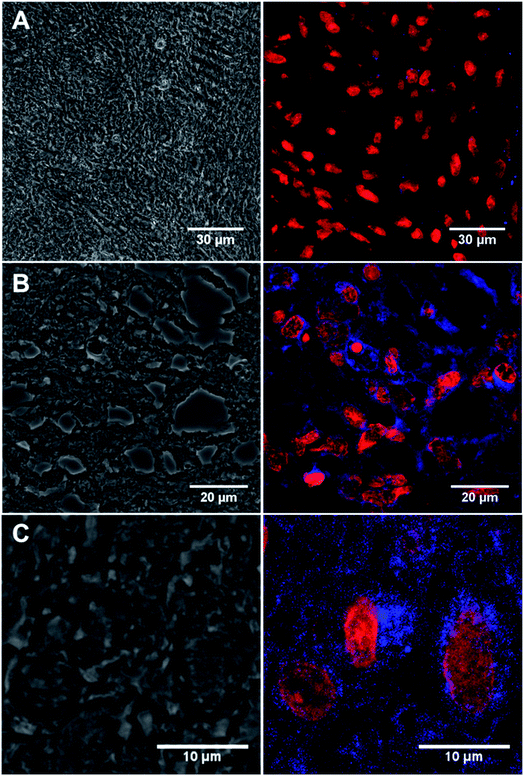 | ||
| Fig. 5 (A) Confocal image of the negative control benign schwannoma stained with Anti-GFAP Abs-CD 13a showing immunofluorescence red labelling nuclei and negative for blue GFAP staining (patient ID: N1214A1). (B) Immunostained tissue section of malignant brain tumour glioblastoma stained with 13a showing immunofluorescence red labelling nuclei and blue labelling cobweb pattern of intermediate filament GFAP (patient ID: 08/0160b). (C) Magnified view of 13a labelled tissue section of malignant brain tumour glioblastoma showing blue immunopositivity in a single cell (patient id: 10/0053). Left panel = bright field showing monolayer. Right panel = anti-GAFP Abs-CD probe 13a labelled tissue. For full scale pictures of A, B and C refer to ESI, Fig. S27A, K and G† respectively. | ||
As a comparison, Invitrogen SiteClick Qdot 625 antibody labeling kit was also used to label anti-GFAP Ab, however anti-GFAP Ab-QD probes tended to precipitate and a stable suspension was only possible for a few minutes after preparation. Moreover, labelling of brain tumour samples with ab-functionalised-QDs lead to low levels of labelling when compared to our CD-probes and most of the labelling is associated to necrotic tissue. In addition, unfunctionalized acid coated QDs (Qdot™ 625 ITK™ carboxyl quantum dots), as a negative control, showed wide spread non-specific labelling in brain tissue samples. These results further validate the utility of using CDs as the fluorescent platform (Fig. S28 in ESI†).
3. Conclusions
In summary, we have successfully developed a new class of carbon dot-based fluorescence labels that can be “clicked” onto suitably functionalised proteins such as Abs in a chemoselective manner. The two-step strategy relies on the used DBCO-functionalised CDs and azide-functionalised proteins that can be easily prepared by simple amide conjugation methods from suitably functionalised linkers with control over degree of functionalization. The novel anti-GFAP Abs-CD probes developed here retained their ability to interact with the human GFAP. Moreover, we have demonstrated our novel probes show reliable binding in a range of clinical malignant brain tumour glioblastoma cases, in tissue sections. Overall, this new class of probes offer a promising and versatile strategy in terms of costs, photostability and applicability which can be extended to other Abs and protein systems. This type of cheap and rapid nanoparticle tests have the potential to pave the way for novel strategies to identify the presence of tumour markers such as GFAP in clinical samples to support early diagnosis of brain tumours in primary care. Early diagnosis would potentially improve survival and reduce anxiety in these patients by giving them more surgical and treatment options earlier in the course of their disease.4. Materials and methods
4.1 General experimental
Reagents and solvents were purchased as reagent grade from Sigma Aldrich or ThermoFisher and used without further purification. For column chromatography, silica gel 60 (230–400 mesh, 0.040–0.063 mm) was purchased from Merck and for gel filtration Sephadex G-25 from GE Healthcare. Thin Layer Chromatography (TLC) was performed on aluminium sheets coated with silica gel 60 F254 purchased from Merck. Dialysis was performed with Cole-Parmer Spectra Por Dialysis Tubing, 500–1000 MWCO. Centrifugal spin filtration was performed on Amicon Ultra-0.5 mL purchased from Merck. Carbon dots were prepared using a domestic microwave oven (300 W). NMR spectra were recorded on Bruker AV 400 MHz or AV 500 MHz spectrometers, using the residual solvent peaks as internal reference at 298 K. Chemical shifts are reported as parts per million and coupling constants (J) given in Hertz. All the assignments were confirmed by one- and two-dimensional NMR experiments (DEPT, COSY, HSQC). Mass spectra were obtained by the University of Bristol mass spectrometry service using electrospray ionisation (ESI) acquired on a Micromass LCT mass spectrometer or aVG Quattro mass spectrometer and MALDI spectra were acquired on Bruker ultrafleXtreme 2 (TOF). Zeta potential analysis was carried out using Malvern Instruments Nano-Z ZEN 2600 and conducted in distilled H2O at a concentration of 4 mg mL−1. BSA was purchased from ThermoFisher (23209). Polyclonal Rabbit Anti-Glial Fibrillary Acidic Protein was purchased from Agilent Dako (Z033401-2). Recombinant Human GFAP protein, used in the western blot test was purchased from abcam (ab114149). Secondary IRDye® 680RD Goat anti-Rabbit IgG used in the western blot test were purchased by LI-COR. Human brain tissue samples were kindly provided by the Southmead Hospital, (University of Bristol, UK).4.2 Chemical synthesis
![[thin space (1/6-em)]](https://www.rsc.org/images/entities/char_2009.gif) :
:![[thin space (1/6-em)]](https://www.rsc.org/images/entities/char_2009.gif) 0 to 3
0 to 3![[thin space (1/6-em)]](https://www.rsc.org/images/entities/char_2009.gif) :
:![[thin space (1/6-em)]](https://www.rsc.org/images/entities/char_2009.gif) 7, v/v) furnishing 6 (2.08 g, 87% yield) as a transparent syrup. 1H NMR (500 MHz, chloroform-d) δ 8.27–8.20 (m, 2H, Ar), 7.35–7.27 (m, 2H, Ar), 6.12 (s, 1H, NH), 4.89 (s, 1H, NH), 3.69–3.62 (m, 8H, OCH2), 3.59 (dd, J = 5.8, 3.5 Hz, 2H, OCH2), 3.51 (t, J = 6.0 Hz, 2H, OCH2), 3.42 (q, J = 6.0 Hz, 2H, NCH2), 3.21 (q, J = 6.5 Hz, 2H, NCH2), 1.87 (h, J = 6.0 Hz, 2H, CH2CH2CH2), 1.77–1.69 (m, 2H, CH2CH2CH2), 1.43 (s, 9H, CH3). 13C NMR (126 MHz, CDCl3) δ 156.3, 156.2, 153.4, 144.8, 125.2, 122.1, 79.2, 70.7, 70.7, 70.4, 70.3, 70.1, 69.7, 40.2, 38.6, 29.8, 29.1, 28.6. HRMS (ESI) m/z: calcd for C22H35N3O9Na (M + Na)+ 508.2265, found 508.2279.
7, v/v) furnishing 6 (2.08 g, 87% yield) as a transparent syrup. 1H NMR (500 MHz, chloroform-d) δ 8.27–8.20 (m, 2H, Ar), 7.35–7.27 (m, 2H, Ar), 6.12 (s, 1H, NH), 4.89 (s, 1H, NH), 3.69–3.62 (m, 8H, OCH2), 3.59 (dd, J = 5.8, 3.5 Hz, 2H, OCH2), 3.51 (t, J = 6.0 Hz, 2H, OCH2), 3.42 (q, J = 6.0 Hz, 2H, NCH2), 3.21 (q, J = 6.5 Hz, 2H, NCH2), 1.87 (h, J = 6.0 Hz, 2H, CH2CH2CH2), 1.77–1.69 (m, 2H, CH2CH2CH2), 1.43 (s, 9H, CH3). 13C NMR (126 MHz, CDCl3) δ 156.3, 156.2, 153.4, 144.8, 125.2, 122.1, 79.2, 70.7, 70.7, 70.4, 70.3, 70.1, 69.7, 40.2, 38.6, 29.8, 29.1, 28.6. HRMS (ESI) m/z: calcd for C22H35N3O9Na (M + Na)+ 508.2265, found 508.2279.
![[thin space (1/6-em)]](https://www.rsc.org/images/entities/char_2009.gif) :
:![[thin space (1/6-em)]](https://www.rsc.org/images/entities/char_2009.gif) 0 to 9
0 to 9![[thin space (1/6-em)]](https://www.rsc.org/images/entities/char_2009.gif) :
:![[thin space (1/6-em)]](https://www.rsc.org/images/entities/char_2009.gif) 1, v/v) furnishing 8 (116 mg, 63% yield) as a transparent oil. 1H NMR (500 MHz, chloroform-d) δ 7.66 (d, J = 7.6 Hz, 1H, Ar), 7.42–7.23 (m, 7H, Ar), 5.12 (d, J = 13.9 Hz, 1H, CH2aDBCO), 5.05 (s, 1H, NH), 5.00 (d, J = 6.3 Hz, 1H, NH), 4.86 (s, 1H, NH), 3.69–3.47 (m, 13H, CH2bDBCO, OCH2), 3.30–3.10 (m, 6H, NCH2), 2.56–2.48 (m, 1H, COCH2), 1.98–1.84 (m, 1H, COCH2), 1.79–1.63 (m, 4H, NCH2CH2CH2), 1.42 (s, 9H, CH3). 13C NMR (126 MHz, CDCl3) δ 172.5, 158.3, 156.1, 151.2, 148.1, 132.1, 129.2, 128.6, 128.2, 128.2, 127.7, 127.1, 125.5, 123.1, 122.5, 114.7, 107.9, 70.5, 70.4, 70.1, 69.8, 69.5, 69.4, 55.5, 38.4, 36.1, 35.6, 29.6, 29.5, 28.4. HRMS (ESI) m/z: calcd for C34H47N4O7Na (M + Na)+ 645.3259, found 645.3236.
1, v/v) furnishing 8 (116 mg, 63% yield) as a transparent oil. 1H NMR (500 MHz, chloroform-d) δ 7.66 (d, J = 7.6 Hz, 1H, Ar), 7.42–7.23 (m, 7H, Ar), 5.12 (d, J = 13.9 Hz, 1H, CH2aDBCO), 5.05 (s, 1H, NH), 5.00 (d, J = 6.3 Hz, 1H, NH), 4.86 (s, 1H, NH), 3.69–3.47 (m, 13H, CH2bDBCO, OCH2), 3.30–3.10 (m, 6H, NCH2), 2.56–2.48 (m, 1H, COCH2), 1.98–1.84 (m, 1H, COCH2), 1.79–1.63 (m, 4H, NCH2CH2CH2), 1.42 (s, 9H, CH3). 13C NMR (126 MHz, CDCl3) δ 172.5, 158.3, 156.1, 151.2, 148.1, 132.1, 129.2, 128.6, 128.2, 128.2, 127.7, 127.1, 125.5, 123.1, 122.5, 114.7, 107.9, 70.5, 70.4, 70.1, 69.8, 69.5, 69.4, 55.5, 38.4, 36.1, 35.6, 29.6, 29.5, 28.4. HRMS (ESI) m/z: calcd for C34H47N4O7Na (M + Na)+ 645.3259, found 645.3236.
![[thin space (1/6-em)]](https://www.rsc.org/images/entities/char_2009.gif) :
:![[thin space (1/6-em)]](https://www.rsc.org/images/entities/char_2009.gif) 5, v/v) and stirred for 1.5 h at room temperature. The reaction was concentrated under reduced pressure and the residue was purified by column chromatography on silica gel (CHCl3/MeOH 1
5, v/v) and stirred for 1.5 h at room temperature. The reaction was concentrated under reduced pressure and the residue was purified by column chromatography on silica gel (CHCl3/MeOH 1![[thin space (1/6-em)]](https://www.rsc.org/images/entities/char_2009.gif) :
:![[thin space (1/6-em)]](https://www.rsc.org/images/entities/char_2009.gif) 0 to 95
0 to 95![[thin space (1/6-em)]](https://www.rsc.org/images/entities/char_2009.gif) :
:![[thin space (1/6-em)]](https://www.rsc.org/images/entities/char_2009.gif) 5, containing a 0.5% of 35% aq. HN4OH solution v/v/v) furnishing 9 (84 mg, 86% yield) as a pale brown oil. 1H NMR (500 MHz, D2O25 °C) δ 7.63 (d, J = 7.7 Hz, 1H, Ar), 7.46–7.35 (m, 6H, Ar), 7.29–7.23 (m, 1H, Ar), 5.02 (d, J = 14.5 Hz, 1H, CH2aDBCO), 3.72–3.61 (m, 11H, CH2bDBCO, OCH2), 3.52 (t, J = 6.4 Hz, 2H, OCH2), 3.14–2.95 (m, 6H, NCH2), 2.32–2.16 (m, 2H, CH2CO), 1.94 (dt, J = 13.5, 6.4 Hz, 2H, NCH2CH2CH2), 1.67 (p, J = 6.6 Hz, 2H, NCH2CH2CH2). 13C NMR (126 MHz, D2O25 °C) δ 174.3, 159.7, 150.6, 147.7, 131.9, 129.1, 129.1, 128.9, 128.5, 128.1, 127.0, 125.7, 122.4, 121.6, 114.3, 107.8, 69.6, 69.5, 69.4, 69.3, 68.5, 68.3, 55.5, 37.6, 36.8, 36.3, 34.7, 29.0, 26.5. HRMS (ESI) m/z: calcd for C29H39N4O5 (M + H)+ 523.2915, found 523.2927.
5, containing a 0.5% of 35% aq. HN4OH solution v/v/v) furnishing 9 (84 mg, 86% yield) as a pale brown oil. 1H NMR (500 MHz, D2O25 °C) δ 7.63 (d, J = 7.7 Hz, 1H, Ar), 7.46–7.35 (m, 6H, Ar), 7.29–7.23 (m, 1H, Ar), 5.02 (d, J = 14.5 Hz, 1H, CH2aDBCO), 3.72–3.61 (m, 11H, CH2bDBCO, OCH2), 3.52 (t, J = 6.4 Hz, 2H, OCH2), 3.14–2.95 (m, 6H, NCH2), 2.32–2.16 (m, 2H, CH2CO), 1.94 (dt, J = 13.5, 6.4 Hz, 2H, NCH2CH2CH2), 1.67 (p, J = 6.6 Hz, 2H, NCH2CH2CH2). 13C NMR (126 MHz, D2O25 °C) δ 174.3, 159.7, 150.6, 147.7, 131.9, 129.1, 129.1, 128.9, 128.5, 128.1, 127.0, 125.7, 122.4, 121.6, 114.3, 107.8, 69.6, 69.5, 69.4, 69.3, 68.5, 68.3, 55.5, 37.6, 36.8, 36.3, 34.7, 29.0, 26.5. HRMS (ESI) m/z: calcd for C29H39N4O5 (M + H)+ 523.2915, found 523.2927.
![[thin space (1/6-em)]](https://www.rsc.org/images/entities/char_2009.gif) :
:![[thin space (1/6-em)]](https://www.rsc.org/images/entities/char_2009.gif) acetone 1
acetone 1![[thin space (1/6-em)]](https://www.rsc.org/images/entities/char_2009.gif) :
:![[thin space (1/6-em)]](https://www.rsc.org/images/entities/char_2009.gif) 1 (4x times). The residue was then phase-separated by centrifugation and re-dissolved in 15 mL of distilled H2O. The CD solution was dialysed in H2O using 0.5–1 kDa MWCO Biotech Cellulose Ester membrane. The concentrate CD solution was then lyophilised to yield 1.1 g of CD as an amber powder. To remove high MW components the 100 mg of CD were redissolved in H2O and filtered over Amicon Ultra spin filtration (10 kDa cut-off membrane) and liophilized furnishing 92 mg of CD as an amber powder. Procedure modified from the one reported by Mondal et al.16 See SI for full characterization.
1 (4x times). The residue was then phase-separated by centrifugation and re-dissolved in 15 mL of distilled H2O. The CD solution was dialysed in H2O using 0.5–1 kDa MWCO Biotech Cellulose Ester membrane. The concentrate CD solution was then lyophilised to yield 1.1 g of CD as an amber powder. To remove high MW components the 100 mg of CD were redissolved in H2O and filtered over Amicon Ultra spin filtration (10 kDa cut-off membrane) and liophilized furnishing 92 mg of CD as an amber powder. Procedure modified from the one reported by Mondal et al.16 See SI for full characterization.
4.3 General protein/Abs conjugation procedure
Step 1 – azide functionalization: to a solution of protein in PBS (100 μL, 36.1 μM for BSA or 100 μL, 11.1 μM Abs), different amounts of compound 1 (0.1 mg μL−1 in DMSO stock solution) from 0.14 to 4.81 μmol for BSA and 0.12–2.41 μmol for Abs, were added, respectively (see Tables S1 and S2†). The final solution was mixed in a shaker at 400 rpm for 4 h at room temperature. The product was purified via spin-filtration using 30 kDa or 50 kDa cut-off membrane for BSA or Abs respectively, at 4000 g per 20 minutes. The concentrated protein solution was diluted with 100 μL of PBS and concentrated again; this washing step was repeated two more times to remove unbound linker 1 and by-products of the reaction, furnishing a concentrated 10a–f or 12a–d for BSA and Abs derivatives respectively.Step 2 – CD-conjugation: the concentrated 10a–f or 12a–d solution prepared in Step 1 was diluted with 100 μL of a PBS solution containing DBCO-CD 2(2 mg mL−1) mixed in a shaker at 400 rpm for 16 h at room temperature. The product was purified via spin-filtration using 30 kDa or 50 kDa cut-off membrane for BSA or the Abs respectively, at 4000 g per 20 minutes. The concentrated protein solution was diluted with 100 μL of PBS and concentrated again; this washing step was repeated three more times to remove the excess of 2(4 washing steps were judged enough to remove the excess of 2since no fluorescence was detected by the naked eye in the washing solution passing through the membrane under UV lamp in the last wash), furnishing a concentrated 11a–f or 13a–d solution.
4.4 Gel electrophoresis
SDS-PAGE on 4–12% NuPage gels (Life Technologies) was performed for labelled and unlabelled protein/Abs samples. Loading dye was added to each sample and heated at 100 °C for 5 minutes. SeeBlue™ (ThermoFisher Scientific) was used as a ladder. Lanes were loaded at similar protein concentrations and the gel was run with MES buffer at 180 V for 40 minutes. The images were acquired after staining with Pageblue (ThermoFisher Scientific/Pierce) protein staining solution.4.5 Western blot analysis
Recombinant human GFAP protein were run on 12% SDS-PAGE and transferred onto membrane via Trans-Blot Turbo Transfer System (BIO-RAD). Membrane was incubated in blocking buffer (PBS, 0.1% Tween and 2% milk) for one hour and then incubated in primary anti-GFAP antibodies or anti-GFAP-CD conjugates 13a (results and discussion) overnight in the cold room. Membranes were washed and then incubated in secondary antibodies for one hour. The membranes were washed and then visualized on a LI-COR Odyssey imaging system.4.6 Tissue staining protocol for GFAP immunofluorescence with Abs-CD 13a
The tissue sections were deparaffinized and rehydrated as follows, the sections were incubated in three washes of xylene for 2 min each, followed by two washes of 100%, 95% ethanol for 10 min each. The sections were then washed twice in distilled H2O for 5 min each.The tissue slides were then placed in the microwaveable vessel. Tris–EDTA antigen retrieval buffer (10 mM Tris base, 1 mM EDTA solution, 0.05% Tween 20, pH 9.0) was added and placed inside a dedicated domestic microwave, which was set to full power (950 W) until the solution came to a boil. The solution was boiled for 20 min from this point and left on the bench at room temp to cool for 30 min. The slides were then washed 2 × 5 min with TBS plus 0.025% Triton X-100 with gentle agitation. The slides were blocked in Superblock buffer (Thermofisher, ref. 37515) 30 min at room temp. The slides were drained for a few seconds (not rinsed) and wiped around the sections with tissue paper. 400 μl of CDs-conjugated GFAP antibody 13a (1![[thin space (1/6-em)]](https://www.rsc.org/images/entities/char_2009.gif) :
:![[thin space (1/6-em)]](https://www.rsc.org/images/entities/char_2009.gif) 500) were then added per slide and incubated at 4 °C overnight. The slides were then rinsed 3 × 5 min with TBS plus 0.05% Tween20.
500) were then added per slide and incubated at 4 °C overnight. The slides were then rinsed 3 × 5 min with TBS plus 0.05% Tween20.
4.7 Confocal microscopy
Optical microscope images were acquired on a Leica DMIL Led Fluo microscope. Confocal microscope images were acquired on a Leica DMi8 inverted epifluorescence microscope using 405 nm and tuneable white light lasers and 63× (NA 1.4) objective at the Wolfson Imaging facility at the University of Bristol. The images were analysed using Fiji (ImageJ) software.Conflicts of interest
There are no conflicts of interest to declare.Acknowledgements
The authors thank Cancer Research UK (grant number C30758/A2979). TGM thanks EPSRC BCFN EP/L016648/1/Conacyt. This research was also funded by the European Research Council (MCG), grant number ERC-COG:648239 and by the MSCA fellowship project 843720-BioNanoProbes (JRS). The authors thank Dr Katy Jepson and the Wolfson Bioimaging Facility for her assistance in this work.References
- M. Ozawa, P. M. Brennan, K. Zienius, K. M. Kurian, W. Hollingworth, D. Weller, W. Hamilton, R. Grant and Y. Ben-Shlomo, Fam. Pract., 2018, 35, 551–558 CrossRef PubMed.
- Neuro-oncology Top 10 priorities http://www.jla.nihr.ac.uk/priority-setting-partnerships/neurooncology/top-10-priorities/ Search PubMed.
- (a) C. Faulkner, A. Palmer, H. Williams, C. Wragg, H. R. Haynes, P. White, R. M. DeSouza, M. Williams, K. Hopkins and K. M. Kurian, Br. J. Neurosurg., 2015, 29, 23–29 CrossRef PubMed; (b) A. Harland, X. Liu, M. Ghirardello, M. C. Galan, C. M. Perks and K. M. Kurian, Front. Oncol., 2021, 11, 743814 CrossRef PubMed.
- J. Tichy, S. Spechtmeyer, M. Mittelbronn, E. Hattingen, J. Rieger, C. Senft and C. Foerch, J. Neuro-Oncol., 2016, 126, 361–369 CrossRef CAS PubMed.
- (a) K. M. Kurian, Y. Zhang, H. R. Haynes, N. A. Macaskill and M. Bradley, Clin. Neuroradiol., 2014, 24, 231–238 CrossRef CAS PubMed; (b) L. Z. Xu, S. Ramadan, O. E. Akingbade, Y. Z. Zhang, S. Alodan, N. Graham, K. A. Zimmerman, E. Torres, A. Heslegrave, P. K. Petrov, H. Zetterberg, D. J. Sharp, N. Klein and B. Li, ACS Sens., 2022, 7, 253–262 CrossRef CAS PubMed.
- K. A. Giuliano and D. L. Taylor, Trends Biotechnol., 1998, 16, 135–140 CrossRef CAS PubMed.
- H. Zhu, J. Fan, J. Du and X. Peng, Acc. Chem. Res., 2016, 49, 2115–2126 CrossRef CAS PubMed.
- (a) S. A. Hill, D. Benito-Alifonso, D. J. Morgan, S. A. Davis, M. Berry and M. C. Galan, Nanoscale, 2016, 8, 18630–18634 RSC; (b) S. Hill and M. C. Galan, Beilstein J. Org. Chem., 2017, 13, 675–693 CrossRef CAS PubMed; (c) S. A. Hill, D. Benito-Alifonso, S. A. Davis, D. J. Morgan, M. Berry and M. C. Galan, Sci. Rep., 2018, 8(1), 12234 CrossRef PubMed; (d) X. Y. Xu, R. Ray, Y. L. Gu, H. J. Ploehn, L. Gearheart, K. Raker and W. A. Scrivens, J. Am. Chem. Soc., 2004, 126, 12736–12737 CrossRef CAS PubMed; (e) B. Y. Wang and S. Y. Lu, Matter, 2022, 5, 110–149 CrossRef CAS; (f) C. He, P. Xu, X. H. Zhang and W. J. Long, Carbon, 2022, 186, 91–127 CrossRef CAS.
- A. M. Derfus, W. C. W. Chan and S. N. Bhatia, Nano Lett., 2004, 4, 11–18 CrossRef CAS PubMed.
- L. M. Hu, Y. Sun, S. L. Li, X. L. Wang, K. L. Hu, L. R. Wang, X. J. Liang and Y. Wu, Carbon, 2014, 67, 508–513 CrossRef CAS.
- S. N. Baker and G. A. Baker, Angew. Chem., Int. Ed., 2010, 49, 6726–6744 CrossRef CAS PubMed.
- (a) H. Ali, S. K. Bhunia, C. Dalal and N. R. Jana, ACS Appl. Mater. Interfaces, 2016, 8, 9305–9313 CrossRef CAS PubMed; (b) J. Bartelmess, S. J. Quinn and S. Giordani, Chem. Soc. Rev., 2015, 44, 4672–4698 RSC.
- (a) D. P. O'Neal, L. R. Hirsch, N. J. Halas, J. D. Payne and J. L. West, Cancer Lett., 2004, 209, 171–176 CrossRef PubMed; (b) S. A. Hill, S. Sheikh, Q. Y. Zhang, L. S. Ballesteros, A. Herman, S. A. Davis, D. J. Morgan, M. Berry, D. Benito-Alifonsoa and M. C. Galan, Nanoscale Adv., 2019, 1, 2840–2846 RSC; (c) M. Ghirardello, J. Ramos-Soriano and M. C. Galan, Nanomaterials, 2021, 11, 1877 CrossRef CAS PubMed.
- (a) C. Y. Ji, Y. Q. Zhou, R. M. Leblanc and Z. L. Peng, ACS Sens., 2020, 5, 2724–2741 CrossRef CAS PubMed; (b) Y. S. Ma, G. H. Xu, F. D. Wei, Y. Cen, Y. Y. Song, Y. J. Ma, X. M. Xu, M. L. Shi, M. Sohail and Q. Hu, Nanotechnology, 2018, 29, 145501 CrossRef PubMed.
- (a) S. Jampasa, N. Ngamrojanavanich, S. Rengpipat, O. Chailapakul, K. Kalcher and S. Chaiyo, Biosens. Bioelectron., 2021, 188, 113323 CrossRef CAS PubMed; (b) L. Zhu, X. Cui, J. Wu, Z. Wang, P. Wang, Y. Hou and M. Yang, Anal. Methods, 2014, 6, 4430–4436 RSC; (c) C. Zhang, X. Yu, X. Shi, Y. Han, Z. Guo and Y. Liu, Food Anal. Methods, 2020, 13, 1042–1049 CrossRef; (d) S. Mohammadi, A. Salimi, S. Hamd-Ghadareh, F. Fathi and F. Soleimani, Anal. Biochem., 2018, 557, 18–26 CrossRef CAS PubMed.
- S. Mondal, A. Yucknovsky, K. Akulov, N. Ghorai, T. Schwartz, H. N. Ghosh and N. Amdursky, J. Am. Chem. Soc., 2019, 141, 15413–15422 CrossRef CAS PubMed.
- S. Qu, X. Wang, Q. Lu, X. Liu and L. Wang, Angew. Chem., Int. Ed. Engl., 2012, 51, 12215–12218 CrossRef CAS PubMed.
- D. Benito-Alifonso, B. Richichi, V. Baldoneschi, M. Berry, M. Fragai, G. Salerno, M. C. Galan and C. Nativi, ACS Omega, 2018, 3, 9822–9826 CrossRef CAS PubMed.
- (a) V. Chudasama, A. Maruani and S. Caddick, Nat. Chem., 2016, 8, 114–119 CrossRef CAS PubMed; (b) N. G. Welch, J. A. Scoble, B. W. Muir and P. J. Pigram, Biointerphases, 2017, 12, 02D301 CrossRef PubMed.
- D. Leung, J. M. Wurst, T. Liu, R. M. Martinez, A. Datta-Mannan and Y. Feng, Antibodies, 2020, 9(1), 2 CrossRef CAS PubMed.
- N. Diamantis and U. Banerji, Br. J. Cancer, 2016, 114, 362–367 CrossRef CAS PubMed.
- (a) P. Akkapeddi, S.-A. Azizi, A. M. Freedy, P. M. S. D. Cal, P. M. P. Gois and G. J. L. Bernardes, Chem. Sci., 2016, 7, 2954–2963 RSC; (b) P. Dennler, E. Fischer and R. Schibli, Antibodies, 2015, 4, 197–224 CrossRef.
- K. M. Hamill, E. Wexselblatt, W. Tong, J. D. Esko and Y. Tor, J. Mater. Chem. B, 2016, 4, 5794–5797 RSC.
- L. Signor and E. Boeri Erba, JoVE, 2013, e50635 Search PubMed.
- Although all azido moieties can react on the protein and be labelled with 2, this is just an approximation. Due to the molecular complexity and polydispersity of the CDs, their MW is unknown as steric hindrance might interfere with conjugation..
- On the other hand, ionization of the Ab-CD conjugates probe inneficient on MALDI which hamper the spectrometric validation of the CD-Ab adducts, however gel electrophorosis allowed the validation of the conjugation step. Thus the combination of both techniques is crucial for the characterization of the probes..
- Due to the autofluorescence of the gel, it was not possible to directly detect the presence of Ab-CDs using the inherent CDs fluorescence..
Footnote |
| † Electronic supplementary information (ESI) available. See DOI: 10.1039/d2na00060a |
| This journal is © The Royal Society of Chemistry 2022 |

