 Open Access Article
Creative Commons Attribution 3.0 Unported Licence
Resolving nanoscopic structuring and interfacial THz dynamics in setting cements†
Fu V. Songa,
Bin Yangb,
Devis Di Tommaso a,
Robert S. Donnanc,
Gregory A. Chass
 *ade,
Rickey Y. Yadad,
David H. Farrare and
Kun V. Tian
 *def
*def
aDepartment of Chemistry, School of Physical and Chemical Sciences, Queen Mary University of London, London, E1 4NS, UK. E-mail: g.chass@qmul.ac.uk
bFaculty of Science and Engineering, University of Chester, Chester, CH1 4BJ, UK
cSchool of Electronic and Electrical Engineering, Queen Mary University of London, London, E1 4NS, UK
dFaculty of Land and Food Systems, The University of British Columbia, Vancouver V6T 1Z4, Canada
eDepartment of Chemistry and Biological Chemistry, McMaster University, Hamilton, L8S 4L8, Canada
fDepartment of Chemistry and Chemical sciences of Pharmacy, Sapienza University of Rome, Roma 00186, Italy. E-mail: kun.tian@uniroma1.it; tiankv@mcmaster.ca
First published on 16th May 2022
Abstract
The setting dynamics of two commercial cements have been tracked over >24 hours of setting with non-destructive THz spectroscopy and neutron scattering. Two established glass ionomer cements (GICs) were measured, both exhibiting similar and commercially agreeable non-linear settings associated with changes in interfacial particle dynamics through variations in their collective low-energy vibrations. Structural evolutions in the ∼1–30 nm range were correlated with changes in small angle neutron scattering (SANS) profiles over setting. Accompanying models of the interfacial structures and the amorphous glass components of the cements helped make the dynamic and structural trends comprehensible. The combined observations helped elucidate key temporal features in the setting of the cements, whilst suggesting the functional role played by the THz vibrations, in particular at dynamically coordinated interfacial Al-atom pivots. The insights obtained could help evolve nano-scopic strategies to optimise cements and their eventual properties.
1. Introduction
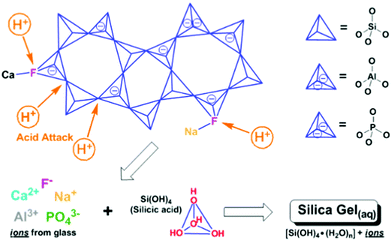
The history of implanting foreign materials into the human body can be traced back to ancient civilizations employing natural materials as replacements for missing or damaged teeth (i.e., bone, shell, wood). Presently, such implantation continues to be epitomised by dentistry, which by-far, provides the most pervasive and historic test-set, with dental solutions transferable to orthopaedics and beyond.This is exemplified by the wide and expanding applications of dental glass ionomer cements (GICs),1 also known as glass polyalkenoate cements,2,3 which are on the WHO's list of essential medicines, with potential for replacing dental silver amalgam.4 GICs are the composite product of the acid-base reaction between an aqueous poly(acrylic) acid solution and a calcium-fluoro-alumino-silicate glass powder, to form silica and poly-salt hydro gels (Fig. 1) with unreacted glass particles tethered within5 and have become a biomaterial of choice. This is due to their satisfying the challenging requirements of bone and tooth prosthetics including: natural adhesion through ion-exchange with hydroxyapatite, the structural prototype of bone and tooth,6,7 good thermo-responsive behavior through thermal coefficient matching to bone and tooth,8 durable and sustained fluoride release,9,10 and the ability to recharge fluoride from external sources.11 These, in addition to not only good biocompatibility12,13 yet true bioactivity that stimulates bone and tooth remineralisation,14 make GICs near ideal implant and osteorestorative materials, similar to modern bioactive glasses. Their potential to develop into structural delivery systems (i.e., drugs, anti-inflammatories, etc.) has also been demonstrated with positive results.15 Yet the fundamental bases and control of these attractive and transferable properties are not fully characterized and thus worthy of further exploration towards optimisation of these self-adhesive regenerative biomaterials.
There is a need and profitable opportunity to address the recurring brittleness of GICs, which has limited their use to low-to-moderate load-bearing applications since their inception in the 1970s.1,16,17 Relevant mechanical properties such as hardness and ductility contribute to the battle between strength and toughness which are often mutually exclusive and albeit the ideal being high values for both, they are as Ritchie terms it ‘in perennial conflict’.18 Therefore, a compromise between the strength and toughness is often the most reasonable (only?) way forward in terms of time, resources, scale-up & manufacture, quality control, costs and robustness of solutions. Bioinspired solutions have presented encouraging leads to tackling this material dichotomy, through hierarchical structuring of diverse components from nanoscopic to bulk scales.19 Hence, further resolving the atomistic and dynamical origins of the brittleness in GICs could uncover possible routes to modulating their ductility and effectively raising toughness. Such scope would provide the relevance to inform on the atomic-scale structure, dynamics and setting mechanisms of other cementitious systems such as Portland, geopolymer and magnesite-based cements; towards raising their longevity and perhaps influencing sustainability.
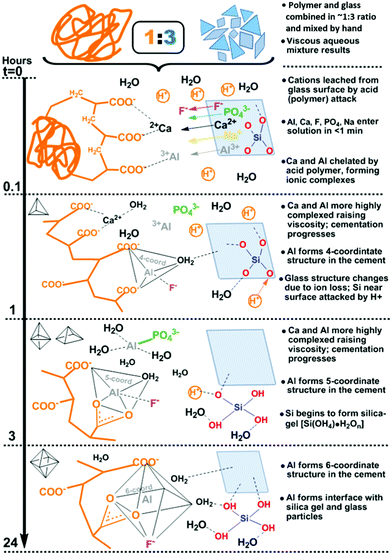
Indeed, GIC setting dynamics and their influence on the eventual mechanical properties have been previously tracked by conventional techniques including (FT)IR and Raman spectroscopy, to resolve localised or specific vibrational dynamics. Yet these are not optimal for characterising bulk material changes nor the far infrared or THz-dynamics that are shown to be instrumental in the toughness of amorphous systems, tracking whole system phenomena such as the ‘boson peak’ in glasses and disordered or amorphous systems.20–22 Much less regular or periodic than the modes in crystalline or ordered systems (i.e. phonons), such dynamics include non-localised, collective vibrations involving cooperative torsional, twisting, breathing, rocking, librational and other such soft, slow modes that fall in the THz regime (∼0.1–15 THz ≈ 3.34–500 cm−1 ≈ 0.4–62 meV). These manifest as whole intra-particle motions and inter-particle ones involving interfacial twist and snap-modes. In the case of GICs, the overwhelming majority of the stepwise liberation of ions from acid-attack on the glass surface (Fig. 1) and subsequent time-dependent structural changes during cementation (Fig. 2) reside at the interface, where chemical transformations and phase changes significantly modify the local structure. These include coordinational changes at Al centres from 4 → 5 → 6 coordination as tracked by 27Al-NMR.23 Such progression of interfacial geometries from tetrahedral (Td), through trigonal bipyramidal (TBP) and square-based pyramidal (SBP) to octahedral (Oh) geometries (Fig. 2) affects changes to the hybridisation of the bonding molecular orbitals and thus interfacial properties. As with most cements, only the surface of the dry powder particles (calcium-alumino-silicate glass in the case of GICs) reacts, whilst the interior remains unchanged. Hence, the changes in the low-energy regime presents a means to tracking the developing interfaces in cements.
Yet, these low-energy modes are not accessible to conventional techniques, such as FTIR and Raman, due to selection rules,24 else when present are very weak and difficult to de-convolute. This region, also termed the fingerprint region, has also been dubbed the ‘terahertz gap’ due to the difficulty in performing measurements at these frequencies, arising from the lack of compact, high-power and low-consumption solid-state coherent sources and efficient detectors.25,26
Opportunely, the rapid development of relevant technology for the generation and detection of coherent THz radiation has made this frequency region more accessible.25,26 The general description of THz spectroscopy refers to techniques which employ coherent (heterodyne) transceivers as opposed to the incoherent (noise) sources historically used in far infrared spectroscopies. Furthermore, THz radiation suffers less from scattering compared to IR due to the larger wavelength, while remaining non-ionizing (non-destructive), allowing it to penetrate deeper into materials27,28 whilst not contributing to changes in the sample, especially for time-dependent measurements.
THz spectroscopy has been successfully used as a probe for monitoring the curing of light-cured dental composite resins of clinically relevant dimension (2 mm thickness).29 Such successes spurred our initiation to carrying out THz measurements of the setting of two commercially available GICs, with comparative measurements avoiding the problematic aspect of their high water content, which has multiple and strong contributions to the spectra. Herein, we employed a coherent THz vector network analyser (VNA) setup, coupled with a modular quasi-optical set-up.
Towards comparatively characterising the structural changes ongoing during setting, small angle neutron scattering (SANS) presents a similarly non-destructive technique to probe time-dependent changes. Unlike X-rays, neutrons penetrate deep into materials,30,31 are highly sensitive to detection of hydrogen atoms, as well as disordered systems, including liquids, and the ones containing liquid/gel phases that have differing scattering lengths/cross sections. SANS allows for a simultaneous characterisation of scale spanning the atomistic through nanoscopic to microscopic scales and beyond.32 Of particular interest is the Porod range which characterises local interface intercorrelations. The Porod range is not a fixed measure and changes with system character and environment, yet is generally characterised as mesoscopic scale down to ∼1 Å−1; 10's of nm down to ∼6.28 Å in real space. As changes to scattering at the Porod range in setting cements remain sparse in the literature, we worked to fill this void with SANS measurements on setting GICs with focus on characterisation of the local interfacial intercorrelations.
Such information is complementary to interpreting changes in the low-frequency dynamics of key structural aspects of the cements. Together with ab initio molecular dynamics (AIMD) and density functional theory (DFT) modelling of the interfaces, this combination of techniques helped provide a glimpse into the dynamical and structural evolution ongoing during setting of the two differing cements, with focus on the differences over-time, which are overwhelmingly dominated by the developing interfaces, with negligible contributions from the unchanging bulk of the filler glass material.
2. Experimental
2.1 Sample preparation
Two sets of commercial GIC cements with different mixing methods were studied: GIC-1 produced from mixing G338 glass powder (CDL St. Marks Ind. Estate Corby, Northants, UK) and Chemflex liquid (Dentsply, DeTrey GmbH, Constance, Germany) and GC Fuji Triage (pink) capsules (GC GmbH, Bad Homburg, Germany), which contain pre-proportioned glass and polymer. The former was hand-mixed with a dental spatula at a powder![[thin space (1/6-em)]](https://www.rsc.org/images/entities/char_2009.gif) :
:![[thin space (1/6-em)]](https://www.rsc.org/images/entities/char_2009.gif) liquid ratio of 2.5
liquid ratio of 2.5![[thin space (1/6-em)]](https://www.rsc.org/images/entities/char_2009.gif) :
:![[thin space (1/6-em)]](https://www.rsc.org/images/entities/char_2009.gif) 1 and the latter were machine-mixed with a capsule mixer (CM-II, GC GmbH, Bad Homburg, Germany) following the manufacturer's instructions. All preparation and measurements were done at room temperature.
1 and the latter were machine-mixed with a capsule mixer (CM-II, GC GmbH, Bad Homburg, Germany) following the manufacturer's instructions. All preparation and measurements were done at room temperature.
2.2 Coherent terahertz spectroscopic measurements
A quasi-optical (QO) transmissometer driven by a vector network analyser (VNA) was used to study the cementation process over the 220–325 GHz (0.22–0.325 THz) frequency domain using a reflection set-up. Immediately following mixing, the cements were transferred into a disk-shaped sample cell with a THz-transparent (polyethylene) Real TPX® cap and sealed; cell dimensions = 11 mm diameter × 1.86 mm thick ≈ 176.8 mm3 ≈ 0.176 ml. The sample absorbance was recorded continuously as spectral reflectance response relative to a standard flat aluminium reflector, at 3 min interval for 30 hours for GIC-1 and 24 hours for Fuji Triage. Identical comparative, calibration measurements were then repeated on the isolated components of GIC-1 (G338 glass and Chemflex liquid) to generate baselines.2.3 Small angle neutron scattering (SANS) experiments
SANS data were collected using the NIMROD setup at ISIS pulsed neutron and muon source (Rutherford Appleton Laboratory, Harwell, UK). Calibration was done using a vanadium reference, after which G338 glass powder and Chemflex liquid were independently measured in a TiZr sample cell. SANS measurements of GIC-1 were continually generated over 24 hours of setting. Data were analysed using the Gudrun program package33 to correct for the contributions from the empty cell, instrument background and normalise the data to absolute units using the scattering of a vanadium standard absorption before attenuation and multiple-scattering corrections. Correction for the contribution from inelastic scattering by the sample was made using a well-established method,34 incorporating equations developed for total-scattering correlation functions to provide consistent definitions.35 The large Q range of the NIMROD setup allows for both small- and wide-angle neutron scattering (SANS and WANS, respectively) over an approximate q-range of ∼0.01–50 Å−1 with reliable statistics from q ∼ 0.01 Å−1 (approximately ∼300–1 Å in real-space, with a resolution of ±0.1 Å).2.4 Computational experiments
The detailed description of the AIMD and DFT computational methods has been extensively covered elsewhere36,37 and full details are provided in the ESI.† Relevantly, ab initio (Born-Oppenheimer) molecular dynamics (AIMD) simulations of the commercial G338 were conducted with the electronic structure code CP2K/Quickstep code, version 2.5.1 (CP2K developers group, 2014). The PBE method with Goedecker-Teter-Hutter pseudopotentials were employed for core-valence electron interactions, whilst all valence interactions were represented using a double-zeta valence polarized basis set. Additional investigations of the low-energy vibrations were completed with electronic structure calculations using a molecular cluster model38 and the Gaussian 09 program package,39 with focus on resolving the interfacial THz modes. Models were geometry-optimised and complemented by analytical frequencies determined at the B3LYP/DGDZVP level of theory. Selected vibrations in the THz-range were then visualised with their relative force vectors.3. Results and discussion
3.1 Coherent-THz spectroscopy measurements
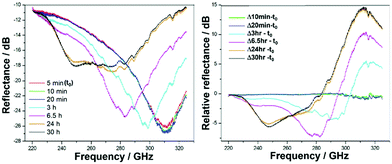
Plots of the frequency domain at selected times (5, 10, 20 min and 3, 6.5, 24, 30 hours) show a main broad reflectance feature centred around 310 GHz (Fig. 3). After an initial stage of little to no change, after ∼10 min the feature progressively broadens and red-shifts to lower frequencies, prior to once again settling after 24 hours, into a broad feature spanning ∼240–290 GHz. This emerging THz feature is attributed to the initiation of the cementation reaction, wherein the polymer (acid) attacks the glass (base) at its surface, initiating an eruption of ions led by Ca2+ and followed by Al3+,2,3 among other reactive changes to the structure and dynamics (Fig. 1 and 2). The frequency changes are on a relatively small scale, yet are expected as-such, as the measurements are on the entire cement. Any changes observed only arise from the formation of the interfaces between glass and polymer, as well as those between crosslinked polymer chains within the matrix during setting, whilst the change to the overall GIC material is negligible. Dynamical softening is expected, in the formation of a cement with higher ductility than its dominating fraction of glass.40,41 Such non-monotonic behavior has been previously observed in measurements of bone cements (calcium phosphate) from in situ energy-dispersive X-ray diffractometry (EDXD) and FTIR,42 among others.43–47These snapshot changes in time are in-line with practical and clinical observations and manufacturers’ guidelines on setting and working times.40,48 Therein an initial stage of little material change (i.e. setting and hardening of the cement) is required for the practitioner to introduce and form the material, followed by a sharp and exponential setting to set the material in place and form. This is intelligible in human terms, where a dental practitioner will strongly recommend to not touch or disturb the filler cement material, and to not ‘chew on it' till tomorrow, or better for 24 hours. Such temporal agreement affirms this frequency regime as a realistic probe of ongoing changes associated with GIC setting and provides a partial view of the dynamical ranges these are occurring at.
Towards more completely resolving this time-dependence of reflectance over setting, all 2001 frequency points from 220 to 325 GHz (50 MHz resolution) collected were summed together and subsequently converted to the inverse parameter generating time-dependent values for the absorption coefficient, as per:
 | (1) |
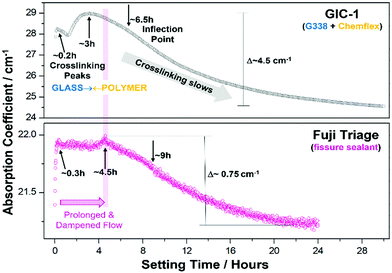
The values at each measurement time (every 3 minutes) were plotted over the full setting on a log-scale and normalised to the value of the initial start time (t0), generating time-dependent profiles of the absorption coefficient (Fig. 4). Absorption as a function of time shows non-linear profiles over setting for both cements, with maxima at 0.2 and 3 hours for GIC-1 and 0.3 and 4.5 hours for Fuji Triage, aligning with times for the release and crosslinking of Ca2+ and Al3+, respectively, as identified in precipitation1–3 and 27Al-NMR experiments23 and illustrated in Fig. 2. Inflection points at 6.5 and 9 hours, for GIC-1 and Fuji-Triage, respectively, were identified from sigmoidal fits of the profiles, corresponding to slowing down of the chemical crosslinking due to exhaustion of ions available. This forms stable unchanging interfaces, effectively separating and isolating unreacted glass surfaces and non-crosslinked ions from the reactive aqueous polymer phase.
Generally, both cements exhibit similar trends with crosslinking peaking earlier-on in GIC-1. Changes over time were ∼4 times the magnitude of those in Fuji Triage, correlated with GIC-1's higher powder![[thin space (1/6-em)]](https://www.rsc.org/images/entities/char_2009.gif) :
:![[thin space (1/6-em)]](https://www.rsc.org/images/entities/char_2009.gif) liquid ratio (2.5
liquid ratio (2.5![[thin space (1/6-em)]](https://www.rsc.org/images/entities/char_2009.gif) :
:![[thin space (1/6-em)]](https://www.rsc.org/images/entities/char_2009.gif) 1 vs. 2
1 vs. 2![[thin space (1/6-em)]](https://www.rsc.org/images/entities/char_2009.gif) :
:![[thin space (1/6-em)]](https://www.rsc.org/images/entities/char_2009.gif) 1) resulting in the observed faster setting,49 as well as its higher polymeric acid concentration (40% vs. 20%) leading to more complete setting.50 In practice, Fuji is used as a sealant and surface protectant for tooth and bone, with ‘free-flowing consistency’ as advertised by the manufacturer. A requisite property is early low viscosity to flow into pits and fissures, or across surfaces before it hardens. Hence the observed delayed peaking and extent of crosslinking relative to the GIC-1 cement.
1) resulting in the observed faster setting,49 as well as its higher polymeric acid concentration (40% vs. 20%) leading to more complete setting.50 In practice, Fuji is used as a sealant and surface protectant for tooth and bone, with ‘free-flowing consistency’ as advertised by the manufacturer. A requisite property is early low viscosity to flow into pits and fissures, or across surfaces before it hardens. Hence the observed delayed peaking and extent of crosslinking relative to the GIC-1 cement.
The setting profiles bear a close resemblance to that of the polymerisation of dental composite resins,29 yet on much longer time scale as such cements set much slower. While the setting of GICs is initially an acid-base reaction with the released ions being bound by the polymer's carboxylate groups (COO−) to form a polyacrylate salt hydro-gel matrix, this is followed by cross-linking of the polymer chains, analogous to the cross-linking in composite resins. Although the changes in material absorption coefficient are often correlated with changes in density, the curing of light-activated dental composite resins found no clear linear dependence on the density.29 Also, the ∼18% change of absorption (29 → 24.5 cm−1) observed over setting in this study (Fig. 4) was substantially larger than the commonly observed ∼3–3.5% GIC setting shrinkage, which is equivalent to density change,48 hence the oscillatory change observed from t0 onwards is therefore due mostly to changes in chemical, material, and interfacial properties and thus dynamics, during cementation. In this case, changes therein track those resulting from reaction, whilst unreacted portions do not contribute (the vast bulk of the cement does not change).
3.2 Small angle neutron scattering (SANS)
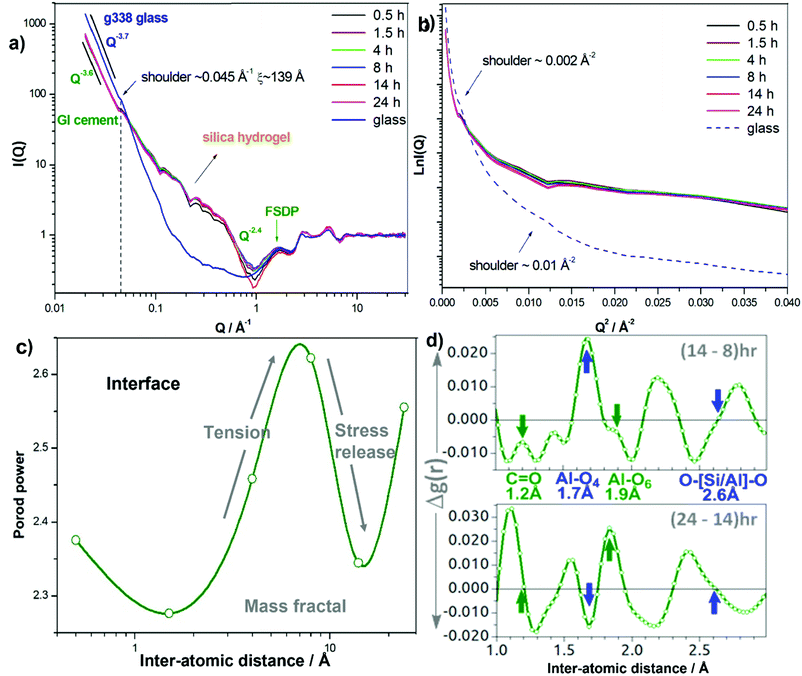
The time resolved SANS for GIC-1 setting over 24 hours, and comparative data of the component G338 glass powder are presented in Fig. 5a, plotted in log–log scale using the Porod method as well as in Ln-Q2 scale using the Guinier method (Fig. 5b). The Porod plots (Fig. 5a) all have similar initial power-decay gradients at lower Q of approximately −3.6, which is indicative of large spherical structuring causing scattering, yet with rougher surfaces51 than the power of the glasses with smoother surfaces ∼−3.8 to −4.0 within the length scale of ∼10–300 Å. This is attributed to the specific ball milling processes of glasses in commercial GICs, such as G338, which roughen the outer edges effectively raising surface area and reactivity. This also introduces stresses in the glass which act as a physical driving force to further push the reaction forward.The time-dependent changes in the SANS signal occur principally between 1.5 and 14 hours of GIC-1 setting, and thus it is highly probable these arise from the surface scattering at the interfaces between the glass powder and polymer. The shoulder signal at q ∼ 0.045 Å−1 present in the diffraction pattern of the unreacted glass also persists in the setting cement through to 24 hours and corresponds to a structural motif in the glass which is still present in the cement possibly as the matrix aggregates over the glass particles. The position of this shoulder facilitates the approximation of the correlation length of the cluster using ξ ∼ 2π/q ∼139 Å. Coincidently, in Fig. 5b, there is also a shoulder ∼0.002 Å−2, arising from the same glass motif. The position of the shoulder appears at the same position in setting cement, yet with some variance in amplitude due the cement having a smaller fraction of glass. Another shoulder appears at ∼0.01 Å−2 in Fig. 5b corresponding to ξ ∼ 62.8 Å in the glass and it also appears in the cement.
Each variance in the cement spectra coincides well with those in the glass spectrum at the same Q positions (Fig. 5a) indicating that the diffraction signal is essentially from the unreacted glass particle surfaces which also form glass-matrix interfaces. This reconfirms the expectations of most of the cement being unchanged over the course of setting, with the changes that are observed being at reactive interfaces.5,17 And the unreacted glass embedded within the cement matrix retain the original glass characteristics, evidenced by the DSC-determined heat-capacity (Cp) of the GIC cement demonstrating the same evolution of the glass-transition behaviour of the original glass.41 The higher amplitude in Q range ∼0.1–0.5 Å−1 is consistent with the hump previously observed with SANS, attributed to the growth of a siliceous hydrogel layer on the surface of the glass particles.52–56 In addition to silica hydrogel, we also attribute this general hump to diffraction from aluminium phosphate gel since there is P in G338 glass.5
In the Porod region preceding the FSDP the gradient drops to −2.4 (Fig. 5a), indicating the presence of mass/volume fractals. This is in-line with the increased crosslinking of the polymer and its chelating the Al3+ and Ca2+ ions released by acid attack on the glass, as well as the growth of the silica gel to form the complex interfacial matrix. Porod power oscillates as a function of time (Fig. 5c) reaching a maximum at ∼8 hours, attributed to interfacial tension buildup before descending into a minimum at ∼14 hours corresponding to stress release. This is in good agreement with the oscillating position of the FSDP QFSDP (2π/rIRO) and integrated peak intensity, which are pressure- and composition-dependent.57,58 While the fluctuating FSDP indicates changes in composition and internal stress, the fluctuating Porod power indicates changes in the degree of mass fractal, a measure of the scale of polymer crosslinking at the interfacial region.
Finally, the real-space atom-atom pair correlations (Fig. 5d), Al–O4, Al–O6 and O–[Si/Al]–O in particular that reside at the interfaces, also vary with setting in a coordinated fashion. Between 8–14 hours, Al–O4 amplitude increases, whilst those of Al–O6, O–[Si/Al]–O and C![[double bond, length as m-dash]](https://www.rsc.org/images/entities/char_e001.gif) O inversely decrease; and at 14–24 hours, Al–O4 amplitude decreases, whilst those of Al–O6, O–[Si/Al]–O and C
O inversely decrease; and at 14–24 hours, Al–O4 amplitude decreases, whilst those of Al–O6, O–[Si/Al]–O and C![[double bond, length as m-dash]](https://www.rsc.org/images/entities/char_e001.gif) O inversely increase. The opposite trend of Al–O4 and C
O inversely increase. The opposite trend of Al–O4 and C![[double bond, length as m-dash]](https://www.rsc.org/images/entities/char_e001.gif) O is logical as the polymer's carboxylate groups bind with Al raising coordination number and lengthening the C
O is logical as the polymer's carboxylate groups bind with Al raising coordination number and lengthening the C![[double bond, length as m-dash]](https://www.rsc.org/images/entities/char_e001.gif) O to a C–O. Albeit relatively small (∼0.2–1% of a bond length), these changes are related to the reactive cementation at interfaces and averaged over all Al–O and C
O to a C–O. Albeit relatively small (∼0.2–1% of a bond length), these changes are related to the reactive cementation at interfaces and averaged over all Al–O and C![[double bond, length as m-dash]](https://www.rsc.org/images/entities/char_e001.gif) O/C–O bonds present in these samples, hence are pronounced with respect to interface formations at cement interfaces.
O/C–O bonds present in these samples, hence are pronounced with respect to interface formations at cement interfaces.
3.3 Ab initio molecular dynamics and quantum chemical structures
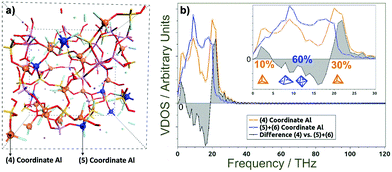
Simulations of the glass and the interface with the chelating polymer helped resolve the influence of Al-coordination on structuring, dynamics and properties in the glass. AIMD computations revealed disordered structuring throughout for tetra-, penta- and hexa-coordinated Al (Al-IV, Al-V and Al-VI, respectively). A snapshot of the final structuring along the AIMD trajectories at 300 K of the G338 glass shows Si–O–Si, Si–O–Al, and Al–O–Al networks comprising the core structure of the glass, with free cations balancing the negative charges at AlO4 sites and fragmenting the glass network (Fig. 6(a)).57–59 Such disordering manifests itself in complex collective modes in the THz-regime; contrasting against phonon modes in ordered crystalline structures. Fig. 6(b) also shows the partial vibrational vibrational densities of states (VDOS) for the Al atoms in the G338 structure decomposed into the 4-, 5- and 6-coordinated species (Al-IV, Al-V and Al-VI). The VDOS showed Al-coordination dependence, where Al-IV displayed red-shifting of collective modes in the ∼0–5 THz range and blue-shifting of those in the ∼19–30 THz range, relative to those of Al-V and Al-VI. This is indicative of the higher coordinations possibly constraining Al in the glass, and leading to a more rigid, inflexible structuring, and thus rising brittleness. Such raised constraint has been previously proposed as being a potentially major contributor to the brittleness in glassy and other composite systems.Quantum chemical models employing DFT helped resolve the type of collective modes at polymer–glass interfaces.60 These low-THz motions involve cooperative motions of all or nearly all atoms moving together in twisting, rocking, bending and compressive type modes, as well as con- and dis-rotatory types, with the polymer and glass components twisting in matching or contrary directions, respectively. Two exemplars are presented in Fig. 7 with all modes 0–3.0 THz presented in Fig. S2 and S3 (ESI†) as moving videos or stills, with all atomic force vectors included. In each of these modes, the collective motions together impart a flexing and distortion of the interfacial structuring, with the bridging Al-atom acts as a hinge to these. Therein, more constrained Al-VI would be less flexible, whilst Al-IV is less coordinated and thus less strongly binding the two components together. A compromise is thus found with Al-V, itself able to adopt trigonal bi-pyramidal and square-based pyramidal geometries. The relatively low barriers to their inter-conversion providing a means to distort and relieve instability arising from compressive or stretching forces acting at these interfaces. These modes are collective modes, involving the simultaneous THz-energy scale motions of the polymer, glass and their interfacial bonding.
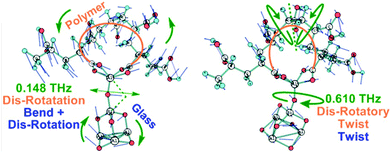 | ||
| Fig. 7 Examples of the glass-polymer interfacial models, showing THz modes distorting the structure at Al-hinges, as determined by DFT methods. | ||
4. Conclusions
THz spectroscopy has proven a useful technique for monitoring the setting mechanism of glass cements and in the determination of their THz dielectric parameter changes over real time. Specifically, it has revealed non-monotonic trends through an undulating signal over ∼24 hours of setting, including the initiation of crosslinking at ∼3 hours and 4.5 hours, respectively, for both cements, where cementitious gelation dominates, followed by subsequent interfacial growth between the cements’ polymer and glass composite components. After coupling peaks, the setting slows through to the end of 24 hours, where the bulk of the cementation reaction is completed.These temporal trends were reproduced with parallel measurement of the same cement using small angle neutron scattering (SANS) tracking real-time structural changes from ∼0.1–30 nm, from atomic scale through the meso-scopic Porod and Guiner regions. Changes in structuring over setting tracked the formation of interfaces of the mill-roughened glass surfaces.
These trends were made intelligible through high-end ab initio molecular dynamics simulations and electronic structure computations of the glass and polymer–glass interface. These helped identify the changes in the underlying low-energy dynamics ongoing throughout the bulk cements and at the forming interfaces as cementation progressed over 24 hours.
Future endeavours may work to resolve the low-energy modes using a combination of terahertz and inelastic neutron scattering towards accessing the terahertz energy regime. Similarly for determining changes to material atomic momentums and kinetic energies of the principal elements forming the interfaces and the inter-particle cohesion of the cement (Ca, Al, Si, C, O, H). Such information could provide a glimpse into the atomistic and nanoscopic bases of a cement's mechanical properties.
Author contributions
Conceptualisation of work: G. A. C., K. V. T.; conducting of experiments: B. Y., R. S. D., G. A. C., K. V. T.; computation: D. D. T., G. A. C.; data analyses: F. V. S., B. Y., D. D. T., R. S. D., G. A. C., K. V. T.; data dissemination & graphics: B. Y., D. D. T., G. A. C., K. V. T.; writing of manuscript: R. Y. Y., D. H. F., G. A. C., K. V. T.; project funding support: D. D. T., G. A. C., R. Y. Y., D. H. F.Conflicts of interest
There are no conflicts to declare.Acknowledgements
The authors acknowledge EU-Horizon 2020 and BEIS, UK for supporting the FUNMIN project (ACT, No. 294766) and providing the means to extending ongoing work to cementitious materials. Computational work utilised Queen Mary's MidPlus computational facilities, supported by QMUL Research-IT and funded by EPSRC grant EP/K000128/1, as well as via membership to the UK's HEC Materials Chemistry Consortium, which is funded by EPSRC (EP/L000202), this work also used the ARCHER UK National Supercomputing Service (https://www.archer.ac.uk). Giovanni Romanelli, Tom Headen and Daniel Bowron (RAL, STFC) are acknowledged for technical assistance and Stewart Parker (RAL, STFC) for helpful discussions. STFC RAL is thanked for access to neutron beam facilities via proposals RB1100006, RB1110428 and RB1310334. KVT thanks Prof. Bruno Botta (Sapienza University of Rome) for support, in addition to the Department of Chemistry and Chemical Biology (McMaster University), the Faculty of Land and Food Systems (University of British Columbia) and the Natural Sciences and Engineering Research Council, Canada (RGPIN 04598, RYY) for support. GAC thanks the departments of Chemistry at McMaster University and the University of Hong Kong for supporting his Adjunct and Honorary Professorships, respectively, as well as the Faculty of Land and Food Systems (University of British Columbia) for his Affiliate Professorship.References
- S. K. Sidhu and J. W. Nicholson, A review of glass-ionomer cements for clinical dentistry, J. Funct. Biomater., 2016, 7, 16 CrossRef PubMed.
- A. D. Wilson and B. E. Kent, The glass-ionomer cement, a new translucent dental filling material, J. Appl. Chem., 1971, 21, 313 CrossRef CAS.
- A. D. Wilson and B. E. Kent, A new translucent cement for dentistry. The glass ionomer cement, Br. Dent. J., 1972, 132, 133–135 CrossRef CAS PubMed.
- R. A. Davies, et al., Geometric, electronic and elastic properties of dental silver amalgam γ-(Ag3Sn), γ1-(Ag2Hg3), γ2-(Sn8Hg) phases, comparison of experiment and theory, Intermetallics, 2010, 18, 756–760 CrossRef CAS.
- A. D. Wilson, Secondary reactions in glass-ionomer cements, J. Mater. Sci. Lett., 1996, 15, 275–276 CrossRef CAS.
- P. Hotz, J. W. McLean, I. Sced and A. D. Wilson, The bonding of glass–ionomer cements to metal and tooth substrates, Br. Dent. J., 1977, 142, 41–47 CrossRef CAS PubMed.
- D. R. Powis, T. Folleras, S. A. Merson and A. D. Wilson, Improved adhesion of a glass ionomer cement to dentin and enamel, J. Dent. Res., 1982, 61, 1416–1422 CrossRef CAS PubMed.
- R. G. Craig, Restorative dental materials, Mosby-Year Book, Inc., St Louis, MO, 10th edn, 1997 Search PubMed.
- L. Forsten, Fluoride release from a glass–ionomer cement, Scand. J. Dent. Res., 1977, 85, 503–504 CAS.
- B. Czarnecka, H. Limanowska-Shaw and J. W. Nicholson, Buffering and ion-release by a glass-ionomer cement under near-neutral and acidic conditions, Biomater., 2002, 23, 2783–2788 CrossRef CAS PubMed.
- K. Pawluk, S. E. Booth, N. J. Coleman and J. W. Nicholson, The kinetics of fluoride uptake by immature glass-ionomer dental cements, Dent. Forum, 2008, 36, 11–14 Search PubMed.
- J. W. Nicholson, Glass ionomer dental cements: update, Mater. Technol. Adv. Perf. Mater., 2010, 25, 8–13 CAS.
- O. Lang, et al., Cell Physiological effects of glass ionomer cements on fibroblast cells, Toxicol. Vitro, 2019, 61, 104627 CrossRef CAS PubMed.
- J. M. Ten Cate and R. N. B. van Duinen, Hypermineralization of dentinal lesions adjacent to glass-ionomer cement restorations, J. Dent. Res., 1995, 74, 1266–1271 CrossRef CAS PubMed.
- L. Kiri, M. Filiaggi and D. Boyd, Methotrexate-loaded glass ionomer cements for drug release in the skeleton: an examination of composition–property relationships, J. Biomater. App., 2015, 30, 732–739 CrossRef PubMed.
- A. O. Akinmade and J. W. Nicholson, Poisson's ratio of glass-polyalkenoate (“glass-ionomer”) cements determined by an ultrasonic pulse method, J. Mater. Sci.: Mater. Med., 1995, 6, 483–485 CrossRef CAS.
- K. V. Tian, P. M. Nagy, G. A. Chass, P. Fejerdy, J. W. Nicolson, I. G. Csizmadia and D. Dobó/Nagy, Qualitative assessment of microstructure and Hertzian indentation failure in biocompatible glass ionomer cements, J. Mater. Sci.: Mater. Med., 2012, 23, 677–685 CrossRef CAS PubMed.
- R. O. Ritchie, The conflicts between strength and toughness, Nat. Mater., 2011, 10, 817–822 CrossRef CAS PubMed.
- U. G.-K. Wegst, H. Bai, E. Saiz, A. P. Tomsia and R. O. Ritchie, Bioinspired structural materials, Nat. Mater., 2015, 14, 23–26 CrossRef CAS PubMed.
- M. Naftaly and A. Gregory, Terahertz and Microwave Properties of Single-Crystal Quartz and Vitreous Silica and the Behavior of the Boson Peak, Appl. Sci., 2021, 11, 6733 CrossRef CAS.
- B. Guillot and Y. Guissani, Boson Peak and High Frequency Modes in Amorphous Silica, Phys. Rev. Lett., 1997, 78, 2401–2404 CrossRef CAS.
- T. Ohsaka and S. Oshikawa, Effect of OH content on the far-infrared absorption and low-energy states in silica glass, Phys. Rev. B: Condens. Matter Mater. Phys., 1998, 57, 4995–4998 CrossRef CAS.
- N. Zainuddin, N. Karpukhina, R. G. Hill and R. V. Law, A long-term study on the etting reaction of glass ionomer cements by 27Al MAS-NMR spectroscopy, Dent. Mater., 2009, 25, 290–295 CrossRef CAS PubMed.
- P. M.-A. Sherwood, Vibrational Spectroscopy of Solids. Cambridge University Press, 1972 Search PubMed.
- T. Nagatsuma, Terahertz technologies: present and future, IEICE Electro. Express, 2011, 8, 1127–1142 CrossRef.
- Z. Popović and E. N. Grossman, THz metrology and instrumentation, IEEE Trans. Terahertz Sci. Technol., 2011, 1, 133 Search PubMed.
- N. Nagai, R. Kumazawa and R. Fukasawa, Direct evidence of inter-molecular vibrations by THz spectroscopy, Chem. Phys. Lett., 2005, 413, 495–500 CrossRef CAS.
- Z. Zhu, Y. J. Bian, X. Zhang, R. N. Zeng and B. Yang, Evaluation of formation and proportion of secondary structure in γ-polyglutamic acid by terahertz time-domain spectroscopy, Spectrochim Acta, Part A, 2022, 271, 120940 CrossRef CAS PubMed.
- M. Schwerdtfeger, et al., Terahertz time-domain spectroscopy for monitoring the curing of dental composites, Biomed. Opt. Express, 2012, 3, 2842–2850 CrossRef PubMed.
- K. V. Tian, et al., Orthodontic archwire composition and phase analyses by neutron spectroscopy, Dent. Mater. J., 2017, 36, 282–288 CrossRef CAS PubMed.
- K. V. Tian, et al., Composition—Nanostructure Steered Performance Predictions in Steel Wires, Nanomater., 2019, 9, 1119 CrossRef CAS PubMed.
- A. Nespoli, et al., Biomedical NiTi and β-Ti Alloys: From Composition, Microstructure and Thermo-Mechanics to Application, Metals, 2022, 12, 406 CrossRef CAS.
- A. K. Soper, N. Gudrun and X. Gudrun, programs for correcting raw neutron and X-ray diffraction data to differential scattering cross section. Rutherford Appleton Laboratory Technical report: RAL-TR-2011-013 https://epubs.stfc.ac.uk/work/56240, 2011.
- A. K. Soper, The radial distribution functions of water as derived from radiation total scattering experiments: is there anything we can say for sure?, ISRN Phys. Chem., 2013, 279463 Search PubMed.
- D. A. Keen, A comparison of various commonly used correlation functions for describing total scattering, J. Appl. Crystallogr., 2001, 34, 172–177 CrossRef CAS.
- J. Hutter, M. Iannuzzi, M. Schiffmann and J. VandeVondele, CP2K: atomistic simulations of condensed matter systems, Wiley Interdiscip. Rev.: Comput. Mol. Sci., 2014, 4, 15–25 CAS.
- T. D. Kuhne, et al., CP2K: an electronic structure and molecular dynamics software package – Quickstep: efficient and accurate electronic structure calculations, J. Chem. Phys., 2020, 152, 194103 CrossRef PubMed.
- K. V. Tian, et al., Periodic vs. molecular cluster approaches to resolving glass structure and properties: Anorthite a case study, J. Non-Crystal. Soli., 2016, 451, 138–145 CrossRef CAS.
- M. J. Frisch, et al., Gaussian 09, Revision E.01, Gaussian, Inc., Wallingford CT, 2009 Search PubMed.
- J. W. McLean and A. D. Wilson, The clinical development of the glass ionomer cement. II. Some clinical applications, Aus. Dent. J., 1977, 22, 120–127 CrossRef CAS PubMed.
- M. Pedersen, et al., Phase separation in an ionomer glass: insight from calorimetry and phase transitions, J. Non-Cry. Soli., 2015, 415, 24–29 CrossRef CAS.
- V. Uskoković and J. V. Rau, Nonlinear oscillatory dynamics of the hardening of calcium phosphate bone cements, RSC Adv., 2017, 64, 40517–40532 RSC.
- Y. Li, H. Qian and Y. Yi, Nonlinear oscillation and multiscale dynamics in a closed chemical reaction system, J. Dynam. Differ. Equat., 2010, 22, 491–507 CrossRef.
- N. A. Zimbovskaya, Local Flattening of the Fermi Surface and Quantum Oscillations in the Magnetoacoustic Response of a Metal, Solid State Commun., 2006, 138, 559–562 CrossRef CAS.
- R. Imbihl, Oscillatory reactions on single crystal surfaces, Prog. Surf. Sci., 1993, 44, 185–343 CrossRef CAS.
- D. H. Setiadi, G. A. Chass, L. L. Torday, A. Varro and J. G. Papp, Vitamin E models. Can the anti-oxidant and pro-oxidant dichotomy of α-tocopherol be related to ionic ring closing and radical ring opening redox reactions?, J. Mol. Struct.: THEOCHEM, 2003, 620, 93–106 CrossRef CAS.
- C. H. Lloyd and M. Adamson, The development of fracture toughness and fracture strength in posterior restorative materials, Dent. Mater., 1987, 3, 225–231 CrossRef CAS PubMed.
- T. Attin, W. Buchalla, A. M. Kielbassa and E. Helwig, Curing shrinkage and volumetric changes of resin-modified glass ionomer restorative materials, Dent. Mater., 1995, 11, 359–362 CrossRef CAS PubMed.
- S. Crisp, B. G. Lewis and A. D. Wilson, Characterization of glass-ionomer cements 2. Effect of the powder:liquid ratio on the physical properties, J. Dent., 1976, 4, 287–290 CrossRef CAS PubMed.
- S. Crisp, B. G. Lewis and A. D. Wilson, Characterization of glass-ionomer cements. 3. Effect of polyacid concentration on the physical properties, J. Dent., 1977, 5, 51–56 CrossRef CAS PubMed.
- J. M. Smith, R. A. Martin, D. T. Bowron, A. C. Hannon and R. J. Newport, Probing crystallisation of a fluoro-apatite-mullite system using neutron diffraction, J. Non-Crystal Solids, 2016, 451, 84–88 CrossRef CAS.
- W. L. Chee, et al., Investigation of the siliceous hydrogel phase formation in glass-ionomer cement paste, Phys. B, 2018, 551, 287–290 CrossRef.
- S. Ganguly, et al., Mechanically robust dual responsive water dispersible-graphene based conductive elastomeric hydrogel for tunable pulsatile drug release, Ultrason. Sonochem., 2018, 42, 212–227 CrossRef CAS PubMed.
- P. Das, et al., Surface quaternized nanosensor as a one-arrow-two-hawks approach for fluorescence turn “on–off–on” bifunctional sensing and antibacterial activity, New J. Chem., 2019, 43, 6205–6219 RSC.
- X. F. Sánchez-Romate, A. Sans, A. Jiménez-Suárez and S. G. Prolongo, The addition of graphene nanoplatelets into epoxy/polycaprolactone composites for autonomous self-healing activation by Joule's heating effect, Compos. Sci. Techno., 2021, 213, 108950 CrossRef.
- V. Sans, et al., Polymer-Supported Ionic-Liquid-Like Phases (SILLPs): Transferring Ionic Liquid Properties to Polymeric Matrices, Chem. – Eur. J., 2011, 17, 1894–1906 CrossRef CAS PubMed.
- K. V. Tian, G. A. Chass and D. Di, Tommaso, Simulations reveal the role of composition into the atomic-level flexibility of bioactive glass cements, Phys. Chem. Chem. Phys., 2016, 18, 837–845 RSC.
- K. V. Tian, et al., Atomic and vibrational origins of mechanical toughness in bioactive cement during setting, Nat. Commun., 2015, 6, 8631 CrossRef CAS PubMed.
- W. H. Mu, et al., Test and modification of the van der Waals’ radii employed in the default PCM model, Int. J. Quantum Chem., 2008, 108, 1422–1434 CrossRef CAS.
- G. A. Chass, et al., A Hartree–Fock, MP2 and DFT computational study of the structures and energies of ′′b2 ions derived from deprotonated peptides. A comparison of method and basis set used on relative product stabilities, J. Mol. Struct.: THEOCHEM, 2004, 675, 149–162 CrossRef CAS.
Footnote |
| † Electronic supplementary information (ESI) available. See DOI: https://doi.org/10.1039/d1ma01002f |
| This journal is © The Royal Society of Chemistry 2022 |

