 Open Access Article
Creative Commons Attribution 3.0 Unported Licence
Transition between growth of dense and porous films: theory of dual-layer SEI†
Lars
von Kolzenberg‡
 ab,
Martin
Werres‡
 ab,
Jonas
Tetzloff
c and
Birger
Horstmann
 *abc
*abc
aInstitute of Engineering Thermodynamics, Computational Electrochemistry, German Aerospace Center (DLR), 70569 Stuttgart, Germany. E-mail: birger.horstmann@dlr.de
bHelmholtz Institute Ulm (HIU), Electrochemical Multiphysics Modelling, 89081 Ulm, Germany
cUlm University, Albert-Einstein-Allee 47, 89081 Ulm, Germany
First published on 17th June 2022
Abstract
The formation of passivating films is a common aging phenomenon, for example in weathering of rocks, silicon, and metals. In many cases, a dual-layer structure with a dense inner and a porous outer layer emerges. However, the origin of this dual-layer growth is so far not fully understood. In this work, a continuum model is developed, which describes the morphology evolution of the solid-electrolyte interphase (SEI) in lithium-ion batteries. Transport through the SEI and a growth reaction governed by the SEI surface energies are modelled. In agreement with experiments, this theory predicts that SEI grows initially as a dense film and subsequently as a porous layer. This dynamic phase transition is driven by the slowing down of electron transport as the film thickens. Thereby, the model offers a universal explanation for the emergence of dual-layer structures in passivating films.
1 Introduction
Surface processes are at the center of various aging phenomena. Weathering forms a patina on earth1,2 and even moon minerals,3 as well as on various metals including copper,4–14 zinc,6,15,16 and lead.6,13,14 Crystalline silicon passivates in contact with hydrogen,17–22 nitride,23,24 or oxygen.25,26 Also anode particles in lithium-ion batteries form a shielding surface film; the solid-electrolyte interphase (SEI).27–29 Different mechanisms for SEI growth have recently been discussed with continuum models.30–35Despite the variety of substrates and aging conditions, some universal properties of these surface films emerge. First, the film protects the bulk material and thereby slows down its own growth over time.6,14,29,30 This self-passivating characteristic is mostly ascribed to transport limitations through the film.5,6,14,30,31,36–45 Second, the film structure is oftentimes dual-layered with a dense inner layer and a porous outer layer.4,6,13–16,22,28,46–49
The origin of this multi-layer growth remains to be understood and only few theoretical works analyze the surface morphology evolution. Kim and Kosterlitz50 derived a scaling law to describe a ballistic growth process via a solid-on-solid model. Clarelli et al.51 modeled copper weathering and showed the thickness evolution of the inner cuprite and the outer brochantite surface film. Chazalviel et al.41 derived a threshold voltage for the transition from uniform to mesoporous growth of SiO2 in fluorinated media using a diffusion-reaction model. Single et al.38,39 modeled the SEI porosity evolution with two complementary transport processes and two different formation reactions.
In this paper, we present a novel model to study the morphology evolution of surface films for the example of SEI growth. The model assumes diffusion as growth limiting process.40,52,53 The subsequent film formation reaction is governed by the film morphology according to the model of Horstmann et al. for the formation of Li2O2 films and particles in lithium-air batteries.54,55 This approach can be understood in more general terms as a model for electrochemically-driven phase transitions due to electro-autocatalysis.56 In the following, we first present the theoretical foundations of our model before presenting and discussing its numeric evaluation.
2 Theory
Passivating films grow at their interface with the environment. In the case of SEI, new film forms from non-aqueous electrolyte, lithium ions Li+, and electrons e−. We simplify the multitude of possible SEI growth reactions to the formation of the most prominent SEI compound lithium ethylene dicarbonate Li2EDC from the solvent ethylene carbonate (EC),| Li+ + e− + EC → 0.5Li2EDC + 0.5C2H4. | (1) |
We model the kinetics r of reaction (1) with the thermodynamically consistent approach57,58
 | (2) |
Now, we discuss how we represent SEI morphology in our model. Fig. 1 illustrates the SEI growth process and the corresponding geometrical quantities. We model the two-dimensional substrate surface as a one-dimensional coordinate x. On a molecular level, the SEI grows via the deposition of distinct molecules, which we model as cubes of edge length a = 5.42 Å;59 Each electron transferred in reaction (1) increases the local SEI thickness L(x) by half a monolayer a/2 (green area in Fig. 1). Thus, the number of monolayers ![[L with combining tilde]](https://www.rsc.org/images/entities/i_char_004c_0303.gif) = L/a grows according to
= L/a grows according to
 | (3) |
 .
.
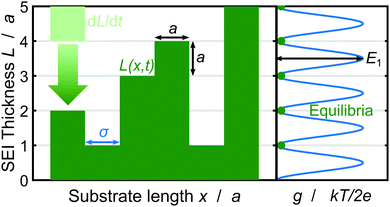 | ||
| Fig. 1 Schematic depiction of the SEI growth process and the corresponding geometrical quantities. Left: SEI molecules in the form of cubes with edge length a deposit in time dL/dt (bright green) resulting in the SEI thickness L(x,t) (dark green) governed by eqn (3). Right: The oscillating bulk contribution of the Gibbs free energy density g(L) for the SEI morphology. Equilibria of the Gibbs free energy density g lie on integer monolayers and non-integer monolayer deposition is penalized with the energy E1 (see eqn (5)). | ||
The chemical potential of the SEI μSEI depends on the resulting SEI morphology via the variational derivative of the Gibbs free energy μSEI = δG/δ![[L with combining tilde]](https://www.rsc.org/images/entities/i_char_004c_0303.gif) , see for example Horstmann et al.54 The free energy G consists of a surface gs and a bulk contribution gb according to eqn (4),
, see for example Horstmann et al.54 The free energy G consists of a surface gs and a bulk contribution gb according to eqn (4),
 | (4) |
The bulk free energy density,
 | (5) |
We model molecular disorder by adding a normally distributed random term with an amplitude of 1 mV to this barrier. This disorder term accounts for structural variations in SEI molecule deposition and as such varies for each monolayer in thickness ![[L with combining tilde]](https://www.rsc.org/images/entities/i_char_004c_0303.gif) and substrate
and substrate ![[x with combining tilde]](https://www.rsc.org/images/entities/i_char_0078_0303.gif) = x/a direction.50,54 This source of randomness breaks the symmetry of the system and thus drives the emergence of instabilities: Locally higher energy barriers provide less favorable sites for deposition of distinct SEI molecules. In turn, this structural heterogeneity affects the reaction rate in eqn (2) and thus either enhances or diminishes unstable growth.
= x/a direction.50,54 This source of randomness breaks the symmetry of the system and thus drives the emergence of instabilities: Locally higher energy barriers provide less favorable sites for deposition of distinct SEI molecules. In turn, this structural heterogeneity affects the reaction rate in eqn (2) and thus either enhances or diminishes unstable growth.
Next, we model electron transport through the SEI via diffusion of neutral lithium as proposed in ref. 31 and 40. The chemical potential of lithium atoms inside the SEI μe− follows from the Nernst equation μe− = kBT![[thin space (1/6-em)]](https://www.rsc.org/images/entities/char_2009.gif) ln(c/cref), where the reference concentration cref is a material parameter. Lithium atoms diffuse through the SEI at the diffusive flux density
ln(c/cref), where the reference concentration cref is a material parameter. Lithium atoms diffuse through the SEI at the diffusive flux density
| Ndiff= −D·gradce−, | (6) |
In the following, we simplify the flux equation to one dimension. We emphasize that we want to focus on the onset of porous layer growth in this paper. Thus, we discuss small fluctuations in concentrations δc(x) due to small fluctuations in SEI thickness δL around a homogeneous film with thickness L in this paragraph. The diffusive transport in eqn (6) leads to a decrease in concentration fluctuation with mean thickness as δc/δL ∼ c0/L. We conclude that the diffusive concentration term in eqn (2) becomes less and less important with growing SEI. Therefore, we simplify the model equations and simulate transport in one dimension only. We make the simplified Ansatz of a constant surface concentration δc/δL = 0, which we determine with Ndiff = −D (c− c0)/L and the integral condition
 | (7) |
![[thin space (1/6-em)]](https://www.rsc.org/images/entities/char_2009.gif) exp(−eU0/kBT) at the anode-SEI interface depends on the open circuit voltage (OCV) U0, which results from the state of charge SoC via the OCV-curve.31,40,62
exp(−eU0/kBT) at the anode-SEI interface depends on the open circuit voltage (OCV) U0, which results from the state of charge SoC via the OCV-curve.31,40,62
At this point, we summarize and non-dimensionalize the model equations. We use the characteristic time 1/(r0a2) and the characteristic energy scale kBT. Table 1 lists the dimensionless parameters of our model.
 | (8) |
 | (9) |
 | (10) |
![[L with combining tilde]](https://www.rsc.org/images/entities/i_char_004c_0303.gif) = L/a = L/a |
![[x with combining tilde]](https://www.rsc.org/images/entities/i_char_0078_0303.gif) = x/a = x/a |
à x = Ax/a |
![[t with combining tilde]](https://www.rsc.org/images/entities/i_char_0074_0303.gif) = tr0a2 = tr0a2 |
![[c with combining tilde]](https://www.rsc.org/images/entities/i_char_0063_0303.gif) = c/cref = c/cref |
![[small kappa, Greek, tilde]](https://www.rsc.org/images/entities/i_char_e1e8.gif) = aσ/kBT = aσ/kBT |
| Ẽ 0 = 2eE0/kBT | Ẽ 1 = 2eE1/kBT | Ũ 0 = eU0/kBT |
| DaII = r0a/Dcref |
Linear stability analysis mathematically describes the response of a dynamic system to infinitesimal perturbations.54 We start the analysis with a homogeneous thickness profile ![[L with combining tilde]](https://www.rsc.org/images/entities/i_char_004c_0303.gif) 0 so that α = 1. This profile is perturbed by the infinitesimal function δ
0 so that α = 1. This profile is perturbed by the infinitesimal function δ![[L with combining tilde]](https://www.rsc.org/images/entities/i_char_004c_0303.gif) (x), which satisfies ∂2δ
(x), which satisfies ∂2δ![[L with combining tilde]](https://www.rsc.org/images/entities/i_char_004c_0303.gif) /∂
/∂![[x with combining tilde]](https://www.rsc.org/images/entities/i_char_0078_0303.gif) 2 = −
2 = −![[k with combining tilde]](https://www.rsc.org/images/entities/i_char_006b_0303.gif) 2δ
2δ![[L with combining tilde]](https://www.rsc.org/images/entities/i_char_004c_0303.gif) with the dimensionless wavenumber
with the dimensionless wavenumber ![[k with combining tilde]](https://www.rsc.org/images/entities/i_char_006b_0303.gif) = ka. We evaluate the growth of this infinitesimal perturbation with eqn (8),
= ka. We evaluate the growth of this infinitesimal perturbation with eqn (8),
 | (11) |
![[c with combining tilde]](https://www.rsc.org/images/entities/i_char_0063_0303.gif) /δ
/δ![[L with combining tilde]](https://www.rsc.org/images/entities/i_char_004c_0303.gif) = 0 as discussed and assumed in the context of eqn (6) above.
= 0 as discussed and assumed in the context of eqn (6) above.
Evaluating this derivative, we obtain the exponential growth rate
 | (12) |
![[s with combining tilde]](https://www.rsc.org/images/entities/i_char_0073_0303.gif) > ∂ > ∂![[L with combining tilde]](https://www.rsc.org/images/entities/i_char_004c_0303.gif) 0/∂ 0/∂![[t with combining tilde]](https://www.rsc.org/images/entities/i_char_0074_0303.gif) . . | (13) |
3 Results
In this section, we discuss our simulation results and compare them with experiments. Our simulations predict the capacity fade due to mean SEI growth and the SEI dual-layer structure.It is well known in experiment and theory that SEI growth during storage leads to measurable capacity fade. In Fig. 2, we plot the mean SEI thickness  over time. Our model reproduces two experimentally observed trends. First, the SEI grows faster for higher states of charge SoC. This is in line with the experiments of Keil et al.,64,65 which we further validate in the ESI,† SI-2. Second, the SEI grows proportional to the square root of time
  , which accords well to battery aging studies.66 However, for low SoCs and large storage times, we observe a deviation from the
  -growth.
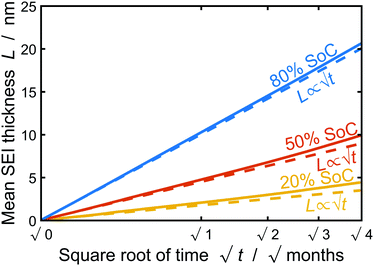 | ||
Fig. 2 Growth of the mean SEI thickness  over the square root of storage time over the square root of storage time  . Different colors indicate different states of charge. Dashed lines indicate a . Different colors indicate different states of charge. Dashed lines indicate a  -growth for comparison. -growth for comparison. | ||
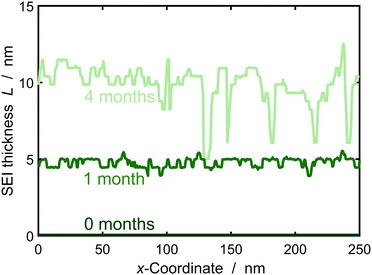
In the following, we study SEI morphology evolution. Fig. 3 shows SEI morphologies at SoC = 50% for a couple of storage times. The SEI grows from an initially homogeneous profile at 0 months to an increasingly heterogeneous profile after 4 months. We interpret the heterogeneous profile as a porous SEI and the homogeneous profile as a dense SEI. Thus, our model predicts a transition from growth of dense to porous interphases as a function of film thickness. The universal origin of this effect is the reduction in growth rate with increasing film thickness. Low current densities favor heterogeneous growth, because the influence of fluctuations becomes larger as detailedly shown by Horstmann et al.30 and reflected by our stability criterion, eqn (13), confer ESI† for more detail.
To further characterize the SEI and compare it to existing theoretical studies, we investigate the SEI volume fraction εSEI in the following.
 | (14) |
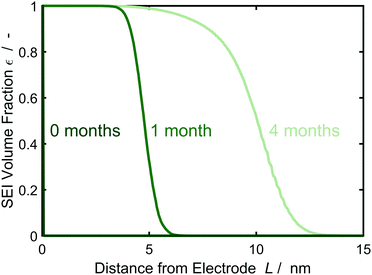 | ||
| Fig. 4 Evolution of the SEI volume fraction εSEI perpendicular to the electrode over time according to the morphology profiles of Fig. 3, averaged over 1000 simulations. Color gradient indicates increasing storage time from 0 (darkest green) to 4 months (lightest green). | ||
We interpret this morphological difference as emergence of a dual-layer SEI structure. In the following, we thus subdivide the SEI into a dense inner part of thickness Lin without pores εSEI(Lin) = 1 and a porous outer part Lout = max(L) − Lin. The thickness Lin is defined such that εSEI (Lin + a) < 1.
Fig. 5 depicts the evolution of the inner and outer SEI at 50% SoC. While the inner SEI reaches a steady thickness of 5 nm after 2 months, the outer SEI grows uninhibited, i.e., approximately linear in time. As a result, we observe the deviation from the parabolic growth law shown in Fig. 2 at long times.
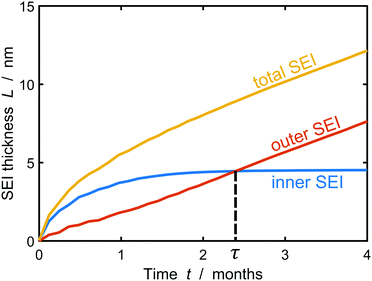 | ||
| Fig. 5 Growth of the inner (blue), outer (red) and total (yellow) SEI during storage for one year at 50% state of charge. The results were averaged over 1000 simulations. | ||
This result clearly shows the onset of porous layer growth, but the long-term simulations have to be interpreted with care. However, our model cannot faithfully capture the long-term evolution after this transition for two reasons. First, we assume a constant lithium atom concentration ![[c with combining tilde]](https://www.rsc.org/images/entities/i_char_0063_0303.gif) at the SEI-electrolyte interphase. This assumption is reasonable for homogeneous SEI profiles and fast surface diffusion, but falls short with increasing film heterogeneity. Replacing the integral constraint eqn (7) with a fully resolved three-dimensional diffusion-reaction equilibrium would increase the model accuracy, but result in higher computational costs. Second, the heterogeneous film tends to arrange in columns and valleys getting stuck at unfavorable molecular positions in the SEI. At this point, we emphasize that this particular process stops the inner SEI growth in Fig. 5. This does not imply that the electrode is completely passivated and in reality we would expect the inner SEI to continue growing albeit at a significantly slower rate. It can be expected that neighboring columns can merge in real SEI and form truly porous structures. Such structures cannot be described with the thickness function L(x) and would require a numerically more challenging tracking of the SEI surface.
at the SEI-electrolyte interphase. This assumption is reasonable for homogeneous SEI profiles and fast surface diffusion, but falls short with increasing film heterogeneity. Replacing the integral constraint eqn (7) with a fully resolved three-dimensional diffusion-reaction equilibrium would increase the model accuracy, but result in higher computational costs. Second, the heterogeneous film tends to arrange in columns and valleys getting stuck at unfavorable molecular positions in the SEI. At this point, we emphasize that this particular process stops the inner SEI growth in Fig. 5. This does not imply that the electrode is completely passivated and in reality we would expect the inner SEI to continue growing albeit at a significantly slower rate. It can be expected that neighboring columns can merge in real SEI and form truly porous structures. Such structures cannot be described with the thickness function L(x) and would require a numerically more challenging tracking of the SEI surface.
The dual-layer SEI growth corresponds well to experimental findings. Harris and coworkers47–49 showed the dual-layer SEI structure using TOF-SIMS, isotope tracer experiments, and EIS. With cryo-TEM measurements, Cui and coworkers visualized a dense inner SEI on graphite, silicon and lithium.67–70 Also the SEI growth model of Single et al.38,39 predicts the emergence of a dual-layer SEI. However, this model relates the two SEI layers to two reduction reactions and two SEI components. Our current model, instead, derives it from a universal transition in growth mode for decreasing growth rates. As a result, Single et al. predict a constant ratio between inner and outer SEI thickness instead of a constant inner SEI thickness. An analysis of existing SEIs after distinct storage times e.g. by transmission electron microscopy or neutron reflectometry could reveal the precise morphology evolution and thereby help to identify the origin of dual-layer growth.
Finally, we analyze the influence of SoC on the emerging SEI profile during storage. To this aim, Fig. 6 shows the transition time τ from dense to porous growth, which we define as Lin(τ) = Lout(τ) (see Fig. 5).
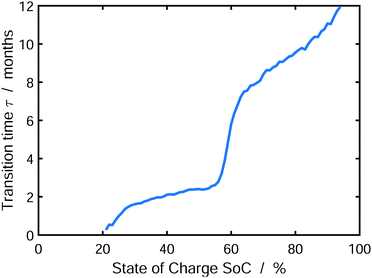 | ||
| Fig. 6 Transition time τ from dense to porous SEI growth defined as Lin(τ) = Lout(τ) depending on the state of charge. The results were averaged over 1000 simulations. | ||
We observe that the transition time increases with increasing state of charge. Accordingly, low SoCs result in a predominantly porous SEI, while high SoCs will lead to a dense SEI. This is a direct consequence of our model, which limits SEI growth by charge transport via electron diffusion. Electron concentration in the SEI at the electrode depends on the SoC via the OCV-curve. Thus, electron transport through the SEI is faster at higher SOCs according to Ndiff ∝ exp(−eU0/kBT). As a consequence, lower SoCs cause slower electron transport, which in turn causes earlier onset of heterogeneous growth, according to our instability criterion, eqn (13). Our findings accord qualitatively well to the experiments of Harris and coworkers,47–49 who describe an increase in SEI porosity with increasing electrode voltage, i.e. decreasing SoC. Note that the transition time τ increases with decreasing exchange current density of electrolyte reduction r0, because this shifts the onset of porous growth as explained in SI-2 (ESI†). At this point, one could intervene in the experiment, e.g. by using additives, in order to delay the onset of porous growth.
We understand the influence of time and SoC on SEI morphology with infinitesimal stability analysis. In Fig. 7, we analyze the occurrence of metastable growth ![[s with combining tilde]](https://www.rsc.org/images/entities/i_char_0073_0303.gif) > ∂
> ∂![[L with combining tilde]](https://www.rsc.org/images/entities/i_char_004c_0303.gif) 0/∂
0/∂![[t with combining tilde]](https://www.rsc.org/images/entities/i_char_0074_0303.gif) (see eqn (12)) at different times, i.e., SEI thicknesses L and SoCs. We observe three main trends in Fig. 7. First, SEI growth is stable for integer monolayers. This effect results from the form of the Gibbs free energy, eqn (4), with equilibria at complete molecular monolayers
(see eqn (12)) at different times, i.e., SEI thicknesses L and SoCs. We observe three main trends in Fig. 7. First, SEI growth is stable for integer monolayers. This effect results from the form of the Gibbs free energy, eqn (4), with equilibria at complete molecular monolayers ![[h with combining tilde]](https://www.rsc.org/images/entities/i_char_0068_0303.gif) and a free energy barrier E1 in between. Second, SEI growth becomes more unstable over time, i.e., with increasing thickness L. This explains the increasingly porous SEI morphology, which we observed in Fig. 3 and 4. Third, higher SoCs lead to more stable SEI growth. This accords well to our findings from Fig. 6, which show a denser SEI for high SoCs. These trends are analogous to the current dependent morphology evolution observed in Li2O2.54 Large leak currents, resulting either from a high SoC or a thin SEI, lead to dense SEI growth, while small leak currents cause porous SEI growth.
and a free energy barrier E1 in between. Second, SEI growth becomes more unstable over time, i.e., with increasing thickness L. This explains the increasingly porous SEI morphology, which we observed in Fig. 3 and 4. Third, higher SoCs lead to more stable SEI growth. This accords well to our findings from Fig. 6, which show a denser SEI for high SoCs. These trends are analogous to the current dependent morphology evolution observed in Li2O2.54 Large leak currents, resulting either from a high SoC or a thin SEI, lead to dense SEI growth, while small leak currents cause porous SEI growth.
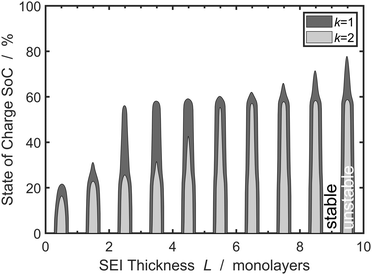 | ||
Fig. 7 Stability analysis of SEI growth, according to eqn (12). Filled areas show conditions of unstable SEI growth ![[s with combining tilde]](https://www.rsc.org/images/entities/i_char_0073_0303.gif) > ∂ > ∂![[L with combining tilde]](https://www.rsc.org/images/entities/i_char_004c_0303.gif) /∂ /∂![[t with combining tilde]](https://www.rsc.org/images/entities/i_char_0074_0303.gif) depending on the SEI thickness h and the state of charge for increasing wavenumbers depending on the SEI thickness h and the state of charge for increasing wavenumbers ![[k with combining tilde]](https://www.rsc.org/images/entities/i_char_006b_0303.gif) . . | ||
Overall, the stability analysis depicted in Fig. 7 comprises the main features of our model: SEI growth becomes increasingly unstable over time and with lower SoC. Thereby, our model shows that the experimentally observed dual-layer SEI structure not only results from the formation of different SEI compounds, but is also inherent to the growth process. In a more general view,our model can also be applied to analyse multi-layer formation in different aging phenomena, e.g. oxidation of silicon, or patina formation on rocks or metals.
In conclusion, our model predicts a universal transition to dual-layer growth for passivating films. However, our predictions are rather qualitative as our model has some limitations. First, the model parametrization is difficult, because information about the long-term SEI morphology evolution is scarce. Novel TEM images of SEI layers after different battery storage times can reveal the structural evolution and aid in parametrizing the model. Moreover, these experiments could measure growth of the inner and outer layer separately and distinguish between the model predictions presented in this paper and by Single et al.38,39 Second, the combination of effects on different length and time scales challenges our model, which is highly sensitive to molecular fluctuations as described by the stability analysis. Our reductionist model focuses on the SEI structure and thus only captures randomness emerging from structural disorder. Additional fluctuations, e.g., thermal, chemical, or electrolyte related may influence our predictions. Further information about these fluctuations as well as surface energies from ab initio calculations would improve our model.
4 Conclusion
Summing up, we developed a general model to study the morphology evolution of passivating surface films. The model consists of a diffusion equation and a morphology-driven reaction rate.40,54 These films arise for example on crystalline silicon,22 minerals,2 and metals.6,14,16We use the model to study the morphology evolution of the solid-electrolyte interphase (SEI) on anode particles in lithium-ion batteries. We parameterize the state-of-charge and time dependence of SEI growth with capacity fade experiments.64,65 The resulting model captures the SEI's tendency to grow in a dual-layer structure with a dense inner and a porous outer layer and captures the principles of experimental findings on the voltage dependence of this process.47–49
Our model focuses on the onset of porous layer growth. Modelling the long-term growth of porous structures would require a simulation of two-dimensional diffusion through the SEI. This approach would be interesting for future studies but comes at the cost of additional unknown parameters. Novel in-situ experiments could provide improved model parameterization and validation.
Author contributions
Lars von Kolzenberg: conceptualization, methodology, software, validation, formal analysis, investigation, writing – original draft, visualization. Martin Werres: conceptualization, methodology, software, validation, formal analysis, investigation, writing – original draft, visualization. Jonas Tetzloff: methodology, software, formal analysis, writing – review & editing. Birger Horstmann: conceptualization, methodology, writing – review & editing, supervision, funding acquisition, project administration.Conflicts of interest
There are no conflicts to declare.Acknowledgements
Lars von Kolzenberg gratefully acknowledges funding and support by the German Research Foundation (DFG) within the research training group SiMET under the project number 281041241/GRK2218. Martin Werres gratefully acknowledges financial support within the Lillint project (03XP0225A). The support of the bwHPC initiative through the use of the JUSTUS HPC facility at Ulm University is acknowledged. This work contributes to the research performed at CELEST (Center for Electrochemical Energy Storage Ulm-Karlsruhe).References
- C. A. Pineda, M. Peisach, L. Jacobson and C. G. Sampson, Cation-ratio differences in rock patina on hornfels and chalcedony using thick target PIXE, Nucl. Instrum. Methods Phys. Res., Sect. B, 1990, 49(1–4), 332–335 CrossRef.
- M. Garcia-Vallès, M. Vendrell-Saz, J. Molera and F. Blazquez, Interaction of rock and atmosphere: Patinas on Mediterranean monuments, Environ. Geol., 1998, 36(1–2), 137–149 CrossRef.
- S. J. Wentworth, L. P. Keller, D. S. McKay and R. V. Morris, Space weathering on the Moon: Patina on Apollo 17 samples 75075 and 76015, Meteorit. Planet. Sci., 1999, 34(4), 593–603 CrossRef CAS.
- J. H. Payer, G. Ball, B. I. Rickett and H. S. Kim, Role of transport properties in corrosion product growth, Mater. Sci. Eng., A, 1995, 198(1–2), 91–102 CrossRef.
- L. Robbiola, J. M. Blengino and C. Fiaud, Morphology and mechanisms of formation of natural patinas on archaeological Cu-Sn alloys, Corros. Sci., 1998, 40(12), 2083–2111 CrossRef CAS.
- D. D. Macdonald, Passivity-the key to our metals-based civilization, Pure Appl. Chem., 1999, 71(6), 951–978 CrossRef CAS.
- X. Zhang, W. He, I. Odnevall Wallinder, J. Pan and C. Leygraf, Determination of instantaneous corrosion rates and runoff rates of copper from naturally patinated copper during continuous rain events, Corros. Sci., 2002, 44(9), 2131–2151 CrossRef CAS.
- J. Sandberg, I. Odnevall Wallinder, C. Leygraf and N. Le Bozec, Corrosion-induced copper runoff from naturally and pre-patinated copper in a marine environment, Corros. Sci., 2006, 48(12), 4316–4338 CrossRef CAS.
- N. Souissi, E. Triki, L. Bousselmi and S. Khosrof, Comparaison between archaeological and artificially aged bronze interfaces, Werkst. Korros., 2006, 57, 794–799 CrossRef CAS.
- L. Muresan, S. Varvara, E. Stupnišek-Lisac, H. Otmačić, K. Marušić and S. Horvat-Kurbegović, et al., Protection of bronze covered with patina by innoxious organic substances, Electrochim. Acta, 2007, 52(27 SPEC. ISS.), 7770–7779 CrossRef CAS.
- R. D. P. Hernández, I. V. Aoki, B. Tribollet and H. G. De Melo, Electrochemical impedance spectroscopy investigation of the electrochemical behaviour of copper coated with artificial patina layers and submitted to wet and dry cycles, Electrochim. Acta, 2011, 56(7), 2801–2814 CrossRef.
- S. J. Travassos, C. R. Tomachuk and H. G. de Melo, EIS investigation and patina characterization of weathering steel exposed to each of the four seasons in the São Paulo metropolitan area, Electrochim. Acta, 2019, 325, 134885 CrossRef CAS.
- A. Doménech-Carbo, Electrochemical dating: a review, J. Solid State Electrochem., 2017, 21(7), 1987–1998 CrossRef.
- A. Doménech-Carbó and F. Scholz, Electrochemical Age Determinations of Metallic Specimens-Utilization of the Corrosion Clock, Acc. Chem. Res., 2019, 52(2), 400–406 CrossRef PubMed.
- D. D. Macdonald, K. M. Ismail and E. Sikora, Characterization of the Passive State on Zinc, J. Electrochem. Soc., 1998, 145(9), 3141–3149 CrossRef CAS.
- S. Thomas, N. Birbilis, M. S. Venkatraman and I. S. Cole, Self-repairing oxides to protect zinc: Review, discussion and prospects, Corros. Sci., 2013, 69, 11–22 CrossRef CAS.
- K. Yoshikawa, H. Kawasaki, W. Yoshida, T. Irie, K. Konishi and K. Nakano, et al., Silicon heterojunction solar cell with interdigitated back contacts for a photoconversion efficiency over 26%, Nat. Energy, 2017, 2(5), 1–8 Search PubMed.
- K. Masuko, M. Shigematsu, T. Hashiguchi, D. Fujishima, M. Kai and N. Yoshimura, et al., Achievement of more than 25% conversion efficiency with crystalline silicon heterojunction solar cell, IEEE J. Photovolt., 2014, 4(6), 1433–1435 Search PubMed.
- S. De Wolf, A. Descoeudres, Z. C. Holman and C. Ballif, High-efficiency silicon heterojunction solar cells: A review, Green, 2012, 2(1), 7–24 CrossRef CAS.
- M. Tanaka, M. Taguchi, T. Matsuyama, T. Sawada, S. Tsuda and S. Nakano, et al., Development of new a-Si/c-Si heterojunction solar cells: ACJ-HIT (artificially constructed junction-heterojunction with intrinsic thin-layer), Jpn. J. Appl. Phys., 1992, 31(11R), 3518 CrossRef CAS.
- W. van Sark, L. Korte and F. Roca, Introduction-Physics and Technology of Amorphous-Crystalline Heterostructure Silicon Solar Cells, Physics and Technology of Amorphous-Crystalline Heterostructure Silicon Solar Cells, Springer, 2012, pp. 1–12 Search PubMed.
- S. Nunomura, I. Sakata, H. Sakakita, K. Koga and M. Shiratani, Real-time monitoring of surface passivation of crystalline silicon during growth of amorphous and epitaxial silicon layer, J. Appl. Phys., 2020, 128(3), 033302 CrossRef CAS.
- A. G. Aberle, Overview on SiN surface passivation of crystalline silicon solar cells, Sol. Energy Mater. Sol. Cells, 2001, 65(1–4), 239–248 CrossRef CAS.
- A. G. Aberle, Surface passivation of crystalline silicon solar cells: a review, Prog. Photovoltaics, 2000, 8(5), 473–487 CAS.
- Y. Larionova, V. Mertens, N. Harder and R. Brendel, Surface passivation of n-type Czochralski silicon substrates by thermal-SiO2/plasma-enhanced chemical vapor deposition SiN stacks, Appl. Phys. Lett., 2010, 96(3), 32105 CrossRef.
- M. J. Kerr, J. Schmidt, A. Cuevas and J. H. Bultman, Surface recombination velocity of phosphorus-diffused silicon solar cell emitters passivated with plasma enhanced chemical vapor deposited silicon nitride and thermal silicon oxide, J. Appl. Phys., 2001, 89(7), 3821–3826 CrossRef CAS.
- E. Peled, The Electrochemical Behavior of Alkali and Alkaline Earth Metals in Nonaqueous Battery Systems—The Solid Electrolyte Interphase Model, J. Electrochem. Soc., 1979, 126(12), 2047, DOI:10.1149/1.2128859.
- E. Peled and S. Menkin, Review—SEI: Past, Present and Future, J. Electrochem. Soc., 2017, 164(7), A1703–A1719, DOI:10.1149/2.1441707jes.
- A. Wang, S. Kadam, H. Li, S. Shi and Y. Qi, Review on modeling of the anode solid electrolyte interphase (SEI) for lithium-ion batteries, Npj Comput. Mater., 2018, 4(1), 1–26 CrossRef CAS , Available from: https://www.nature.com/articlgreees/s41524-018-0064-0.
- B. Horstmann, F. Single and A. Latz, Review on multi-scale models of solid-electrolyte interphase formation, Curr. Opin. Electrochem., 2019, 13, 61–69, DOI:10.1016/j.coelec.2018.10.013.
- L. von Kolzenberg, A. Latz and B. Horstmann, Solid–Electrolyte Interphase During Battery Cycling: Theory of Growth Regimes, ChemSusChem, 2020, 13(15), 3901–3910 CrossRef CAS PubMed.
- S. Das, P. M. Attia, W. C. Chueh and M. Z. Bazant, Electrochemical Kinetics of SEI Growth on Carbon Black: Part II. Modeling, J. Electrochem. Soc., 2019, 166(4), E107–E118 CrossRef CAS.
- O. C. Harris, K. Leung and M. H. Tang, How Transition Metals Enable Electron Transfer through the SEI: Part II. Redox-Cycling Mechanism Model and Experiment, J. Electrochem. Soc., 2020, 167(1), 013503 CrossRef CAS.
- F. Hao, Z. Liu, P. B. Balbuena and P. P. Mukherjee, Mesoscale Elucidation of Solid Electrolyte Interphase Layer Formation in Li-Ion Battery Anode, J. Phys. Chem. C, 2017, 121(47), 26233–26240 CrossRef.
- F. T. Krauss, I. Pantenburg and B. Roling, Transport of Ions, Molecules, and Electrons across the Solid Electrolyte Interphase: What Is Our Current Level of Understanding?, Adv. Mater. Interfaces, 2022, 9(8), 2101891 CrossRef CAS.
- B. E. Deal and A. S. Grove, General relationship for the thermal oxidation of silicon, J. Appl. Phys., 1965, 36(12), 3770–3778 CrossRef CAS.
- A. Doménech-Carbó, M. T. Doménech-Carbó, S. Capelo, T. Pasíes and I. Martínez-Lázaro, Dating Archaeological Copper/Bronze Artifacts by Using the Voltammetry of Microparticles, Angew. Chem., 2014, 126(35), 9416–9420 CrossRef.
- F. Single, B. Horstmann and A. Latz, Dynamics and morphology of solid electrolyte interphase (SEI), Phys. Chem. Chem. Phys., 2016, 18(27), 17810–17814 RSC , Available from: http://xlink.rsc.org/?DOI=C6CP02816K.
- F. Single, B. Horstmann and A. Latz, Revealing SEI Morphology: In-Depth Analysis of a Modeling Approach, J. Electrochem. Soc., 2017, 164(11), E3132–E3145, DOI:10.1149/2.0121711jes.
- F. Single, A. Latz and B. Horstmann, Identifying the Mechanism of Continued Growth of the Solid–Electrolyte Interphase, ChemSusChem, 2018, 11(12), 1950–1955 CrossRef CAS PubMed.
- J. N. Chazalviel and F. Ozanam, Electrochemically formed porous silica, Materials, 2010, 4(5), 825–844 CrossRef PubMed.
- T. Graedel, Gildes model studies of aqueous chemistry. I. Formulation and potential applications of the multi-regime model, Corros. Sci., 1996, 38(12), 2153–2180 CrossRef CAS.
- J. Tidblad and T. E. Graedel, Gildes model studies of aqueous chemistry. III. Initial SO2-induced atmospheric corrosion of copper, Corros. Sci., 1996, 38(12), 2201–2224 CrossRef CAS.
- J. Tidblad and T. E. Graedel, Gildes model studies of aqueous chemistry. III. Initial SO2-induced atmospheric corrosion of copper, Corros. Sci., 1996, 38(12), 2201–2224 CrossRef CAS.
- R. S. Larson, A Physical and Mathematical Model for the Atmospheric Sulfidation of Copper by Hydrogen Sulfide, J. Electrochem. Soc., 2002, 149(2), B40 CrossRef CAS.
- A Atrens, K Fitzgerald, G Skeleton and J. Nairn, Composition and structure of copper patinas, Proceedings: 13thInternational Corrosion Congress. Australasian Corrosion Association, 1996.
- P. Lu and S. J. Harris, Lithium transport within the solid electrolyte interphase, Electrochem. Commun., 2011, 13(10), 1035–1037 CrossRef CAS.
- S. J. Harris and P. Lu, Effects of inhomogeneities-Nanoscale to mesoscale -on the durability of Li-ion batteries, J. Phys. Chem. C, 2013, 117(13), 6481–6492 CrossRef CAS.
- P. Lu, C. Li, E. W. Schneider and S. J. Harris, Chemistry, impedance, and morphology evolution in solid electrolyte interphase films during formation in lithium ion batteries, J. Phys. Chem. C, 2014, 118(2), 896–903 CrossRef CAS.
- J. M. Kim and J. M. Kosterlitz, Growth in a Restricted Solid-on-Solid Model, Phys. Rev. Lett., 1989, 62(19), 2289–2292 CrossRef PubMed.
- F. Clarelli, B. De Filippo and R. Natalini, Mathematical model of copper corrosion, Appl. Math. Models, 2014, 38(19–20), 4804–4816, DOI:10.1016/j.apm.2014.03.040.
- S. Shi, Y. Qi, H. Li and L. G. Hector, Defect Thermodynamics and Diffusion Mechanisms in Li2CO3 and Implications for the Solid Electrolyte Interphase in Li-Ion Batteries, J. Phys. Chem. C, 2013, 117(17), 8579–8593, DOI:10.1021/jp310591u.
- F. A. Soto, Y. Ma, J. M. Martinez De La Hoz, J. M. Seminario and P. B. Balbuena, Formation and Growth Mechanisms of Solid-Electrolyte Interphase Layers in Rechargeable Batteries, Chem. Mater., 2015, 27(23), 7990–8000 CrossRef CAS.
- B. Horstmann, B. Gallant, R. Mitchell, W. G. Bessler, Y. Shao-Horn and M. Z. Bazant, Rate-dependent morphology of Li2O2 growth in Li-O2 batteries, J. Phys. Chem. Lett., 2013, 4(24), 4217–4222 CrossRef CAS PubMed.
- D. Fraggedakis and M. Z. Bazant, Tuning the stability of electrochemical interfaces by electron transfer reactions, J. Chem. Phys., 2020, 152(18), 184703, DOI:10.1063/5.0006833.
- M. Z. Bazant, Thermodynamic stability of driven open systems and control of phase separation by electro-autocatalysis, Faraday Discuss., 2017, 199, 423–463 RSC.
- A. Latz and J. Zausch, Thermodynamic derivation of a Butler-Volmer model for intercalation in Li-ion batteries, Electrochim. Acta, 2013, 110, 358–362, DOI:10.1016/j.electacta.2013.06.043.
- M. Z. Bazant, Theory of chemical kinetics and charge transfer based on nonequilibrium thermodynamics, Acc. Chem. Res., 2013, 46(5), 1144–1160 CrossRef CAS PubMed.
- O. Borodin, G. D. Smith and P. Fan, Molecular dynamics simulations of lithium alkyl carbonates, J. Phys. Chem. B, 2006, 110(45), 22773–22779 CrossRef CAS PubMed.
- H. A. Stone and D. Margetis, Continuum Descriptions of Crystal Surface Evolution, Handbook of Materials Modeling, Springer Netherlands, 2005, vol. I, pp. 1389–1401 Search PubMed.
- S. Y. Luchkin, S. A. Lipovskikh, N. S. Katorova, A. A. Savina, A. M. Abakumov and K. J. Stevenson, Solid-electrolyte interphase nucleation and growth on carbonaceous negative electrodes for Li-ion batteries visualized with in situ atomic force microscopy, Sci. Rep., 2020, 10(1), 1–10 CrossRef PubMed.
- L. von Kolzenberg, A. Latz and B. Horstmann, Chemo-Mechanical Model of SEI Growth on Silicon Electrode Particles, Batteries Supercaps, 2022, 5, e202100216 CAS.
- C. R. Birkl, E. McTurk, M. R. Roberts, P. G. Bruce and D. A. Howey, A Parametric Open Circuit Voltage Model for Lithium Ion Batteries, J. Electrochem. Soc., 2015, 162(12), A2271–A2280 CrossRef CAS.
- P. Keil, S. F. Schuster, J. Wilhelm, J. Travi, A. Hauser and R. C. Karl, et al., Calendar Aging of Lithium-Ion Batteries, J. Electrochem. Soc., 2016, 163(9), A1872–A1880 CrossRef CAS.
- P. Keil and A. Jossen, Calendar Aging of NCA Lithium-Ion Batteries Investigated by Differential Voltage Analysis and Coulomb Tracking, J. Electrochem. Soc., 2017, 164(1), A6066–A6074 CrossRef CAS.
- M. Broussely, S. Herreyre, P. Biensan, P. Kasztejna, K. Nechev and R. J. Staniewicz, Aging mechanism in Li ion cells and calendar life predictions, J. Power Sources, 2001, 97-98, 13–21 CrossRef CAS.
- Y. Li, W. Huang, Y. Li, A. Pei, D. T. Boyle and Y. Cui, Correlating Structure and Function of Battery Interphases at Atomic Resolution Using Cryoelectron Microscopy, Joule, 2018, 2(10), 2167–2177, DOI:10.1016/j.joule.2018.08.004.
- W. Huang, P. M. Attia, H. Wang, S. E. Renfrew, N. Jin and S. Das, et al., Evolution of the Solid-Electrolyte Interphase on Carbonaceous Anodes Visualized by Atomic-Resolution Cryogenic Electron Microscopy, Nano Lett., 2019, 19(8), 5140–5148, DOI:10.1021/acs.nanolett.9b01515.
- W. Huang, J. Wang, M. R. Braun, Z. Zhang, Y. Li and D. T. Boyle, et al., Dynamic Structure and Chemistry of the Silicon Solid-Electrolyte Interphase Visualized by Cryogenic Electron Microscopy, Matter, 2019, 1(5), 1232–1245, DOI:10.1016/j.matt.2019.09.020.
- W. Huang, H. Wang, D. T. Boyle, Y. Li and Y. Cui, Resolving Nanoscopic and Mesoscopic Heterogeneity of Fluorinated Species in Battery Solid-Electrolyte Interphases by Cryogenic Electron Microscopy, ACS Energy Lett., 2020, 1128–1135 CrossRef CAS.
Footnotes |
| † Electronic supplementary information (ESI) available. See DOI: https://doi.org/10.1039/d2cp00188h |
| ‡ These authors contributed equally to this work. |
| This journal is © the Owner Societies 2022 |

