 Open Access Article
Creative Commons Attribution 3.0 Unported Licence
Polymer indicator displacement assay: electrochemical glucose monitoring based on boronic acid receptors and graphene foam competitively binding with poly-nordihydroguaiaretic acid†
Simon M.
Wikeley
 a,
Jakub
Przybylowski
a,
Pablo
Lozano-Sanchez
b,
Marco
Caffio
b,
Tony D.
James
a,
Jakub
Przybylowski
a,
Pablo
Lozano-Sanchez
b,
Marco
Caffio
b,
Tony D.
James
 *ac,
Steven D.
Bull
a,
Philip J.
Fletcher
d and
Frank
Marken
 *a
*a
aDepartment of Chemistry, University of Bath, Claverton Down, Bath BA2 7AY, UK. E-mail: f.marken@bath.ac.uk; t.d.james@bath.ac.uk
bIntegrated Graphene Ltd., Euro House, Wellgreen Place, Stirling FK8 2DJ, UK
cSchool of Chemistry and Chemical Engineering, Henan Normal University, Xinxiang 453007, China
dUniversity of Bath, Materials & Chemical Characterisation Facility, MC2, Bath BA2 7AY, UK
First published on 19th January 2022
Abstract
The concept of a reversible polymer displacement sensor mechanism for electrochemical glucose monitoring is demonstrated. A pyrene-derivatised boronic acid chemo-receptor for glucose is adsorbed onto a graphene foam electrode. Spontaneous oxidative polymerisation of nordihydroguaiaretic acid (NHG) onto the graphene foam electrode leads to a redox active film (poly-NHG) covalently attached to the boronic acid receptors. Oxidation of poly-NHG frees the boronic acid receptors to interact with glucose from the solution phase, which is detected due to competitive binding when reduced poly-NHG re-binds to the boronic acid functional groups. The sensor shows the anticipated boronic acid selectivity of fructose > glucose. The ratio of charges under the voltammetric peaks for poly-NHG unbound and bound is employed for glucose sensing with an approximately linear analytical range from 1 to 50 mM glucose in aqueous pH 7 buffer. The new methodology is shown to give apparent saccharide – boronic acid binding constants and to work in human serum. Therefore, in the future it could be developed further for glucose monitoring.
1. Introduction
Diabetes is a chronic condition in which the sufferer can no longer naturally regulate their own blood glucose levels, either due to not being able to produce insulin (type I) or due to a loss of cell responsiveness to insulin (type II). In both cases, successful diabetes management relies upon accurate and sensitive blood glucose testing methods to inform insulin dosage. A vast number of glucose detection methods already exists.1,2 The most common techniques applied to clinical sensing make use of enzymes such as glucose oxidase for electrochemical glucose detection, thereby classifying them as biosensors.3 However, enzyme-based biosensors are inherently affected by changes in temperature, pH and are dependent on localised oxygen concentration in the analyte, which can lead to reliability issues and may impact upon the ability of the patient to effectively manage their condition.4 Furthermore, current electrochemical glucose sensors on the market today are expensive (it is estimated that £172 million was spent on glucose monitors in 2012 by the NHS alone).5 Therefore, it is clinically and fiscally desirable to uncover new, enzyme-free glucose monitoring sensor solutions. Here, we propose an alternative, low-cost yet effective electrochemical glucose chemo-sensing technique based on a boronic acid functionalised graphene foam electrode in conjunction with a redox-active polymer. The sensor mechanism relies on temporary polymer displacement.Boronic acids have previously been explored for their potential in glucose detection, often in optical or fluorescence methods.6–9 Electrochemical detection methods based on boronic acids have been developed10 for a range of analytes. In this work, we exploit the known ability of boronic acids to act as a chemo-receptors and form cyclic boronic esters with diols such as glucose or fructose (more specifically α-D-glucofuranose or β-D-fructofuranose, the isomers that bind most strongly,11 Fig. S1†) in the fabrication of our boronic acid-based electrochemical sensor. The chosen boronic acid for this work was 4-borono-1-(pyren-2-ylmethyl)pyridin-1-ium bromide (abbreviated T1; see Fig. S1A†), a pyrene-appended pyridinium boronic acid receptor that has been employed previously.12
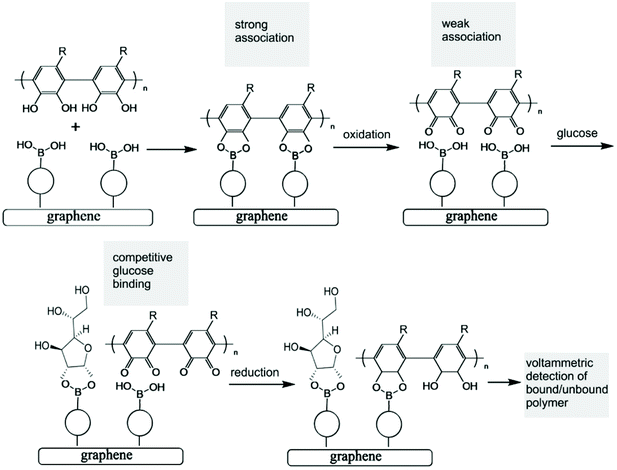
Both the boronic acid and the glucose analyte are not redox active and therefore not easily detected at electrodes under physiological conditions. A competitive assay would require a redox active molecule to bind to the boronic acid in competition with glucose, but this would not be practical due to loss of the redox indicator into the solution. However, the introduction of a redox-active polymer (here based on poly-nordihydroguaiaretic acid – a polymeric material of medicinal interest13,14 – with additional dispersion interaction to the graphene foam substrate) into the boronic acid – based electrochemical sensor design confers many advantages to the sensor. Firstly, the polymer can act as a molecular sieve, filtering out larger molecules in the blood that may disrupt or interfere with glucose sensing (such as plasma proteins and/or red blood cells). Secondly, the polymer could increase the stability and resistance of the system to degradation and mechanical damage (i.e. keeping the boronic acid in place), which is of particular importance for the proposed application as a clinical, point-of-care glucose sensor. Most importantly, the redox-active polymer remains bound to the electrode even when displaced from the boronic acid receptor. This provides a re-usable device with the capability to monitor glucose levels rather than just giving a one-point measurement. The polymer indicator displacement assay methodology is illustrated in Fig. 1.
The analytical detection mechanism for glucose and other species able to form boronic ester complexes with T1 is based on the ability to decouple boronic acid–polymer covalent complexes (due to ortho-quinol oxidation to ortho-quinone) formed on the T1 – functionalised graphene foam electrode during polymerisation. Decoupling of the boronic acid–polymer complex on the graphene foam electrode creates ‘free’ boronic acid binding sites, which can then interact competitively with relevant diols (such as glucose) that may be present in solution, reducing the number of boronic acid binding sites for the polymer to re-bind to (after ortho-quinone reduction back to ortho-quinol). This is shown here to cause voltammetric peak signals, which are related to the diol/glucose concentration.
2. Experimental
2.1. Chemical reagents
Nordihydroguaiaretic acid (NHG; CAS Number 500-38-9; molecular weight 302.37 g mol−1), chloroform (>99%), ethanol (ACS Reagent), NaH2PO4, Na2HPO4, glucose, and fructose were obtained from Sigma-Aldrich and used without further purification. Demineralised and filtered water (ultrapure, 18.2 MΩ cm at 18 °C) was taken from a Thermo-Fisher water purification system.2.2. Instrumentation
A computer controlled Ivium Compactstat instrument (Ivium, The Netherlands) was employed for electrochemical measurements. Graphene foam electrodes were obtained from Integrated Graphene Ltd. Electrochemical measurements were performed with a single droplet (volume 100 μL) placed onto the graphene foam electrode. The working electrode was graphene foam (4 mm diameter disk, approx. 40 μm thick) with a counter electrode (1 mm ring) and a printed Ag/AgCl reference electrode. Scanning electron micrographs were obtained with JEOL JSM-7900F field emission scanning electron microscope (FE-SEM) with attached Oxford Instruments Ultim Extreme 100 mm2 low kV energy dispersive X-ray analyser (EDX). Raman spectroscopy was performed at 532 nm excitation with a Renishaw inVia confocal Raman microscope.2.3. Characterisation
2.4. Procedure
3. Results and discussion
3.1. Binding of nordihydroguaiaretic acid onto a graphene foam electrode
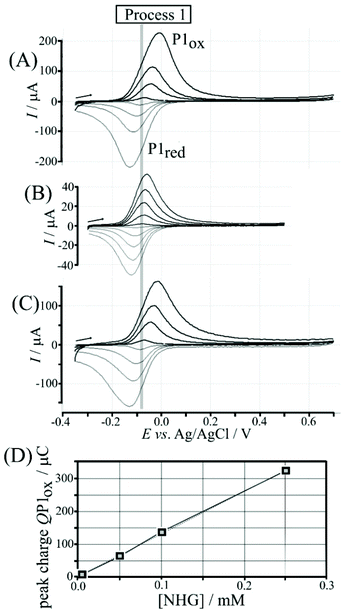
Nordihydroguaiaretic acid (NHG) is poorly soluble in aqueous media but can be readily dispersed by initially preparing 5 mM ethanolic solution followed by dilution in 0.1 M phosphate buffer pH 7. Fig. 2A shows cyclic voltammetry data for 0.1 M phosphate buffer solution (pH 7) containing 0.005, 0.05, 0.10, and 0.25 mM NHG. The symmetric shapes of these cyclic voltammograms (with E1/2 = ½Eox + ½Ered = −0.08 V vs. Ag/AgCl) differ from classic diffusion-controlled signal shapes. This shape is indicative of a surface-immobilised redox system, which is linked to spontaneous (or electrochemically induced) polymerisation of NHG onto graphene foam. Transfer of the electrode into clean phosphate buffer solution without dissolved NHG demonstrates that poly-NHG is indeed immobilised at the graphene foam (Fig. 2B). The charge under oxidation and reduction peaks is essentially independent of scan rate. Similar immobilisation processes have been reported previously16,17 and are known to result in poly-NHG as a deposit on the electrode surface. The equilibrium potential (open circuit) of a graphene foam electrode immersed in aerated phosphate buffer pH 7 is approximately 0.1 V vs. SCE (due to the presence of oxygen in solution), which is sufficiently positive to drive the spontaneous anodic polymer formation (see Fig. S3†) in aerated aqueous buffer, on graphene foam, and without externally applied voltage.Poly-(nordihydroguaiaretic acid) (or poly-NHG) formation occurs spontaneously at the graphene foam electrode upon addition of a droplet of aqueous NHG solution onto the graphene foam electrode (see Experimental). Fig. S3† tentatively suggests a molecular structure consistent with this reactivity although the molecular structure of poly-NHG has currently not been elucidated. The presence of ortho-quinol groups is supported by the electrochemical oxidation response that is consistent with the oxidation of the mono-molecular NHG molecule (and by literature reports on poly-NHG formation18). There are related ortho-quinol redox systems with a related pattern of polymerisation reactivity, e.g. formation of poly-dopamine19 or formation of poly-caffeic acid.20,21 The resulting poly-NHG is anticipated to adhere well to the hydrophobic graphene foam electrode surface. The amount deposited onto the surface (330 μC for 0.25 mM NHG solution) corresponds to about 10% of the solution species (deposited spontaneously within 30 minutes) and this amount is indicative of multi-layer formation. The geometric area of the graphene foam working electrode (4 mm diameter disk) is 12.5 × 10⁻⁶ m2 with a roughness factor of roughly 100 (estimated from electron micrographs in Fig. S2A†). Even taking into account the roughness factor, the resulting footprint per molecule would be unreasonably small for a monolayer, clearly suggesting multi-layer polymer formation. The thickness of the resulting poly-NHG is below that for imaging in electron microscopy (see Fig. S2G†). The thickness of the poly-NHG film is controlled by the concentration of NHG in the deposition solution (see Fig. 2D).
The poly-NHG film was further investigated using cyclic voltammetry. Fig. 2B shows data for poly-NHG immobilised onto the graphene foam electrode immersed in 0.1 M phosphate buffer solution pH 7. Clear oxidation and back-reduction current signals are observed in the potential region consistent with NHG ortho-quinols.22 When systematically changing the scan rate, the peak current varies, but the charges under the oxidation and reduction peaks remain essentially constant. The peaks can be assigned (tentatively) as cathodic and anodic processes for immobilised poly-NHG (corresponding to oxidation of the ortho-quinol and reduction of the ortho-quinone, see Fig. 3).
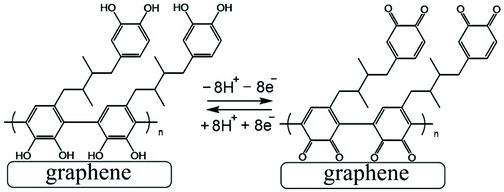 | ||
| Fig. 3 Illustration of Process 1, the oxidation and back reduction of poly-NHG (tentatively assigned molecular structure). | ||
3.2. Binding of poly-nordihydroguaiaretic acid onto a boronic acid modified graphene foam electrode
Next, a pyrene boronic acid (T1, see Fig. 4) is introduced onto the graphene-foam electrode surface. The pyrene is known to attach to the graphene surface.23 Here, a drop-casting method is employed with T1 dissolved in chloroform (1 mg mL−1) being evaporated onto the graphene-foam (see Experimental).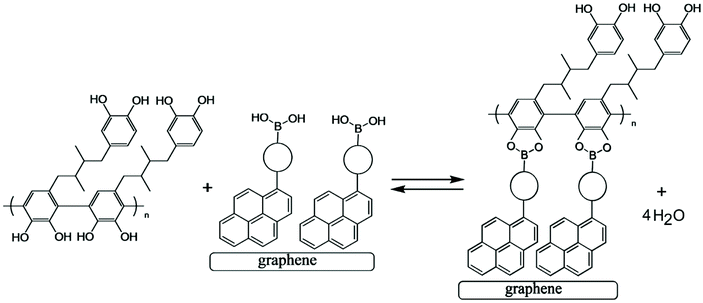 | ||
| Fig. 4 Condensation reaction between a boronic acid and poly-NHG forming the boronate ester at the electrode surface. | ||
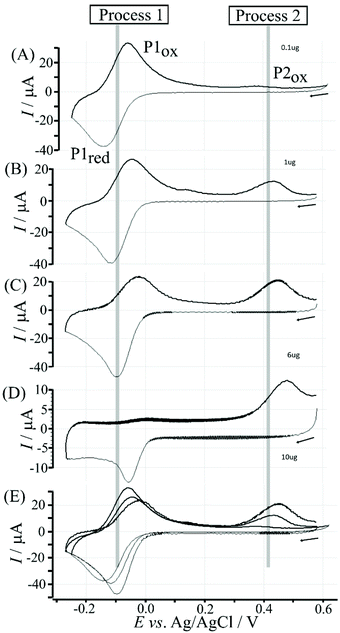
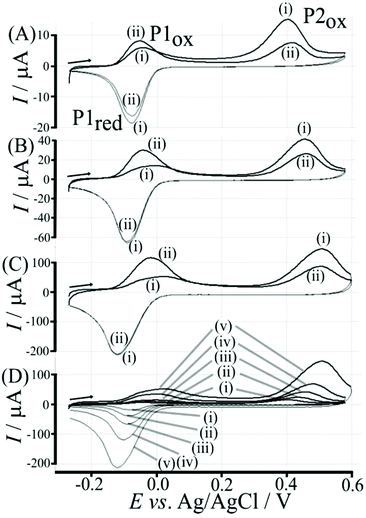
Data in Fig. 5 show how the amount of T1 on the surface affects the voltammetric signals. Fig. 5A shows the effect of 0.1 μg T1 immobilisation. The poly-NHG redox system is not strongly affected and only a new minor peak at 0.35 V vs. Ag/AgCl indicates a change. When increasing the amount of T1 to 1 μg (Fig. 5B) the product peak is stronger and shifted to 0.44 V vs. Ag/AgCl. With 6 μg T1 (Fig. 5C) an optimum case is observed with Process 1 (see Fig. 3) and Process 2 (see Fig. 6) both clearly observed. Further increase in the amount of T1 (see Fig. 5D) causes partial blocking of the electrode and diminished voltammetric responses. The “footprint” of T1 is linked to the pyrene unit and can be estimated as 8 Å × 8 Å = 64 Å2. The resulting covered area for 6 μg T1 should be 6 × 10⁻³ m2, which compares well with the estimated graphene area of about 2 × 10⁻³ m2 (including the roughness factor 100, vide supra). Fig. 5E shows an overlay of voltammetric data as a function of T1 surface coverage demonstrating (A) the gradual blocking of electron transfer by T1 (widening of the peak-to-peak separation for Process 1) and (B) the gradual increase in the peak for Process 2. The gradual shift of the peak potential for Process 2 towards more positive values is likely to also reflect slower electron transfer across the T1-modified graphene foam interface.
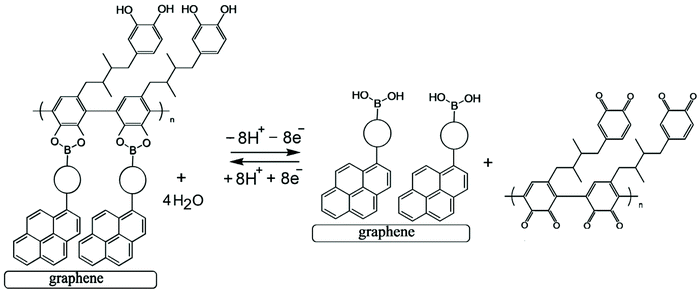 | ||
| Fig. 6 Illustration of Process 2 based on oxidative boronate bond breaking and ortho-quinone formation. | ||
Electrochemical processes in Fig. 5 are indicated as Process 1 and Process 2. Process 1 is associated with the poly-NHG oxidation and back-reduction (see Fig. 3). Process 2 is associated with the oxidation of poly-NHG bound to the boronic acid (see Fig. 6). Process 2 leads to boronic ester bond breaking and temporary anodic disconnection of the poly-NHG.
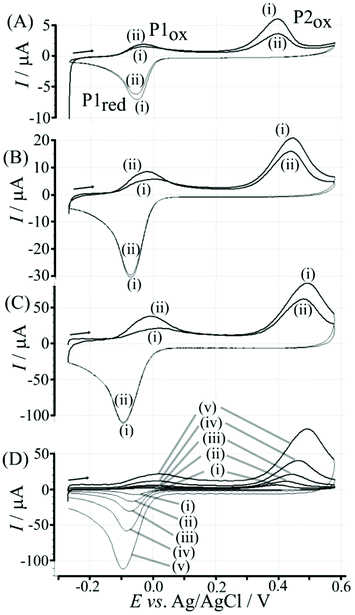
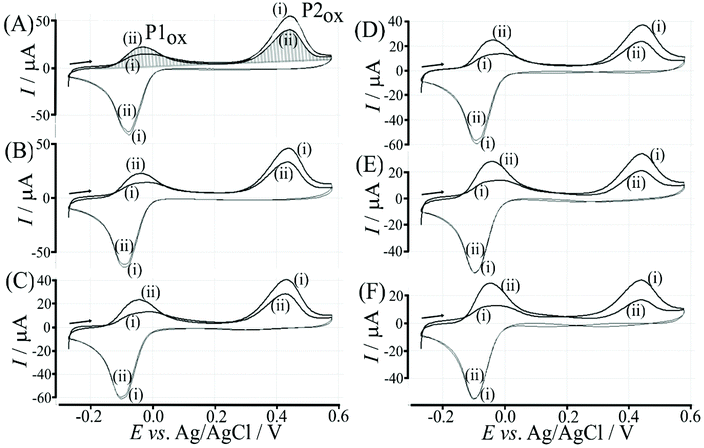
Fig. 4 illustrates how poly-NHG will form and bind to the T1-modified graphene surface. When a positive potential of +0.5 V vs. Ag/AgCl is applied, the ortho-quinol is oxidised to the ortho-quinone and the bond to the boronic acid is broken (see Fig. 6; polymer displacement). This phenomenon is studied next as a function of scan rate. Fig. 7 shows the cyclic voltammetry data (first and second potential cycle) for NHG oxidation immobilised on T1 on a graphene foam electrode. The experiment is started at −0.3 V vs. Ag/AgCl where NHG is in the reduced state and bound to T1. The first oxidation peak at −0.05 V vs. Ag/AgCl (associated with unbound poly-NHG) is small. A second oxidation peak at +0.4 V vs. Ag/AgCl then is associated with the breaking of the boronic acid to ortho-quinol bond (see Fig. 6). The reduction peak at −0.05 V vs. Ag/AgCl is associated with the reduction back to the ortho-quinol and therefore with re-binding of boronic acid and NHG. This re-binding process is time dependent as can be seen from the effect of scan rate. With faster scan rates P1ox for first and second potential cycle are different. P1ox increases as not all poly-NHG is re-binding to the boronic acid. The re-binding process occurs on the second timescale.
The re-binding process is likely to be sensitive (retarded) due to competitive binding for example to glucose. This is investigated next. Fig. 8 demonstrates the effect of 50 mM glucose in solution. For all scan rates the change between P1ox in the first cycle to P1ox in the second cycle is substantially increased compared to data in Fig. 7. The glucose is able to bind to the boronic acid and in this way causes a competition process that slows down the poly-NHG re-connection process. Most clearly observed is the effect of the glucose when comparing data for 10 mV s−1 (Fig. 7A and 8A) when the peak charge ratio for P1ox(ii) and P2ox(ii) is examined. In the presence of glucose P2ox(ii) is much smaller compared to P1ox(ii) due to glucose blocking the re-connection process.
3.3. Polymer displacement assay for glucose with poly-nordihydroguaiaretic acid and boronic acid modified graphene foam electrodes
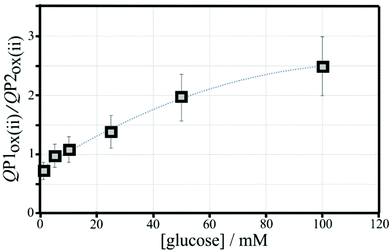
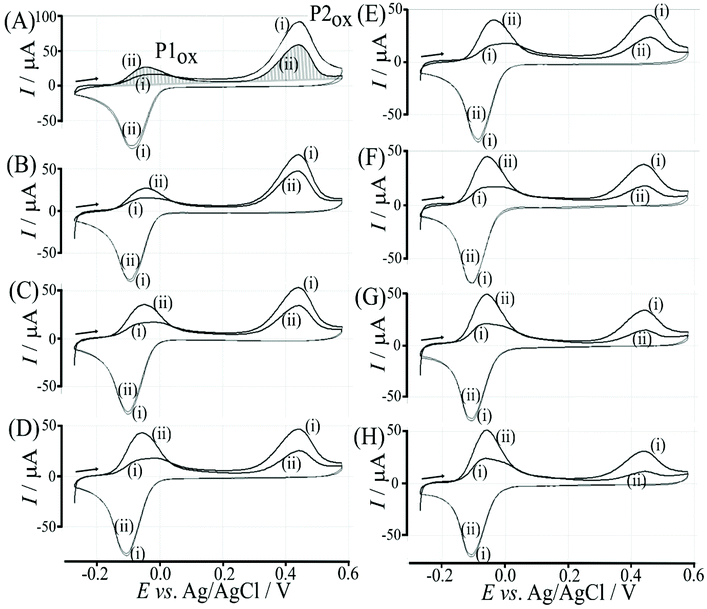
The effect of the glucose concentration on voltammetric characteristics is shown in Fig. 9. The glucose concentration is varied from 1 mM to 100 mM. The effect on P1ox in the first and second potential cycle is clearly observed. In addition, the presence of glucose lowers the current for P2ox in the second potential cycle (due to glucose slowing down re-binding). A measurement of glucose based on these effects is possible based on the ratio of charge under P1ox in the second cycle over the charge under P2ox in the second cycle (see shaded area in Fig. 9A). The use of the ratio of peak charges helps normalising data (for example when the polymer amount on the sensor surface varies). Table S1† summarises some of the peak charges.The charge under peak P1ox(ii) seems to vary systematically with glucose concentration and a normalisation approach can be employed to make data form different experiments more comparable. The ratio of peak charges QP1ox(ii)/QP1red(ii) confirms a systematic trend, although a plateau occurs at higher glucose concentration. The ratio of peak charges QP1ox(ii)/QP2ox(ii) offers a better spread of data points. A plot of the ratio QP1ox(ii)/QP2ox(ii) versus glucose concentration is shown in Fig. 10. An almost linear dependency from 1 mM to 50 mM glucose is observed with plateauing of the data at higher glucose concentrations. A polynomial fit suggests QP1ox(ii)/QP2ox(ii) = −0.0001x2 + 0.03x + 0.765 with x = glucose concentration in mM. There is a considerable error on data points (estimated as 20%) especially at higher glucose concentrations due to uncertainty in the baseline for peak integration.
3.4. Polymer displacement assay for fructose with poly-nordihydroguaiaretic acid and boronic acid modified graphene foam electrodes
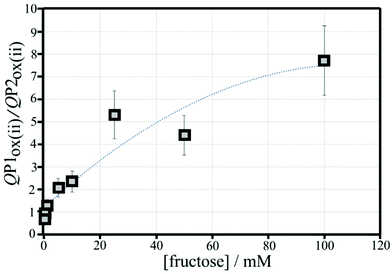
Fructose is known to bind strongly to boronic acids (in the form of the β-D-fructofuranose11) and investigated next. Fig. 11 shows voltammetric data for the poly-NHG oxidation and back-reduction in the presence of different concentrations of fructose. Comparison to data for glucose (Fig. 9) clearly demonstrates the stronger binding.Peak charge data for the second potential cycle is summarised in Table S2.† The peak charge ratio QP1ox(ii)/QP1red(ii) again plateaus, but the peak charge ratio QP1ox(ii)/QP2ox(ii) exhibits a systematic increase with increasing fructose concentration. A plot of this parameter versus fructose concentration is shown in Fig. 12. Again, a second order polynomial can be employed to add a trendline. Errors (estimated as 20%) are mainly due to uncertainty in the baseline for integration.
It is interesting to compare the point at which QP1ox(ii)/QP2ox(ii) is in unity (i.e. half of the boronic acid binding sites are blocked). For fructose this occurs at approx. 0.2 mM and for glucose this is at approx. 8 mM. For Langmuirian binding, the point of half coverage is linked to the binding constants (the binding constant K is given by the inverse of the concentration at half coverage), which suggests Kfructose = 5000 M−1 and Kglucose = 125 M−1 (very approximately; apparent binding constants). The related apparent binding constant in solution for phenylboronic acid with fructose (β-D-fructofuranose) is 4370 M−1, while that with glucose (α-D-glucofuranose) is 110 M−1.11,24 The ratio of these reported apparent binding constants is Kfructose/Kglucose = 40. There is a remarkable agreement in literature and measured apparent binding constants and, although there is currently no direct evidence for Langmuirian binding conditions being obeyed in the presence of poly-NHG, it can be concluded that meaningful binding information can indeed be obtained directly from voltammetric polymer displacement assays.
3.5. Polymer displacement assay for fructose/glucose with poly-nordihydroguaiaretic acid and boronic acid modified graphene foam electrodes in human serum
Further exploratory experiments were performed in pure human serum (Sigma-Aldrich 637810). Of particular interest during this experiment was the possibility of interference in saccharide detection by or electrode foul/or electrode fouling. Fig. 13 shows typical cyclic voltammograms with no sign of detrimental interferences. The electrode modified with fructose-containing serum clearly shows a higher ratio of QP1ox(ii)/QP2ox(ii) consistent with the anticipated polymer indicator displacement in the presence of fructose. However, in contrast to measurements in aqueous buffer media, measurements in serum required a new electrode for each measurement. Therefore, error margins are substantially higher compared to those in data obtained in buffer.Data in Fig. 13 suggests that the polymer indicator displacement mechanism does work even in a complex serum environment, and the QP1ox(ii)/QP2ox(ii) parameter shows fructose binding. But the experimental error introduced by using a new electrode for each measurement currently prevents meaningful calibration or determination of concentrations. Improved electrode design, flow through sensing, and new types of boronic acid with higher affinity to α- or β-D-glucose will be important targets for future research.
4. Conclusion
A boronic acid – functionalised graphene foam electrode has been successfully applied for the detection of glucose via the reversible displacement of a redox-active polymer, poly-NHG. The graphene foam gives a high sensor surface area. Competition for a limited number of boronic acid binding sites (adsorbed to the graphene foam) facilitates the use of cyclic voltammetry to analytically detect glucose or fructose concentrations in solution. The analytical method has been based on double cycle voltammetry and the analysis of the charge under the oxidation peaks for Process 1 (poly-NHG oxidation) and Process 2 (boronic acid bound poly-NHG oxidation). Quantitative information can be obtained not only relating to the concentration of glucose (or fructose) but also linked to apparent binding constants between saccharides and boronic acids in aqueous media.In future work, the analytical methodology needs to be improved and longer-term detection of glucose in real or simulated blood plasma needs to be investigated in more detail. The use of alternative ortho-quinols and other types of boronic acid receptor molecules will be an option to improve the sensor performance. Techniques other than cyclic voltammetry will be necessary to avoid errors in peak integration and to speed up the analytical process for fast glucose concentration monitoring.
Conflicts of interest
There are no conflicts to declare.Acknowledgements
S. M. W. thanks EPSRC (DTP) and Integrated Graphene Ltd. for scholarship support. T. D. J. wishes to thank the Royal Society for a Wolfson Research Merit Award and the Open Research Fund of the School of Chemistry and Chemical Engineering, Henan Normal University for support (2020ZD01).References
- N. S. Oliver, C. Toumazou, A. E. G. Cass and D. G. Johnston, Diabetic Med., 2009, 26, 197–210 CrossRef CAS PubMed.
- D. W. Hwang, S. Lee, M. Seo and T. D. Chung, Anal. Chim. Acta, 2018, 1033, 1–34 CrossRef CAS PubMed.
- H. Lee, Y. J. Hong, S. Baik, T. Hyeon and D. H. Kim, Adv. Healthcare Mater., 2018, 7, 1701150 CrossRef PubMed.
- M. Adeel, M. M. Rahman, I. Caligiuri, V. Canzonieri, F. Rizzolio and S. Daniele, Biosens. Bioelectron., 2020, 165, 112331 CrossRef CAS PubMed.
- P. Kanavos, S. van den Aardweg and W. Schurer, Report on Diabetes expenditure, burden of disease and management in 5 EU countries, LSE Health, London School of Economics, January 2012 Search PubMed.
- A. C. Sedgwick, J. T. Brewster II, T. Wu, X. Feng, S. D. Bull, X. Qian, J. L. Sessler, T. D. James, E. V. Anslyn and X. Sun, Chem. Soc. Rev., 2021, 50, 9–38 RSC.
- J. S. Fossey, F. D'Hooge, J. M. H. van den Elsen, M. P. P. Morais, S. I. Pascu, S. D. Bull, F. Marken, A. T. A. Jenkins, Y. B. Jiang and T. D. James, Chem. Rec., 2012, 12, 464–478 CrossRef CAS PubMed.
- S. D. Bull, M. G. Davidson, J. M. H. Van den Elsen, J. S. Fossey, A. T. A. Jenkins, Y. B. Jiang, Y. Kubo, F. Marken, K. Sakurai, J. Z. Zhao and T. D. James, Acc. Chem. Res., 2013, 46, 312–326 CrossRef CAS PubMed.
- G. T. Williams, J. L. Kedge and J. S. Fossey, ACS Sens., 2021, 6, 1508–1528 CrossRef CAS PubMed.
- M. Li, W. H. Zhu, F. Marken and T. D. James, Chem. Commun., 2015, 51, 14562–14573 RSC.
- X. Wu, Z. Li, X. X. Chen, J. S. Fossey, T. D. James and Y. B. Jiang, Chem. Soc. Rev., 2013, 42, 8032–8048 RSC.
- K. Lawrence, T. Nishimura, P. Haffenden, J. M. Mitchels, K. Sakurai, J. S. Fossey, S. D. Bull, T. D. James and F. Marken, New J. Chem., 2013, 37, 1883–1888 RSC.
- J. D. Lambert, R. T. Dorr and B. N. Timmermann, Pharm. Biol., 2004, 42, 149–158 CrossRef CAS.
- G. S. M. John, V. K. Vuttaradhi, S. Takeuchi, R. S. Pitani, G. Venkatraman and S. K. Rayala, J. Nanobiotechnol., 2020, 18, 74 CrossRef CAS PubMed.
- A. C. Ferrari and D. M. Basko, Nat. Nanotechnol., 2013, 8, 235–246 CrossRef CAS PubMed.
- S. M. Chen and M. I. Liu, Electrochim. Acta, 2006, 51, 4744–4753 CrossRef CAS.
- S. M. Chen and M. I. Liu, J. Electroanal. Chem., 2005, 579, 153–162 CrossRef CAS.
- Y. Li, Y. Umasankar and S. M. Chen, Anal. Biochem., 2009, 388, 288–295 CrossRef CAS PubMed.
- D. R. Dreyer, D. J. Miller, B. D. Freeman, D. R. Paul and C. W. Bielawski, Chem. Sci., 2013, 4, 3796–3802 RSC.
- N. B. Li, W. Ren and H. Q. Luo, J. Solid State Electrochem., 2008, 12, 693–699 CrossRef CAS.
- T. Rebis, M. Kuznowicz, A. Jedrzak, G. Milczarek and T. Jesionowski, Electrochim. Acta, 2021, 386, 138384 CrossRef CAS.
- H. R. Zare, N. Rahmani, N. Nasirizadeh and A. Benvidi, Catal. Sci. Technol., 2013, 3, 1224–1233 RSC.
- E. M. Perez and N. Martin, Chem. Soc. Rev., 2015, 44, 6425–6433 RSC.
- J. P. Lorand and J. O. Edwards, J. Org. Chem., 1959, 24, 769–774 CrossRef CAS.
Footnote |
| † Electronic supplementary information (ESI) available. See DOI: 10.1039/d1an01991k |
| This journal is © The Royal Society of Chemistry 2022 |

