 Open Access Article
Born–Oppenheimer approximation in optical cavities: from success to breakdown†
Csaba
Fábri
 *ab,
Gábor J.
Halász
 c,
Lorenz S.
Cederbaum
 d and
Ágnes
Vibók
 *ef
*ef
aLaboratory of Molecular Structure and Dynamics, Institute of Chemistry, Eötvös Loránd University, Pázmány Péter sétány 1/A, H-1117 Budapest, Hungary. E-mail: ficsaba@caesar.elte.hu
bMTA-ELTE Complex Chemical Systems Research Group, P.O. Box 32, H-1518 Budapest, Hungary
cDepartment of Information Technology, University of Debrecen, P.O. Box 400, H-4002 Debrecen, Hungary
dTheoretische Chemie, Physikalisch-Chemisches Institut, Universität Heidelberg, Im Neuenheimer Feld 229, 69120 Heidelberg, Germany
eDepartment of Theoretical Physics, University of Debrecen, PO Box 400, H-4002 Debrecen, Hungary. E-mail: vibok@phys.unideb.hu
fELI-ALPS, ELI-HU Non-Profit Ltd, Dugonics tér 13, H-6720 Szeged, Hungary
First published on 13th November 2020
Abstract
The coupling of a molecule and a cavity induces nonadiabaticity in the molecule which makes the description of its dynamics complicated. For polyatomic molecules, reduced-dimensional models and the use of the Born–Oppenheimer approximation (BOA) may remedy the situation. It is demonstrated that contrary to expectation, BOA may even fail in a one-dimensional model and is generally expected to fail in two- or more-dimensional models due to the appearance of conical intersections induced by the cavity.
1 Introduction
The dynamics initiated in a molecule by the absorption of a photon is usually treated within the framework of the Born–Oppenheimer (BO) or adiabatic approximation1 where the fast-moving electrons are separated from the slow nuclear degrees of freedom (dofs). In this picture the nuclei move on a single potential energy surface (PES) created by the fast-moving electrons. Although several chemical processes can be rationalised by considering a single BO PES, there are indeed a number of situations where the BO approximation (BOA) breaks down. These are called nonadiabatic processes which involve nuclear dynamics proceeding on at least two coupled PESs, leading to the formation of so-called conical intersections (CIs).2–7 Nonadiabatic phenomena are ubiquitous in photochemistry, photophysics, particularly in molecular fragmentation, proton transfer, isomerization or radiationless deactivation processes of excited states as the CI can provide a very efficient channel for ultrafast interstate crossing on the femtosecond timescale.8–21Conical intersections and avoided crossings (ACs) can be created both by classical and quantum light, as well. To form a CI, the molecule must have at least two independent nuclear dofs. In diatomics having only one nuclear dof, natural CIs can never be formed, only ACs can arise. If the system interacts with light, either light-induced avoided crossings (LIACs) or light-induced conical intersections (LICIs)22–24 can emerge. LICIs can be created even in diatomics where the second dof (either rotation or translation), needed to form a LICI, comes into play due to the light-matter interaction. Moreover, LICIs are ubiquitous and become multidimensional in the nuclear coordinate space in polyatomic molecules due to the presence of several vibrational dofs.25,26
Recently, efforts have been made to study light-induced nonadiabatic phenomena in optical or microwave cavities.27–46 It has been successfully demonstrated that describing the photon–matter interaction with the tools of cavity quantum electrodynamics (cQED)47–50 can provide an alternative way to study the quantum control of molecules with light. In this framework nonadiabatic dynamics arises due to the strong coupling between the molecular dofs and the photonic mode of the radiation field which can alter the molecular energy levels by controlling the dynamics of basic photophysical and photochemical processes. The molecular vibrational modes which are strongly coupled to the electronic and photonic dofs are taken into account resulting in a new set of “cavity-induced” or “polariton” surfaces in the molecular Hamiltonian. These polariton surfaces are expected to form LIACs or LICIs.
Numerous works deal with quantum-light-induced nonadiabatic effects within a single molecule. In most of the studies diatomic or polyatomic organic molecules are treated as reduced-dimensional two-level systems by taking into account only one vibrational and photonic dof.27–29,34,35,42 As is already clear from classical light, quantum LICI situations can also only occur if, in addition to the only vibrational dof, the rotational angle between the molecular axis and the polarization vector of the electric field in the cavity is also accounted for (in case of diatomics)37,38 or at least two vibrational dofs are considered in the description.26,44 Furthermore, quantum light-induced collective nonadiabatic phenomena (collective LICI) can also emerge when many molecules are involved in strong coupling to the cavity mode.34,35,42
Our current aim is to study pure quantum light-induced nonadiabatic phenomena in a single polyatomic molecule placed in an optical nanocavity with methods ranging from a full-dimensional and accurate quantum-dynamical description to a simple one-dimensional treatment. In order to eliminate any possible interference between inherent and cavity-induced nonadiabatic phenomena, we consider situations where a clear separation and identification of these can be made, enabling us to reveal effects solely caused by the quantum LICI.
Our showcase example is the four-atomic H2CO (formaldehyde) molecule which has been investigated very recently for nonadiabatic phenomena induced by classical light.26 This molecule does not exhibit any inherent nonadiabatic effects in the studied region of the nuclear configuration space (see further explanation in ESI†). Therefore, nonadiabatic effects appearing in the absorption spectrum of H2CO coupled to a single cavity mode can be attributed solely to the quantum LICI. First, by applying accurate full-dimensional computations, the field-free absorption spectrum of H2CO is investigated and compared to results obtained with one- and two-dimensional quantum-dynamical models. Next, we study the absorption spectrum of H2CO coupled to a single cavity mode and investigate how cavity-induced nonadiabatic phenomena can be understood if simplified one- and two-dimensional descriptions are used. Most importantly, we examine whether the BOA is capable of yielding qualitatively (or even quantitatively) correct absorption spectra for the different quantum-dynamical models applied in this study.
The BOA, to be accurately defined later in the context of polaritonic surfaces, breaks down for both the two- and six-dimensional quantum-dynamical models used in this work. The failure of the BOA is attributed to the emergence of the LICI between polaritonic surfaces. However, if only one vibrational dof is taken into account, no LICI can be formed and it seems plausible that the BOA can provide correct absorption spectra. In ref. 27 it has been found that the BOA is valid for larger organic molecules described in one dimension provided that the coupling between the molecule and the cavity mode is sufficiently strong. The most striking outcome of the present work is that the BOA can fail even for a one-dimensional description of H2CO, irrespective of the coupling strength. Consequently, BOA is expected to fail in the presence of a LICI and care should be taken when a molecule coupled to a cavity mode is described using the BOA with only one vibrational dof.
2 Results and discussion
2.1 Hamiltonian of a single molecule coupled to a cavity mode and six-dimensional results
Let us start with the Hamiltonian of a single molecule coupled to a cavity mode,51 | (1) |
 is the electric dipole moment operator,
 ![[e with combining right harpoon above (vector)]](https://www.rsc.org/images/entities/i_char_0065_20d1.gif) is the polarization vector, ↠and â are the creation and annihilation operators of the cavity mode, ωc is the angular frequency of the cavity mode and g is the coupling strength parameter. If two electronic states of the molecule are considered, the Hamiltonian takes the form
is the polarization vector, ↠and â are the creation and annihilation operators of the cavity mode, ωc is the angular frequency of the cavity mode and g is the coupling strength parameter. If two electronic states of the molecule are considered, the Hamiltonian takes the form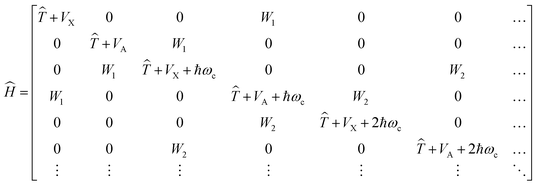 | (2) |
![[T with combining circumflex]](https://www.rsc.org/images/entities/i_char_0054_0302.gif) is the kinetic energy operator, VX and VA denote the ground-state and excited-state PESs and
is the kinetic energy operator, VX and VA denote the ground-state and excited-state PESs and  , where
 ![[small mu, Greek, vector]](https://www.rsc.org/images/entities/i_char_e0e9.gif) is the transition dipole moment (TDM) vector. In what follows, the notation μ =
is the transition dipole moment (TDM) vector. In what follows, the notation μ = ![[small mu, Greek, vector]](https://www.rsc.org/images/entities/i_char_e0e9.gif)
![[e with combining right harpoon above (vector)]](https://www.rsc.org/images/entities/i_char_0065_20d1.gif) will be used.
will be used.
The eigenstates of the Hamiltonian of eqn (2)
 | (3) |
 | (4) |
![[small mu, Greek, circumflex]](https://www.rsc.org/images/entities/i_char_e0b3.gif) α denotes the components of the electric dipole moment operator.
α denotes the components of the electric dipole moment operator.
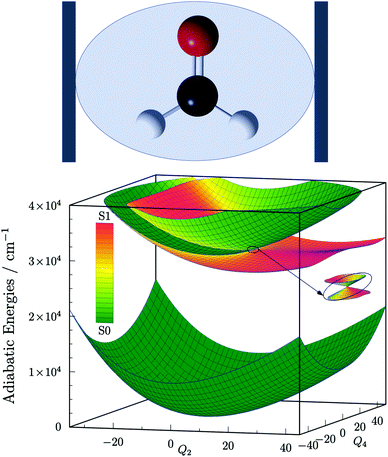
Following the footsteps of our previous study focused on light-induced nonadiabaticity in polyatomic molecules,26 we choose the four-atomic H2CO molecule as the target of the present work. The two singlet electronic states S0 ![[( with combining tilde]](https://www.rsc.org/images/entities/char_0028_0303.gif) X 1A1) and S1 (Ã 1A2) of H2CO are taken into account and the corresponding six-dimensional VX and VA PESs are taken from ref. 52 and 53, respectively. The structure of H2CO coupled to a single cavity mode and the three lowest polaritonic (adiabatic) PESs that emerge due to the light–matter coupling are depicted in Fig. 1. The field-free vibrational eigenstates of H2CO were computed with the GENIUSH program package54–56 for both electronic states treating all six vibrational dofs in a numerically exact way. The rotational dofs are omitted from the present computational protocol and the molecule is imagined to be fixed with respect to the external electric field. Further information on the structure and normal modes of H2CO as well as technical details of the computations are provided in the ESI.†
X 1A1) and S1 (Ã 1A2) of H2CO are taken into account and the corresponding six-dimensional VX and VA PESs are taken from ref. 52 and 53, respectively. The structure of H2CO coupled to a single cavity mode and the three lowest polaritonic (adiabatic) PESs that emerge due to the light–matter coupling are depicted in Fig. 1. The field-free vibrational eigenstates of H2CO were computed with the GENIUSH program package54–56 for both electronic states treating all six vibrational dofs in a numerically exact way. The rotational dofs are omitted from the present computational protocol and the molecule is imagined to be fixed with respect to the external electric field. Further information on the structure and normal modes of H2CO as well as technical details of the computations are provided in the ESI.†
Having described the working formulae and the molecular system, we move on to the discussion of the absorption spectrum of the field-free H2CO molecule and first present results with a numerically-exact six-dimensional (6D) quantum-dynamical treatment. We consider the high-energy part of the spectrum consisting of spectral lines corresponding to transitions from |X0〉 (vibrational ground state of the electronic state X) to |Ai〉 (vibrational states of the electronic state A). Fig. 2 presents the 6D field-free spectrum of H2CO, showing favourable agreement with results reported in ref. 57. The 6D field-free spectrum exhibits progressions of lines that are mainly associated with the ν4 (out-of-plane bend) and ν2 (C![[double bond, length as m-dash]](https://www.rsc.org/images/entities/char_e001.gif) O stretch) vibrational modes. Displacements along the ν4 vibrational mode produce nonzero TDM and since the C
O stretch) vibrational modes. Displacements along the ν4 vibrational mode produce nonzero TDM and since the C![[double bond, length as m-dash]](https://www.rsc.org/images/entities/char_e001.gif) O equilibrium bond length in the excited electronic state is considerably larger than the corresponding ground-state value, the ν2 vibrational mode adds complexity to the absorption spectrum by giving rise to several nonzero Franck–Condon factors. Therefore, any reduced-dimensional quantum-dynamical model of H2CO should incorporate at least the ν4 and ν2 vibrational modes. However, if one still aims to define a one-dimensional model, the ν2 vibrational mode should be omitted as explained in the next paragraph.
O equilibrium bond length in the excited electronic state is considerably larger than the corresponding ground-state value, the ν2 vibrational mode adds complexity to the absorption spectrum by giving rise to several nonzero Franck–Condon factors. Therefore, any reduced-dimensional quantum-dynamical model of H2CO should incorporate at least the ν4 and ν2 vibrational modes. However, if one still aims to define a one-dimensional model, the ν2 vibrational mode should be omitted as explained in the next paragraph.
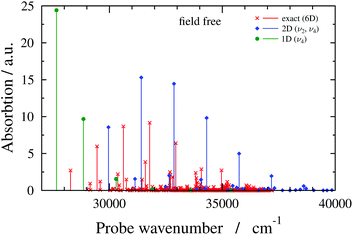 | ||
| Fig. 2 Absorption spectra of field-free (i.e., no cavity) formaldehyde obtained with different quantum-dynamical models (6D, 2D(ν2,ν4) and 1D(ν4) models, as indicated in the figure). | ||
Fig. 2 also shows field-free spectra obtained with two reduced-dimensional models, treating the ν2 and ν4 vibrational modes (2D(ν2,ν4) model), or the ν4 vibrational mode (1D(ν4) model). Comparing the field-free 2D(ν2,ν4) spectrum to its 6D counterpart reveals that although the 2D(ν2,ν4) spectrum lacks lines that are present in the 6D spectrum, the overall structures of the 2D(ν2,ν4) and 6D field-free spectra are similar. On the contrary, the 1D(ν4) field-free spectrum does not resemble the 6D field-free spectrum at all. Besides the 1D(ν4) model, one could also think of testing the performance of the 1D(ν2) model. Since the reduced-dimensional models are defined by setting the inactive normal coordinates to zero and the ν2 vibrational mode is totally symmetric, the C2v symmetry of the equilibrium structure is preserved when displacements are made along the ν2 vibrational mode (see also ESI†). Due to symmetry, the TDM between the electronic states X and A is zero at nuclear configurations of C2v symmetry, therefore, no transitions are allowed if the 1D(ν2) model is used. Based on the analysis of the field-free spectra presented in this subsection, the simplest model expected to provide sensible results is the 2D(ν2,ν4) model.
2.2 One-dimensional results for the 1D(ν4) model
We define a one-dimensional quantum-dynamical model, called 1D(ν4) model henceforth, treating only the ν4 (out-of-plane) vibrational mode of H2CO (see ESI† for technical details). The 1D(ν4) model is utilized to assess the performance of a simplified one-dimensional description for H2CO and test the applicability of the BOA in one dimension, which requires further explanation. Since the frequency of the cavity mode is chosen to be nearly resonant with the frequency of the X → A electronic excitation, the dof associated with the “fast” cavity mode is grouped with the electrons and the “slow” nuclear dofs are separated from the electronic and cavity dofs. This allows the construction of the lower (|−〉) and upper (|+〉) hybrid light-matter (polaritonic) states that can be approximately described as | (5) |
The initial dressed state |Φi〉 is always chosen as the lowest-energy dressed state. As for the current range of g the lowest polariton PES (see the first polariton PES in Fig. 1) can be approximated as VX (strong coupling regime), |Φi〉 virtually equals |X0〉|0〉, that is, the product of |X0〉 and the vacuum state of the cavity mode. The final dressed states |Φf〉 of the transitions lie in the singly-excited subspace (molecule in ground electronic state X dressed with one photon or molecule in excited electronic state A dressed with zero photon). Note that the second and third polaritonic PESs in Fig. 1 correspond to the singly-excited subspace. We stress that in the numerical computations all coupling terms appearing in the Hamiltonian of eqn (2) are included explicitly.
The exact dressed spectra displayed in Fig. 3 (ωc = 27![[thin space (1/6-em)]](https://www.rsc.org/images/entities/char_2009.gif) 653.3 cm−1 and e = (0, 1, 0) with different values of g) show the emergence of new peaks besides splittings and shifts of peaks that are present in the field-free spectrum. It is apparent in Fig. 3 that the dressed spectra calculated using the BOA are rather different from their exact counterparts for all g values considered. The lower panel in Fig. 3 shows the dressed spectrum with g = 2.67 × 10⁻¹ a.u. (equivalent to a classical intensity of I = 10
653.3 cm−1 and e = (0, 1, 0) with different values of g) show the emergence of new peaks besides splittings and shifts of peaks that are present in the field-free spectrum. It is apparent in Fig. 3 that the dressed spectra calculated using the BOA are rather different from their exact counterparts for all g values considered. The lower panel in Fig. 3 shows the dressed spectrum with g = 2.67 × 10⁻¹ a.u. (equivalent to a classical intensity of I = 10![[thin space (1/6-em)]](https://www.rsc.org/images/entities/char_2009.gif) 000 TW cm−2), the highest (and likely experimentally not yet feasible) value of g applied. In contrast to the dressed spectra with lower g values, the spectrum with g = 2.67 × 10⁻¹ a.u. exhibits two clearly separated groups of peaks. Moreover, it is conspicious that the BOA works for the lower group of peaks and fails completely for the upper group of peaks in this particular case.
000 TW cm−2), the highest (and likely experimentally not yet feasible) value of g applied. In contrast to the dressed spectra with lower g values, the spectrum with g = 2.67 × 10⁻¹ a.u. exhibits two clearly separated groups of peaks. Moreover, it is conspicious that the BOA works for the lower group of peaks and fails completely for the upper group of peaks in this particular case.
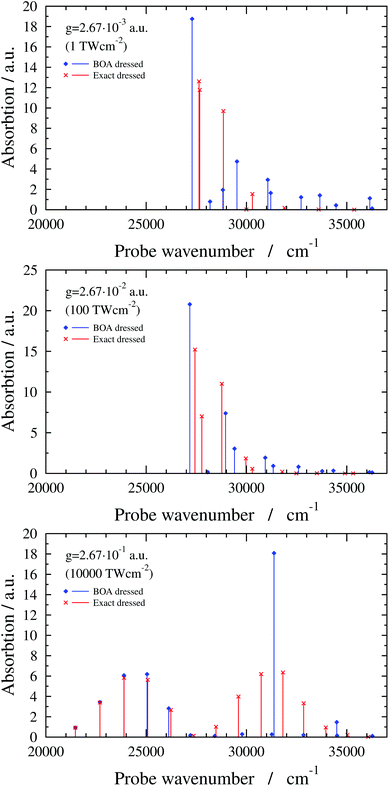 | ||
Fig. 3 1D(ν4) dressed spectra (exact and BOA) with a cavity wavenumber of ωc = 27![[thin space (1/6-em)]](https://www.rsc.org/images/entities/char_2009.gif) 653.3 cm−1 for different coupling strength values. 653.3 cm−1 for different coupling strength values. | ||
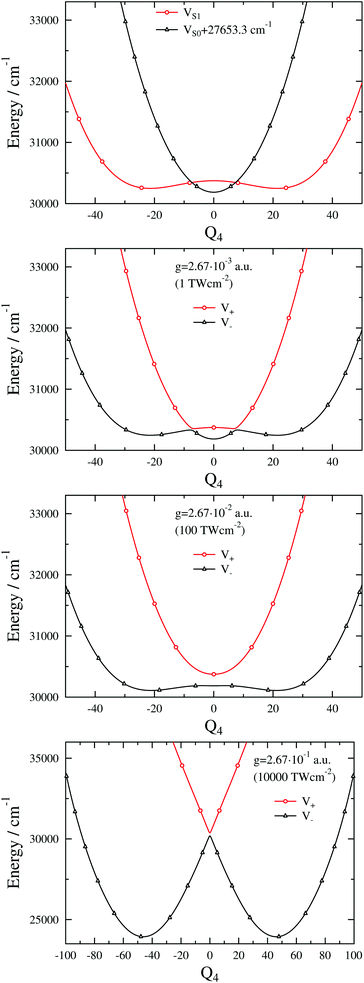
The breakdown of the BOA even for the highest g value might seem counterintuitive as only one vibrational dof is taken into account. In order to rationalise this odd result we have investigated the lower and upper polaritonic (adiabatic) PESs and evaluated the NAC for several g values. Fig. 4 displays both the diabatic (VX + ℏωc and VA) and adiabatic PESs (V− and V+) as a function of the ν4 normal coordinate (Q4). The diabatic PESs cross at Q4 = ±7.35 and 30![[thin space (1/6-em)]](https://www.rsc.org/images/entities/char_2009.gif) 344.8 cm−1 for ωc = 27
344.8 cm−1 for ωc = 27![[thin space (1/6-em)]](https://www.rsc.org/images/entities/char_2009.gif) 653.3 cm−1. Note that VA shows an anharmonic double-well structure and the TDM vanishes at Q4 = 0 due to symmetry, which implies that the gap between V− and V+ at Q4 = 0 is determined solely by ωc (and not by g). One can also observe LIACs in Fig. 4 and the shapes of V− and V+ change substantially as g increases. An interesting feature of V− is the emergence of a barrier centered at Q4 = 0 for high g values. Fig. 5 shows the NAC as a function of Q4 for several g values. One can notice in Fig. 5 that at lower g values the NAC curve has a bimodal structure (with maxima located around the two crossing points of the diabatic PESs), while at higher g values the NAC exhibits a single maximum at Q4 = 0. This behaviour of the NAC can be qualitatively interpreted by examining the shape of the adiabatic PES. While at lower g values the adiabatic PESs show two LIACs around the crossing points of the diabatic PESs, at higher g values the adiabatic PES show only one LIAC at Q4 = 0. The shape of the NAC curve follows this trend and the bimodal NAC curve (lower g values) turns into a unimodal NAC curve centered at Q4 = 0 (higher g values).
653.3 cm−1. Note that VA shows an anharmonic double-well structure and the TDM vanishes at Q4 = 0 due to symmetry, which implies that the gap between V− and V+ at Q4 = 0 is determined solely by ωc (and not by g). One can also observe LIACs in Fig. 4 and the shapes of V− and V+ change substantially as g increases. An interesting feature of V− is the emergence of a barrier centered at Q4 = 0 for high g values. Fig. 5 shows the NAC as a function of Q4 for several g values. One can notice in Fig. 5 that at lower g values the NAC curve has a bimodal structure (with maxima located around the two crossing points of the diabatic PESs), while at higher g values the NAC exhibits a single maximum at Q4 = 0. This behaviour of the NAC can be qualitatively interpreted by examining the shape of the adiabatic PES. While at lower g values the adiabatic PESs show two LIACs around the crossing points of the diabatic PESs, at higher g values the adiabatic PES show only one LIAC at Q4 = 0. The shape of the NAC curve follows this trend and the bimodal NAC curve (lower g values) turns into a unimodal NAC curve centered at Q4 = 0 (higher g values).
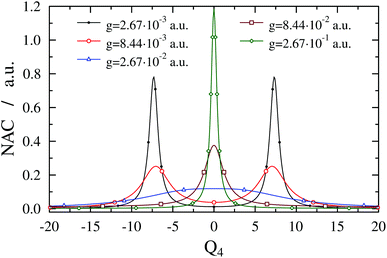 | ||
Fig. 5 Nonadiabatic coupling (1D(ν4) model) as a function of Q4 for formaldehyde in a cavity of ωc = 27![[thin space (1/6-em)]](https://www.rsc.org/images/entities/char_2009.gif) 653.3 cm−1 with different coupling strength values g. With growing coupling strength, the bimodal structure of the nonadiabatic coupling turns into a single maximum following the structure of the avoided crossings of the adiabatic potentials shown in Fig. 4. 653.3 cm−1 with different coupling strength values g. With growing coupling strength, the bimodal structure of the nonadiabatic coupling turns into a single maximum following the structure of the avoided crossings of the adiabatic potentials shown in Fig. 4. | ||
The numerical NAC results can be quantitatively understood by a simple one-dimensional model with two harmonic PESs,
 | (6) |
| μ(x) = αx, | (7) |
 | (8) |
 | (9) |
Finally, the interpretation of the partial BOA breakdown for the highest value of g (2.67 × 10⁻¹ a.u.) is in order. The analysis of the dressed spectrum reveals that the peaks of the lower group in the BOA spectrum (see lower panel in Fig. 3) correspond to transitions to the lower-lying eigenstates of V−. Since V− exhibits a high barrier in this case (see last panel in Fig. 4), the lower-lying adiabatic eigenstates of V− have negligible amplitude around Q4 = 0, i.e., in the region where the NAC is not negligible according to Fig. 5. Therefore, the BOA provides satisfactory results for the lower group of peaks. As to the higher group of peaks, the final dressed states of these BOA transitions are adiabatic eigenstates of V+ which has a single minimum at Q4 = 0, therefore, the effect of the NAC can not be neglected and the BOA breaks down.
Interestingly, the higher group of states can be explained by the potential curve obtained by connecting smoothly the left (right) part of V+ with the right (left) part of V− in the last panel of Fig. 4. The resulting curves can be viewed as diabatic curves and their diabatic coupling is weak as the energy gap at Q4 = 0 is small.
2.3 Two-dimensional results for the 2D(ν2,ν4) model
In this subsection results are presented for a two-dimensional quantum-dynamical model, referred to as the 2D(ν2,ν4) model, treating both the ν2 and ν4 vibrational modes (see ESI† for technical details). Fig. 6 shows 2D(ν2,ν4) dressed spectra (ωc = 29![[thin space (1/6-em)]](https://www.rsc.org/images/entities/char_2009.gif) 957.23 cm−1 and e = (0, 1, 0) with different g values). The exact dressed spectrum for the lowest value of g in Fig. 6 shows splitting of the first band of the field-free spectrum. As g increases, further field-free lines become split and shifted, and new lines appear. Common to all g values is that the BOA and exact dressed spectra differ substantially. At the highest value of g one can again observe the emergence of two groups of peaks in the dressed spectrum. In this case the BOA again works well for the lower group of peaks and utterly breaks down for the upper group of peaks.
957.23 cm−1 and e = (0, 1, 0) with different g values). The exact dressed spectrum for the lowest value of g in Fig. 6 shows splitting of the first band of the field-free spectrum. As g increases, further field-free lines become split and shifted, and new lines appear. Common to all g values is that the BOA and exact dressed spectra differ substantially. At the highest value of g one can again observe the emergence of two groups of peaks in the dressed spectrum. In this case the BOA again works well for the lower group of peaks and utterly breaks down for the upper group of peaks.
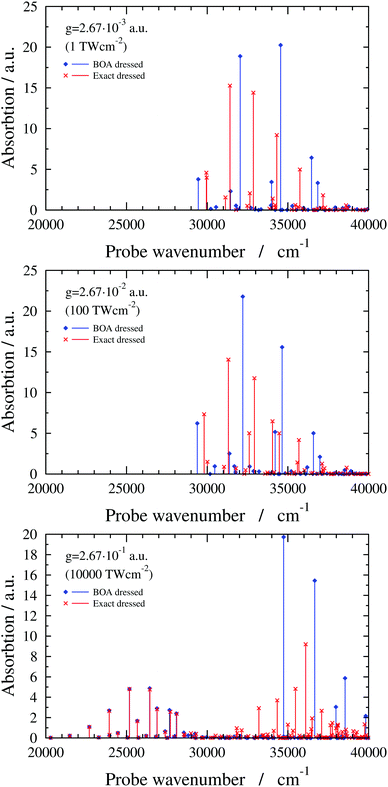 | ||
Fig. 6 2D(ν2,ν4) dressed spectra (exact and BOA) with a cavity wavenumber of ωc = 29![[thin space (1/6-em)]](https://www.rsc.org/images/entities/char_2009.gif) 957.23 cm−1 for different coupling strength values. 957.23 cm−1 for different coupling strength values. | ||
The breakdown of the BOA in case of the 2D(ν2,ν4) model can be attributed to the LICI, also visible in Fig. 1. For ωc = 29![[thin space (1/6-em)]](https://www.rsc.org/images/entities/char_2009.gif) 957.23 cm−1, the LICI is located at an energy of 30
957.23 cm−1, the LICI is located at an energy of 30![[thin space (1/6-em)]](https://www.rsc.org/images/entities/char_2009.gif) 776.1 cm−1 at Q2 = 8.84 and Q4 = 0. V− and V+ are degenerate at the LICI and the NAC becomes singular, also verified by analytical 2D model calculations described in the ESI.† Similarly to the 1D(ν4) case, the final states of the BOA transitions in the lower group of peaks for g = 2.67 × 10⁻¹ a.u. are lower-lying V− adiabatic eigenstates which have negligible amplitude at the LICI. On the other hand, BOA lines in the upper group of peaks correspond to transitions to either higher-lying V− adiabatic eigenstates that are above the LICI in energy or to adiabatic eigenstates of V+ which has a minimum at the LICI. Therefore, the BOA can not be expected to yield sensible results for the upper group of peaks. Note that similar conclusions have been drawn for natural CIs.2,58 Along these lines, we believe that the BOA fails for the 6D model, similarly to the 2D(ν2,ν4) model, due to the presence of the LICI.
776.1 cm−1 at Q2 = 8.84 and Q4 = 0. V− and V+ are degenerate at the LICI and the NAC becomes singular, also verified by analytical 2D model calculations described in the ESI.† Similarly to the 1D(ν4) case, the final states of the BOA transitions in the lower group of peaks for g = 2.67 × 10⁻¹ a.u. are lower-lying V− adiabatic eigenstates which have negligible amplitude at the LICI. On the other hand, BOA lines in the upper group of peaks correspond to transitions to either higher-lying V− adiabatic eigenstates that are above the LICI in energy or to adiabatic eigenstates of V+ which has a minimum at the LICI. Therefore, the BOA can not be expected to yield sensible results for the upper group of peaks. Note that similar conclusions have been drawn for natural CIs.2,58 Along these lines, we believe that the BOA fails for the 6D model, similarly to the 2D(ν2,ν4) model, due to the presence of the LICI.
3 Conclusions
This study discusses the applicability of the Born–Oppenheimer approximation (BOA) in optical cavities for polyatomic molecules. The H2CO molecule serves as a showcase example and its absorption spectrum is calculated for the energy region of electronic transitions. H2CO does not exhibit a natural conical intersection in the studied energy region, and therefore, nonadiabatic effects appearing in the absorption spectrum can be attributed solely to the quantum LICI.First, as for comparison, we have calculated the field-free spectrum of H2CO utilizing the full-dimensional (6D) as well as reduced-dimensional (2D(ν2,ν4) and 1D(ν4)) quantum-dynamical models. It has been found that the simplest model which can approximately reproduce the structure of the numerically-exact 6D spectrum is the 2D(ν2,ν4) model. As the one-dimensional 1D(ν2) model leads to a vanishing absorption spectrum, the 1D(ν4) model is the one-dimensional model to be used.
For the reduced-dimensional 1D(ν4) and 2D(ν2,ν4) models, the field-dressed exact and BOA spectra have been computed and compared. A striking finding of our work is that the BOA can fail even for a one-dimensional quantum-dynamical treatment of H2CO irrespective of the value of the coupling strength. This complements previous results claiming that the BOA can be used in the strong coupling regime when only one vibrational dof is taken into account. Analytical considerations fully corroborate our conclusion and point out that the breakdown of the BOA even in 1D for H2CO arises due to an intrinsic property of the molecule, namely that the transition dipole moment vanishes at certain geometries due to molecular symmetry. Clearly, one should be careful even when describing a molecule in a cavity using the BOA with only one vibration.
Moreover, we have also shown that the BOA is not applicable for the 2D(ν2,ν4) model. We can expect such a failure whenever there is a LICI and the spectrum extends to energies above the LICI. Consequently, we have no doubt that the BOA fails for the full-dimensional (6D) model as well.
The above-discussed aspects are valid when the system under investigation lacks any inherent nonadiabatic phenomena in the absence of the cavity. If this is not the case, the situation is expected to be even more involved.
Conflicts of interest
There are no conflicts to declare.Acknowledgements
Professor Joel Bowman is gratefully acknowledged for providing Fortran subroutines for the S0 and S1 potential energy surfaces. We are indebted to Benjamin Lasorne and Gerrit Groenhof for fruitful discussions. This research was supported by the EU-funded Hungarian grant EFOP-3.6.2-16-2017-00005. The authors are grateful to NKFIH for financial support (grants no. K128396 and PD124699).Notes and references
- M. Born and R. Oppenheimer, Ann. Phys., 1927, 389, 457–484 CrossRef.
- H. Köppel, W. Domcke and L. S. Cederbaum, Adv. Chem. Phys., 1984, 57, 59–246 Search PubMed.
- D. R. Yarkony, Rev. Mod. Phys., 1996, 68, 985–1013 CrossRef CAS.
- M. Baer, Phys. Rep., 2002, 358, 75–142 CrossRef CAS.
- G. A. Worth and L. S. Cederbaum, Annu. Rev. Phys. Chem., 2004, 55, 127–158 CrossRef CAS.
- W. Domcke, D. R. Yarkony and H. Köppel, Conical Intersections, World Scientific, 2004 Search PubMed.
- M. Baer, Beyond Born–Oppenheimer: Electronic Non-Adiabatic Coupling Terms and Conical Intersections, Wiley, New York, 2006 Search PubMed.
- J. S. Lim and S. K. Kim, Nat. Chem., 2010, 2, 627–632 CrossRef CAS.
- H. J. Wörner, J. B. Bertrand, B. Fabre, J. Higuet, H. Ruf, A. Dubrouil, S. Patchkovskii, M. Spanner, Y. Mairesse, V. Blanchet, E. Mével, E. Constant, P. B. Corkum and D. M. Villeneuve, Science, 2011, 334, 208–212 CrossRef.
- H. S. You, S. Han, J. S. Lim and S. K. Kim, J. Phys. Chem. Lett., 2015, 6, 3202–3208 CrossRef CAS.
- A. J. Musser, M. Liebel, C. Schnedermann, T. Wende, T. B. Kehoe, A. Rao and P. Kukura, Nat. Phys., 2015, 11, 352–357 Search PubMed.
- A. von Conta, A. Tehlar, A. Schletter, Y. Arasaki, K. Takatsuka and H. J. Wörner, Nat. Commun., 2018, 9, 3162 Search PubMed.
- M. E. Corrales, J. González-Vázquez, R. de Nalda and L. Bañares, J. Phys. Chem. Lett., 2019, 10, 138–143 Search PubMed.
- T. J. Martinez, Nature, 2010, 467, 412–413 CrossRef CAS.
- C. Xie, J. Ma, X. Zhu, D. R. Yarkony, D. Xie and H. Guo, J. Am. Chem. Soc., 2016, 138, 7828–7831 CrossRef CAS.
- J. A. DeVine, M. L. Weichman, X. Zhou, J. Ma, B. Jiang, H. Guo and D. M. Neumark, J. Am. Chem. Soc., 2016, 138, 16417–16425 CrossRef CAS.
- K. C. Woo, D. H. Kang and S. K. Kim, J. Am. Chem. Soc., 2017, 139, 17152–17158 CrossRef CAS.
- B. F. E. Curchod and T. J. Martínez, Chem. Rev., 2018, 118, 3305–3336 CrossRef CAS.
- K. Bennett, M. Kowalewski, J. R. Rouxel and S. Mukamel, Proc. Natl. Acad. Sci. U. S. A., 2018, 115, 6538–6547 CrossRef CAS.
- I. G. Ryabinkin, L. Joubert-Doriol and A. F. Izmaylov, Acc. Chem. Res., 2017, 50, 1785–1793 CrossRef CAS.
- C. Xie, C. L. Malbon, H. Guo and D. R. Yarkony, Acc. Chem. Res., 2019, 52, 501–509 CrossRef CAS.
- N. Moiseyev, M. Šindelka and L. S. Cederbaum, J. Phys. B: At., Mol. Opt. Phys., 2008, 41, 221001 CrossRef.
- G. J. Halász, A. Vibók and L. S. Cederbaum, J. Phys. Chem. Lett., 2015, 6, 348–354 CrossRef.
- A. Csehi, G. J. Halász, L. S. Cederbaum and A. Vibók, J. Phys. Chem. Lett., 2017, 8, 1624–1630 CrossRef CAS.
- P. V. Demekhin and L. S. Cederbaum, J. Chem. Phys., 2013, 139, 154314 CrossRef.
- C. Fábri, B. Lasorne, G. J. Halász, L. S. Cederbaum and Á. Vibók, J. Phys. Chem. Lett., 2020, 11, 5324–5329 CrossRef.
- J. Galego, F. J. Garcia-Vidal and J. Feist, Phys. Rev. X, 2015, 5, 041022 Search PubMed.
- M. Kowalewski, K. Bennett and S. Mukamel, J. Phys. Chem. Lett., 2016, 7, 2050–2054 CrossRef CAS.
- H. L. Luk, J. Feist, J. J. Toppari and G. Groenhof, J. Chem. Theory Comput., 2017, 13, 4324–4335 CrossRef CAS.
- J. Flick, M. Ruggenthaler, H. Appel and A. Rubio, Proc. Natl. Acad. Sci. U. S. A., 2017, 114, 3026–3034 CrossRef CAS.
- J. Flick, H. Appel, M. Ruggenthaler and A. Rubio, J. Chem. Theory Comput., 2017, 13, 1616–1625 CrossRef CAS.
- M. Du, L. A. Martínez-Martínez, R. F. Ribeiro, Z. Hu, V. M. Menon and J. Yuen-Zhou, Chem. Sci., 2018, 9, 6659–6669 RSC.
- R. F. Ribeiro, L. A. Martínez-Martínez, M. Du, J. Campos-Gonzalez-Angulo and J. Yuen-Zhou, Chem. Sci., 2018, 9, 6325–6339 RSC.
- J. Feist, J. Galego and F. J. Garcia-Vidal, ACS Photonics, 2018, 5, 205–216 CrossRef CAS.
- O. Vendrell, Phys. Rev. Lett., 2018, 121, 253001 CrossRef CAS.
- J. F. Triana, D. Peláez and J. L. Sanz-Vicario, J. Phys. Chem. A, 2018, 122, 2266–2278 CrossRef CAS.
- T. Szidarovszky, G. J. Halász, A. G. Császár, L. S. Cederbaum and A. Vibók, J. Phys. Chem. Lett., 2018, 9, 6215–6223 CrossRef CAS.
- A. Csehi, M. Kowalewski, G. J. Halász and Á. Vibók, New J. Phys., 2019, 21, 093040 CrossRef CAS.
- J. B. Pérez-Sánchez and J. Yuen-Zhou, J. Phys. Chem. Lett., 2019, 11, 152–159 CrossRef.
- A. Mandal and P. Huo, J. Phys. Chem. Lett., 2019, 10, 5519–5529 CrossRef CAS.
- M. Litinskaya and F. Herrera, Phys. Rev. B, 2019, 99, 041107 CrossRef CAS.
- I. S. Ulusoy, J. A. Gomez and O. Vendrell, J. Phys. Chem. A, 2019, 123, 8832–8844 CrossRef CAS.
- J. F. Triana and J. L. Sanz-Vicario, Phys. Rev. Lett., 2019, 122, 063603 CrossRef CAS.
- B. Gu and S. Mukamel, Chem. Sci., 2020, 11, 1290–1298 RSC.
- F. Herrera, Chem, 2020, 6, 7–9 CAS.
- A. Mandal, T. D. Krauss and P. Huo, J. Phys. Chem. B, 2020, 124, 6321–6340 CrossRef CAS.
- J. A. Hutchison, T. Schwartz, C. Genet, E. Devaux and T. W. Ebbesen, Angew. Chem., Int. Ed., 2012, 51, 1592–1596 CrossRef CAS.
- T. W. Ebbesen, Acc. Chem. Res., 2016, 49, 2403–2412 CrossRef CAS.
- R. Chikkaraddy, B. De Nijs, F. Benz, S. J. Barrow, O. A. Scherman, E. Rosta, A. Demetriadou, P. Fox, O. Hess and J. J. Baumberg, Nature, 2016, 535, 127–130 CrossRef CAS.
- X. Zhong, T. Chervy, S. Wang, J. George, A. Thomas, J. A. Hutchison, E. Devaux, C. Genet and T. W. Ebbesen, Angew. Chem., Int. Ed., 2016, 128, 6310–6314 CrossRef.
- C. Cohen-Tannoudji, J. Dupont-Roc and G. Grynberg, Atom-Photon Interactions: Basic Processes and Applications, Wiley-VCH Verlag GmbH and Co. KGaA, Weinheim, 2004 Search PubMed.
- X. Wang, P. L. Houston and J. M. Bowman, Philos. Trans. R. Soc., A, 2017, 375, 20160194 CrossRef.
- B. Fu, B. C. Shepler and J. M. Bowman, J. Am. Chem. Soc., 2011, 133, 7957–7968 CrossRef CAS.
- E. Mátyus, G. Czakó and A. G. Császár, J. Chem. Phys., 2009, 130, 134112 CrossRef.
- C. Fábri, E. Mátyus and A. G. Császár, J. Chem. Phys., 2011, 134, 074105 CrossRef.
- A. G. Császár, C. Fábri, T. Szidarovszky, E. Mátyus, T. Furtenbacher and G. Czakó, Phys. Chem. Chem. Phys., 2012, 14, 1085–1106 RSC.
- M. Bonfanti, J. Petersen, P. Eisenbrandt, I. Burghardt and E. Pollak, J. Chem. Theory Comput., 2018, 14, 5310–5323 CrossRef CAS.
- L. S. Cederbaum, H. Köppel and W. Domcke, Int. J. Quantum Chem., 1981, 20, 251–267 CrossRef.
Footnote |
| † Electronic supplementary information (ESI) available. See DOI: 10.1039/d0sc05164k |
| This journal is © The Royal Society of Chemistry 2021 |

