 Open Access Article
Regulating the Bi NIR luminescence behaviours in fluorine and nitrogen co-doped germanate glasses
Fuguang
Chen
a,
Yafei
Wang
a,
Weiwei
Chen
a,
Puxian
Xiong
b,
Bofan
Jiang
a,
Shifeng
Zhou
a,
Zhijun
Ma
 *a and
Mingying
Peng
 ab
ab
aThe China-Germany Research Center for Photonic Materials and Device, the State Key Laboratory of Luminescent Materials and Devices, and Guangdong Provincial Key Laboratory of Fiber Laser Materials and Applied Techniques, the School of Materials Science and Engineering, South China University of Technology, Guangzhou 510641, China. E-mail: zhijma@scut.edu.cn
bSchool of Physics and Optoelectronics, the State Key Laboratory of Luminescent Materials and Devices, and Guangdong Provincial Key Laboratory of Fiber Laser Materials and Applied Techniques, South China University of Technology, Guangzhou 510641, China
First published on 4th June 2021
Abstract
Bi-Doped nitridated germanate glasses covering the whole NIR region from 800–1600 nm have attracted considerable attention due to their potential application in tunable fiber lasers and optical amplifiers. However, it remains challenging to regulate the luminescence behaviour of Bi because of the coexistence of multi-centers in the glasses. Here, we successfully regulated multi Bi NIR centers to obtain a flatter and ultra-broadband emission in nitridated germanate glasses. By varying the alkaline earth metal fluorides from MgF2 to BaF2, the glass structures were gradually depolymerized. A looser glass network, on one hand, promoted Bi in lower valences to be oxidized into Bi2+ and Bi3+, thus reducing the NIR emission intensity at ∼1150 and ∼1260 nm; on the other hand, it also enhanced the energy transfer from Bi+ to Bi0, which resulted in a relatively flatter emission band. In addition, the depolymerised glass structure could facilitate more nitride bonds, which are favorable for dispersing and stabilizing the new Bi NIR active centers related to germanate for ∼930 and ∼1490 nm emission. This investigation offers an efficient way to manipulate the multi-center luminescence behaviour of Bi in nitridated germanate glasses, and is beneficial to understand the mechanism of Bi NIR emission centers in glasses.
1 Introduction
The arrival of the 5th generation of communication technology (5G) is often accompanied by the explosive growth of information and data, which require bigger information transmission capacity for the current optical communication system. One possible way to improve the performance of the optical communication system is to broaden the data transmission channels, thus increasing the information transmission capacity. Laser materials operating in the broadband NIR spectral region (1200–1600 nm) are the major components for developing modern communication systems with unprecedented performance.1–4 Due to the excellent fluorescence characteristics, rare-earth-doped materials, as a type of efficient gain medium, particularly near-infrared (NIR) optical amplifiers and tunable lasers, have attracted widespread attention. Unfortunately, the f–f electronic transition, which is shielded by the outer-layer electrons, is almost unaffected by glass composition, making it difficult to modulate the emission bandwidth and peak position. As a result, the gain bandwidth of traditional rare-earth-doped materials has always been quite narrow (not exceeding 100 nm), which cannot make full use of the ultra-low-attenuation telecommunication windows of silica glass fibers (1260–1675 nm).5–9 Therefore, it is urgent to explore new photonic materials with an ultra-broadband NIR emission and long lifetime as a gain medium for potential applications in broadband optical amplifiers and tunable lasers.In the past decades, Bi-doped glasses and fibers have been confirmed to exhibit intriguing broad NIR photoemission from 1000 to 1600 nm, which made them a promising medium for optical amplifiers and NIR lasers.10–21 Although a significant progress has now been made in improving the performance of Bi-doped glasses and fibers, the emission intensity of the widely used C and L bands (1530–1625 nm) is relatively weak. In recent years, Cao et al. realized a super-broad emission band shape, which extends over the whole NIR spectral region (850–1600 nm) via the topochemical reduction of bismuth in germanate glasses co-doped with AlN, Si3N4 or SiC.20,22–24 The topochemical reduction in germanate glasses not only enhances the near-infrared luminescence of bismuth but also generates new NIR emission centers located at ∼930 and ∼1500 nm, which are related to germanium. Due to the coexistence of multiple Bi NIR activate centers (such as Bi+, Bi0 and Bi related to germanium) and their super sensitivity to the changes in the crystal field, it remains challenging to regulate the Bi NIR luminescence behaviour.21,25–28
At present, Bi-doped fibers are mainly based on oxide glasses, which show superior chemical and optical stability; however, simultaneously, they suffer from the large phonon energy (∼1200 cm−1 for silica glass). Compared to oxide glasses, the phonon energy of a fluoride glass (∼550 cm−1 for ZBLAN glass) is relatively low, which helps to reduce the non-radiative transition and to enhance the luminescence, but its chemical stability is poor. Hence, oxyfluoride glasses combining the advantages of both oxide and fluoride glasses, may be one of the best candidates for optical materials. Owing to this reason, oxyfluoride glasses have been confirmed to be promising rare-earth-doped optical materials in recent years.29–31 In 2012, Xu et al. reported that the substitution of magnesium fluoride for magnesium oxide in Bi-doped silicate glasses could significantly increase the intensity and lifetime of the NIR luminescence.32 In 2020, Chen et al. manifested that the partial substitution of barium fluoride for barium oxide in Bi-doped nitridated germanate glasses could facilitate the formation of nitride bonds to induce NIR luminescence in the glasses.33 However, to the best of our knowledge, there are a few reports related to a systematic study on different fluorides of alkali earth metals on the regulation of multi-center luminescence behaviour of Bi in nitridated germanate glasses.
In this study, taking topochemically reduced multicomponent germanate glasses as models, a series of nitridated germanate glasses co-doped with a low Bi content and different fluorides of alkaline earth metals were investigated. The results here indicated that the Bi NIR luminescence behaviour can be manipulated by varying the alkaline earth metal ions, and flat and tunable NIR emission spectra spanning from 850 nm to 1600 nm were obtained by adjusting the glass structures. We believe that the present work is beneficial to promoting the design of Bi-doped germanate glass fibres with a tunable and ultra-broadband NIR luminescence.
2 Experimental section
2.1 Synthesis
Glass composition with molar compositions of 76GeO2–9Al2O3–xCaF2–(12 − x)CaO–3AlN–0.005Bi2O3 (x = 0, 4, 6, 8, and 10) and 76GeO2–9Al2O3–6MF2–6BaO–3AlN–0.005Bi2O3 (M = Mg, Ca, Sr, and Ba) were prepared by traditional melting and quenching methods. For convenience, the glass samples were denoted as xCF (x = 0, 4, 6, 8, and 10) and MF, CF, SF, BF, respectively. Analytical grade Al2O3, MgF2, CaF2, SrF2, BaF2, CaCO3, BaCO3 and high-purity GeO2 (99.999%), AlN and Bi2O3 (99.99%) were used as the starting materials. Batches of raw materials (15 g) were mixed homogeneously in an agate mortar. Each batch of the mixture was melted in an alumina crucible at a temperature of 1520 °C in air for 30 min. Afterwards, the melt was cast onto a stainless-steel plate, and finally pressed by another stainless-steel plate to speed up the cooling process and avoid crystallization. Finally, the glasses were cut and polished for optical analysis.2.2 Characterization
Optical absorption spectra of the samples were recorded using a PerkinElmer Lambda 900 UV/Vis spectrophotometer over the spectral range of 300–1000 nm. Static excitation and emission spectra, dynamic emission spectra excited at 460 nm, and luminescence lifetime were obtained using an Edinburgh FLS920 spectrofluorometer equipped with a continuous wave 450 W Xe lamp and a microsecond flashlamp (μF900) as excitation sources. Fourier transform infrared (FT-IR) spectra were measured in the transmission mode using a Bruker Vector 33 spectrometer by dispersing glass powders into KBr pellets. Electron paramagnetic resonance (EPR) spectra were collected using an X-band spectrometer (Bruker E500). All measurements were performed at room temperature.3 Results and discussion
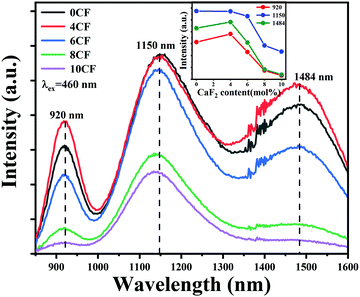
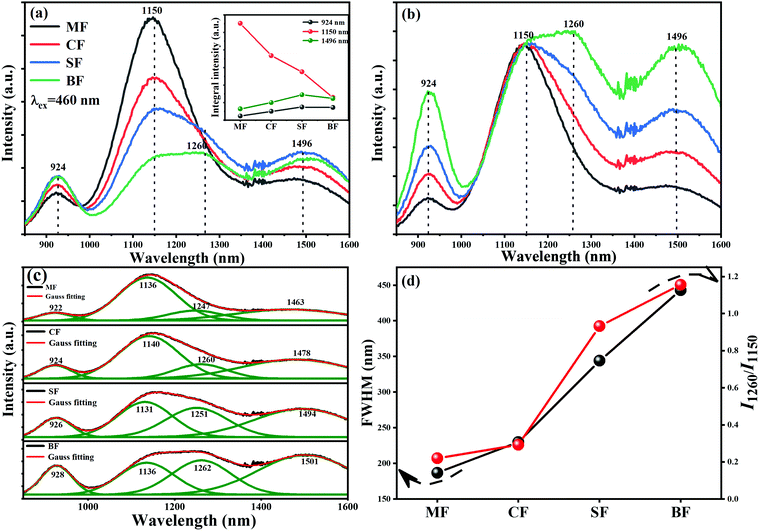
In order to verify that the introduction of an appropriate amount of fluorine in the glasses is beneficial to improve the NIR luminescence property of Bi, a series of Bi-doped germanate glasses containing different contents of fluorine were investigated. Fig. 1 illustrates the emission spectra of 76GeO2–9Al2O3–xCaF2–(12 − x)CaO–3AlN–0.005Bi2O3 (x = 0, 4, 6, 8, and 10). The intensities of the emission bands at ∼920 nm and ∼1484 nm first increase, and then, decease with the further increase in the fluorine content. However, the intensity of the emission band at ∼1150 nm kept decreasing continuously. As shown in the inset of Fig. 1, the intensities of the emission bands at ∼920 and ∼1484 nm reached the appropriate state at 4 mol%. The intensity of the emission band at ∼1500 nm decreases continuously, which indicates that fluorination can effectively manipulate the Bi NIR emission bands, and enhance the emission intensity, particularly for the emission bands at ∼920 and ∼1484 nm.When we introduced different fluorides of alkaline earth metals to Bi-doped nitridated germanate glasses, the luminescence spectral configuration of the glasses could be tuned. As presented in Fig. 2(a), under an excitation at 460 nm, an ultra-broadband NIR luminescence covering 850–1600 nm with three predominant peaks at ∼924, ∼1150 and ∼1496 nm related to the Bi NIR centers is observed in all samples. According to previous reports, the emission bands at ∼924 and 1496 nm can be attributed to the new Bi-activated centers generated by the addition of nitride in germanate glassses,22,23,34 while the emission band at ∼1150 nm originated from the typical transition 3P1 → 3P0 of Bi+.20,35 Moreover, as shown in Fig. 2(a), the integral intensity of the ∼1150 nm emission band showed a dramatical decreasing trend as the radius of alkaline earth metal ion increased, while the integral intensity of the ∼924 and ∼1496 nm emission bands got slightly enhanced. Moreover, different from the ∼1150 nm emission band, the emission bands located at ∼924 and ∼1496 nm demonstrate an increasing trend, and the shapes of their emission bands are similar, as indicated by the corresponding normalized emission spectra (to the intensity at ∼1150 nm) in Fig. 2(b). The above phenomenon indicates that the Bi-activated NIR centers responsible for ∼924, ∼1150, and ∼1496 nm responded differently to the change of alkaline earth metal fluorides.
More importantly, the FWHM of the ∼1150 nm emission band increased from 187 to 443 nm by varying the alkaline earth metals from Mg to Ba. Although the overall emission intensity at ∼1150 nm shows a weakening trend, a new emission band appeared at ∼1260 nm, which is due to the typical transition 2D3/2 → 4S3/2 of Bi0, and emerged gradually in the SF and BF glass samples (Fig. 2(b)).18 Owing to the strong overlap between the ∼1150 and ∼1260 nm emission bands, it was hard to detect the ∼1260 nm band in the MF and CF glass samples. A Gauss fitting of the emission spectra of the four samples was conducted towards the emission spectra of the glasses with different fluorides of alkaline earth metals. As shown in Fig. 2(c), there are four emission bands in each sample. Although the overall emission intensity at ∼1150 nm decreased, the ratio between the emission intensity of ∼1260 nm to that of ∼1150 nm increased with the increase in the radius of alkaline earth metal ions (Fig. 2(d)). This result was slightly different from the phenomenon reported by a previous investigation, in which only a redshift and an intensity decrease occurred as the radius of alkaline earth metal ions increased.36–38 Here, a tentative reason to explain this phenomenon is that the energy transfer between Bi+ and Bi0 occurred.
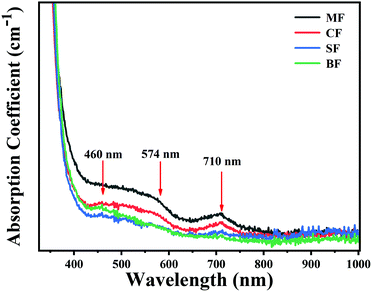
The absorption spectra of the glasses are shown in Fig. 3. These samples all exhibited three absorption peaks centered at ∼460, ∼574 and ∼710 nm, respectively. It is widely accepted that the ∼460 nm absorption band is attributed to the typical absorption of Bi0, while the ∼710 nm band is from Bi+.26,27,37 However, as compared to the ∼460 and 710 nm bands, the ∼574 nm band presented a flatter and wider shape, which may be caused by the new Bi-activated NIR centers. By varying alkaline earth metal fluorides from MgF2 to BaF2, all the Bi-related absorption intensities gradually decreased.
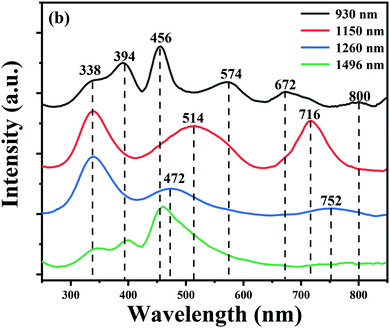
To obtain more information on the Bi-related centers, the excitation spectrum of different emission bands of the BF glass is collected, as shown in Fig. 4. It can be seen that the four NIR emission bands could be well excited by blue light, which shows a great potential as a blue LED-excited broadband NIR light source. The four excitation spectra, however, are different in some details. When monitored at 930 nm, five excitation bands at ∼338, ∼394, ∼456, ∼574, ∼672 and ∼800 nm are observed. These complicated excitation features are different from the excitation bands located at ∼338, ∼394, and ∼456 nm for the 1490 nm emission band. Therefore, we inferred that the ∼924 and ∼1496 nm emission bands may originate from different Bi-activated NIR centers. While monitoring at ∼1150 nm, the excitation spectra consist of three strong bands locating at ∼338, ∼514 and ∼716 nm, respectively. The ∼1260 nm emission band presents a strong absorption band at ∼338 nm and other broad excitation bands at ∼472 and ∼752 nm. The variation tendency observed in the excitation spectra can well explain the different behaviour of the multiple Bi-activated centers in some degree.
The fluorescence lifetime is another important parameter to characterize the fluorescence performance of Bi-doped glasses. The decay curves of multi-center NIR emission at 930, 1150, 1260 and 1490 nm under the excitation of 460 nm are presented in Fig. 5(a)–(d). All the decay curves followed a double exponential decaying law, as described by eqn (1):
I(t) = A1![[thin space (1/6-em)]](https://www.rsc.org/images/entities/char_2009.gif) exp(−t/τ1) + A2 exp(−t/τ1) + A2![[thin space (1/6-em)]](https://www.rsc.org/images/entities/char_2009.gif) exp(−t/τ2) exp(−t/τ2) | (1) |
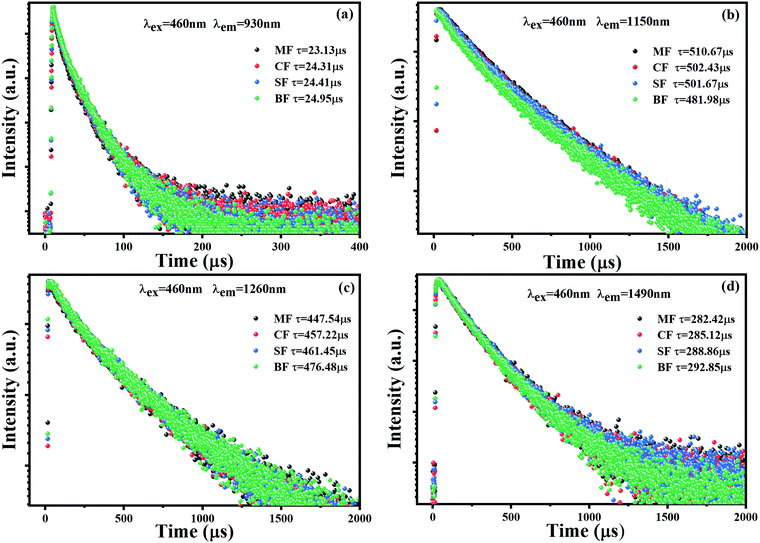 | ||
| Fig. 5 Decaying curves of (a) 930, (b) 1150, (c) 1260, and (d) 1490 nm emission of MF, CF, SF, and BF glass samples (λex = 460 nm). | ||
| Glass samples | τ 930 (μs) | τ 1150 (μs) Bi+ | τ 1260 (μs) Bi0 | τ 1490 (μs) | μ Bi+→Bi0 (%) | Optical basicity (Λth) |
|---|---|---|---|---|---|---|
| MF | 23.13 | 510.67 | 447.54 | 282.42 | — | 0.601 |
| CF | 24.31 | 502.43 | 457.22 | 285.12 | 1.61 | 0.606 |
| SF | 24.41 | 501.67 | 461.45 | 288.86 | 1.76 | 0.609 |
| BF | 24.95 | 481.98 | 476.48 | 292.85 | 5.62 | 0.611 |
In consideration of the above-mentioned results, here, proper energy level diagrams for Bi+ and Bi0 were depicted on the basis of previous studies to explain the energy transfer mechanism.18,26 As shown in Fig. 6, both Bi+ and Bi0 can be excited by 460 nm light from the ground state to the excited levels of 1D2 and 2P1/2, respectively, and the active Bi+ then relaxes non-radiatively to the first excited level 3P1. The energy transfer process can be described as 3P1(Bi+) + 4S3/2(Bi0) → 3P0(Bi+) + 2D3/2(Bi0), which helps to emit a 1260 nm photon. In order to quantify the energy transfer, we calculated the efficiency in CF, SF, and BF glasses compared to the MF sample by the following eqn (2):
 | (2) |
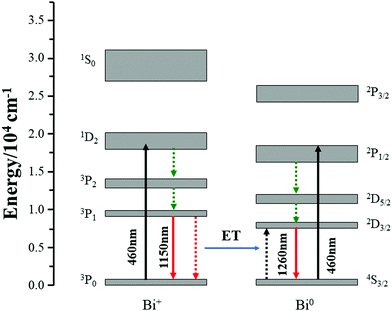 | ||
| Fig. 6 Simplified energy level diagram of Bi+ and Bi0, and the possible energy transfer between Bi+ and Bi0. | ||
Owing to the co-existence of multiple Bi-activated NIR centers in the glasses, the ultrabroadband NIR emission in Bi-doped germanate glasses prepared through topochemical reduction could be tuned widely to span the NIR region by adjusting the excitation wavelength from 420 to 700 nm, as presented in Fig. 7(a). Compared to RE-doped or RE-Bi co-doped glasses, the NIR emission performance of Bi-doped glasses was more flexible and efficient in terms of the emission bandwidth and peaks.40,41 To further reveal the relationship between the emission and excitation behaviour in detail, the emission-excitation map from the BF glass sample is denoted in Fig. 7(b). Clearly, there are multiple NIR centers co-existing in the glass and Bi-activated centers responded differently to the excitation wavelength. For NIR emission centers at ∼1100 nm, two wide absorption bands ranging from 420 to 600 nm and 660 to 720 nm are observed, which indicates that the emission band around ∼1100 nm could be excited by visible light. For the NIR emissions centered at ∼930 and ∼1500 nm, there was only a narrow absorption band between 430 and 470 nm. By increasing the excitation wavelength from 420 to 720 nm, the emission band can cover the 900–1600 nm region at the beginning, but set to ∼1100 nm at the end. These results provided a flexible pumping scheme of Bi-doped glasses for the potential application as NIR materials.
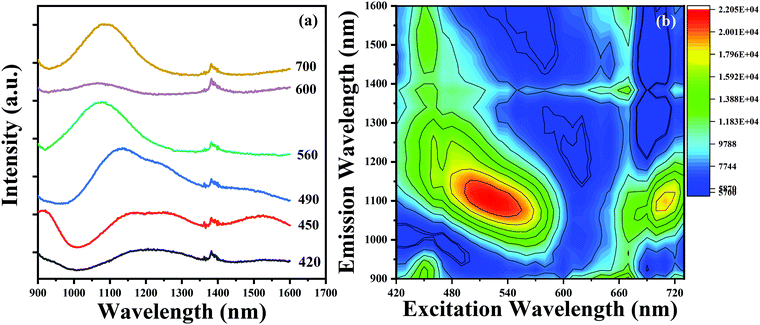 | ||
| Fig. 7 (a) The NIR spectra evolution of the BF glass sample. (b) The contour plot of the emission-excitation map from the BF glass sample. | ||
In order to understand why the above changes occurred, the concept of optical basicity, which has an important influence on the valence state and luminescence behaviour of Bi, was employed to provide more clues.37,38 The values of the Duffy's optical basicity (Λth) of glasses can be calculated by the eqn (3):
| Λth = (X1Λ1 + X2Λ2 + ⋯ + XnΛn) | (3) |
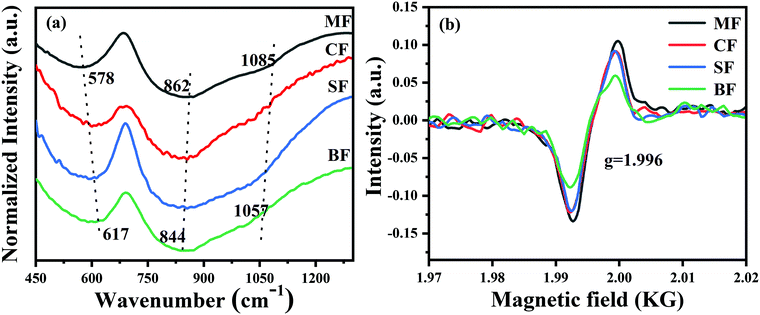
To the best of our knowledge, the Bi-activated centers are highly sensitive to the variation of the local crystal field and glass structures around them.43–45 To reveal the deeper mechanism behind what we have discussed above, the structural analysis by FTIR spectroscopy and EPR was performed to offer more detailed information concerning the relationship between the microstructure of the glasses and the optical properties of Bi-activated NIR centers. FTIR spectra are illustrated in Fig. 8. Two absorption bands around 578 cm−1 and 862 cm−1 are observed in the spectra, which are assigned to the symmetric stretching vibrations of Ge–O–Ge and the asymmetric stretching vibrations of Ge–O–Ge in the GeO4 tetrahedra.24,37,46 As the radius of the alkaline earth-metal ions increases, two remarkable changes are observed in the FTIR spectra. First, the former absorption peak located at 578 cm−1 ultimately shifted to 617 cm−1, indicating that the six-unit GeO4 rings are broken up into smaller ones, and eventually, three-unit GeO4 rings. Second, the latter absorption peaks blue-shift from 862 cm−1 to 844 cm−1 and from 1085 cm−1 to 1057 cm−1, which are related to the conversion of the GeO4 tetrahedra from Q3 (tetrahedral with one non-bridged oxygen) to Q2 (tetrahedral with two non-bridge oxygens), Ge–O− bands, and finally forming GeO6 octahedron.47–49 To sum up, the phenomenon observed above implies that more and more non-bridging oxygens are generated in the glasses, which therefore resulted in the depolymerisation of the glass network. The EPR technique is adopted to offer more information about the glass structure. As presented in Fig. 8(b), an obvious signal at g = 1.996 appeared in the four samples, which is attributed to the oxygen vacancy. Moreover, the signal intensity decreases continuously with the increase in the radius of the alkaline earth metal ions, indicating that more and more oxygen were involved into the glass structures, thus causing the Bi-activated NIR centers to be oxidized into non-NIR emission centers. This fact shows that the NIR luminescence behaviour of Bi could be regulated by modulating the overall glass structure.
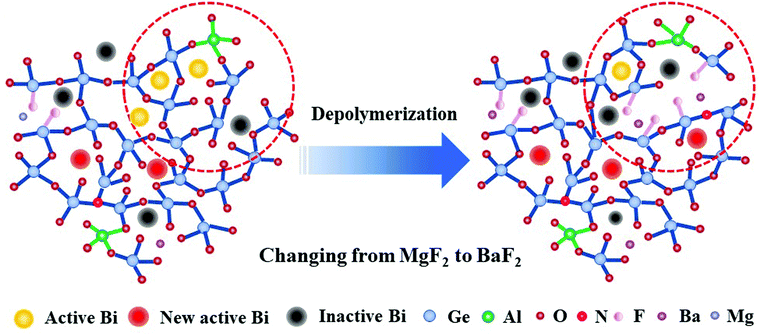
Based on the above analysis, the structural evolution of the glasses from MF to BF is proposed in the schematic diagram in Fig. 9. As the ionic field strength decreases from Mg2+ to Ba2+, more and more F− replace O2− with varying alkaline earth metal fluorides from MgF2 to BaF2, which results in an increase in the content of non-bridging oxygen. As a result, the glass networks are gradually depolymerized. On one hand, it creates a negatively charged environment, which requires more positive charges to neutralize the excess negative charges, and the looser glass structures can easily expose the Bi NIR emission centers within the glasses to the oxygen atmosphere.21 The above two reasons drive the oxidation of Bi in low valence into higher valence, which are not active NIR centers.50–52 Simultaneously, the depolymerized glass network promotes interactions between Bi+ and Bi0. As a result, the energy transfer between Bi+ and Bi0 is enhanced, which is why we could observe the increased energy transfer efficiency from Bi+ to Bi0 in Table 1. On the other hand, the depolymerized glass network may facilitate the formation of more nitride bonds connecting with Ge to the glass network around Bi, thus generating more new Bi NIR emission centers related to germanate by nitridation.33 As a consequence, the emission intensity at ∼924 and ∼1496 nm improved. This result indicates that the multi-center Bi NIR luminescence behaviour can be regulated differently by adjusting the glass structures, and provides a better understanding about the mechanism of the Bi NIR emission.
4 Conclusions
In summary, through adjusting the glass structure, we successfully manipulated the multi-center Bi NIR luminescence behaviours in fluorine- and nitrogen-doped germanate glasses. A flatter emission spectrum spanning from 850 to 1600 nm with predominant emission bands located at ∼924, ∼1150, ∼1260 and ∼1496 nm was realized. By increasing the radius of alkaline earth metal ions, the glass structures were gradually depolymerized. The looser glass structures, on one hand, promoted the oxidization of Bi0 and Bi+ into inactive centers, thus reducing the emission intensity at ∼1150 nm. On the other hand, it enhanced the energy transfer from Bi+ to Bi0, which was conducive to enhance the emission intensity at ∼1260 nm. Moreover, the depolymerized glass network may facilitate the formation of more nitride bonds connecting to Ge to the glass network around Bi, thus generating new Bi NIR emission centers related to germanate by nitridation. As a result, the emission intensity and lifetime of ∼924 and ∼1496 nm emission bands got a certain degree of improvement. The study presented here is expected to promote our understanding to the mechanism of the Bi NIR emission behaviours in glass.Conflicts of interest
There are no conflicts to declare.Acknowledgements
We acknowledge the financial support from the National Key R&D Program of China (2020YFB1805901), the National Natural Science Foundation of China (Grant No. 51872095, 51672085), the Key R&D Program of Guangzhou (No. 202007020003), the Program for Innovative Research Team in University of Ministry of Education of China (Grant No. IRT-17R38), the Joint Fund of Ministry of Education of China, the Major Basic Research Cultivation Project of Natural Science Foundation of Guangdong Province (Grant No. 2018B03038009), the Local Innovative Research Team Project of “Pearl River Talent Plan” (Grant No. 2017BT01X137) and the Fundamental Research Funds for the Central Universities (Grant No. 2020ZYGXZR036).References
- S. A. Diddams, L. Hollberg and V. Mbele, Nature, 2007, 445, 627–630 Search PubMed.
- B. Lee, Opt. Fiber Technol., 2003, 9, 57–79 Search PubMed.
- Th. Udem, R. Holzwarth and T. W. Hänsch, Nature, 2002, 416, 233–237 Search PubMed.
- M. Hilbert and P. López, Science, 2011, 332, 60–65 Search PubMed.
- M. Janos and S. C. Guy, J. Lightwave Technol., 1998, 16, 542–548 Search PubMed.
- S. Jetschke and S. Unger, et al. , Opt. Express, 2008, 16, 15540–15545 Search PubMed.
- R. Zhou, Y. Ju, Y. Zhang and Y. Wang, Chin. Opt. Lett., 2011, 9, 071401 Search PubMed.
- X. Liu, P. Kuan, D. Li, S. Gao, X. Wang, L. Zhang, L. Hu and D. Chen, Opt. Mater. Express, 2016, 6, 1093–1098 Search PubMed.
- R. Lisiecki and W. Ryba-Romanowski, J. Alloys Compd., 2020, 814, 152304 Search PubMed.
- K. Murata, Y. Fujimoto, T. Kanabe, H. Fujita and M. Nakatsuka, Fusion Eng. Des., 1999, 44, 437–439 Search PubMed.
- Y. Fujimoto and M. Nakatsuka, Jpn. J. Appl. Phys., 2001, 40, L279–L281 Search PubMed.
- M. Peng, J. Qiu, D. Chen, X. Meng, I. Yang, X. Jiang and C. Zhu, Opt. Lett., 2004, 29, 1998–2000 Search PubMed.
- E. M. Dianov, V. V. Dvoyrin, V. M. Mashinsky, A. A. Umnikov, M. V. Yashkov and A. N. Gur'yanov, Quantum Electron., 2005, 35, 1083–1084 Search PubMed.
- Y. Fujimoto and M. Nakatsuka, J. Non-Cryst. Solids, 2006, 352, 2254–2258 Search PubMed.
- Y. Arai, T. Suzuki, Y. Ohishi, S. Morimoto and S. Khonthon, Appl. Phys. Lett., 2007, 90, 261110 Search PubMed.
- G. Lakshminarayana, J. Ruan and J. Qiu, J. Alloys Compd., 2009, 476, 878–883 Search PubMed.
- M. A. Hughes, T. Akada, T. Suzuki, Y. Ohishi and D. W. Hewak, Opt. Express, 2009, 17, 19345–19355 Search PubMed.
- N. Zhang, J. Qiu, G. Dong, Z. Yang, Q. Zhang and M. Peng, J. Mater. Chem., 2012, 22, 3154–3159 Search PubMed.
- Y. Zhao, M. Peng, A. Mermet, J. Zheng and J. Qiu, J. Mater. Chem. C, 2014, 2, 7830–7835 Search PubMed.
- J. Cao, L. Wondraczek, Y. Wang, L. Wang, J. Li, S. Xu and M. Peng, ACS Photonics, 2018, 5, 4393–4401 Search PubMed.
- X. Li, J. Cao, L. Wang and M. Peng, J. Am. Ceram. Soc., 2018, 101, 1159–1168 Search PubMed.
- J. Cao, J. Peng, L. Wang, H. Luo, X. Wang, P. Xiong, Y. Wang and M. Peng, J. Mater. Chem. C, 2019, 7, 2076–2084 Search PubMed.
- J. Cao, X. Li, L. Wang, Z. Zhang, S. Xu and M. Peng, J. Mater. Chem. C, 2018, 101, 2297–2304 Search PubMed.
- J. Cao, S. Xu, Q. Zhang, Z. Yang and M. Peng, Adv. Opt. Mater., 2018, 6, 1801059 Search PubMed.
- B. Xu, S. Zhou, M. Guan and D. Tan, Opt. Express, 2011, 19, 23436–23443 Search PubMed.
- L. Zhang, G. Dong, J. Wu, M. Peng and J. Qiu, J. Alloys Compd., 2012, 531, 10–13 Search PubMed.
- F. E. D. Zhang, R. Ye, Y. Hua, S. Xu and F. Huang, Opt. Mater., 2019, 95, 109222 Search PubMed.
- S. Wu, P. Xiong, X. Liu, Y. Fu, Q. Liu, M. Peng, Y. Chen and Z. Ma, J. Mater. Chem. C, 2020, 8, 16584–16592 Search PubMed.
- X. Xu, J. Zhao, X. Chen, Q. Xu, T. Wang, S. F. Yu, X. Xu, X. Qiao, J. Du, X. Fan, J. Qiu and G. Qian, J. Am. Ceram. Soc., 2020, 103, 5796–5807 Search PubMed.
- A. J. Stevenson, H. Serier-Brault, P. Gredin and M. Mortier, J. Fluorine Chem., 2011, 132, 1165–1173 Search PubMed.
- Y. Ma, X. Peng, M. Fei, W. Zhang, L. Teng, F. Hu, R. Wei and H. Guo, J. Alloys Compd., 2020, 846, 156435 Search PubMed.
- B. Xu, D. Tan, S. Zhou, Z. Hong, K. N. Sharafudeen and J. Qiu, Opt. Express, 2012, 20, 29105–29111 Search PubMed.
- W. Chen, J. Cao, M. Peng, Y. Wang and P. Xiong, J. Am. Ceram. Soc., 2020, 00, 1–9 Search PubMed.
- J. Cao, L. Li, L. Wang, X. Li, Z. Zhang, S. Xu and M. Peng, J. Mater. Chem. C, 2018, 6, 5384–5390 Search PubMed.
- X. Li, J. Cao and M. Peng, J. Am. Ceram. Soc., 2018, 101, 2921–2929 Search PubMed.
- C. Liu, Y. Zhuang, J. Han, J. Ruan, C. Liu and X. Zhao, Ceram. Int., 2020, 46, 15544–15553 Search PubMed.
- Y. Zhao, L. Wondraczek, A. Mermet, M. Peng, Q. Zhang and J. Qiu, Opt. Express, 2015, 23, 12423–12433 Search PubMed.
- Y. Xue, J. Cao, Z. Zhang, L. Wang, S. Xu and M. Peng, J. Am. Ceram. Soc., 2018, 101, 624–633 Search PubMed.
- X. Li, F. Hu, M. Peng, Q. Zhang and M. Yin, J. Am. Ceram. Soc., 2017, 100, 574–582 Search PubMed.
- J. Xiao, J. Cao, Y. Wang, X. Li, X. Wang, J. Zhang and M. Peng, J. Mater. Chem. C, 2019, 7, 10544–10550 Search PubMed.
- H. K. Dan, D. N. Le, H. T. Nguyen-Truong, T. D. Tap, H. X. Vinh, N. M. Ty, R. Wang, D. Zhou and J. Qiu, J. Lumin., 2020, 219, 116942 Search PubMed.
- J. A. Duffy, J. Non-Cryst. Solids, 1989, 109, 35–39 Search PubMed.
- P. Xiong, Y. Li and M. Peng, iScience, 2020, 23, 101578 Search PubMed.
- Z. Lu, W. Zhang, J. Chen, S. Chen, J. Cao and H. Guo, J. Lumin., 2021, 232, 117857 Search PubMed.
- Z. Zheng, J. Zhang, X. Liu, R. Wei, F. Hu and H. Guo, Ceram. Int., 2020, 46, 6154–6159 Search PubMed.
- H. Verweij and J. H. J. M. Buster, J. Non-Cryst. Solids, 1979, 34, 81–99 Search PubMed.
- F. L. Galeener, A. E. Geissberger, G. W. Ogar and R. E. Loehman, Phys. Rev. B: Condens. Matter Mater. Phys., 1983, 28, 4768–4773 Search PubMed.
- D. D. Martino, L. F. Santos, A. C. Marques and R. M. Almeida, J. Non-Cryst. Solids, 2001, 293-295, 394–401 Search PubMed.
- L. Wang, M. Peng, X. Li, Y. Wang, H. Luo, J. Cao and X. Li, J. Mater. Chem. C, 2019, 7, 5074–5083 Search PubMed.
- P. Xiong, C. Zheng, M. Peng, Z. Zhou, F. Xu, K. Qin, Y. Hong and Z. Ma, J. Am. Ceram. Soc., 2020, 103, 6922–6931 Search PubMed.
- C. Zheng, P. Xiong, M. Peng and H. Liu, J. Mater. Chem. C, 2020, 8, 13668–13675 Search PubMed.
- W. Zhang, Y. Tong, F. Hu, R. Wei, L. Chen and H. Guo, Ceram. Int., 2021, 47, 284–291 Search PubMed.
| This journal is © The Royal Society of Chemistry 2021 |

