DOI:
10.1039/D0MA00736F
(Paper)
Mater. Adv., 2021,
2, 996-1005
Molecular structure controlled self-assembly of pyridine appended fluorophores: multi-stimuli fluorescence responses and fabricating rewritable/self-erasable fluorescent platforms†
Received
25th September 2020
, Accepted 10th December 2020
First published on 12th December 2020
Abstract
The fluorescence properties of organic materials are intrinsically governed by the molecular conformation and intermolecular interaction mediated aggregation. Herein, we have synthesized two sets of isomeric fluorescence molecules with a partially planar and propeller structure, (Z)-3-(4-(9H-carbazol-9-yl)phenyl)-2-(pyridinyl)acrylonitrile (1–3) and (Z)-3-(4-(diphenylamino)phenyl)-2-(pyridinyl)acrylonitrile (4–6) and explored their effect on the molecular aggregation, and tunable and switchable solid state fluorescence. Molecular aggregation studies revealed the formation of 1D nanostructures of nanoparticles with the evolution of intermolecular interactions with increasing water fraction and time. The evolution of nanostructures led to a tunable fluorescence from green to red. The subtle structural change and formation of different crystal forms/polymorphs resulted in a tunable fluorescence between 514 and 644 nm (Φf = 11.3 to 25.3%). Solid state structural studies showed relatively weak intermolecular interactions in the crystal lattice of 1, 3 and 6 that resulted in the formation of different crystal forms/polymorphs and varied molecular assemblies with tunable fluorescence. Mechanofluorochromism (MFC) studies also showed molecular structure dependent fluorescence switching. 1–3 and 6 showed crushing/heating induced reversible fluorescence switching whereas 4 and 5 did not show any MFC. Integrating an acid/base sensitive pyridine functionality has been exploited for demonstrating halochromic reversible fluorescence switching as well as fabricating rewritable/self-erasable fluorescent platforms on filter paper and glass plates.
Introduction
Organic solid state fluorescent materials with tunable and switchable fluorescence properties have received significant attention owing to their applications in sensors, fluorescent switches, organic light-emitting diodes (OLEDs), optical devices and bio-imaging.1–8 Molecular self-assembly and external stimuli sensitive molecular packing can tune the optical band gap and fluorescence properties.9–11 Molecular structure and intermolecular interactions of organic molecules often play a significant role in the molecular self-assembly and stimuli induced molecular packing alterations.12–19 Non-planar flexible structures produced tunable fluorescent polymorphs via conformational freedom.16–19 Moreover, twisted non-planar molecular conformations with weak intermolecular interactions exhibited drastic fluorescence colour changes due to the transformation of molecular packing, phase, conformation and excited state (locally excited state to charge-transfer state, triplet to singlet state or monomer to excimer state) upon applying mechanical pressure.20–29 Subtle molecular change often produced remarkable fluorescence modulation and molecular aggregation.30–32 Anthracene functionalized triphenylethylene fluorophores exhibited a rare two sequential fluorescence switching initiated by one stimulus via forming an anthracene excimer intermediate.33 Integrating anthracene with tetraphenylethylene (TPE) showed pressure induced enhanced blue shifted fluorescence by suppression of energy transfer.34 TPE based donor (D)–acceptor (A) materials showed a molecular structure dependent pressure induced fluorescence enhancement.9,29,35–39 Introducing alkyl chains resulted in self-reversible MFC materials and super-cooled fluorescent liquids.40–42 Triphenylamine (TPA) based D–A–D molecules with pyridine units showed remarkable fluorescence switching.43 Integrating acid responsive pyridine units leads to halochromic fluorescence switching.14,44–48 Halochromic isoquinoline functionalized mechanochromic TPA has been employed for fabricating rewritable fluorescent platforms.49 Nevertheless, the versatility of small molecules to exhibit varied molecular assembly and functions via delicately controlled conformation and supramolecular interactions continues to attract great interest.
Herein, we have synthesized two sets of positional isomers (Scheme 1, 1–6) that differ subtly in the structure to explore their impact on the molecular assembly and switchable and tunable fluorescence. Interestingly, the subtle structural change drastically influenced the formation of nanostructures, solid state fluorescence and mechanofluorochromism (MFC). Carbazole based isomers (1–3) produced multiple crystal forms/polymorphs with tunable fluorescence between 514 and 644 nm (Φf = 11.3 to 25.3%). The fluorescent crystals and nanostructure evolution are controlled by supramolecular interactions that varied with the molecular structure. The presence of the nitrogen functionality allowed demonstrating halochromic fluorescence switching via exposing trifluoroacetic acid (TFA) and NH3. The structure dependent response has been exploited for fabricating rewritable and self-erasable fluorescent platforms.
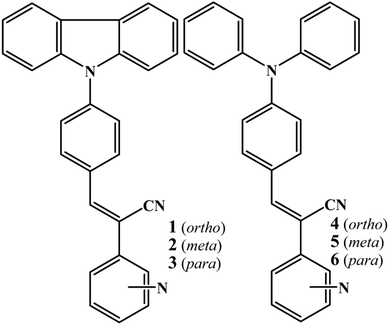 |
| | Scheme 1 Molecular structure of 1–6. | |
Experimental section
Carbazole, CuI, 18-crown-6, triphenylamine, 2-pyridylacetonitrile, 3-pyridylacetonitrile, 4-pyridylacetonitrile, K2CO3, and sodium methoxide were purchased from Sigma-Aldrich and used without further purification. 4-(9H-Carbazol-9-yl) benzaldehyde and 4-(diphenylamino) benzaldehyde were synthesized by following the reported procedure.50,51
General procedure for synthesizing 1–6 (Scheme S1, ESI†)
4-(9H-Carbazol-9-yl) benzaldehyde/4-diphenylamine benzaldehyde (1.0 equivalent) was dissolved in methanol and stirred at room temperature. To this solution, pyridine substituted phenylacetonitrile (1.5 equivalents) and sodium methoxide (2 equivalents) were added and the reaction mixture was stirred at 60 °C for 2 h. Finally, the reaction mixture was cooled to room temperature and the product was filtered and washed with cold methanol.
(Z)-3-(4-(9H-Carbazol-9-yl)phenyl)-2-(pyridine-2-yl)acrylonitrile (1).
Yield: 79%. M.p.: 162–164 °C. IR (KBr, cm−1): 3418 (N–H), 3048 (C–H), 2215 (C![[triple bond, length as m-dash]](https://www.rsc.org/images/entities/char_e002.gif) N), 1591 (aromatic C
N), 1591 (aromatic C![[double bond, length as m-dash]](https://www.rsc.org/images/entities/char_e001.gif) C), 1450 (C–H double bond), 745 (CH). 1H NMR (300 MHz, CDCl3) δ 8.69–8.67 (d, 1H), 8.59 (s, 1H), 8.26–8.23 (d, 2H), 8.16–8.13 (d, 2H), 7.86–7.82 (m, 2H), 7.80–7.72 (d, 2H), 7.55–7.47 (d, 2H), 7.46–7.41 (m, 2H), 7.35–7.29 (m, 3H). 13C NMR (75 MHz, CDCl3) δ 150.94, 149.75, 143.87, 140.26, 140.20, 137.52, 131.96, 131.58, 126.90, 126.23, 123.83, 123.71, 121.45, 120.59, 120.47, 117.88, 110.38, 109.92. C26H17N3 (371.14): calculated. C 84.07, H 4.61, N 11.31; found C 84.16, H 4.66, N 11.12. m/z calculated for C26H17N3 (M + H): 371.14, found: 371.2.
C), 1450 (C–H double bond), 745 (CH). 1H NMR (300 MHz, CDCl3) δ 8.69–8.67 (d, 1H), 8.59 (s, 1H), 8.26–8.23 (d, 2H), 8.16–8.13 (d, 2H), 7.86–7.82 (m, 2H), 7.80–7.72 (d, 2H), 7.55–7.47 (d, 2H), 7.46–7.41 (m, 2H), 7.35–7.29 (m, 3H). 13C NMR (75 MHz, CDCl3) δ 150.94, 149.75, 143.87, 140.26, 140.20, 137.52, 131.96, 131.58, 126.90, 126.23, 123.83, 123.71, 121.45, 120.59, 120.47, 117.88, 110.38, 109.92. C26H17N3 (371.14): calculated. C 84.07, H 4.61, N 11.31; found C 84.16, H 4.66, N 11.12. m/z calculated for C26H17N3 (M + H): 371.14, found: 371.2.
(Z)-3-(4-(9H-Carbazol-9-yl)phenyl)-2-(pyridine-3-yl)acrylonitrile (2).
Yield: 85%. M.p.: 149–151 °C. IR (KBr, cm−1): 3419 (N–H), 3055 (C–H), 2224 (C![[triple bond, length as m-dash]](https://www.rsc.org/images/entities/char_e002.gif) N), 1595 (aromatic C
N), 1595 (aromatic C![[double bond, length as m-dash]](https://www.rsc.org/images/entities/char_e001.gif) C), 1449 (C–H double bond), 748 (CH). 1H NMR (300 MHz, CDCl3) δ 8.99 (s, 1H), 8.68–8.67 (d, 1H), 8.18–8.14 (t, 4H), 8.03–8.01 (d, 1H), 7.76–7.74 (d, 2H), 7.67 (s, 1H), 7.53–7.51 (d, 2H), 7.46–7.42 (m, 3H), 7.34–7.31 (s, 2H). 13C NMR (75 MHz, CDCl3) δ 150.22, 147.06, 142.52, 140.26, 140.23, 133.57, 131.75, 131.10, 130.52, 127.01, 126.25, 123.84, 123.76, 120.65, 120.50, 117.25, 109.82, 108.75. C26H17N3 (371.14): calculated. C 84.07, H 4.61, N 11.31; found C 84.12, H 4.51, N 11.22. m/z calculated for C26H17N3 (M + H): 371.14, found: 371.2.
C), 1449 (C–H double bond), 748 (CH). 1H NMR (300 MHz, CDCl3) δ 8.99 (s, 1H), 8.68–8.67 (d, 1H), 8.18–8.14 (t, 4H), 8.03–8.01 (d, 1H), 7.76–7.74 (d, 2H), 7.67 (s, 1H), 7.53–7.51 (d, 2H), 7.46–7.42 (m, 3H), 7.34–7.31 (s, 2H). 13C NMR (75 MHz, CDCl3) δ 150.22, 147.06, 142.52, 140.26, 140.23, 133.57, 131.75, 131.10, 130.52, 127.01, 126.25, 123.84, 123.76, 120.65, 120.50, 117.25, 109.82, 108.75. C26H17N3 (371.14): calculated. C 84.07, H 4.61, N 11.31; found C 84.12, H 4.51, N 11.22. m/z calculated for C26H17N3 (M + H): 371.14, found: 371.2.
(Z)-3-(4-(9H-Carbazol-9-yl)phenyl)-2-(pyridine-4-yl)acrylonitrile (3).
Yield: 87%. M.p.: 165–168 °C. IR (KBr, cm−1): 3432 (N–H), 3046 (C–H), 2217 (C![[triple bond, length as m-dash]](https://www.rsc.org/images/entities/char_e002.gif) N), 1592 (aromatic C
N), 1592 (aromatic C![[double bond, length as m-dash]](https://www.rsc.org/images/entities/char_e001.gif) C), 1450 (C–H double bond), 752 (CH). 1H NMR (300 MHz, CDCl3) δ 8.75–8.73 (dd, 2H), 8.21–8.18 (d, 2H), 8.17–8.14 (d, 2H), 7.81–7.75 (m, 3H), 7.63–7.61 (m, 2H), 7.54–7.51 (d, 2H), 7.47–7.42 (m, 2H), 7.36–7.25 (m, 2H). 13C NMR (75 MHz, CDCl3) δ 150.75, 143.79, 141.65, 140.74, 140.15, 131.45, 131.28, 126.99, 126.28, 123.91, 120.74, 120.53, 119.98, 116.97, 109.82, 109.50. C26H17N3 (371.14): calculated. C 84.07, H 4.61, N 11.31; found C 84.20, H 4.58, N 11.42. m/z calculated for C26H17N3 (M + H): 371.14, found: 371.2.
C), 1450 (C–H double bond), 752 (CH). 1H NMR (300 MHz, CDCl3) δ 8.75–8.73 (dd, 2H), 8.21–8.18 (d, 2H), 8.17–8.14 (d, 2H), 7.81–7.75 (m, 3H), 7.63–7.61 (m, 2H), 7.54–7.51 (d, 2H), 7.47–7.42 (m, 2H), 7.36–7.25 (m, 2H). 13C NMR (75 MHz, CDCl3) δ 150.75, 143.79, 141.65, 140.74, 140.15, 131.45, 131.28, 126.99, 126.28, 123.91, 120.74, 120.53, 119.98, 116.97, 109.82, 109.50. C26H17N3 (371.14): calculated. C 84.07, H 4.61, N 11.31; found C 84.20, H 4.58, N 11.42. m/z calculated for C26H17N3 (M + H): 371.14, found: 371.2.
(Z)-3-(4-(Diphenylamino)phenyl)-2-(pyridine-2-yl)acrylonitrile (4).
Yield: 86%. M.p.: 141–143 °C. IR (KBr, cm−1): 3425 (N–H), 3056 (C–H), 2210 (C![[triple bond, length as m-dash]](https://www.rsc.org/images/entities/char_e002.gif) N), 1581 (aromatic C
N), 1581 (aromatic C![[double bond, length as m-dash]](https://www.rsc.org/images/entities/char_e001.gif) C), 1491 (C–H double bond), 697 (CH). 1H NMR (300 MHz, CDCl3) δ 8.61–8.60 (d, 1H), 8.35 (s, 1H), 7.88–7.77 (d, 2H), 7.75–7.70 (m, 2H), 7.34–7.30 (t, 4H), 7.22–7.21 (m, 1H), 7.18–7.16 (m, 5H), 7.13–7.12 (m, 1H), 7.05–7.03 (d, 2H). 13C NMR (75 MHz, CDCl3) δ 151.84, 150.56, 149.50, 146.44, 144.51, 137.29, 131.57, 129.63, 125.95, 125.84, 124.63, 122.79, 120.86, 120.41, 118.74, 105.89. C26H17N3 (373.16): calculated. C 83.62, H 5.13, N 11.25; found C 83.43, H 5.01, N 11.22. m/z calculated for C26H19N3 (M + H): 373.16, found: 373.3.
C), 1491 (C–H double bond), 697 (CH). 1H NMR (300 MHz, CDCl3) δ 8.61–8.60 (d, 1H), 8.35 (s, 1H), 7.88–7.77 (d, 2H), 7.75–7.70 (m, 2H), 7.34–7.30 (t, 4H), 7.22–7.21 (m, 1H), 7.18–7.16 (m, 5H), 7.13–7.12 (m, 1H), 7.05–7.03 (d, 2H). 13C NMR (75 MHz, CDCl3) δ 151.84, 150.56, 149.50, 146.44, 144.51, 137.29, 131.57, 129.63, 125.95, 125.84, 124.63, 122.79, 120.86, 120.41, 118.74, 105.89. C26H17N3 (373.16): calculated. C 83.62, H 5.13, N 11.25; found C 83.43, H 5.01, N 11.22. m/z calculated for C26H19N3 (M + H): 373.16, found: 373.3.
(Z)-3-(4-(Diphenylamino)phenyl)-2-(pyridine-4-yl)acrylonitrile (5).
Yield: 72%. M.p.: 108–112 °C IR (KBr, cm−1): 3433 (N–H), 2924 (C–H), 2208 (C![[triple bond, length as m-dash]](https://www.rsc.org/images/entities/char_e002.gif) N), 1579 (aromatic C
N), 1579 (aromatic C![[double bond, length as m-dash]](https://www.rsc.org/images/entities/char_e001.gif) C), 1488 (C–H double bond), 756 (CH). 1H NMR (300 MHz, CDCl3) δ 8.59 (s, 1H), 8.06–8.04 (d, 1H), 7.82–7.80 (d, 1H), 7.52–7.49 (d, 2H), 7.48–7.46 (d, 1H), 7.35–7.33 (m, 1H), 7.32 (m, 4H), 7.18–7.16 (m, 6H), 7.05–7.03 (d, 2H). 13C NMR (75 MHz, CDCl3) δ 151.86, 150.57, 149.49, 146.45, 144.53, 137.27, 131.55, 129.61, 125.94, 124.62, 122.77, 120.85, 120.41, 118.70, 105.92. C26H17N3 (373.16): calculated. C 83.62, H 5.13, N 11.25; found C 83.68, H 5.22, N 11.17. m/z calculated for C26H19N3 (M + H): 373.16, found: 373.2.
C), 1488 (C–H double bond), 756 (CH). 1H NMR (300 MHz, CDCl3) δ 8.59 (s, 1H), 8.06–8.04 (d, 1H), 7.82–7.80 (d, 1H), 7.52–7.49 (d, 2H), 7.48–7.46 (d, 1H), 7.35–7.33 (m, 1H), 7.32 (m, 4H), 7.18–7.16 (m, 6H), 7.05–7.03 (d, 2H). 13C NMR (75 MHz, CDCl3) δ 151.86, 150.57, 149.49, 146.45, 144.53, 137.27, 131.55, 129.61, 125.94, 124.62, 122.77, 120.85, 120.41, 118.70, 105.92. C26H17N3 (373.16): calculated. C 83.62, H 5.13, N 11.25; found C 83.68, H 5.22, N 11.17. m/z calculated for C26H19N3 (M + H): 373.16, found: 373.2.
(Z)-3-(4-(Diphenylamino)phenyl)-2-(pyridine-4-yl)acrylonitrile (6).
Yield: 89%. M.p.: 153–156 °C IR (KBr, cm−1): 3432 (N–H), 3039 (C–H), 2207 (C![[triple bond, length as m-dash]](https://www.rsc.org/images/entities/char_e002.gif) N), 1578 (aromatic C
N), 1578 (aromatic C![[double bond, length as m-dash]](https://www.rsc.org/images/entities/char_e001.gif) C), 1487 (C–H double bond), 698 (CH). 1H NMR (300 MHz, CDCl3) δ 8.64 (s, 2H), 7.83–7.81 (d, 2H), 7.59–7.52 (s,1H), 7.36–7.32 (d, 2H), 7.29–7.27 (m, 4H), 7.18–7.14 (m, 6H), 7.12–7.03 (d, 2H). 13C NMR (75 MHz, CDCl3) δ 151.02, 150.46, 146.20, 144.34, 142.54, 131.49, 129.71, 129.66, 126.09, 125.07, 124.94, 120.11, 119.60, 117.84, 104.38. C26H17N3 (373.16): calculated. C 83.62, H 5.13, N 11.25; found C 83.68, H 5.24, N 11.12. m/z calculated for C26H19N3 (M + H): 373.16, found: 373.2.
C), 1487 (C–H double bond), 698 (CH). 1H NMR (300 MHz, CDCl3) δ 8.64 (s, 2H), 7.83–7.81 (d, 2H), 7.59–7.52 (s,1H), 7.36–7.32 (d, 2H), 7.29–7.27 (m, 4H), 7.18–7.14 (m, 6H), 7.12–7.03 (d, 2H). 13C NMR (75 MHz, CDCl3) δ 151.02, 150.46, 146.20, 144.34, 142.54, 131.49, 129.71, 129.66, 126.09, 125.07, 124.94, 120.11, 119.60, 117.84, 104.38. C26H17N3 (373.16): calculated. C 83.62, H 5.13, N 11.25; found C 83.68, H 5.24, N 11.12. m/z calculated for C26H19N3 (M + H): 373.16, found: 373.2.
Characterization
NMR spectra were measured on a Bruker 300 MHz AVANCE-II. The fluorescence spectra and absolute quantum yields for all compounds in the solid state were recorded using a Jasco fluorescence spectrometer-FP-8300 instrument equipped with an integrating sphere and a calibrated light source. The Fourier transform infrared (FT-IR) spectra were recorded on a JASCO FT-IR spectrometer model 400 plus using KBr pellets. Mass spectra were recorded using a Bruker 320-MS triple quadrupole mass spectrometer using the direct probe insertion method. Powder X-ray diffraction (PXRD) patterns were measured using an XRD-Bruker D8 Advance XRD with Cu Kα radiation (λ = 1.54050 Å) at room temperature. Single crystals were coated with paratone-N oil and the diffraction data were measured with synchrotron radiation (λ = 0.62998 Å) on a ADSC Quantum-210 detector at 2D SMC with a silicon (111) double crystal monochromator (DCM) at the Pohang Accelerator Laboratory, Korea. CCDC No. 2027366–2027372.†
Results and discussion
Isomeric fluorophores (1–6, Scheme 1a) were synthesized by condensing carbazole benzaldehyde/triphenylamine aldehyde with pyridine acetonitrile isomers (Scheme S1, ESI†). Structurally 1–6 differed only slightly. 1–3 contain planar carbazole whereas twisted propeller triphenylamine is found in 4–6. Nitrogen positions in 1–3 and 4–6 varied from ortho to para. Absorption of 1–3 and 4–6 did not show significant change with solvent polarity (Fig. S1 and S2, ESI†). 1–3 showed intramolecular charge transfer (ICT) absorption peaks between 370 and 380 nm in different solvents whereas 4–6 showed ICT between 405 and 420 nm. On the other hand, fluorescence spectra showed a large shift of λmax across solvent polarities (Fig. S3 and S4, ESI†). 1–6 showed red shifted weak fluorescence in polar solvents but a comparatively strong blue shifted fluorescence was observed in non-polar solvents (Fig. S3, S4 and Table S1, ESI†). This strongly suggests the involvement of a twisted intramolecular charge transfer state (TICT).52 In contrast, 1–6 showed strongly enhanced fluorescence in the solid state (Table 1). Unlike in solution, carbazole based 1–3 exhibited a stronger fluorescence compared to 4–6. Aggregation studies of 1–6 further confirmed the solid state luminescence enhancement (Fig. 1 and Fig. S5–S8, ESI†). For example, 3 in CH3CN showed a weak fluorescence at 563 nm. Increasing water fraction showed a decrease of fluorescence intensity with a slight red shift in the λmax (575 nm) due to the increase in local polarity. The fluorescence was completely quenched at 70% water fraction.
Table 1 Fluorescence efficiency of 1–6 in the solid state
| Compounds |
λ
max (nm) |
Absolute quantum yield (Φf) % |
| Crystal |
Crushed |
Heated |
|
1-G
|
536 |
13.4 |
7.4 |
10.4 |
|
1-O
|
581 |
20.2 |
12.7 |
18.4 |
|
2
|
516 |
23.5 |
18.9 |
20.9 |
|
3-G
|
537 |
25.3 |
15.0 |
21.9 |
|
3-Y
|
554 |
18.1 |
8.0 |
14.7 |
|
3-O
|
567 |
13.3 |
4.9 |
10.9 |
|
4
|
604 |
12.2 |
14.6 |
14.6 |
|
5
|
561 |
11.3 |
8.5 |
10.4 |
|
6
|
565 |
15.3 |
11.0 |
14.6 |
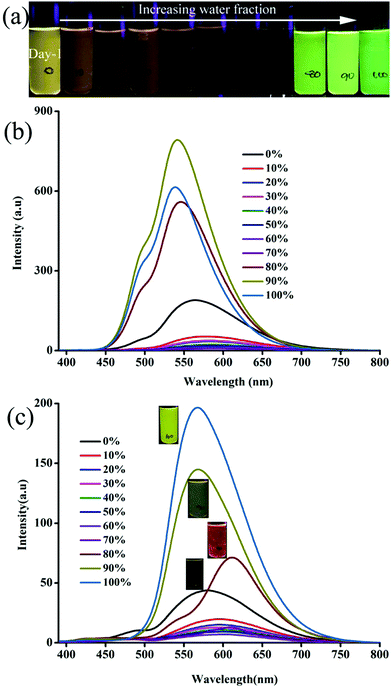 |
| | Fig. 1 Digital images and fluorescence spectra (a and b) 3 and (c) 6 with increasing water fraction in a CH3CN:water mixture. λexc = 365 nm (for the digital images) and 370 nm (for the spectra). | |
However, further increase of the water fraction (above 80%) showed a strong increase of fluorescence intensity due to the aggregation of molecules with increasing water fraction. The fluorescence (λmax) was blue shifted with increasing water fraction (545 nm at 80% and 539 nm at 100%). Digital images also confirmed the conversion of weak yellow fluorescence to strong green with increasing water ratio in CH3CN (Fig. 1a). Other isomers (1, 2 and 4, 5) also exhibited a similar increase of fluorescence intensity with increasing water fraction (Fig. S5–S8, ESI†). Surprisingly, 6 exhibited drastically different fluorescent aggregate formation with increasing water fraction. 6 showed a red shifted fluorescence from 575 nm to 610 nm at 80% water fraction (Fig. 1c). Further increase of water fraction (90 and 100%) showed blue shifted fluorescence (575 to 567 nm). Thus water percentage clearly influenced the molecular self-assembly of 6 which was different from other isomers.
Molecular self-assembly of 1–6 varied with increasing water fraction and time that led to tunable fluorescence. After 48 h, 1 showed yellow fluorescence particles at 70 and 80% water fraction (Fig. S5c, ESI†). The peak intensity at 488 nm becomes stronger and both peaks appeared with almost equal intensity. In contrast, 2 did not show any significant change after 48 h (Fig. S6c, ESI†). But 3 exhibited green (70%), yellow (80%) and greenish-yellow (90 and 100%) fluorescent particles at different water fractions after 48 h (Fig. 2). On the other hand, 4 and 5 did not show a significant change of fluorescence with time (Fig. S7 and S8, ESI†). After 48 h, the fluorescence of 6 was red shifted for 90 and 100% water fraction and matched with the fluorescence of 80% water fraction (Fig. S9, ESI†). Except 6, the fluorescence of all other molecules blue shifted with time. Thus the molecular structure and water fraction influenced molecular aggregation and fluorescence tuning.53,54
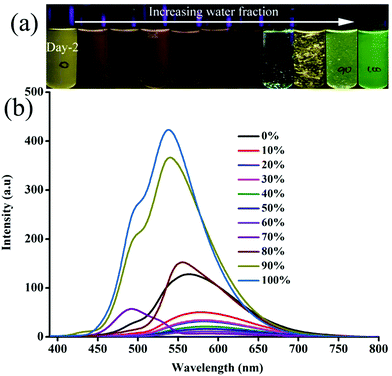 |
| | Fig. 2 (a) Digital images and (b) fluorescence spectra of 3 at different water fraction in CH3CN:water in day 2. λexc = 365 nm (for the digital images) and 370 nm (for the spectra). | |
In order to explore the morphological evolution at different water fractions, fluorescence microscopy and scanning electron microscopy (SEM) analyses were performed. Fluorescence microscopy studies of 1 revealed 1D nanostructures with red, green and yellow fluorescent particles at 60, 70 and 90–100% water fraction, respectively (Fig. S10 and S11, ESI†). However, SEM showed featureless particles along with a few flat 1D nanoparticles at 60% and only featureless particles at 100% water fraction (Fig. S11, ESI†). Although 2 did not show any fluorescence modulation, it showed a clear morphological change with increasing water fraction. Green fluorescent 1D nanostructures were observed at 80 and 90% water fraction whereas small particles were formed at 100% water fraction (Fig. S12, ESI†). SEM also confirmed the formation of neat 1D nanostructures at 80% water fraction (Fig. S13, ESI†). Along with a 1D nanostructure, small particles also formed at 90% and only single nanoparticles were found at 100% water (Fig. S14 and S15, ESI†). 3 showed rectangle shaped crystalline particles with green fluorescence at 70% water fraction (Fig. 3a). Orange fluorescent 1D nanostructures along with green fluorescent nanoparticles were formed at 80% and 90% water fraction, respectively (Fig. 3b and c). But green fluorescent thin needle/flakes were formed at 100% water (Fig. 3d). SEM also showed the formation of crystals, 1D nanostructures, 1D nanostructures along with nanoparticles and only nanoparticles with increasing water fraction from 70 to 100% (Fig. 4 and Fig. S16–S18, ESI†). 4 and 5 showed only green fluorescent nanostructures from 70 to 100% water fraction (Fig. S19 and S20, ESI†). However, SEM of 4 showed 1D nanostructures at 70% water fraction and nanoparticles at 100% water fraction (Fig. S21 and S22, ESI†). 5 exhibited spherical nanoparticles along with 1D nanostructures at 100% water fraction (Fig. S23, ESI†). But 6 showed only single nanoparticle formation from 80 to 100% water fraction (Fig. S24 and S25, ESI†). It showed red fluorescent nanoparticles at 80% and green fluorescent nanoparticles at 90 and 100% water fraction. The comparison of SEM images revealed that carbazole based 2 and 3 produced clear sharp edged ID nanostructures compared to triphenylamine based 4 and 5.
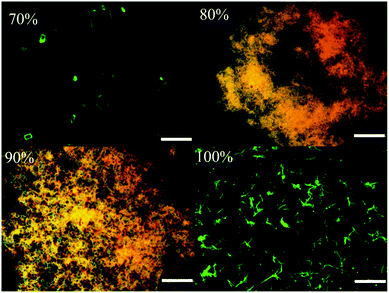 |
| | Fig. 3 Fluorescent microscopic images of 3 at different water fractions in a CH3CN–water mixture (scale bar = 500 μm). | |
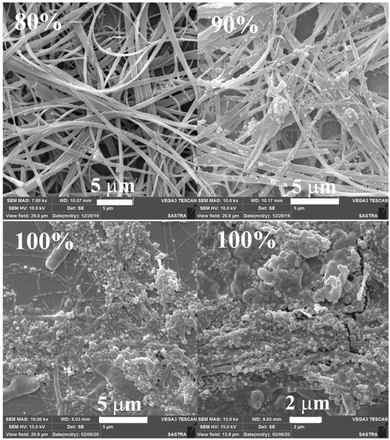 |
| | Fig. 4 SEM images of 3 at different water fractions in a CH3CN–water mixture (scale bar = 1 μm). | |
The observation of different self-assemblies and fluorescence modulations suggested the possibility of realizing polymorphic structures with tunable fluorescence. Hence various solvents have been explored for growing crystals of 1–6. Interestingly, 1 produced green (1-G) and orange (1-O) fluorescent crystals by slow evaporation from CHCl3 and CHCl3–CH3OH (1![[thin space (1/6-em)]](https://www.rsc.org/images/entities/char_2009.gif) :
:![[thin space (1/6-em)]](https://www.rsc.org/images/entities/char_2009.gif) 1), respectively. But 2 produced only green fluorescent crystals (Fig. 5a). 3 produced green (3-G), yellow (3-Y), orange (3-O) and red (3-R) fluorescent crystals from CHCl3
1), respectively. But 2 produced only green fluorescent crystals (Fig. 5a). 3 produced green (3-G), yellow (3-Y), orange (3-O) and red (3-R) fluorescent crystals from CHCl3![[thin space (1/6-em)]](https://www.rsc.org/images/entities/char_2009.gif) :
:![[thin space (1/6-em)]](https://www.rsc.org/images/entities/char_2009.gif) CH3OH (1
CH3OH (1![[thin space (1/6-em)]](https://www.rsc.org/images/entities/char_2009.gif) :
:![[thin space (1/6-em)]](https://www.rsc.org/images/entities/char_2009.gif) 1), CHCl3
1), CHCl3![[thin space (1/6-em)]](https://www.rsc.org/images/entities/char_2009.gif) :
:![[thin space (1/6-em)]](https://www.rsc.org/images/entities/char_2009.gif) hexane (1
hexane (1![[thin space (1/6-em)]](https://www.rsc.org/images/entities/char_2009.gif) :
:![[thin space (1/6-em)]](https://www.rsc.org/images/entities/char_2009.gif) 1), CHCl3
1), CHCl3![[thin space (1/6-em)]](https://www.rsc.org/images/entities/char_2009.gif) :
:![[thin space (1/6-em)]](https://www.rsc.org/images/entities/char_2009.gif) CH3OH (3
CH3OH (3![[thin space (1/6-em)]](https://www.rsc.org/images/entities/char_2009.gif) :
:![[thin space (1/6-em)]](https://www.rsc.org/images/entities/char_2009.gif) 1) and CHCl3
1) and CHCl3![[thin space (1/6-em)]](https://www.rsc.org/images/entities/char_2009.gif) :
:![[thin space (1/6-em)]](https://www.rsc.org/images/entities/char_2009.gif) hexane (diffusion), respectively (Fig. 5a). This resulted in tunable solid state fluorescence between 516 and 645 nm (Fig. 5a). In contrast, 4–6 did not produce any fluorescent polymorphs and exhibited only isomerism dependent fluorescence tuning (Fig. 5b). 4 showed solid state fluorescence at 603 nm whereas 5 and 6 showed fluorescence at 561 and 566 nm, respectively (Fig. 5b). The appearance of double fluorescence peaks in 1-G, 3-G and 3-Y might be attributed to the lack of electronic communication between donor (carbazole) and acceptor units (cyanostilbene) and exhibiting fluorescence from carbazole and cyanostilbene units separately. Single crystal structural analysis has been performed to gain insight into fluorescence tuning (Tables S3–S9, ESI†). Structural analysis showed that the molecules adopted a twisted conformation in the crystal lattice (Fig. 6 and Table S2, ESI†). 1-G and 1-O showed similar conformation with only a slight conformational twist difference in the crystal lattice (Table S2 and Fig. S26, ESI†). Molecules displayed similar packing and intermolecular interactions. Simulated PXRD of 1-G and 1-O also perfectly matched each other (Fig. S27, ESI†). 1-G showed dimer formation with opposite molecular arrangement via weak intermolecular interactions between cyano nitrogen and phenyl hydrogen (Fig. 7). 2 showed multiple intermolecular interactions; dimer formation with opposite molecular arrangement via hydrogen bonding between cyano nitrogen and phenyl/pyridine hydrogen and C–H⋯π interactions between carbazole and pyridine hydrogen (Fig. 7 and Fig. S28, ESI†). Only crystals of green and yellow forms of 3 were of good quality to solve the structure. Similar to 1, 3-G and 3-Y also differed only slightly in the conformational twist and displayed similar intermolecular interactions and packing (Fig. S29, S30 and Tables S2, S6, S7, ESI†). The intermolecular interaction between cyano nitrogen and phenyl hydrogen produced dimers with opposite molecular arrangements (Fig. 7). The asymmetric unit of 3-G/3-Y contained two molecules with different conformations (Fig. S31, ESI†). Simulated and experimental PXRD of 3-G and 3-Y also matched perfectly (Fig. S32 and S33, ESI†). However, 3-O and 3-R showed different PXRD patterns and confirmed the polymorphism (Fig. S33, ESI†). Thus the fluorescence tuning of 1-G and 1-O, and 3-G and 3-Y is attributed to crystal habits or morphology differences.55 But 3-O and 3-R are fluorescent polymorphs. 4 showed a parallel arrangement of molecules in the crystal lattice via π⋯π interactions between pyridine and phenyl group (Fig. 7 and Fig. S34, ESI†). 6 showed dimer formation with opposite molecular arrangement via weak C–H⋯π interactions (Fig. 7). The crystal quality of 5 was very poor and the structure could not be solved. The fluorescence of 4 is strongly red shifted compared to 5 and 6 due to the formation of a parallel arrangement of molecules. Solid state structural studies indicate that 1, 3 and 6 showed relatively weak intermolecular interactions compared to 2 and 4. Aggregation studies of 1, 3 and 6 showed tunable fluorescence via different self-assemblies. 3 also produced fluorescent polymorphs. The stronger intermolecular interactions in 2 and 4 might drive the molecules to adopt a more preferred arrangement whereas weaker interactions provided the opportunity to form different structural assemblies in 1, 3 and 6. Hence, the delicate balance of solvent mixtures and intermolecular interactions leads to a tunable fluorescence.
hexane (diffusion), respectively (Fig. 5a). This resulted in tunable solid state fluorescence between 516 and 645 nm (Fig. 5a). In contrast, 4–6 did not produce any fluorescent polymorphs and exhibited only isomerism dependent fluorescence tuning (Fig. 5b). 4 showed solid state fluorescence at 603 nm whereas 5 and 6 showed fluorescence at 561 and 566 nm, respectively (Fig. 5b). The appearance of double fluorescence peaks in 1-G, 3-G and 3-Y might be attributed to the lack of electronic communication between donor (carbazole) and acceptor units (cyanostilbene) and exhibiting fluorescence from carbazole and cyanostilbene units separately. Single crystal structural analysis has been performed to gain insight into fluorescence tuning (Tables S3–S9, ESI†). Structural analysis showed that the molecules adopted a twisted conformation in the crystal lattice (Fig. 6 and Table S2, ESI†). 1-G and 1-O showed similar conformation with only a slight conformational twist difference in the crystal lattice (Table S2 and Fig. S26, ESI†). Molecules displayed similar packing and intermolecular interactions. Simulated PXRD of 1-G and 1-O also perfectly matched each other (Fig. S27, ESI†). 1-G showed dimer formation with opposite molecular arrangement via weak intermolecular interactions between cyano nitrogen and phenyl hydrogen (Fig. 7). 2 showed multiple intermolecular interactions; dimer formation with opposite molecular arrangement via hydrogen bonding between cyano nitrogen and phenyl/pyridine hydrogen and C–H⋯π interactions between carbazole and pyridine hydrogen (Fig. 7 and Fig. S28, ESI†). Only crystals of green and yellow forms of 3 were of good quality to solve the structure. Similar to 1, 3-G and 3-Y also differed only slightly in the conformational twist and displayed similar intermolecular interactions and packing (Fig. S29, S30 and Tables S2, S6, S7, ESI†). The intermolecular interaction between cyano nitrogen and phenyl hydrogen produced dimers with opposite molecular arrangements (Fig. 7). The asymmetric unit of 3-G/3-Y contained two molecules with different conformations (Fig. S31, ESI†). Simulated and experimental PXRD of 3-G and 3-Y also matched perfectly (Fig. S32 and S33, ESI†). However, 3-O and 3-R showed different PXRD patterns and confirmed the polymorphism (Fig. S33, ESI†). Thus the fluorescence tuning of 1-G and 1-O, and 3-G and 3-Y is attributed to crystal habits or morphology differences.55 But 3-O and 3-R are fluorescent polymorphs. 4 showed a parallel arrangement of molecules in the crystal lattice via π⋯π interactions between pyridine and phenyl group (Fig. 7 and Fig. S34, ESI†). 6 showed dimer formation with opposite molecular arrangement via weak C–H⋯π interactions (Fig. 7). The crystal quality of 5 was very poor and the structure could not be solved. The fluorescence of 4 is strongly red shifted compared to 5 and 6 due to the formation of a parallel arrangement of molecules. Solid state structural studies indicate that 1, 3 and 6 showed relatively weak intermolecular interactions compared to 2 and 4. Aggregation studies of 1, 3 and 6 showed tunable fluorescence via different self-assemblies. 3 also produced fluorescent polymorphs. The stronger intermolecular interactions in 2 and 4 might drive the molecules to adopt a more preferred arrangement whereas weaker interactions provided the opportunity to form different structural assemblies in 1, 3 and 6. Hence, the delicate balance of solvent mixtures and intermolecular interactions leads to a tunable fluorescence.
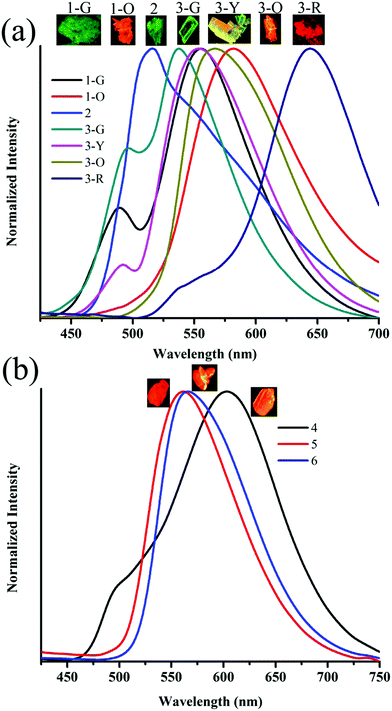 |
| | Fig. 5 Solid state fluorescence spectra of (a) 1–3 and (b) 4–6. Inset shows the digital fluorescence images of crystals. λexc = 365 nm (for digital images) and 370 nm (for spectra). | |
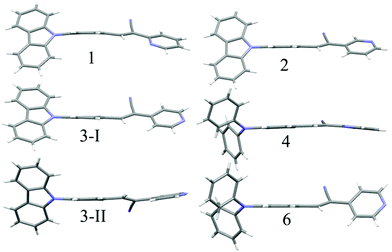 |
| | Fig. 6 Molecular conformation of different isomers in the crystal lattice. C (grey), N (blue) and H (white). | |
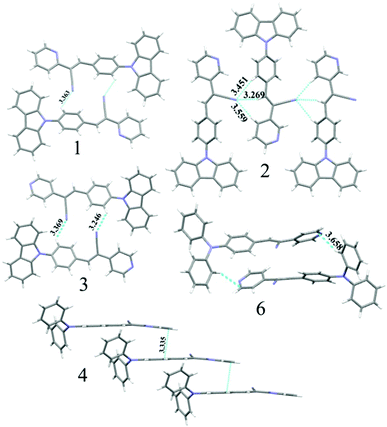 |
| | Fig. 7 Molecular interactions in the crystal lattice of 1–4 and 6. C (grey), N (blue) and H (white). Dotted lines indicate the hydrogen bonding, C–H⋯π and π⋯π interactions in Å. | |
The strong solid state fluorescence with a twisted molecular conformation of 1–6 prompted the exploration of mechanofluorochromism (MFC). Interestingly, carbazole based 1–3 showed clear MFC whereas triphenylamine based 4 and 5 did not show fluorescence modulation (Fig. 8a and Fig. S35–S37, ESI†). But 6 showed fluorescence switching upon crushing and heating (Fig. S38, ESI†). Crystals of 1-G showed two fluorescence peaks at 488 and 540 nm. Crushing showed a significant reduction of fluorescence intensity whereas heating increased the fluorescence intensity of longer wavelength peaks with slight red shifting to 555 nm (Fig. S35a, ESI†). The crystals of 1-O showed fluorescence at 580 nm and blue shifted to 560 nm by slight breaking (Fig. S35b, ESI†).56 Mechanical crushing further blue shifted the fluorescence to 505 nm and heating red shifted it to 558 nm. The blue shifting of 1-O fluorescence upon slight breaking might be attributed to the disruption of long range intermolecular interactions and crystal morphology changes.54,55,57 MFC studies of 2 showed fluorescence switching between 504 and 474 nm upon crushing and heating (Fig. S35c, ESI†). 3-G showed two fluorescence peaks at 490 and 535 nm (Fig. 5). The fluorescence at 490 nm was reduced by crushing whereas the peak at 535 was completely shifted toward 490 nm upon heating (Fig. 8a). Crushing of 3-Y showed a blue shifting of the fluorescence from 560 to 546 nm and heating produced an additional small hump at 488 nm (Fig. S36a, ESI†). Slight breaking of 3-O crystals showed blue shifting of the fluorescence from 580 to 561 nm (Fig. S36b, ESI†). The fluorescence was significantly reduced upon crushing and showed two fluorescence peaks at 486 and 550 nm while heating caused an effect that matched with that on the fluorescence of 3-G after heating. Crushing of 3-R produced a fluorescence similar to 3-G crushed solids and showed an MFC also similar to 3-G (Fig. S36c, ESI†). Heating crystals of 3-O and 3-R also showed blue shifted fluorescence that matched with 3-G (Fig. S39, ESI†). Thus any external disturbances (mechanical or heating) of 3-Y, 3-O and 3-R caused a conversion to 3-G which suggests that the 3-G form might be more stable compared to 3-Y, 3-O and 3-R. Crystals of 6 showed blue shifted fluorescence (565 to 554 nm) by slight breaking/crushing and heating exhibited further blue shifting of the fluorescence to 538 nm (Fig. S38, ESI†). The comparison of molecular conformation in the crystal lattice of 1–6 suggests that the acceptor pyridine unit displayed a twisted conformation in 1–3 and 6 (Fig. 6). The pyridine and phenyl groups showed a coplanar conformation in 4. In general, the twisted molecular conformation adopts a more planar structure upon applying mechanical pressure and partial/complete amorphous phase formation that leads to fluorescence tuning.12–19 The coplanar conformation and parallel arrangement might not undergo further conformational change upon crushing and hence might not be showing fluorescence switching. Further comparison of MFC revealed an unusual blue shifting of fluorescence by crushing of 1 and heating induced red shifting of fluorescence. All other five compounds (2–6) showed red shifting of fluorescence by crushing and blue shifting by heating. The planarization of molecules or amorphous phase formation by mechanical crushing often induced red shifted weak fluorescence due to the formation of low energy species and a nonradiative ‘dark’ state.58–61 Only a few limited molecules showed pressure induced blue shifted fluorescence.62,63 However, the reason for the blue shifting of 1 is not clear at present. It is noted that 1 and 3 showed similar dimer formation but 3 exhibited red shifted fluorescence upon crushing. PXRD studies of 1–3 indicate that the crystalline phase was converted to amorphous/partial amorphous upon crushing and regenerated to crystalline by heating. Hence the reversible phase transformation might be responsible for fluorescence switching (Fig. S40, ESI†).
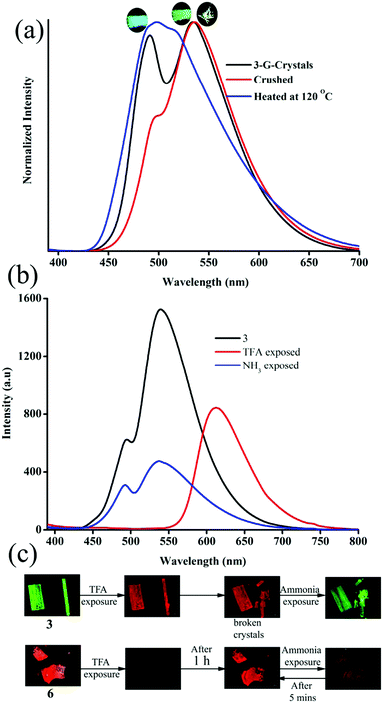 |
| | Fig. 8 (a) Mechanofluorochromism and (b) halochromism of 3-G. (a) Digital images of halochromic fluorescence switching of 3 and 6. λexc = 365 nm (for digital images) and 370 nm (for spectra). | |
The presence of acid responsive pyridine unit was utilized for halochromic fluorescence switching. Exposure of trifluoroacetic acid (TFA) on powdered 3-G showed strongly red shifted fluorescence (610-615 nm) and NH3 exposure reversed to the initial state (Fig. 8b and Fig. S41, S42, ESI†). Similarly 2, 4 and 6 also showed reversible halochromic fluorescence switching upon TFA/NH3 exposure (Fig. S43–S45, ESI†). 5 exhibited off–on fluorescence switching by TFA and NH3 exposure (Fig. S46, ESI†). The reversible halochromic fluorescence switching could be demonstrated for several cycles without significant change of fluorescence (Fig. S47, ESI†). It was observed that 1 and 3 fluorescence self-reversed to the initial state with TFA exposure without NH3 exposure after 1 h (Fig. S48, ESI†). But self-reversible fluorescence switching of 2 was relatively very slow compared to 1 and 3. In contrast, the very weak red shifted fluorescence of 6 after TFA exposure became strong without altering λmax within 1 h (Fig. S49, ESI†). Single crystals of 3-G and 6 also showed clean conversion of fluorescence from green/yellow to red upon TFA exposure (Fig. 8c). NH3 exposure showed a complete reversal of fluorescence. The broken single crystals of 3 with TFA exposure also confirmed transformation of green to red fluorescence. Crystals of 6 TFA exposure initially showed very weak fluorescence but showed strongly enhanced fluorescence after 1 h. 6 self-reversed to red fluorescence in 5 min with ammonia exposure. Thus carbazole based 1–3 showed self-reversed fluorescence switching to the initial state after TFA exposure whereas triphenylamine based 4–6 exhibited more stable red fluorescence with TFA exposure. Halochromic fluorescence switching of 1–6 has been utilized for fabricating rewritable fluorescence platforms. Since all the molecules showed halochromic fluorescence switching, 3 and 6 were chosen to demonstrate rewritable fluorescence platforms. The fluorophore–PMMA polymer composite was prepared by dissolving 3/6 (10−3 M) and PMMA (1 wt%) in toluene. Filter paper coated with 3-PMMA showed a light green colour and writing with TFA showed a dark red colour (Fig. 9a). The written material can be erased immediately using NH3 or it can be self-erased in 30 min. Instead of writing, TFA exposure converted the filter paper to red colour (Fig. S50, ESI†). Further writing with NH3 showed blue fluorescence that slowly disappeared and red paper also slowly converted to blue. The process can be repeated by exposing to TFA again followed by writing. 3-PMMA on a glass plate showed blue fluorescence and converted to red fluorescence upon TFA exposure (Fig. 9b, c and Fig. S51, ESI†). NH3 exposure converted it to blue fluorescence. It is noted that 3-PMMA on a glass plate also showed self-reversibility but took a longer time. Filter paper coated with 6-PMMA showed green fluorescence and TFA exposure converted it to red fluorescence (Fig. 10a). Writing with NH3 showed yellow fluorescence which can self erase or be erased using TFA. The writing can be repeated after self-erasing/TFA erasing. A symbol or letter written on a glass plate using 6-PMMA also exhibited halochromic fluorescence switching (Fig. 10b and Fig. S52, ESI†). The material written on the glass plate showed green fluorescence and TFA exposure showed complete quenching of fluorescence. NH3 exposure regenerated the fluorescence but slowly turned to red. TFA exposed powders of 6 turned to bright red from the completely quenched state in 1 h but a word written on a glass plate using 6-PMMA took nearly 20 days (Fig. 10c and Fig. S53, ESI†). 1-PMMA and 4-PMMA showed weak orange-red fluorescence and NH3 exposure reversed the fluorescence to the initial state (Fig. S54, ESI†). 2-PMMA exhibited bright yellow-green fluorescence after TFA exposure whereas 5-PMMA showed completely quenched fluorescence.
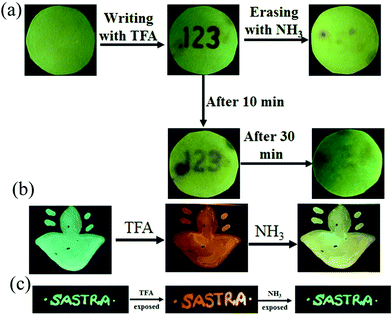 |
| | Fig. 9 Fabricating rewritable/self-erasable fluorescent platforms using 3-PMMA on (a) a filter paper, (b) symbol on a glass plate and (c) word writing on a glass plate (λexc = 365 nm). | |
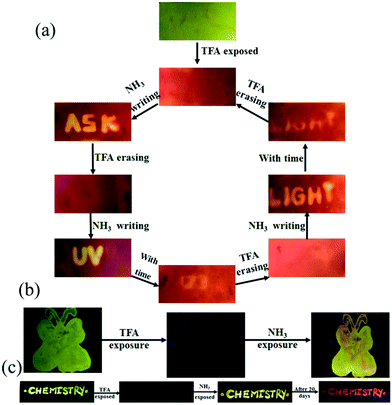 |
| | Fig. 10 Fabricating rewritable/self-erasable fluorescent platforms using 6-PMMA on (a) a filter paper, (b) a symbol on glass plate and (c) word writing on a glass plate (λexc = 365 nm). | |
Conclusions
In summary, pyridine functionalized organic fluorescence molecules with partially planar carbazole and propeller triphenylamine donors (1–6) have been synthesized and demonstrated isomerism/structure controlled molecular self-assembly, tunable fluorescence (514 to 644 nm) and stimuli-responsive fluorescence switching. The position of nitrogen and subtle structural changes strongly influenced the formation of fluorescent polymorphs and self-assembled nano/microstructures with tunable fluorescence. The evolution of intermolecular interactions with time led to the formation of 1D nanowires to nano/micro particles with varying water ratios. The varied molecular assembly showed tunable fluorescence from green to red. The relatively weak intermolecular interactions in the crystal lattice of 1, 3 and 6 facilitated the formation of tunable fluorescent crystals/polymorphs with slight conformational differences and different molecular assemblies. Further MFC of 1–6 also showed isomer dependent reversible fluorescence switching. 1–3 and 6 exhibited crushing/heating induced reversible fluorescence whereas 4 and 5 did not show any MFC that could be attributed to the molecular packing in the crystal lattice. Acid responsive pyridine units have been exploited for demonstrating halochromic fluorescence switching by exposing acid/base and rewritable fluorescent platforms. 3 powder and 3-PMMA polymer thin films showed red shifted fluorescence that is self-reversed to the initial fluorescence state with time or upon NH3 exposure. In contrast, powders of 6 and 6-PMMA thin films produced more stable red shifted fluorescence states after TFA exposure. NH3 exposure switches the fluorescence to the initial state but it self-reverses to the TFA exposed fluorescence state with time. Contrasting halochromic fluorescence switching has been utilized for demonstrating self-erasable and rewritable fluorescent platforms based on filter paper and glass plates.
Conflicts of interest
There are no conflicts to declare.
Acknowledgements
Financial support from the Science and Engineering Research Board (SERB), New Delhi, India (SERB No. EMR/2015/00-1891) is acknowledged with gratitude. The Deanship of scientific research at King Khalid University is greatly appreciated for funding (GRP-180-41). The CRF facility of SASTRA Deemed University is also acknowledged for absorption spectroscopy. X-ray crystallography at the PLS-II 2D-SMC beamline was supported in part by MSIP and POSTECH.
Notes and references
- A. J. C. Kuehne and M. C. Gather, Chem. Rev., 2016, 116, 12823–12864 CrossRef CAS.
- X. Cai and S. J. Su, Adv. Funct. Mater., 2018, 28, 1802558 CrossRef.
- M. A. C. Stuart, W. T. S. Huck, J. Genzer, M. Müller, C. Ober, M. Stamm, G. B. Sukhorukov, I. Szleifer, V. V. Tsukruk, M. Urban, F. Winnik, S. Zauscher, I. Luzinov and S. Minko, Nat. Mater., 2010, 9, 101–113 CrossRef.
- H. Zhou and J. W. Park, Org. Electron., 2015, 24, 272–279 CrossRef CAS.
- W. Lee, D. Kim, S. Lee, J. Park, S. Oh, G. Kim, J. Lim and J. Kim, Nano Today, 2018, 23, 97–123 CrossRef CAS.
- Y. Chen, W. Zhang, Z. Zhao, Y. Cai, J. Gong, R. T. K. Kwok, J. W. Y. Lam, H. H. Y. Sung, I. D. Williams and B. Z. Tang, Angew. Chem., Int. Ed., 2018, 57, 5011–5015 CrossRef CAS.
- Z. Chi, X. Zhang, B. Xu, X. Zhou, C. Ma, Y. Zhang, S. Liu and J. Xu, Chem. Soc. Rev., 2012, 41, 3878–3896 RSC.
- X. Zhang, Z. Chi, Y. Zhang, S. Liu and J. Xu, J. Mater. Chem. C, 2013, 1, 3376 RSC.
- Z. Yang, Z. Chi, Z. Mao, Y. Zhang, S. Liu, J. Zhao, M. P. Aldred and Z. Chi, Mater. Chem. Front., 2018, 2, 861–890 RSC.
- C. Wang and Z. Li, Mater. Chem. Front., 2017, 1, 2174–2194 RSC.
- S. P. Anthony, ChemPlusChem, 2012, 77, 518–531 CrossRef CAS.
- Y. Q. Dong, J. W. Y. Lam and B. Z. Tang, J. Phys. Chem. Lett., 2015, 6, 3429–3436 CrossRef CAS.
- S. J. Yoon, J. W. Chung, J. Gierschner, K. S. Kim, M. G. Choi, D. Kim and S. Y. Park, J. Am. Chem. Soc., 2010, 132, 13675–13683 CrossRef CAS.
- Y. Dong, J. Zhang, X. Tan, L. Wang, J. Chen, B. Li, L. Ye, B. Xu, B. Zou and W. Tian, J. Mater. Chem. C, 2013, 1, 7554 RSC.
- P. S. Hariharan, G. Parthasarathy, A. Kundu, S. Karthikeyan, Y. Sagara, D. Moon and S. P. Anthony, Cryst. Growth Des., 2018, 18, 3971–3979 CrossRef CAS.
- M. Chen, L. Li, H. Nie, J. Tong, L. Yan, B. Xu, J. Z. Sun, W. Tian, Z. Zhao, A. Qin and B. Z. Tang, Chem. Sci., 2015, 6, 1932–1937 RSC.
- Z. Ning, Z. Chen, Q. Zhang, Y. Yan, S. Qian, Y. Cao and H. Tian, Adv. Funct. Mater., 2007, 17, 3799–3807 CrossRef CAS.
- Y. Li, A. Shao, Y. Wang, J. Mei, D. Niu, J. Gu, P. Shi, W. Zhu, H. Tian and J. Shi, Adv. Mater., 2016, 28, 3187–3193 CrossRef CAS.
- P. Gayathri, M. Pannipara, A. G. Al-Sehemi and S. P. Anthony, New J. Chem., 2020, 44, 8680–8696 RSC.
- J. Kunzelman, M. Kinami, B. R. Crenshaw, J. D. Protasiewicz and C. Weder, Adv. Mater., 2008, 20, 119–122 CrossRef CAS.
- H. Ito, M. Muromoto, S. Kurenuma, S. Ishizaka, N. Kitamura, H. Sato and T. Seki, Nat. Commun., 2013, 4, 2009 CrossRef.
- G. Zhang, J. Lu, M. Sabat and C. L. Fraser, J. Am. Chem. Soc., 2010, 132, 2160–2162 CrossRef CAS.
- X. Luo, J. Li, C. Li, L. Heng, Y. Q. Dong, Z. Liu, Z. Bo and B. Z. Tang, Adv. Mater., 2011, 23, 3261–3265 CrossRef CAS.
- Z. Xie, C. Chen, S. Xu, J. Li, Y. Zhang, S. Liu, J. Xu and Z. Chi, Angew. Chem., Int. Ed., 2015, 54, 7181–7184 CrossRef CAS.
- M. Tanioka, S. Kamino, A. Muranaka, Y. Ooyama, H. Ota, Y. Shirasaki, J. Horigome, M. Ueda, M. Uchiyama, D. Sawada and S. Enomoto, J. Am. Chem. Soc., 2015, 137, 6436–6439 CrossRef CAS.
- W. Z. Yuan, Y. Tan, Y. Gong, P. Lu, J. W. Y. Lam, X. Y. Shen, C. Feng, H. H.-Y. Sung, Y. Lu, I. D. Williams, J. Z. Sun, Y. Zhang and B. Z. Tang, Adv. Mater., 2013, 25, 2837–2843 CrossRef CAS.
- Y. Zhang, Q. Song, K. Wang, W. Mao, F. Cao, J. Sun, L. Zhan, Y. Lv, Y. Ma, B. Zou and C. Zhang, J. Mater. Chem. C, 2015, 3, 3049–3054 RSC.
- Q. Wang, S. Li, L. He, Y. Qian, X. Li, W. Sun, M. Liu, J. Li, Y. Li and G. Yang, ChemPhysChem, 2008, 9, 1146–1152 CrossRef CAS.
- Q. Qi, J. Qian, X. Tan, J. Zhang, L. Wang, B. Xu, B. Zou and W. Tian, Adv. Funct. Mater., 2015, 25, 4005–4010 CrossRef CAS.
- B. Huang, D. Jiang, Y. Feng, W. C. Chen, Y. Zhang, C. Cao, D. Shen, Y. Ji, C. Wang and C. S. Lee, J. Mater. Chem. C, 2019, 7, 9808–9812 RSC.
- P. S. Hariharan, V. K. Prasad, S. Nandi, A. Anoop, D. Moon and S. P. Anthony, Cryst. Growth Des., 2017, 17, 146–155 CrossRef CAS.
- K. Wang, H. Xiao, L. Qian, M. Han, X. Wu, Z. Guo and H. Zhan, CrystEngComm, 2020, 22, 2166–2172 RSC.
- H. Liu, Y. Shen, Y. Yan, C. Zhou, S. Zhang, B. Li, L. Ye and B. Yang, Adv. Funct. Mater., 2019, 29, 1901895 CrossRef.
- H. Liu, Y. Gu, Y. Dai, K. Wang, S. Zhang, G. Chen, B. Zou and B. Yang, J. Am. Chem. Soc., 2020, 142, 1153–1158 CrossRef CAS.
- Y. Gu, K. Wang, Y. Dai, G. Xiao, Y. Ma, Y. Qiao and B. Zou, J. Phys. Chem. Lett., 2017, 8, 4191–4196 CrossRef CAS.
- Y. Gu, H. Liu, R. Qiu, Z. Liu, C. Wang, T. Katsura, H. Zhang, M. Wu, M. Yao, H. Zheng, K. Li, Y. Wang, K. Wang, B. Yang, Y. Ma and B. Zou, J. Phys. Chem. Lett., 2019, 10, 5557–5562 CrossRef CAS.
- P. S. Hariharan, C. Pan, S. Karthikeyan, D. Xie, A. Shinohara, C. Yang, L. Wang and S. P. Anthony, Dyes Pigm., 2020, 174, 108067 CrossRef CAS.
- H. W. Zheng, S. Li, M. Wu, Y. Kang, J. B. Li, Q. F. Liang, X. J. Zheng, D. C. Fang and L. P. Jin, J. Mater. Chem. C, 2020, 8, 4246–4252 RSC.
- F. Liu, J. Tu, X. Wang, J. Wang, Y. Gong, M. Han, X. Dang, Q. Liao, Q. Peng, Q. Li and Z. Li, Chem. Commun., 2018, 54, 5598–5601 RSC.
- M. Ikeya, G. Katada and S. Ito, Chem. Commun., 2019, 55, 12296–12299 RSC.
- P. S. Hariharan, D. Moon and S. P. Anthony, CrystEngComm, 2017, 19, 6489–6497 RSC.
- P. S. Hariharan, P. Gayathri, D. Moon and S. P. Anthony, ChemistrySelect, 2017, 2, 7799–7807 CrossRef CAS.
- A. Li, N. Chu, J. Liu, H. Liu, J. Wang, S. Xu, H. Cui, H. Zhang, W. Xu and Z. Ma, Mater. Chem. Front., 2019, 3, 2768–2774 RSC.
- M. Kondo, T. Yamoto, S. Miura, M. Hashimoto, C. Kitamura and N. Kawatsuki, Chem. – Asian J., 2019, 14, 471–479 CrossRef CAS.
- P. Xue, P. Chen, J. Jia, Q. Xu, J. Sun, B. Yao, Z. Zhang and R. Lu, Chem. Commun., 2014, 50, 2569–2571 RSC.
- Y. I. Park, O. Postupna, A. Zhugayevych, H. Shin, Y. S. Park, B. Kim, H. J. Yen, P. Cheruku, J. S. Martinez, J. W. Park, S. Tretiak and H. L. Wang, Chem. Sci., 2015, 6, 789–797 RSC.
- S. Ito, C. Nishimoto and S. Nagai, CrystEngComm, 2019, 21, 5699–5706 RSC.
- J. Xiong, K. Wang, Z. Yao, B. Zou, J. Xu and X. H. Bu, ACS Appl. Mater. Interfaces, 2018, 10, 5819–5827 CrossRef CAS.
- P. S. Hariharan, E. M. Mothi, D. Moon and S. P. Anthony, ACS Appl. Mater. Interfaces, 2016, 8, 33034–33042 CrossRef CAS.
- H. Shi, J. Yuan, X. Wu, X. Dong, L. Fang, Y. Miao, H. Wang and F. Cheng, New J. Chem., 2014, 38, 2368–2378 RSC.
- Y. Li, L. Xue, H. Xia, B. Xu, S. Wen and W. Tian, J. Polym. Sci., Part A: Polym. Chem., 2008, 46, 3970–3984 CrossRef CAS.
- P. S. Hariharan, N. S. Venkatraman, D. Moon and S. P. Anthony, J. Phys. Chem. C, 2015, 119(17), 9460 CrossRef CAS.
- A. Patra, N. Hebalkar, B. Sreedhar, M. Sarkar, A. Samanta and T. P. Radhakrishnan, Small, 2006, 2, 650–659 CrossRef CAS.
- M. Abyan, D. de Caro and S. Fery-Forgues, Langmuir, 2009, 25, 1651 CrossRef CAS.
- C. Carayon, A. Ghodbane, N. Leygue, J. Wang, N. Saffon-Merceron, R. Brown and S. Fery-Forgues, ChemPhotoChem, 2019, 3, 545 CrossRef CAS.
- P. S. Hariharan, D. Moon and S. P. Anthony, J. Mater. Chem. C, 2015, 3, 8381–8388 RSC.
- P. Gayathri, S. Karthikeyan, M. Pannipara, A. G. Al-Sehemi, D. Moon and S. P. Anthony, CrystEngComm, 2019, 21, 6604 RSC.
- Y. Dong, B. Xu, J. Zhang, X. Tan, L. Wang, J. Chen, H. Lv, S. Wen, B. Li, L. Ye, B. Zou and W. Tian, Angew. Chem., Int. Ed., 2012, 51, 10782–10785 CrossRef CAS.
- K. Nagura, S. Saito, H. Yusa, H. Yamawaki, H. Fujihisa, H. Sato, Y. Shimoikeda and S. Yamaguchi, J. Am. Chem. Soc., 2013, 135, 10322–10325 CrossRef CAS.
- H. Yuan, K. Wang, K. Yang, B. Liu and B. Zou, J. Phys. Chem. Lett., 2014, 5, 2968–2973 CrossRef CAS.
- S. Zhang, Y. Dai, S. Luo, Y. Gao, N. Gao, K. Wang, B. Zou, B. Yang and Y. Ma, Adv. Funct. Mater., 2017, 27, 1602276 CrossRef.
- Z. Wang, Z. Ma, Y. Wang, Z. Xu, Y. Luo, Y. Wei and X. Jia, Adv. Mater., 2015, 27, 6469–6474 CrossRef CAS.
- S. Lu, G. Xiao, L. Sui, T. Feng, X. Yong, S. Zhu, B. Li, Z. Liu, B. Zou, M. Jin, J. S. Tse, H. Yan and B. Yang, Angew. Chem., Int. Ed., 2017, 56, 6187–6191 CrossRef CAS.
Footnote |
| † Electronic supplementary information (ESI) available: NMR, mass, absorption, fluorescence spectra and PXRD, single crystal structural packing, digital images. CCDC 2027366–2027372. For ESI and crystallographic data in CIF or other electronic format see DOI: 10.1039/d0ma00736f |
|
| This journal is © The Royal Society of Chemistry 2021 |
Click here to see how this site uses Cookies. View our privacy policy here.  Open Access Article
 *d and
Savarimuthu Philip
Anthony
 *a
*a
![[triple bond, length as m-dash]](https://www.rsc.org/images/entities/char_e002.gif) N), 1591 (aromatic C
N), 1591 (aromatic C![[double bond, length as m-dash]](https://www.rsc.org/images/entities/char_e001.gif) C), 1450 (C–H double bond), 745 (CH). 1H NMR (300 MHz, CDCl3) δ 8.69–8.67 (d, 1H), 8.59 (s, 1H), 8.26–8.23 (d, 2H), 8.16–8.13 (d, 2H), 7.86–7.82 (m, 2H), 7.80–7.72 (d, 2H), 7.55–7.47 (d, 2H), 7.46–7.41 (m, 2H), 7.35–7.29 (m, 3H). 13C NMR (75 MHz, CDCl3) δ 150.94, 149.75, 143.87, 140.26, 140.20, 137.52, 131.96, 131.58, 126.90, 126.23, 123.83, 123.71, 121.45, 120.59, 120.47, 117.88, 110.38, 109.92. C26H17N3 (371.14): calculated. C 84.07, H 4.61, N 11.31; found C 84.16, H 4.66, N 11.12. m/z calculated for C26H17N3 (M + H): 371.14, found: 371.2.
C), 1450 (C–H double bond), 745 (CH). 1H NMR (300 MHz, CDCl3) δ 8.69–8.67 (d, 1H), 8.59 (s, 1H), 8.26–8.23 (d, 2H), 8.16–8.13 (d, 2H), 7.86–7.82 (m, 2H), 7.80–7.72 (d, 2H), 7.55–7.47 (d, 2H), 7.46–7.41 (m, 2H), 7.35–7.29 (m, 3H). 13C NMR (75 MHz, CDCl3) δ 150.94, 149.75, 143.87, 140.26, 140.20, 137.52, 131.96, 131.58, 126.90, 126.23, 123.83, 123.71, 121.45, 120.59, 120.47, 117.88, 110.38, 109.92. C26H17N3 (371.14): calculated. C 84.07, H 4.61, N 11.31; found C 84.16, H 4.66, N 11.12. m/z calculated for C26H17N3 (M + H): 371.14, found: 371.2.
![[triple bond, length as m-dash]](https://www.rsc.org/images/entities/char_e002.gif) N), 1595 (aromatic C
N), 1595 (aromatic C![[double bond, length as m-dash]](https://www.rsc.org/images/entities/char_e001.gif) C), 1449 (C–H double bond), 748 (CH). 1H NMR (300 MHz, CDCl3) δ 8.99 (s, 1H), 8.68–8.67 (d, 1H), 8.18–8.14 (t, 4H), 8.03–8.01 (d, 1H), 7.76–7.74 (d, 2H), 7.67 (s, 1H), 7.53–7.51 (d, 2H), 7.46–7.42 (m, 3H), 7.34–7.31 (s, 2H). 13C NMR (75 MHz, CDCl3) δ 150.22, 147.06, 142.52, 140.26, 140.23, 133.57, 131.75, 131.10, 130.52, 127.01, 126.25, 123.84, 123.76, 120.65, 120.50, 117.25, 109.82, 108.75. C26H17N3 (371.14): calculated. C 84.07, H 4.61, N 11.31; found C 84.12, H 4.51, N 11.22. m/z calculated for C26H17N3 (M + H): 371.14, found: 371.2.
C), 1449 (C–H double bond), 748 (CH). 1H NMR (300 MHz, CDCl3) δ 8.99 (s, 1H), 8.68–8.67 (d, 1H), 8.18–8.14 (t, 4H), 8.03–8.01 (d, 1H), 7.76–7.74 (d, 2H), 7.67 (s, 1H), 7.53–7.51 (d, 2H), 7.46–7.42 (m, 3H), 7.34–7.31 (s, 2H). 13C NMR (75 MHz, CDCl3) δ 150.22, 147.06, 142.52, 140.26, 140.23, 133.57, 131.75, 131.10, 130.52, 127.01, 126.25, 123.84, 123.76, 120.65, 120.50, 117.25, 109.82, 108.75. C26H17N3 (371.14): calculated. C 84.07, H 4.61, N 11.31; found C 84.12, H 4.51, N 11.22. m/z calculated for C26H17N3 (M + H): 371.14, found: 371.2.
![[triple bond, length as m-dash]](https://www.rsc.org/images/entities/char_e002.gif) N), 1592 (aromatic C
N), 1592 (aromatic C![[double bond, length as m-dash]](https://www.rsc.org/images/entities/char_e001.gif) C), 1450 (C–H double bond), 752 (CH). 1H NMR (300 MHz, CDCl3) δ 8.75–8.73 (dd, 2H), 8.21–8.18 (d, 2H), 8.17–8.14 (d, 2H), 7.81–7.75 (m, 3H), 7.63–7.61 (m, 2H), 7.54–7.51 (d, 2H), 7.47–7.42 (m, 2H), 7.36–7.25 (m, 2H). 13C NMR (75 MHz, CDCl3) δ 150.75, 143.79, 141.65, 140.74, 140.15, 131.45, 131.28, 126.99, 126.28, 123.91, 120.74, 120.53, 119.98, 116.97, 109.82, 109.50. C26H17N3 (371.14): calculated. C 84.07, H 4.61, N 11.31; found C 84.20, H 4.58, N 11.42. m/z calculated for C26H17N3 (M + H): 371.14, found: 371.2.
C), 1450 (C–H double bond), 752 (CH). 1H NMR (300 MHz, CDCl3) δ 8.75–8.73 (dd, 2H), 8.21–8.18 (d, 2H), 8.17–8.14 (d, 2H), 7.81–7.75 (m, 3H), 7.63–7.61 (m, 2H), 7.54–7.51 (d, 2H), 7.47–7.42 (m, 2H), 7.36–7.25 (m, 2H). 13C NMR (75 MHz, CDCl3) δ 150.75, 143.79, 141.65, 140.74, 140.15, 131.45, 131.28, 126.99, 126.28, 123.91, 120.74, 120.53, 119.98, 116.97, 109.82, 109.50. C26H17N3 (371.14): calculated. C 84.07, H 4.61, N 11.31; found C 84.20, H 4.58, N 11.42. m/z calculated for C26H17N3 (M + H): 371.14, found: 371.2.
![[triple bond, length as m-dash]](https://www.rsc.org/images/entities/char_e002.gif) N), 1581 (aromatic C
N), 1581 (aromatic C![[double bond, length as m-dash]](https://www.rsc.org/images/entities/char_e001.gif) C), 1491 (C–H double bond), 697 (CH). 1H NMR (300 MHz, CDCl3) δ 8.61–8.60 (d, 1H), 8.35 (s, 1H), 7.88–7.77 (d, 2H), 7.75–7.70 (m, 2H), 7.34–7.30 (t, 4H), 7.22–7.21 (m, 1H), 7.18–7.16 (m, 5H), 7.13–7.12 (m, 1H), 7.05–7.03 (d, 2H). 13C NMR (75 MHz, CDCl3) δ 151.84, 150.56, 149.50, 146.44, 144.51, 137.29, 131.57, 129.63, 125.95, 125.84, 124.63, 122.79, 120.86, 120.41, 118.74, 105.89. C26H17N3 (373.16): calculated. C 83.62, H 5.13, N 11.25; found C 83.43, H 5.01, N 11.22. m/z calculated for C26H19N3 (M + H): 373.16, found: 373.3.
C), 1491 (C–H double bond), 697 (CH). 1H NMR (300 MHz, CDCl3) δ 8.61–8.60 (d, 1H), 8.35 (s, 1H), 7.88–7.77 (d, 2H), 7.75–7.70 (m, 2H), 7.34–7.30 (t, 4H), 7.22–7.21 (m, 1H), 7.18–7.16 (m, 5H), 7.13–7.12 (m, 1H), 7.05–7.03 (d, 2H). 13C NMR (75 MHz, CDCl3) δ 151.84, 150.56, 149.50, 146.44, 144.51, 137.29, 131.57, 129.63, 125.95, 125.84, 124.63, 122.79, 120.86, 120.41, 118.74, 105.89. C26H17N3 (373.16): calculated. C 83.62, H 5.13, N 11.25; found C 83.43, H 5.01, N 11.22. m/z calculated for C26H19N3 (M + H): 373.16, found: 373.3.
![[triple bond, length as m-dash]](https://www.rsc.org/images/entities/char_e002.gif) N), 1579 (aromatic C
N), 1579 (aromatic C![[double bond, length as m-dash]](https://www.rsc.org/images/entities/char_e001.gif) C), 1488 (C–H double bond), 756 (CH). 1H NMR (300 MHz, CDCl3) δ 8.59 (s, 1H), 8.06–8.04 (d, 1H), 7.82–7.80 (d, 1H), 7.52–7.49 (d, 2H), 7.48–7.46 (d, 1H), 7.35–7.33 (m, 1H), 7.32 (m, 4H), 7.18–7.16 (m, 6H), 7.05–7.03 (d, 2H). 13C NMR (75 MHz, CDCl3) δ 151.86, 150.57, 149.49, 146.45, 144.53, 137.27, 131.55, 129.61, 125.94, 124.62, 122.77, 120.85, 120.41, 118.70, 105.92. C26H17N3 (373.16): calculated. C 83.62, H 5.13, N 11.25; found C 83.68, H 5.22, N 11.17. m/z calculated for C26H19N3 (M + H): 373.16, found: 373.2.
C), 1488 (C–H double bond), 756 (CH). 1H NMR (300 MHz, CDCl3) δ 8.59 (s, 1H), 8.06–8.04 (d, 1H), 7.82–7.80 (d, 1H), 7.52–7.49 (d, 2H), 7.48–7.46 (d, 1H), 7.35–7.33 (m, 1H), 7.32 (m, 4H), 7.18–7.16 (m, 6H), 7.05–7.03 (d, 2H). 13C NMR (75 MHz, CDCl3) δ 151.86, 150.57, 149.49, 146.45, 144.53, 137.27, 131.55, 129.61, 125.94, 124.62, 122.77, 120.85, 120.41, 118.70, 105.92. C26H17N3 (373.16): calculated. C 83.62, H 5.13, N 11.25; found C 83.68, H 5.22, N 11.17. m/z calculated for C26H19N3 (M + H): 373.16, found: 373.2.
![[triple bond, length as m-dash]](https://www.rsc.org/images/entities/char_e002.gif) N), 1578 (aromatic C
N), 1578 (aromatic C![[double bond, length as m-dash]](https://www.rsc.org/images/entities/char_e001.gif) C), 1487 (C–H double bond), 698 (CH). 1H NMR (300 MHz, CDCl3) δ 8.64 (s, 2H), 7.83–7.81 (d, 2H), 7.59–7.52 (s,1H), 7.36–7.32 (d, 2H), 7.29–7.27 (m, 4H), 7.18–7.14 (m, 6H), 7.12–7.03 (d, 2H). 13C NMR (75 MHz, CDCl3) δ 151.02, 150.46, 146.20, 144.34, 142.54, 131.49, 129.71, 129.66, 126.09, 125.07, 124.94, 120.11, 119.60, 117.84, 104.38. C26H17N3 (373.16): calculated. C 83.62, H 5.13, N 11.25; found C 83.68, H 5.24, N 11.12. m/z calculated for C26H19N3 (M + H): 373.16, found: 373.2.
C), 1487 (C–H double bond), 698 (CH). 1H NMR (300 MHz, CDCl3) δ 8.64 (s, 2H), 7.83–7.81 (d, 2H), 7.59–7.52 (s,1H), 7.36–7.32 (d, 2H), 7.29–7.27 (m, 4H), 7.18–7.14 (m, 6H), 7.12–7.03 (d, 2H). 13C NMR (75 MHz, CDCl3) δ 151.02, 150.46, 146.20, 144.34, 142.54, 131.49, 129.71, 129.66, 126.09, 125.07, 124.94, 120.11, 119.60, 117.84, 104.38. C26H17N3 (373.16): calculated. C 83.62, H 5.13, N 11.25; found C 83.68, H 5.24, N 11.12. m/z calculated for C26H19N3 (M + H): 373.16, found: 373.2.


![[thin space (1/6-em)]](https://www.rsc.org/images/entities/char_2009.gif) :
:![[thin space (1/6-em)]](https://www.rsc.org/images/entities/char_2009.gif) 1), respectively. But 2 produced only green fluorescent crystals (Fig. 5a). 3 produced green (3-G), yellow (3-Y), orange (3-O) and red (3-R) fluorescent crystals from CHCl3
1), respectively. But 2 produced only green fluorescent crystals (Fig. 5a). 3 produced green (3-G), yellow (3-Y), orange (3-O) and red (3-R) fluorescent crystals from CHCl3![[thin space (1/6-em)]](https://www.rsc.org/images/entities/char_2009.gif) :
:![[thin space (1/6-em)]](https://www.rsc.org/images/entities/char_2009.gif) CH3OH (1
CH3OH (1![[thin space (1/6-em)]](https://www.rsc.org/images/entities/char_2009.gif) :
:![[thin space (1/6-em)]](https://www.rsc.org/images/entities/char_2009.gif) 1), CHCl3
1), CHCl3![[thin space (1/6-em)]](https://www.rsc.org/images/entities/char_2009.gif) :
:![[thin space (1/6-em)]](https://www.rsc.org/images/entities/char_2009.gif) hexane (1
hexane (1![[thin space (1/6-em)]](https://www.rsc.org/images/entities/char_2009.gif) :
:![[thin space (1/6-em)]](https://www.rsc.org/images/entities/char_2009.gif) 1), CHCl3
1), CHCl3![[thin space (1/6-em)]](https://www.rsc.org/images/entities/char_2009.gif) :
:![[thin space (1/6-em)]](https://www.rsc.org/images/entities/char_2009.gif) CH3OH (3
CH3OH (3![[thin space (1/6-em)]](https://www.rsc.org/images/entities/char_2009.gif) :
:![[thin space (1/6-em)]](https://www.rsc.org/images/entities/char_2009.gif) 1) and CHCl3
1) and CHCl3![[thin space (1/6-em)]](https://www.rsc.org/images/entities/char_2009.gif) :
:![[thin space (1/6-em)]](https://www.rsc.org/images/entities/char_2009.gif) hexane (diffusion), respectively (Fig. 5a). This resulted in tunable solid state fluorescence between 516 and 645 nm (Fig. 5a). In contrast, 4–6 did not produce any fluorescent polymorphs and exhibited only isomerism dependent fluorescence tuning (Fig. 5b). 4 showed solid state fluorescence at 603 nm whereas 5 and 6 showed fluorescence at 561 and 566 nm, respectively (Fig. 5b). The appearance of double fluorescence peaks in 1-G, 3-G and 3-Y might be attributed to the lack of electronic communication between donor (carbazole) and acceptor units (cyanostilbene) and exhibiting fluorescence from carbazole and cyanostilbene units separately. Single crystal structural analysis has been performed to gain insight into fluorescence tuning (Tables S3–S9, ESI†). Structural analysis showed that the molecules adopted a twisted conformation in the crystal lattice (Fig. 6 and Table S2, ESI†). 1-G and 1-O showed similar conformation with only a slight conformational twist difference in the crystal lattice (Table S2 and Fig. S26, ESI†). Molecules displayed similar packing and intermolecular interactions. Simulated PXRD of 1-G and 1-O also perfectly matched each other (Fig. S27, ESI†). 1-G showed dimer formation with opposite molecular arrangement via weak intermolecular interactions between cyano nitrogen and phenyl hydrogen (Fig. 7). 2 showed multiple intermolecular interactions; dimer formation with opposite molecular arrangement via hydrogen bonding between cyano nitrogen and phenyl/pyridine hydrogen and C–H⋯π interactions between carbazole and pyridine hydrogen (Fig. 7 and Fig. S28, ESI†). Only crystals of green and yellow forms of 3 were of good quality to solve the structure. Similar to 1, 3-G and 3-Y also differed only slightly in the conformational twist and displayed similar intermolecular interactions and packing (Fig. S29, S30 and Tables S2, S6, S7, ESI†). The intermolecular interaction between cyano nitrogen and phenyl hydrogen produced dimers with opposite molecular arrangements (Fig. 7). The asymmetric unit of 3-G/3-Y contained two molecules with different conformations (Fig. S31, ESI†). Simulated and experimental PXRD of 3-G and 3-Y also matched perfectly (Fig. S32 and S33, ESI†). However, 3-O and 3-R showed different PXRD patterns and confirmed the polymorphism (Fig. S33, ESI†). Thus the fluorescence tuning of 1-G and 1-O, and 3-G and 3-Y is attributed to crystal habits or morphology differences.55 But 3-O and 3-R are fluorescent polymorphs. 4 showed a parallel arrangement of molecules in the crystal lattice via π⋯π interactions between pyridine and phenyl group (Fig. 7 and Fig. S34, ESI†). 6 showed dimer formation with opposite molecular arrangement via weak C–H⋯π interactions (Fig. 7). The crystal quality of 5 was very poor and the structure could not be solved. The fluorescence of 4 is strongly red shifted compared to 5 and 6 due to the formation of a parallel arrangement of molecules. Solid state structural studies indicate that 1, 3 and 6 showed relatively weak intermolecular interactions compared to 2 and 4. Aggregation studies of 1, 3 and 6 showed tunable fluorescence via different self-assemblies. 3 also produced fluorescent polymorphs. The stronger intermolecular interactions in 2 and 4 might drive the molecules to adopt a more preferred arrangement whereas weaker interactions provided the opportunity to form different structural assemblies in 1, 3 and 6. Hence, the delicate balance of solvent mixtures and intermolecular interactions leads to a tunable fluorescence.
hexane (diffusion), respectively (Fig. 5a). This resulted in tunable solid state fluorescence between 516 and 645 nm (Fig. 5a). In contrast, 4–6 did not produce any fluorescent polymorphs and exhibited only isomerism dependent fluorescence tuning (Fig. 5b). 4 showed solid state fluorescence at 603 nm whereas 5 and 6 showed fluorescence at 561 and 566 nm, respectively (Fig. 5b). The appearance of double fluorescence peaks in 1-G, 3-G and 3-Y might be attributed to the lack of electronic communication between donor (carbazole) and acceptor units (cyanostilbene) and exhibiting fluorescence from carbazole and cyanostilbene units separately. Single crystal structural analysis has been performed to gain insight into fluorescence tuning (Tables S3–S9, ESI†). Structural analysis showed that the molecules adopted a twisted conformation in the crystal lattice (Fig. 6 and Table S2, ESI†). 1-G and 1-O showed similar conformation with only a slight conformational twist difference in the crystal lattice (Table S2 and Fig. S26, ESI†). Molecules displayed similar packing and intermolecular interactions. Simulated PXRD of 1-G and 1-O also perfectly matched each other (Fig. S27, ESI†). 1-G showed dimer formation with opposite molecular arrangement via weak intermolecular interactions between cyano nitrogen and phenyl hydrogen (Fig. 7). 2 showed multiple intermolecular interactions; dimer formation with opposite molecular arrangement via hydrogen bonding between cyano nitrogen and phenyl/pyridine hydrogen and C–H⋯π interactions between carbazole and pyridine hydrogen (Fig. 7 and Fig. S28, ESI†). Only crystals of green and yellow forms of 3 were of good quality to solve the structure. Similar to 1, 3-G and 3-Y also differed only slightly in the conformational twist and displayed similar intermolecular interactions and packing (Fig. S29, S30 and Tables S2, S6, S7, ESI†). The intermolecular interaction between cyano nitrogen and phenyl hydrogen produced dimers with opposite molecular arrangements (Fig. 7). The asymmetric unit of 3-G/3-Y contained two molecules with different conformations (Fig. S31, ESI†). Simulated and experimental PXRD of 3-G and 3-Y also matched perfectly (Fig. S32 and S33, ESI†). However, 3-O and 3-R showed different PXRD patterns and confirmed the polymorphism (Fig. S33, ESI†). Thus the fluorescence tuning of 1-G and 1-O, and 3-G and 3-Y is attributed to crystal habits or morphology differences.55 But 3-O and 3-R are fluorescent polymorphs. 4 showed a parallel arrangement of molecules in the crystal lattice via π⋯π interactions between pyridine and phenyl group (Fig. 7 and Fig. S34, ESI†). 6 showed dimer formation with opposite molecular arrangement via weak C–H⋯π interactions (Fig. 7). The crystal quality of 5 was very poor and the structure could not be solved. The fluorescence of 4 is strongly red shifted compared to 5 and 6 due to the formation of a parallel arrangement of molecules. Solid state structural studies indicate that 1, 3 and 6 showed relatively weak intermolecular interactions compared to 2 and 4. Aggregation studies of 1, 3 and 6 showed tunable fluorescence via different self-assemblies. 3 also produced fluorescent polymorphs. The stronger intermolecular interactions in 2 and 4 might drive the molecules to adopt a more preferred arrangement whereas weaker interactions provided the opportunity to form different structural assemblies in 1, 3 and 6. Hence, the delicate balance of solvent mixtures and intermolecular interactions leads to a tunable fluorescence.


