Mechanistic insights into carbon dioxide utilization by superoxide ion generated electrochemically in ionic liquid electrolyte†
Ahmed
Halilu
 ab,
Maan
Hayyan
 *bc,
Mohamed Kheireddine
Aroua
 *de,
Rozita
Yusoff
 *a and
Hanee F.
Hizaddin
 ab
ab
aDepartment of Chemical Engineering, University of Malaya, Kuala Lumpur, 50603, Malaysia. E-mail: ryusoff@um.edu.my
bUniversity of Malaya Centre for Ionic Liquids (UMCiL), University of Malaya, Kuala Lumpur 50603, Malaysia. E-mail: maan_hayyan@yahoo.com
cChemical Engineering Program, Faculty of Engineering and Technology, Muscat University, P. O. Box 550, Muscat, P.C. 130, Oman
dCentre for Carbon Dioxide Capture and Utilization (CCDCU), School of Engineering and Technology, Sunway University, Bandar Sunway, 47500 Petaling Jaya, Malaysia. E-mail: kheireddinea@sunway.edu.my
eDepartment of Engineering, Lancaster University, Lancaster, LA1 4YW, UK
First published on 8th December 2020
Abstract
Understanding the reaction mechanism that controls the one-electron electrochemical reduction of oxygen is essential for sustainable use of the superoxide ion (O2˙−) during CO2 conversion. Here, stable generation of O2˙− in butyltrimethylammonium bis(trifluoromethylsulfonyl)imide [BMAmm+][TFSI−] ionic liquid (IL) was first detected at −0.823 V vs. Ag/AgCl using cyclic voltammetry (CV). The charge transfer coefficient associated with the process was ∼0.503. It was determined that [BMAmm+][TFSI−] is a task-specific IL with a large negative isovalue surface density accrued from the [BMAmm+] cation with negatively charged C(sp2) and C(sp3). Consequently, [BMAmm+][TFSI−] is less susceptible to the nucleophilic effect of O2˙− because only 8.4% O2˙− decay was recorded from 3 h long-term stability analysis. The CV analysis also detected that O2˙− mediated CO2 conversion in [BMAmm+][TFSI−] at −0.806 V vs. Ag/AgCl as seen by the disappearance of the oxidative faradaic current of O2˙−. Electrochemical impedance spectroscopy (EIS) detected the mechanism of O2˙− generation and CO2 conversion in [BMAmm+][TFSI−] for the first time. The EIS parameters in O2 saturated [BMAmm+][TFSI−] were different from those detected in O2/CO2 saturated [BMAmm+][TFSI−] or CO2 saturated [BMAmm+][TFSI−]. This was rationalized to be due to the formation of a [BMAmm+][TFSI−] film on the GC electrode, creating a 2.031 × 10⁻⁹ μF cm−2 double-layer capacitance (CDL). Therefore, during the O2˙− generation and CO2 utilization in [BMAmm+][TFSI−], the CDL increased to 5.897 μF cm−2 and 7.763 μF cm−2, respectively. The CO2 in [BMAmm+][TFSI−] was found to be highly unlikely to be electrochemically converted due to the high charge transfer resistance of 6.86 × 10¹⁸ kΩ. Subsequently, O2˙− directly mediated the CO2 conversion through a nucleophilic addition reaction pathway. These results offer new and sustainable opportunities for utilizing CO2 by reactive oxygen species in ionic liquid media.
1. Introduction
The global abundance of CO2 is estimated to be more than 550 ppm in the next 3–8 decades mainly due to the high levels of anthropogenic activities.1 As of 2020, the amount of CO2 in the atmosphere is 420 ppm and this can disrupt the conventional climate cycle, thereby increasing the chance of harsh weather.2 To combat this deviation from the 350 ppm equilibrium threshold of global CO2 levels, international and governmental agencies have agreed to cut down 90% of global CO2 emission through capture and utilization techniques.3,4 The utilization of CO2 entails a strategic change in its chemical stability ( ), with the resultant formation of the desired product.5 Also, sucking one ton of CO2 directly from the atmosphere as a capture technique costs about $94–232.6 This indicates that CO2 is apparently a relatively inexpensive C-1 feedstock for the synthesis of a variety of commodity chemical products.
In the utilization of CO2, the main focus is on the alteration of the 4+ oxidation state of C(sp). Accordingly, many catalytic conversions of CO2 into fuels and drop-in fuels, such as electrochemical,7 thermochemical,8 and photochemical9 means, have been investigated. Further utilization of CO2 as a cheap C-1 feedstock has been reported to produce carbon nanotubes (CNTs) as a 100-fold cheaper option than the conventional chemical vapor deposition.10–12 Other electrochemical CO2 utilization techniques largely produce oxocarbons.13–15 Recently, we reported the production of peroxydicarbonate (C2O62−) as an oxocarbon which serves as a carboxylating agent.16 Quantum chemical computations were employed to gain insights toward the most probable interactions of the molecules mediated by superoxide ion (O2˙−), and the subsequent formation of C2O62−. To support possible scale-up, understanding the mechanism that governs the process of CO2 conversion either to oxocarbons, fuels or commodity chemicals is mandatory. In general accounts regarding CO2 utilization by O2˙− or any conventional means, this is a major drawback that could limit CO2 conversion. Especially when using O2˙− to promote CO2 conversion, a medium that could capture CO2 and sustainably retain O2˙− for utilization is desired. Due to the intriguing properties of ionic liquids (ILs) such as the large electrochemical potential window, high ionic conductivity, strong thermal and chemical stability, and low vapour pressure, they have been used to capture CO2 during electrochemical conversion.17–21 In addition, the solubility of CO2 and O2 in ILs is high.22–24 These IL properties facilitate direct electrochemical conversion of O2 and CO2 even under ambient conditions.16,25–27 Also, ILs are suitable media for generation of O2˙− mainly due to their capacity to hold radicals for a sustained period of time.16,28–35 The kinetics of O2˙− in ILs fall in the range of ∼10−5 to 10−3 s−1, indicating that O2˙− can exhibit noticeable long-term stability.31,36–38 The composition of ILs also plays a primary role. For instance, it was reported that imidazolium-based ILs react with O2˙− to produce the corresponding 2-imidazolones.35,39,40 This is an indication that the electrochemistry of O2 to generate and implement O2˙− is strongly influenced by the nature of the IL-cation.41
Ammonium based ILs are renown to be stable to nucleophilic attack by O2˙− unlike imidazolium-based ILs.31 It was found that the C(sp) in the trimethyl-n-hexylammonium [TMHAmm+] cation is negative, while the carbons at the 2-, 4- and 5-positions in 1-ethyl-3-methylimidazolium [EMIm+], and 1,2-dimethyl-3-propylimidazolium [DMPIm+] are positive.42–44 In principle, negatively charged atoms are less susceptible to the nucleophilic influence of O2˙−, unlike positively charged atoms.45 Stable ILs are required in the promotion of O2˙− driven catalysis, particularly for CO2 conversion.16,29 Most CO2 conversions mediated by O2˙−, especially in ILs, are limited by the need of unravelling the mechanism of the process.29 Therefore, this is an inherent challenge that needs to be addressed.46
This work is a major advance of our earlier study, which centred on the use of COSMO-RS and Gaussian calculations to unravel the fundamental mechanistic understanding of the transformation of CO2 by electro-generated O2˙− to produce C2O62−.16 The experimental electrochemical impedance spectroscopy approach was employed for the first time to understand the mechanism of CO2 utilization by O2˙− in an IL to result in C2O62− generation. COSMO-RS and quantum chemical calculations using the COSMOthermX and Gaussian 09 software packages were also conducted as a necessary guideline to gain insights on the fundamental chemical properties of the molecular architecture of O2˙−/ILs/CO2 and O2. Then, O2˙− was electrochemically generated and utilized for conversion of CO2 in butyltrimethylammonium bis(trifluoromethylsulfonyl)imide [BMAmm+][TFSI−]. The long-term stability of O2˙− in [BMAmm+][TFSI−] was confirmed using the UV-vis irradiation kinetics of dynamic O2˙− degradation. [BMAmm+][TFSI−] is structurally different from the ones reported in the literature,31 considering that it is made of negatively charged carbon atoms, which was found as suitable medium for sustainable generation of O2˙−. Although many reports showed electrochemical reduction of O2 to O2˙− in other ILs,31 we are not aware of any study that has elucidated the mechanism of O2 reduction to O2˙− therein, and subsequent utilization of CO2.
2. Materials and methods
2.1 Materials
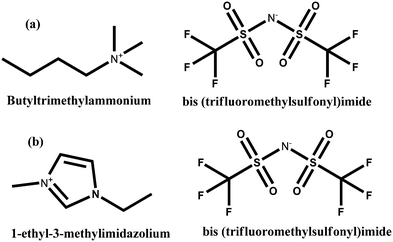
The ILs used in this study were butyltrimethylammonium bis(trifluoromethylsulfonyl)imide [BMAmm+][TFSI−] (purity ≥99%, IOLITEC) and 1-ethyl-3-methylimidazolium bis(trifluoromethylsulfonyl)imide [EMIm+][TFSI−] (purity ≥98%, Sigma Aldrich). These ILs were selected following the geometry guideline in our previous studies, which provided capacity for stable O2˙− generation.16,31,32,34,47,48 These were all obtained with <1% moisture content, which was determined using a Karl Fischer titrator (V30S). The IL structures are presented in Scheme 1. Dimethylsufoxide (DMSO; purity ≥99.97%) was purchased from Fisher Chemicals. Potassium superoxide (KO2, purity ≥99.9%) was purchased from Sigma Aldrich. Throughout the experiment, ultra-high purity gases N2 (purity ≥99.999%), and O2 (purity ≥99.999%) were used as purchased from Gaslink SDN Malaysia.2.2 Computational analysis
 | (1) |
 | (2) |
 | (3) |
2.3 Electrochemical impedance spectroscopy (EIS)
EIS measurements of [BMAmm+][TFSI−] and [EMIm+][TFSI−] media were performed in galvanostatic mode using a three-electrode system in an aluminium foil Faraday cage present in a glove box with an N2 environment. The three electrodes are glassy carbon (GC): OD: 6 mm, ID: 3 mm, platinum (Pt): 5.7 cm, BAS Inc., and Ag/AgCl: 6 mm. A sine amplitude of 100 μA in a frequency range of 100 kHz to 100 mHz was used during the measurement. To investigate the mechanism of radical driven catalysis, EIS measurements were conducted in O2-saturated [BMAmm+][TFSI−] and O2/CO2-saturated [BMAmm+][TFSI−] in potentiostatic mode using the same set of electrodes at a 10 mV amplitude. The total harmonic distortion of the AC signal in [BMAmm+][TFSI−] and [EMIm+][TFSI−] was determined.2.4 Electrochemical generation of O2˙−
[BMAmm+][TFSI−] and [EMIm+][TFSI−] were vacuum dried for ∼6 h at a temperature of ∼50 °C as a form of purification step. One mL of the IL was poured into an electrochemical cell. The GC, Pt and Ag/AgCl electrodes were clamped therein and placed in a sterile jacketed cell kept in a glove box with an N2 environment. These electrodes were connected to an Autolab potentiostat model PGSTAT302N. The latest Nova 2.1 data acquisition software through a computer was used to control the electrochemical process taking place in the cell. During the process, N2 was first directed to the electrochemical cell through a gas channel, ensuring an inert environment. Then, O2 was sparged and cyclic voltammetry (CV) measurements were conducted in the jacketed three-electrode system. In accordance, the charge transfer coefficient (α) governing the process, solubility (C0) and diffusion coefficient (D0) of O2 in the IL were determined using eqn (4)–(6),34 after chronoamperometry analysis using an ∼11 ± 2 μm (dia.) carbon fiber ultra-microelectrode. | (4) |
 | (5) |
| iss = 4nFD0C0r0 | (6) |
i p = cathodic peak current (A),
i ss = steady-state current (A),
α = charge transfer coefficient,
A = surface area of the macro-working electrode (cm2),
C 0 = bulk concentration of O2 (mol mL−1),
D 0 = diffusion coefficient of O2 (cm2 s−1),
v = potential sweep rate (V s−1),
E p = peak potential for the cathodic current (V),
E° = formal potential of the reaction (V),
R = universal gas constant (J mol−1 K),
T = absolute temperature (K),
F = Faraday's constant (96![[thin space (1/6-em)]](https://www.rsc.org/images/entities/char_2009.gif) 485 C mol−1),
485 C mol−1),
k° = standard heterogeneous rate constant (cm s−1),
n = number of electrons,
r 0 = radius of the ultra-microelectrode,
I = current (A),
t = time (s).
2.5 Long-term stability of O2˙− in DMSO containing the IL
The long-term stability was tested as described earlier.32,47 A UV-vis spectrophotometer (PerkinElmer-Lambda 35) was used to measure the absorption spectra of O2˙−. Initially, DMSO, [BMAmm+][TFSI−], and [EMIm+][TFSI−] were vacuum dried overnight at 60 °C. In addition, KO2 was placed in an air tight container with molecular sieves. The KO2 was transferred into the DMSO and the superoxide chemically generated therein was calibrated. A blank solution of ∼0.05 g of the IL in ∼5 mL DMSO was prepared after making ∼0.05 g stock of the IL in a closed vial. This was followed by preparing a fresh solution of KO2 in DMSO. The UV-vis for the blank and 5 mL of KO2 in 0.05 g IL/DMSO solution was measured immediately by repeating the scans for 180 min steps for [BMAmm+][TFSI−] and [EMIm+][TFSI−] media. The kinetics of O2˙− in these media were determined and the reaction rate constant was evaluated. The long-term stability of O2˙− in DMSO containing the IL was then monitored.2.6 Utilization of CO2 by O2˙−
The utilization of CO2 by O2˙− was measured at ambient temperature in a three-electrode cell, containing a GC working electrode, Pt counter electrode and Ag/AgCl reference electrode present in a glove box with an N2 environment. In a cyclic voltammetry experiment, 1.0 mL of [BMAmm+][TFSI−] was systematically sparged with N2 to expel any available impurities. Therefore, a 0.1 L min−1 flow of O2 and 0.034 mPa of CO2 were administered into the [BMAmm+][TFSI−] batch-wise. The medium was subjected to potentiostatic control (i.e., 0.1 to −1.3 V vs. Ag/AgCl) under different sweep rates (i.e., 9 mV s−1 to 144 mV s−1) during cyclic voltammetry.3. Results and discussion
3.1 COSMO-RS analysis
Fig. 1 shows the σ-profiles of the [BMAmm+] and [EMIm+] IL-cation compared with the σ-profiles of [TFSI−], O2, O2˙− and CO2. The possible non-covalent interactions of the molecules and ions can be estimated through the σ-profiles from COSMO-RS analysis.56 In general, the σ-profiles are classified within three possible sections based on the charge density measured in units of e nm−2 or e Å−2.57 In this section, we are adopting the measurements in units of e nm−2 throughout. Therefore, in the first section of the σ-profiles, the molecule's hydrogen bond donor (HBD) capacity can be assessed at σ < −0.820 e nm−2. Accordingly, from Fig. 1a, the HBD behaviour in [BMAmm+][TFSI−] occurred at −0.904 e nm−2, which could be due to the contribution from the C–H group.58,59 Similarly, the HBD behaviour in CO2 (σ = −1.040 e nm−2) originates from the positive character of the carbon in CO2 with sp hybridization that is hydrogen-like, and potentially avails an interaction with O2˙−. The second section within the σ-profile is a non-polar region that occurs within the range of −0.820 e nm−2 < σ < +0.820 e nm−2. [BMAmm+][TFSI−] (Fig. 1a) and the control [EMIm+][TFSI−] (Fig. 1b) have a non-polar range at −0.384 e nm−2 and −0.188 e nm−2, respectively. Also, the non-polar range for O2 and CO2 was −0.084 e nm−2 and +0.328 e nm−2, respectively. These non-polar regions signify where the molecules have their electrons distributed more symmetrically and do not possess an abundance of charges at their opposite sides.60 The third section, which occurred at σ > +0.820 e nm−2, represents the hydrogen bond acceptor (HBA) region. This region was isolated for O2˙− at +1.660 to 2.340 e nm−2. For [TFSI−], the HBA region occurs at +0.912 e nm−2 due to the presence of oxygen or fluorine in the molecular structure of the anion. Generally, the HBA plays a crucial role in establishing a bond with HBD species.61,62 However, since CO2 and [BMAmm+] have HBDs, then O2˙− has the potential to interact with their HBDs, considering no other strong competitive counter effects.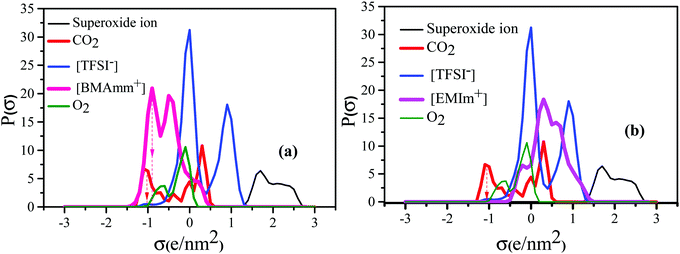 | ||
| Fig. 1 COSMO RS analysis showing the σ-profile of (a) [BMAmm+] and (b) [EMIm+] IL-cations compared with [TFSI−], O2, O2˙− and CO2. | ||
3.2 Frontier molecular orbital (FMO) analysis
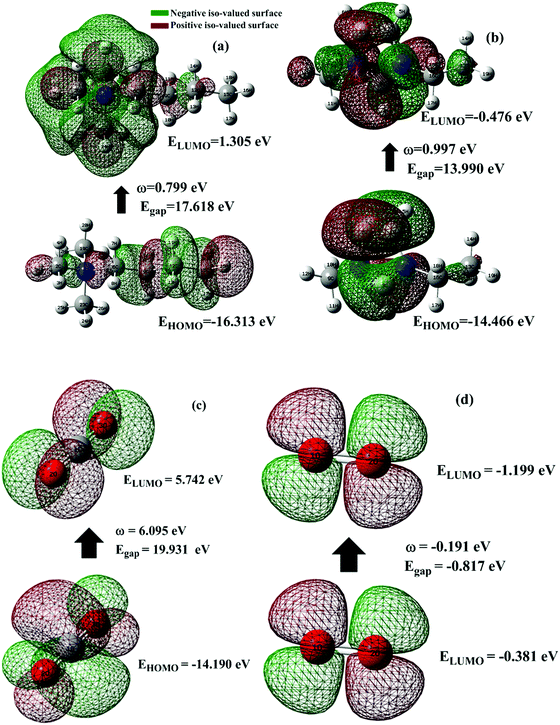
One of the best theories to describe the chemical stability of a molecule is the FMO theory of the highest occupied molecular orbital (HOMO) and lowest unoccupied molecular orbital (LUMO).63 Considering [BMAmm+], [EMIm+], CO2, and O2˙−, their HOMO and LUMO 3D renderings in terms of the isovalue surface are shown in Fig. 2a–d. These HOMOs and LUMOs may provide valuable data on the energy distribution and behavior of the molecules. There are two scenarios for the ground state HOMO or LUMO regarding these molecules: (1) symmetric isovalue surfaces, where the sizes of the green and brown 3D renderings are the same, and (2) asymmetric isovalue surfaces, where the sizes of the green and red 3D renderings are not the same. The green-colored 3D rendering represents a negative isovalue surface, while the brown-colored rendering represents a positive isovalue surface. These isovalue surfaces define the geometry of the IL molecules especially when their electron densities are rendered as colored 3D objects.64,65 Therefore, from Fig. 2a, the HOMO of [BMAmm+] with both negative and positive isovalue surfaces is distributed across the IL-cation, excluding (−CH3)2 that is linked to the nitrogen. The positive (colored brown) and negative (colored green) isovalue surfaces are symmetrical. The LUMO of [BMAmm+] is different from the HOMO of [BMAmm+]. The LUMO is distributed all over [BMAmm+] excluding (CH3). However, the negative isovalue surface is larger than the positive isovalue surface, and hence they are asymmetrical. Considering [EMIm+] in Fig. 2b, the HOMO and LUMO have an almost symmetrical distribution of either the positive or negative isovalue surface. In the HOMO, the shape is not majorly different from the LUMO. This kind of symmetrical distribution of the HOMO and LUMO isovalue surface can be seen for O2˙− and CO2, as shown in Fig. 2c and d.The HOMO energy represents the possible ionization potential, while the LUMO energy represents the electron affinity. In accordance, a high HOMO energy corresponds to a more reactive molecule with electrophiles while a low LUMO energy signifies a less reactive molecule with nucleophiles.66 The difference between the HOMO and LUMO energies represents the energy gap (EHOMO − ELUMO = ΔEg), which dictates the chemical reactivity and kinetic stability of molecules.67 According to Fig. 2a and b, ΔEg for [BMAmm+] (17.618 eV) is greater than ΔEg for [EMIm+] (13.990 eV). This implied that [BMAmm+] has less polarization with higher molecular stability. Similarly, as shown in Fig. 2c and d, ΔEg for CO2 (19.931 eV) is greater than ΔEg for O2˙− (−0.817). This implied that O2˙−, which has a lower value of ΔEg than CO2, [EMIm+], and [BMAmm+], has more polarization with low ionic stability.
However, further estimation of the electrophilicity index showed that [EMIm+] has a more positive character than [BMAmm+]. This is because the electrophilicity index of [EMIm+] is ω = 0.977 eV at the Hartree–Fock/3-21G level of theory, while that of [BMAmm+] is ω = 0.799 eV at the same level of theory. Also, CO2 has a more positive character than [EMIm+] and [BMAmm+], judging from its electrophilicity index, which is ω = 19.931 eV. The high value of the electrophilicity index makes the ion more electrophilic and susceptible to attack by O2˙−.16 To precisely confirm the degree of the positive character of [BMAmm+], [EMIm+], or CO2, further extraction of their Mulliken atomic charge distribution was carried out at the Hartree–Fock//3-21G level of theory. The Mulliken atomic charges, shown in Fig. S1a (ESI†), indicate that all the carbon atoms in [BMAmm+] are negative. In Fig. S1b (ESI†), C(sp2) in the imidazole ring of [EMIm+] has a +0.642 e a.u.−2 Mulliken atomic charge. Also in Fig. S1c (ESI†), C(sp) in CO2 has a +1.083 e a.u.−2 Mulliken atomic charge. These Mulliken atomic charges are insightful to probe the chemical process capability of the molecules.68,69 This could rationalize why [BMAmm+] has a large negatively charged isovalue surface while [EMIm+] has a more positive character.
3.3 Electrochemical impedance spectroscopy analysis
Fig. S2a and b (ESI†) show the total harmonic distortion profile and a sinusoidal profile of the voltage for the EIS measurement with GC in [BMAmm+][TFSI−] vs. Ag/AgCl, respectively. In the [BMAmm+][TFSI−] medium, the total harmonic distortion ranged from 0 to 14% and signified that the medium was stable enough to provide at least 86% undistorted electrical power flow. This is confirmed from the sinusoidal pattern shown in Fig. S2b (ESI†). Accordingly, Fig. S2c (ESI†) presents the Nyquist plot, which is used to estimate the resistance of the [BMAmm+][TFSI−] medium. In the Nyquist plot, two semicircles can be seen as indicated in the inset. The first and hidden semicircle represents the integral resistance (R1) of [BMAmm+][TFSI−].76,77 The hidden semicircle and the two obvious ones represent the electron transfer process. Based on EIS modelling, the time constant for the hidden semicircle was associated with only the electrolyte ([BMAmm+][TFSI−]) resistance R1, which was estimated to be ∼1277 Ω. The last two semi-circles are associated with the resistive–capacitive (RC) circuit.78 However, the value of R2 and R3 was 7.102 kΩ and 20.662 kΩ, respectively. These resistances (i.e., R2 and R3) are associated with capacitance C2 = 19.316 μF cm−2 and C3 = 19.02 μF cm−2, respectively, and they are peculiar to the charge transfer process. Comparing the Nyquist plot for [BMIm+][TFSI−] (Fig. S2d, ESI†), R1 was 0.364 Ω, and the value of R2 and R3 was 12.938 and 1.389 × 10³ kΩ, respectively. These resistances are also associated with a capacitance of C2 = 12.008 μF cm−2 and C3 = 17.165 μF cm−2, respectively. Comparing the Nyquist plots for the [BMAmm+][TFSI−] and [EMIm+][TFSI−] media, the charge transfer resistance R2 is larger in [EMIm+][TFSI−] (i.e., R2 = 12.938 kΩ) than in [BMAmm+][TFSI−] (i.e., R2 = 7.102 kΩ). This makes [EMIm+][TFSI−] less suitable compared with [BMAmm+][TFSI−].3.4 Electrochemical generation of O2˙− in the ILs
Fig. 3 shows the CV waves for the electrochemical generation of O2˙− in [BMAmm+][TFSI−] and [EMIm+][TFSI−] after sparging them with O2. In Fig. 3a and b, O2˙− is generated in [BMAmm+][TFSI−] and in [EMIm+][TFSI−] at −0.823 V and −0.915 V vs. Ag/AgCl, respectively, for a 144 mV s−1 sweep rate. As the sweep rate was reduced to 100, 81, 64, 36 and 9 mV s−1, the O2 reduction potential in [BMAmm+][TFSI−] was −0.825, −0.812, −0.795, −0.777, and −0.747 V vs. Ag/AgCl, respectively. Similarly, the O2 reduction potential in [EMIm+][TFSI−] was −0.908 V, −0.903 V, −0.896 V, −0.888 V, and −0.857 V vs. Ag/AgCl at potential sweep rates 100, 81, 64, 36 and 9 mV s−1, respectively. By comparison, the reduction potential of O2 reduction in [BMAmm+][TFSI−] was lower because the charge transfer resistance was lower in [BMAmm+][TFSI−] (7102 Ω) than that in [EMIm+][TFSI−] (12![[thin space (1/6-em)]](https://www.rsc.org/images/entities/char_2009.gif) 938 Ω). In these media, the CV waves for their cathodic and anodic separations, or their cathodic peak (Epc) and the half peak potential (Ep/2c) separations are higher than 60 mV (Fig. 3a–d and Table S1, ESI†). This implies that the electrochemical process for the generation of O2˙− was irreversible according to the Nicholian criterion.33,39,70 By implication of the irreversible process, the O2˙− generated was available for further reaction. According to Fig. 3a and b, the reverse oxidation CV waves show that O2˙− generated in [BMAmm+][TFSI−] and in [EMIm+][TFSI−] is stable, regardless of whether the process is diffusion or surface controlled.16,47 Moreover, comparing the peak current density with the sweep rate as illustrated in Fig. 3c and d, the linear variation postulates that a diffusion controlled process dominates O2 reduction in the bulk IL medium and this is unlikely on the surface of the electrode.71,72
938 Ω). In these media, the CV waves for their cathodic and anodic separations, or their cathodic peak (Epc) and the half peak potential (Ep/2c) separations are higher than 60 mV (Fig. 3a–d and Table S1, ESI†). This implies that the electrochemical process for the generation of O2˙− was irreversible according to the Nicholian criterion.33,39,70 By implication of the irreversible process, the O2˙− generated was available for further reaction. According to Fig. 3a and b, the reverse oxidation CV waves show that O2˙− generated in [BMAmm+][TFSI−] and in [EMIm+][TFSI−] is stable, regardless of whether the process is diffusion or surface controlled.16,47 Moreover, comparing the peak current density with the sweep rate as illustrated in Fig. 3c and d, the linear variation postulates that a diffusion controlled process dominates O2 reduction in the bulk IL medium and this is unlikely on the surface of the electrode.71,72
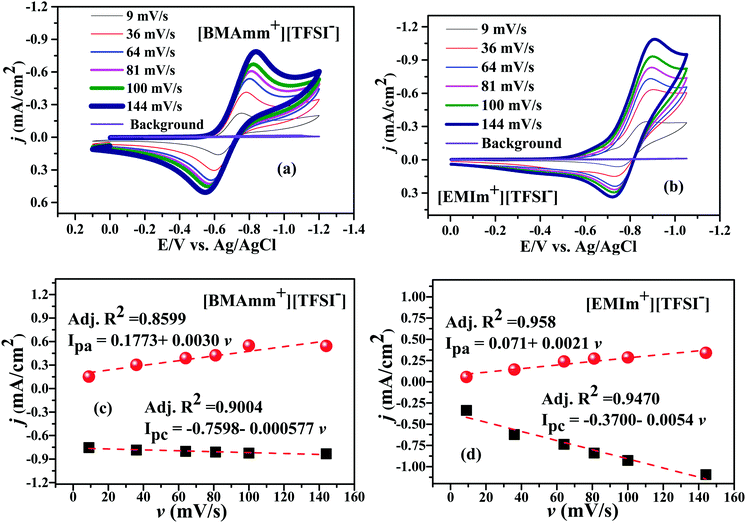 | ||
| Fig. 3 CVs of O2˙− generation in (a) [BMAmm+][TFSI−] and (b) [EMIm+][TFSI−], and current density against sweep rate in (c) [BMAmm+][TFSI−] and (d) [EMIm+][TFSI−]. | ||
3.5 Long-term stability of O2˙− in DMSO containing the IL
To study the long-term stability of O2˙− in [BMAmm+][TFSI−] and [EMIm+][TFSI−], UV-visible (UV-vis) analysis was employed. UV-vis was carried out with DMSO serving as a supporting medium for [BMAmm+][TFSI−] and [EMIm+][TFSI−]. Accordingly, Fig. 4(a and b) shows the absorbance spectra of O2˙− generated in DMSO containing individually the respective [BMAmm+][TFSI−] and [EMIm+][TFSI−]. The absorbance band for O2˙− in the supported ILs evidently occurs around 250–270 nm.32,35,73 Therefore, for [BMAmm+][TFSI−], the steady absorbance for O2˙− was at a ∼255–259 nm excitation wavelength. Similarly, the steady absorbance for O2˙− in DMSO containing [EMIm+][TFSI−] was obtained at a ∼263 nm excitation wavelength. These absorbance spectra decreased slightly with time. The kinetic data associated with this decrease is shown in Table 1. Accordingly, an 8.4% decay of O2˙− radicals was observed in the [BMAmm+][TFSI−]-based medium. On the other hand, at the same duration, a 46.1% decay of O2˙− was observed in the [EMIm+][TFSI−]-based medium. These indicate that [EMIm+][TFSI−] was not a suitable medium to be employed for generating stable O2˙−.31,36,74 The high decay of O2˙− in the [EMIm+][TFSI−]-based medium is consistent with the observation that the [EMIm+] end has more positive character with an electrophilicity index of ∼0.997 eV, and a C(sp) Mulliken charge of +0.642 e a.u.−2. The estimation of the kinetic rate constant associated with the decay of O2˙− in DMSO containing the respective IL was further used to differentiate the prowess of these media. It was found that the O2˙− decay in the [BMAmm+][TFSI−] and [EMIm+][TFSI−]-based media followed a 2nd order reaction and was estimated to be 0.147 × 10⁻⁵ and 0.320 × 10⁻⁵ M−1 s−1, respectively. The O2˙− decay in DMSO containing [BMAmm+][TFSI−] was close to that for O2˙− in DMSO containing [EDMPAmm+][TFSI−] by 9%.47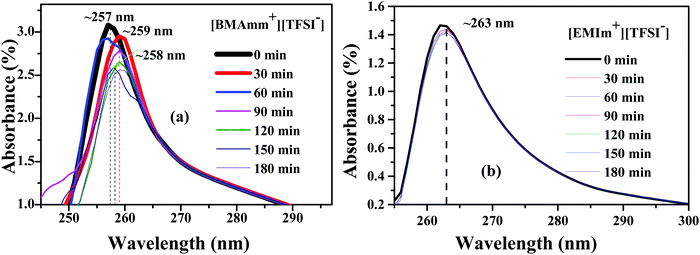 | ||
| Fig. 4 Absorbance spectra of O2˙− generation in DMSO in the presence of (a) [BMAmm+][TFSI−] and (b) [EMIm+][TFSI−]. | ||
| IL | 2nd order rate constant × 10−5 (M−1 s−1) | Total consumption % of O2˙− | D 0 × 1010 (m2 s−1) | C 0 (mM) | α |
|---|---|---|---|---|---|
| [EMIm+][TFSI−] | 0.320 | 46.1 | 1.830 | 10.200 | 0.405 |
| [BMAmm+][TFSI−] | 0.147 | 8.4 | 1.770 | 5.590 | 0.503 |
3.6 CO2 conversion by O2˙− in [BMAmm+][TFSI−]
Considering the high stability of O2˙− in [BMAmm+][TFSI−], it was further used as a medium for CO2 conversion. The [BMAmm+][TFSI−] was saturated with CO2 or N2; on reducing the sweep rate from 144 to 9 mV s−1, a resulting background CV pattern was observed with no visible faradaic current that can be attributed to any redox process taking place (Fig. 5a–f; blue coded-line denoting the blank). This indicates that CO2 was not electrochemically active and [BMAmm+][TFSI−] contained no electrochemically active impurities. According to Fig. 5(a–f), the CO2 utilization by O2˙− is evident from the disappearance of the reverse oxidation wave for O2˙− generation when both O2 and CO2 are sparged in [BMAmm+][TFSI−] electrolyte. This is an indication of spontaneous consumption of CO2 and O2˙−.16,29 The consumption of CO2 by O2˙− is in strong agreement with the literature to confirm selective in situ production of C2O62− due to the increase in the potential forward reductive peak.16,75 The forward reductive peak potential was also raised from −0.750 V (i.e., for only O2˙− before C2O62− generation) to −0.806 V vs. Ag/AgCl (i.e., after C2O62− generation) for a 9 mV s−1 sweep rate. This pattern is similar for other sweep rates, such as 36 mV s−1 (−0.784 to −0.855 V), 64 mV s−1 (−0.798 to −0.880 V), 81 mV s−1 (−0.811 to −0.890 V), 100 mV s−1 (−0.825 to −0.900 V), and 144 mV s−1 (−0.841 to −0.930 V).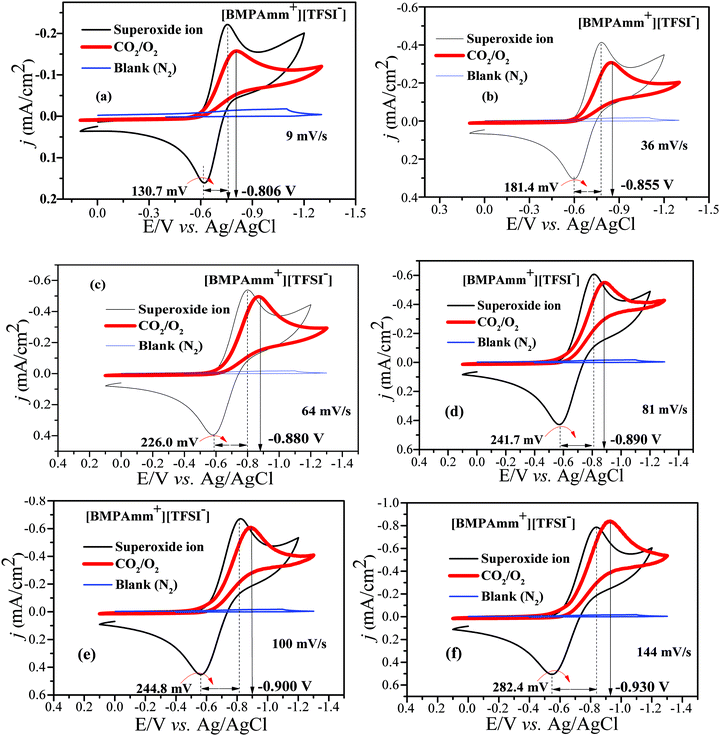 | ||
| Fig. 5 (a–f) CVs of CO2 conversion by O2˙− in [BMAmm+][TFSI−] after sparging with N2 (background), CO2, O2, and CO2/O2 simultaneously at 27 °C, GC vs. Ag/AgCl at various sweep rates. | ||
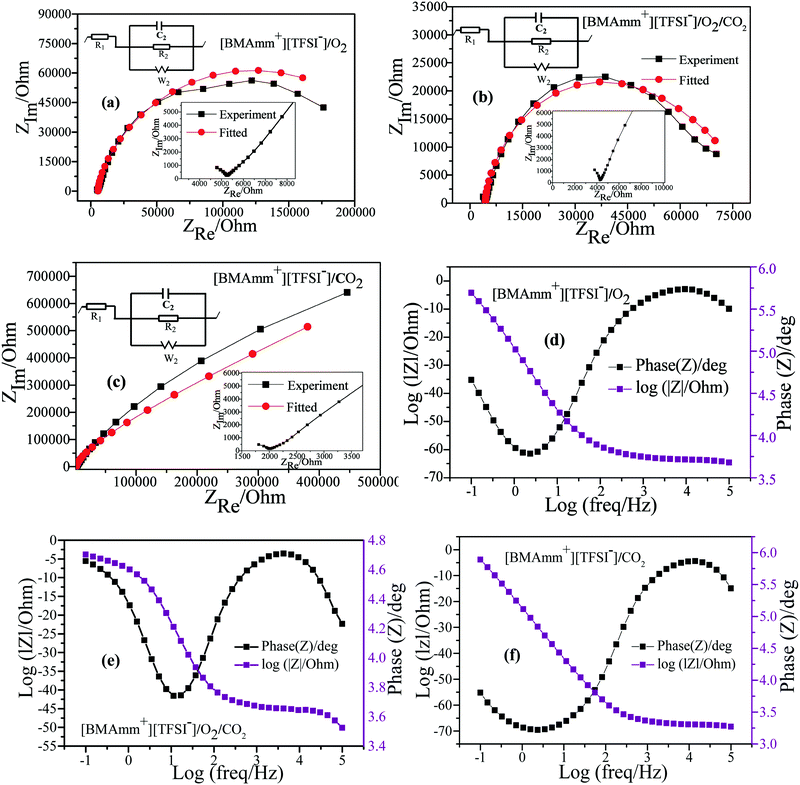
EIS in potentiostatic mode was used to study the mechanism of O2˙− electrogeneration and CO2 utilization in [BMAmm+][TFSI−] on the GC electrode. In the O2-saturated-[BMAmm+][TFSI−], CO2-saturated-[BMAmm+][TFSI−] and O2/CO2-saturated-[BMAmm+][TFSI−] electrolytes, EIS measurements were conducted at −0.773, −0.360, and −0.360 V vs. Ag/AgCl, respectively. The EIS spectra detected in the O2-saturated-[BMAmm+][TFSI−], CO2-saturated-[BMAmm+][TFSI−] and O2/CO2-saturated-[BMAmm+][TFSI−] electrolytes are presented in Fig. 6. In the O2-saturated-[BMAmm+][TFSI−] and O2/CO2-saturated-[BMAmm+][TFSI−] electrolyte (Fig. 6a and b), the Nyquist plot shows a typical feature: in the high frequency region, a small semi-circle can be observed, which corresponds to the electron transfer process. By contrast, in the low-frequency region, a bigger semi-circle was detected, showing a total of two circles which correspond to two time scales that are associated with the resistor capacitance circuit (EC).78 The EIS is modelled by a modified Randles EC79 (Fig. 6a–c), where R1 = Re is the electrolyte resistance, R2 = Rct is the charge transfer, C2 is the double-layer capacitance and W is the Warburg impedance. The EC is described by four elements corresponding to four impedance parameters. This denotes a system with two time-constants. The low-frequency region detected in CO2-saturated-[BMAmm+][TFSI−] shows a straight line, Fig. 6c. This pattern is associated with a diffusion limited process.
It was found that Re varied in the following order: 5.467, 4.378, and 2.116 kΩ for the O2-saturated-[BMAmm+][TFSI−], CO2-saturated-[BMAmm+][TFSI−], and O2/CO2-saturated-[BMAmm+][TFSI−] electrolytes, respectively. The double layer capacitance (C2) associated with Re also varies in the following order: 5.897, 7.764, and 7.507 μF cm−2 in the respective O2-saturated-[BMAmm+][TFSI−], O2/CO2-saturated-[BMAmm+][TFSI−], and CO2-saturated-[BMAmm+][TFSI−]. Comparing the double layer capacitance detected in these media, an apparent peculiarity can be observed. This suggests that the mechanism of O2 reduction to O2˙− and the subsequent CO2 utilization by O2˙− in these media were associated with different charge mobility. The reasonable explanation is that [BMAmm+][TFSI−] got adsorbed on the surface of the GC electrode to form a thin film layer. By virtue of sparging O2, CO2 or O2/CO2, the gases are expected to get absorbed by [BMAmm+][TFSI−]. These contributed to different polarizations with a consequence of different double layer capacitances. Further analysis of the charge transfer resistance (Rct) revealed that the process is faster in O2/CO2-saturated-[BMAmm+][TFSI−] (Rct = 79 kΩ). This Rct is lower than the ones detected in O2-saturated-[BMAmm+][TFSI−] (Rct = 261.467 kΩ) or CO2-saturated-[BMAmm+][TFSI−] (Rct = 6.86 × 10¹⁸ kΩ). It can be noticed that the Rct value detected in CO2-saturated-[BMAmm+][TFSI−] was extremely high. This result can inspire the suggestion that charge mobility therein is almost absent. Therefore, under this condition, CO2 conversion would not occur but it can be available for direct nucleophilic oxidation by O2˙−.
The Bode plots detected in the O2-saturated-[BMAmm+][TFSI−], CO2-saturated-[BMAmm+][TFSI−] and O2/CO2-saturated-[BMAmm+][TFSI−] electrolytes are shown in Fig. 6d–f. In the O2-saturated-[BMAmm+][TFSI−] and CO2-saturated-[BMAmm+][TFSI−] electrolytes, only one peak can be seen and both have a similar frequency response (Fig. 6d and f). By contrast, in O2/CO2-saturated-[BMAmm+][TFSI−], there are two peaks (Fig. 6e). These results indicate that the mechanisms of CO2 utilization by O2˙− and O2 reduction to O2˙− were different. However, the mechanism of O2 reduction or any possibility of electrochemical CO2 reduction may be similar since they both have similar BODE impedance profiles.
The impedance parameters obtained following the fitting of the EIS experimental results by using the equivalent circuits displayed in Fig. 6 are listed in Table 2. It can be observed that the charge transfer resistance detected in CO2-saturated-[BMAmm+][TFSI−] is significantly higher than the ones observed in the O2/CO2-saturated-[BMAmm+][TFSI−] and O2-saturated-[BMAmm+][TFSI−] electrolytes, indicating that intermediate movement therein may be unlikely. This indicates that CO2 might be absorbed and remained available for direct interaction with O2˙−. These results further confirmed the O2˙− catalyzed CO2 reduction. Hence, reducing the activation energy and the overpotential of CO2 reduction can be ascribed to the high charge transfer resistance.
| Catholyte | R e/kΩ | R ct/kΩ | C 2/μF cm−2 | W/Ω s1/2 cm2 |
|---|---|---|---|---|
| O2-saturated-[BMAmm+][TFSI−] | 5467 | 261.467 | 5.897 | 293![[thin space (1/6-em)]](https://www.rsc.org/images/entities/char_2009.gif) 191 191 |
| CO2-saturated-[BMAmm+][TFSI−] | 2116 | 6.86 × 10¹⁸ | 7.764 | 426![[thin space (1/6-em)]](https://www.rsc.org/images/entities/char_2009.gif) 284 284 |
| O2/CO2-saturated-[BMAmm+][TFSI−] | 4378 | 79.00 | 7.507 | 82![[thin space (1/6-em)]](https://www.rsc.org/images/entities/char_2009.gif) 444 444 |
3.7 Catalytic mechanism
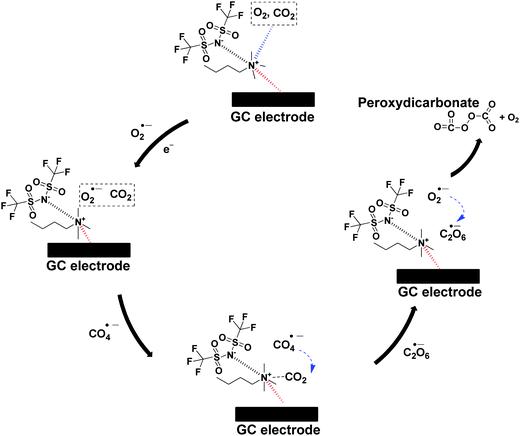
The CO2 utilization by O2˙− in ILs investigated by many researchers necessitates the need to elucidate the proper catalytic mechanism.16,29,31 Therefore, the mechanism is described as follows: firstly, O2 and/or CO2 will diffuse and get absorbed by [BMAmm+][TFSI−] due to the linear σ-profiles of O2, CO2 and [BMAmm+][TFSI−] which centered at their non-polar ends with σ = −0.791 e nm−2 to σ = 0.81 e nm−2, as explained in Section 3.1. Therefore, the O2-saturated-[BMAmm+][TFSI−], O2/CO2-saturated-[BMAmm+][TFSI−] or CO2-saturated-[BMAmm+][TFSI−] further got momentarily adsorbed on the surface of the GC electrode through participation of the IL moiety to form an IL layer. It was shown that the IL layer could be formed during the electrochemical process occurring in the IL.80 Then, O2 will diffuse through the bulk from being absorbed by the [BMAmm+][TFSI−] solution to the vicinity of the GC electrode. O2 could be possibly transferred through the space between the adsorbed IL layer and the GC electrode surface. Eventually, O2 gets reduced to O2˙−via single electron transfer on the GC electrode. Due to the extremely high charge transfer resistance for CO2 saturated media, CO2 will follow a different mechanism (see Table 2), whereas the charge transfer resistance value for O2/CO2-saturated-[BMAmm+][TFSI−] was very small (see Table 2). Accordingly, the O2˙− that is electrochemically generated can be postulated to attack the C(sp) center of CO2, which is highly susceptible because of its positive Mulliken charge (see Fig. S1c, ESI†). During the process, the rate-determining step is the first electron transfer from the cathode to the absorbed O2 to form the highly-energetic O2˙− radical. The generated O2˙− interacted with CO2via nucleophilic addition to induce the formation of CO4˙−. CO4˙− further followed a consecutive reaction step with CO2 to form C2O6˙−. In another step of the consecutive reaction between C2O6˙− and O2˙−, C2O62− was formed along with O2. The reaction summary is presented in Scheme 2. The results are in agreement with the CO2 conversion by O2˙− in aprotic solvents.75 The result also revealed a strong advance that O2˙− was undergoing a nucleophilic addition to CO2 due to the extremely high charge transfer resistance in the CO2 saturated [BMAmm+][TFSI−]. This rendered CO2 to be highly unlikely to undergo electrochemical transformation to CO2˙− as conventionally reported.81 The mechanism of CO2 conversion by direct addition of O2˙− is observable and plausible because [BMAmm+][TFSI−] was significantly stable for the process due to its large negative isovalue surface, unlike aprotic solvents.4. Conclusion
[BMAmm+][TFSI−] was successfully used as a task-specific electrolyte for electrochemical O2˙− generation and conversion of CO2 into C2O62−. It was found that large negative isovalue surfaces accrued from negatively charged carbon atoms in ILs like [BMAmm+][TFSI−] could induce them to be less susceptible to attack by O2˙−. In contrast, the IL large positive isovalue surfaces accrued from at least one positively charged carbon atom such as in the case of [EMIm+] can induce them to become more susceptible to attack by O2˙−. The consequence of O2˙− susceptibility can be measured quantitatively using the long-time stability from UV-vis irradiation analysis. Accordingly, it was noticed that the [BMAmm+] based IL recorded significant O2˙− long-time stability by allowing only 8.4% decay. This rendered the IL a suitable medium for a radical driven CO2 utilization process. Moreover, the C2O62− produced in the [BMAmm+][TFSI−] medium was detected by the total disappearance of the oxidative faradaic current for the O2˙−/O2 couple. Therefore, the mechanism of CO2 utilization by O2˙− is limited by O2 electrochemical reduction to O2˙−. The CO2 was found to be electrochemically stable due to the high charge transfer resistance in CO2 saturated [BMAmm+][TFSI−]. It is expected that this work will open more research opportunities toward using ILs as promising media for electrochemical reactions and applications of O2˙− in organic synthesis of speciality chemicals or drop-in fuel molecules. The study can also serve as a protocol toward the use of different IL media in unraveling the chemistry of reactive oxygen species and their industrial relevance.Conflicts of interest
There are no conflicts to declare.Acknowledgements
The authors would like to express their gratitude to the Newton Fund Institutional Links Project (IF013-2015) and RU Grant (GPF058A) for financial support throughout this research.References
- M. R. Smith and S. S. Myers, Nat. Clim. Change, 2018, 8, 834–839 CrossRef CAS.
- R. J. Kuhns and G. H. Shaw, Navigating the Energy Maze, Springer, 2018, pp. 99–115 Search PubMed.
- C. J. Rhodes, Sci. Prog., 2016, 99, 97–104 CrossRef PubMed.
- A. A. Fawcett, G. C. Iyer, L. E. Clarke, J. A. Edmonds, N. E. Hultman, H. C. McJeon, J. Rogelj, R. Schuler, J. Alsalam and G. R. Asrar, Science, 2015, 350, 1168–1169 CrossRef CAS PubMed.
- J. Li, O. Sode, G. A. Voth and S. Hirata, Nat. Commun., 2013, 4, 2647 CrossRef PubMed.
- J. Tollefson, Nature, 2018, 558, 173 CrossRef CAS PubMed.
- S. Nitopi, E. Bertheussen, S. B. Scott, X. Liu, A. K. Engstfeld, S. Horch, B. Seger, I. E. L. Stephens, K. Chan, C. Hahn, J. K. Nørskov, T. F. Jaramillo and I. Chorkendorff, Chem. Rev., 2019, 119, 7610–7672 CrossRef CAS PubMed.
- J. Artz, T. E. Müller, K. Thenert, J. Kleinekorte, R. Meys, A. Sternberg, A. Bardow and W. Leitner, Chem. Rev., 2018, 118, 434–504 CrossRef CAS PubMed.
- J. L. White, M. F. Baruch, J. E. Pander, Y. Hu, I. C. Fortmeyer, J. E. Park, T. Zhang, K. Liao, J. Gu, Y. Yan, T. W. Shaw, E. Abelev and A. B. Bocarsly, Chem. Rev., 2015, 115, 12888–12935 CrossRef CAS PubMed.
- J. Ren and S. Licht, Sci. Rep., 2016, 6, 27760 CrossRef CAS PubMed.
- J. Ren, M. Johnson, R. Singhal and S. Licht, J. CO2 Util., 2017, 18, 335–344 CrossRef CAS.
- S. Licht, J. CO2 Util., 2017, 18, 378–389 CrossRef CAS.
- D. R. Kauffman, J. Thakkar, R. Siva, C. Matranga, P. R. Ohodnicki, C. Zeng and R. Jin, ACS Appl. Mater. Interfaces, 2015, 7, 15626–15632 CrossRef CAS PubMed.
- F.-Y. Gao, R.-C. Bao, M.-R. Gao and S.-H. Yu, J. Mater. Chem., 2020, 8, 15458–15478 RSC.
- D. L. T. Nguyen, Y. Kim, Y. J. Hwang and D. H. Won, Carbon Energy, 2020, 2, 72–98 CrossRef CAS.
- A. Halilu, M. Hayyan, M. K. Aroua, R. Yusoff and H. F. Hizaddin, ACS Appl. Mater. Interfaces, 2019, 11, 25928–25939 CrossRef CAS PubMed.
- A. Aljuhani, M. R. Aouad, N. Rezki, O. A. Aljaldy, S. A. Al-Sodies, M. Messali and I. Ali, J. Mol. Liq., 2019, 285, 790–802 CrossRef CAS.
- S. K. Singh and A. W. Savoy, J. Mol. Liq., 2020, 297, 112038 CrossRef CAS.
- I. Ali, M. Suhail, M. M. Sanagi and H. Y. Aboul-Enein, Crit. Rev. Anal. Chem., 2017, 47, 332–339 CrossRef CAS PubMed.
- A. Hussain, M. F. AlAjmi, I. Hussain and I. Ali, Crit. Rev. Anal. Chem., 2019, 49, 289–305 CrossRef CAS PubMed.
- M. Kissoudi and V. Samanidou, Molecules, 2018, 23, 1437 CrossRef PubMed.
- I. Bahadur, K. Osman, C. Coquelet, P. Naidoo and D. Ramjugernath, J. Phys. Chem. B, 2015, 119, 1503–1514 CrossRef CAS PubMed.
- J. L. Anthony, J. L. Anderson, E. J. Maginn and J. F. Brennecke, J. Phys. Chem. B, 2005, 109, 6366–6374 CrossRef CAS PubMed.
- J. L. Anderson, J. K. Dixon and J. F. Brennecke, Acc. Chem. Res., 2007, 40, 1208–1216 CrossRef CAS PubMed.
- S. Zeng, X. Zhang, L. Bai, X. Zhang, H. Wang, J. Wang, D. Bao, M. Li, X. Liu and S. Zhang, Chem. Rev., 2017, 117, 9625–9673 CrossRef CAS PubMed.
- K. Seo, C. Tsay, B. Hong, T. F. Edgar, M. A. Stadtherr and M. Baldea, ACS Sustainable Chem. Eng., 2020, 8, 10242–10258 CrossRef CAS.
- Y. Zhang, S. Zhang, X. Lu, Q. Zhou, W. Fan and X. Zhang, Chem. – Eur. J., 2009, 15, 3003–3011 CrossRef CAS PubMed.
- I. M. AlNashef, M. L. Leonard, M. C. Kittle, M. A. Matthews and J. W. Weidner, Electrochem. Solid-State Lett., 2001, 4, D16–D18 CrossRef CAS.
- I. M. AlNashef, M. L. Leonard, M. A. Matthews and J. W. Weidner, Ind. Eng. Chem. Res., 2002, 41, 4475–4478 CrossRef CAS.
- M. T. Carter, C. L. Hussey, S. K. Strubinger and R. A. Osteryoung, Inorg. Chem., 1991, 30, 1149–1151 CrossRef CAS.
- M. Hayyan, M. A. Hashim and I. M. AlNashef, Chem. Rev., 2016, 116, 3029–3085 CrossRef CAS PubMed.
- M. Hayyan, F. S. Mjalli, I. M. AlNashef and M. A. Hashim, J. Fluorine Chem., 2012, 142, 83–89 CrossRef CAS.
- M. Hayyan, F. S. Mjalli, M. A. Hashim and I. M. AlNashef, Ind. Eng. Chem. Res., 2012, 51, 10546–10556 CrossRef CAS.
- M. Hayyan, F. S. Mjalli, M. A. Hashim, I. M. AlNashef and X. M. Tan, J. Electroanal. Chem., 2011, 657, 150–157 CrossRef CAS.
- M. M. Islam, T. Imase, T. Okajima, M. Takahashi, Y. Niikura, N. Kawashima, Y. Nakamura and T. Ohsaka, J. Phys. Chem. A, 2009, 113, 912–916 CrossRef CAS PubMed.
- K. U. Schwenke, J. Herranz, H. A. Gasteiger and M. Piana, J. Electrochem. Soc., 2015, 162, A905–A914 CrossRef CAS.
- M. Hayyan, A. M. Alakrach, A. Hayyan, M. A. Hashim and H. F. Hizaddin, ACS Sustainable Chem. Eng., 2017, 5, 1854–1863 CrossRef CAS.
- M. Hayyan, F. S. Mjalli, I. M. AlNashef and M. A. Hashim, J. Fluorine Chem., 2012, 142, 83–89 CrossRef CAS.
- I. M. AlNashef, M. A. Hashim, F. S. Mjalli, M. Q. A.-h. Ali and M. Hayyan, Tetrahedron Lett., 2010, 51, 1976–1978 CrossRef CAS.
- M. Hayyan, F. S. Mjalli, M. A. Hashim and I. M. AlNashef, J. Mol. Liq., 2013, 181, 44–50 CrossRef CAS.
- S. Doblinger, J. Lee and D. S. Silvester, J. Phys. Chem., 2019, 123, 10727–10737 CAS.
- Y. Katayama, H. Onodera, M. Yamagata and T. Miura, J. Electrochem. Soc., 2004, 151, A59 CrossRef CAS.
- M. C. Buzzeo, O. V. Klymenko, J. D. Wadhawan, C. Hardacre, K. R. Seddon and R. G. Compton, J. Phys. Chem. A, 2003, 107, 8872–8878 CrossRef CAS.
- J. Sun, M. Forsyth and D. R. Macfarlane, J. Phys. Chem. B, 1998, 102, 8858–8864 CrossRef CAS.
- H. Ashassi-Sorkhabi, A. Kazempour and P. Salehi-Abar, J. Mol. Liq., 2018, 251, 190–200 CrossRef CAS.
- B. Wang, L. Qin, T. Mu, Z. Xue and G. Gao, Chem. Rev., 2017, 117, 7113–7131 CrossRef CAS PubMed.
- M. Hayyan, M. Ibrahim, A. Hayyan and M. A. Hashim, Braz. J. Chem. Eng., 2017, 34, 227–239 CrossRef CAS.
- M. Hayyan, M. H. Ibrahim, A. Hayyan, I. M. AlNashef, A. M. Alakrach and M. A. Hashim, Ind. Eng. Chem. Res., 2015, 54, 12263–12269 CrossRef CAS.
- M. Hornig and A. Klamt, J. Chem. Inf. Model., 2005, 45, 1169–1177 CrossRef CAS PubMed.
- C. Steffen, K. Thomas, U. Huniar, A. Hellweg, O. Rubner and A. Schroer, J. Comput. Chem., 2010, 31, 2967–2970 CAS.
- J. P. Perdew, Phys. Rev. B: Solid State, 1986, 33, 8822 CrossRef PubMed.
- A. Schäfer, C. Huber and R. Ahlrichs, J. Chem. Phys., 1994, 100, 5829–5835 CrossRef.
- M. J. Frisch, G. W. Trucks, H. B. Schlegel, G. E. Scuseria, M. A. Robb, J. R. Cheeseman, G. Scalmani, V. Barone, G. A. Petersson, H. Nakatsuji, X. Li, M. Caricato, A. V. Marenich, J. Bloino, B. G. Janesko, R. Gomperts, B. Mennucci, H. P. Hratchian, J. V. Ortiz, A. F. Izmaylov, J. L. Sonnenberg, F. WilliamsDing, F. Lipparini, F. Egidi, J. Goings, B. Peng, A. Petrone, T. Henderson, D. Ranasinghe, V. G. Zakrzewski, J. Gao, N. Rega, G. Zheng, W. Liang, M. Hada, M. Ehara, K. Toyota, R. Fukuda, J. Hasegawa, M. Ishida, T. Nakajima, Y. Honda, O. Kitao, H. Nakai, T. Vreven, K. Throssell, J. A. Montgomery, Jr., J. E. Peralta, F. Ogliaro, M. J. Bearpark, J. J. Heyd, E. N. Brothers, K. N. Kudin, V. N. Staroverov, T. A. Keith, R. Kobayashi, J. Normand, K. Raghavachari, A. P. Rendell, J. C. Burant, S. S. Iyengar, J. Tomasi, M. Cossi, J. M. Millam, M. Klene, C. Adamo, R. Cammi, J. W. Ochterski, R. L. Martin, K. Morokuma, O. Farkas, J. B. Foresman and D. J. Fox, Gaussian 09, Gaussian Inc., Wallingford CT, 2009 Search PubMed.
- P. K. Chattaraj, U. Sarkar and D. R. Roy, Chem. Rev., 2006, 106, 2065–2091 CrossRef CAS PubMed.
- P. K. Chattaraj and S. Giri, Annu. Rep. Prog. Chem., Sect. C: Phys. Chem., 2009, 105, 13–39 RSC.
- A. Klamt, F. Eckert and W. Arlt, Annu. Rev. Chem. Biomol. Eng., 2010, 1, 101–122 CrossRef CAS PubMed.
- F. Eckert and A. Klamt, COSMOtherm, Version C2. 1, Release 01. 11, COSMOlogic, GmbH & Co. KG, Leverkusen, Germany, 2010.
- C. D. Sessler, M. Rahm, S. Becker, J. M. Goldberg, F. Wang and S. J. Lippard, J. Am. Chem. Soc., 2017, 139, 9325–9332 CrossRef CAS PubMed.
- D.-W. Yoon, D. E. Gross, V. M. Lynch, J. L. Sessler, B. P. Hay and C.-H. Lee, Angew. Chem., 2008, 47, 5038–5042 CrossRef CAS PubMed.
- N. Galamba, A. Paiva, S. Barreiros and P. Simões, J. Chem. Theory Comput., 2019, 15, 6277–6293 CrossRef CAS PubMed.
- S. J. Pike, J. J. Hutchinson and C. A. Hunter, J. Am. Chem. Soc., 2017, 139, 6700–6706 CrossRef CAS PubMed.
- J. Schwöbel, R.-U. Ebert, R. Kühne and G. Schüürmann, J. Chem. Inf. Model., 2009, 49, 956–962 CrossRef PubMed.
- J. J. Dannenberg, Chem. Rev., 1999, 99, 1225–1242 CrossRef CAS PubMed.
- G. D. Purvis, 3rd, J. Comput.-Aided Mol. Des., 1991, 5, 55–80 CrossRef PubMed.
- J. Weber, P. Fluekiger, P. Y. Morgantini, O. Schaad, A. Goursot and C. Daul, J. Comput.-Aided Mol. Des., 1988, 2, 235–253 CrossRef CAS PubMed.
- K. Fukui, Science, 1982, 218, 747–754 CrossRef CAS PubMed.
- F. De Proft, N. Sablon, D. J. Tozer and P. Geerlings, Faraday Discuss., 2007, 135, 151–159 RSC.
- J. S. Griffith and L. E. Orgel, Q. Rev., Chem. Soc., 1957, 11, 381–393 RSC.
- R. M. Fogarty, R. P. Matthews, C. R. Ashworth, A. Brandt-Talbot, R. G. Palgrave, R. A. Bourne, T. V. Hoogerstraete, P. A. Hunt and K. R. J. Lovelock, J. Chem. Phys., 2018, 148, 193817 CrossRef PubMed.
- R. S. Nicholson, Anal. Chem., 1965, 37, 1351–1355 CrossRef CAS.
- A. J. Bard, L. R. Faulkner, J. Leddy and C. G. Zoski, Electrochemical methods: fundamentals and applications, Wiley, New York, 1980 Search PubMed.
- J. Wang, Analytical electrochemistry, John Wiley & Sons, 2006 Search PubMed.
- O. U. Ahmed, F. S. Mjalli, T. Al-Wahaibi, Y. Al-Wahaibi and I. M. AlNashef, Ind. Eng. Chem. Res., 2015, 54, 2074–2080 CrossRef CAS.
- M. Hayyan, F. S. Mjalli, I. M. AlNashef and M. A. Hashim, Int. J. Electrochem. Sci., 2012, 7, 8116–8127 CAS.
- J. L. Roberts, T. S. Calderwood and D. T. Sawyer, J. Am. Chem. Soc., 1984, 106, 4667–4670 CrossRef CAS.
- B.-A. Mei, O. Munteshari, J. Lau, B. Dunn and L. Pilon, J. Phys. Chem. C, 2018, 122, 194–206 CrossRef CAS.
- M. E. Orazem and B. Tribollet, Electrochemical Impedance Spectroscopy, John Wiley & Sons, 2011 Search PubMed.
- V. Lates, A. Falch, A. Jordaan, R. Peach and R. J. Kriek, Electrochim. Acta, 2014, 128, 75–84 CrossRef CAS.
- R. M. Torresi, L. Lodovico, T. M. Benedetti, M. R. Alcântara, C. Debiemme-Chouvy and C. Deslouis, Electrochim. Acta, 2013, 93, 32–43 CrossRef CAS.
- T. Jänsch, J. Wallauer and B. Roling, J. Phys. Chem. C, 2015, 119, 4620–4626 CrossRef.
- T. Kai, M. Zhou, S. Johnson, H. S. Ahn and A. J. Bard, J. Am. Chem. Soc., 2018, 140, 16178–16183 CrossRef CAS PubMed.
Footnote |
| † Electronic supplementary information (ESI) available. See DOI: 10.1039/d0cp04903d |
| This journal is © the Owner Societies 2021 |

