Electrochemical non-enzymatic glucose sensors: recent progress and perspectives
Ming
Wei†
a,
Yanxia
Qiao†
a,
Haitao
Zhao
b,
Jie
Liang
b,
Tingshuai
Li
b,
Yonglan
Luo
b,
Siyu
Lu
 c,
Xifeng
Shi
d,
Wenbo
Lu
 *a and
Xuping
Sun
 *b
*b
aKey Laboratory of Magnetic Molecules and Magnetic Information Materials (Ministry of Education), School of Chemistry and Material Science, Shanxi Normal University, Linfen 041004, Shanxi, China. E-mail: luwb@sxnu.edu.cn
bInstitute of Fundamental and Frontier Sciences, University of Electronic Science and Technology of China, Chengdu 610054, Sichuan, China. E-mail: xpsun@uestc.edu.cn
cGreen Catalysis Center and College of Chemistry, Zhengzhou University, Zhengzhou 450001, Henan, China
dCollege of Chemistry, Chemical Engineering and Materials Science, Shandong Normal University, Jinan 250014, Shandong, China
First published on 30th September 2020
Abstract
The detection of glucose has important significance in clinical medicine and the food industry, especially in the diagnosis of diabetes. In recent years, electrochemical non-enzymatic glucose sensors have attracted intensive attention to detect the glucose level with great progress. In this review, we summarize a variety of non-enzymatic glucose sensor materials, including precious metals Pt, Au and their alloy metals, non-precious transition metals and their metal oxides, composites and other functional materials. Moreover, fundamental insights into the reaction mechanism and influencing factors of materials are given. Finally, this review discusses the perspectives and challenges of future developments in electrochemical non-enzymatic glucose detection.
1. Introduction
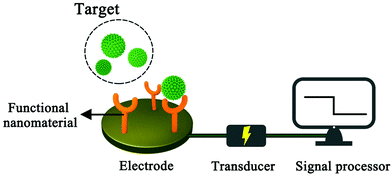
A sensor is a device that records physical, chemical or biological changes of a substance and converts them into measurable signals. In other words, the sensor can help researchers explore the composition and content of specific substances in the unknown world, just as humans can look at the colourful world with their eyes. A sensor is mainly composed of three parts: sensitive detector, transducer and signal processor. The sensitive detector mainly has a selective response to the specific analyte, the transducer generates the corresponding signal, and the signal processor collects, amplifies and presents the signal. An electrochemical sensor is a kind of sensor which outputs the changes generated by the target substance in the form of an electrical signal. Compared with other detection methods, electrochemical analysis does not require large analytical instruments, has fast response speed, high sensitivity and selectivity, and can be used for real-time monitoring of target analytes, and based on these advantages, electrochemical analysis is widely used in environmental detection, the food industry and biomedical fields.1–5 In practical electrical analysis and detection, the standard three-electrode system is usually used.6,7 The working electrode is generally made of metal, metal oxide and carbon. If the bare electrode is used directly in electrochemical experiments, the reactant molecules will be in direct contact with the electrode surface, which will limit the scope of its application. In order to enhance the selectivity of the electrode to the measured material, functional nanomaterials are generally used to modify the electrode to meet the requirements of analysis. After the target molecules are successfully identified on the electrode surface, electrochemical measurement techniques, such as cyclic voltammetry and square wave voltammetry, are used to obtain the corresponding electrochemical signals, so as to obtain the target analysis information such as concentration (Fig. 1).8,9Glucose is one of the most widely distributed monosaccharides in nature. It is the main energy source in living cells and plays an important role in biology.10,11 The physical and chemical properties of glucose have been extensively studied since the German chemist Margraves isolated it from beet roots in 1717.10 The blood glucose concentration of normal people is maintained between 3.9 and 6.1 mmol L−1 in a fasting state.12 Both hypoglycaemia and hyperglycaemia have adverse effects on people's health.13–15 Hypoglycemia will make people feel hungry, palpated or even unconscious, while hyperglycemia increases the risk of diabetes to some extent. In addition, the determination of glucose content in fruits and vegetables is also one of the indexes to determine its quality, which can be used as a reference for their cultivation. From the above discussion, it can be seen that the accurate, rapid, simple and real-time measurement of glucose is of great significance to clinical diagnosis, the food industry and other industries.16,17
The elegant combination of electrochemical techniques and glucose determination brings new paths for glucose concentration determination. In previous literature reports, the electrochemical sensors for glucose are mainly divided into enzyme sensors and enzyme-free sensors.18
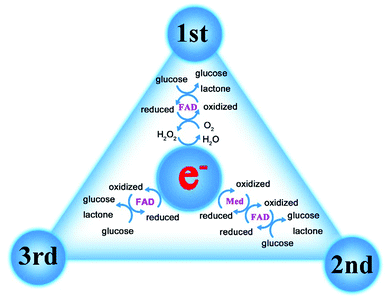
As the most widely studied sensor, the research direction of glucose enzyme-based sensors is moving from invasive to wearable (Fig. 2).19 In terms of development history, glucose enzyme sensors have undergone three generations of development, mainly relying on glucose oxidoreductase enzymes to complete the detection purpose.20,21 As the bioactive centre of glucose enzyme sensors, oxidoreductase enzymes are divided into two categories, glucose oxidase (GOx) and glucose dehydrogenases (GDHs), GDHs can be further classified according to their redox cofactors.22 The first generation of enzyme sensors took oxygen as the electron acceptor, and the glucose concentration was determined by the consumption of oxygen and the release of hydrogen peroxide.23 However, the first generation of sensors also demonstrates many disadvantages. For example, in addition to glucose, biomolecules such as urea may also be oxidized due to the high potential required in the test process. The experimental results are greatly affected by oxygen partial pressure or dissolved oxygen, and the high concentration of hydrogen peroxide produced by the reaction will cause the enzyme activity to decrease or inactivate. In order to overcome the shortcomings of the first generation of enzyme sensors, the second generation of enzyme sensors chose the chemically modified layer as the electron acceptor, and the reduction of working potential and the disappearance of hydrogen peroxide broadened the linear range of the sensor and extended the life of the sensor. The electron transfer process of the third-generation enzyme sensor is directly between the enzyme and the electrode. Considering that the active centre of the enzyme is inside the molecule and the enzyme is prone to deform on the electrode, the use of the third-generation enzyme sensor is limited, but the glucose oxidase can complete the electrocatalytic process on the appropriate electrode (Fig. 3). In order to further improve the performance of the glucose enzyme sensor, functional nanomaterials are introduced into the design of the enzyme sensor to further enhance the directional ability of the enzyme and amplify the conductive currents, especially in the introduction of noble metal nanoparticles such as Au and Pt.
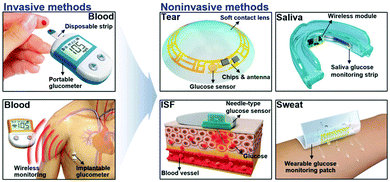 | ||
| Fig. 2 The Schematic diagram of the research direction of glucose enzyme sensors from invasive to wearable. Reproduced ref. 19 with permission from Wiley-VCH Verlag GmbH & Co. KGaA, Weinheim, copyright 2018. | ||
The glucose enzyme sensor has high selectivity and sensitivity, but due to the existence of enzymes in its structure, it also has some defects. For example, the enzyme fixation step is complex, the exact amount of enzyme is difficult to ensure, and it is easily affected by temperature and pH. Therefore, glucose enzyme-free sensors have attracted more and more attention. Compared with enzyme sensors, non-enzyme sensors are easy to prepare, less affected by the surrounding environment, and can be stored for a long time. This review mainly gives a brief overview of the development of glucose non-enzyme sensors, especially in recent years, discusses the electrochemical measurement technology, reaction mechanism and influencing factors, and makes the development of a glucose non-enzyme sensor a certain prospect.
2. Electrochemical techniques
Electrochemical experiments are usually carried out by a three electrode system, which consists of a working electrode, reference electrode and auxiliary electrode. In the circuit, there are two loops, the current loop between the working electrode and the auxiliary electrode and the testing loop between the working electrode and the reference electrode.The main variables in electrochemical measurement technology are potential, current, impedance and time, from which a series of electrochemical measurement methods are derived, such as cyclic voltammetry (CV), linear sweep voltammetry (LSV), differential pulse voltammetry (DPV), electrochemical impedance spectroscopy (EIS) and amperometric response methods, which greatly enriches the research methods of electrochemical sensors (Fig. 4).24,25
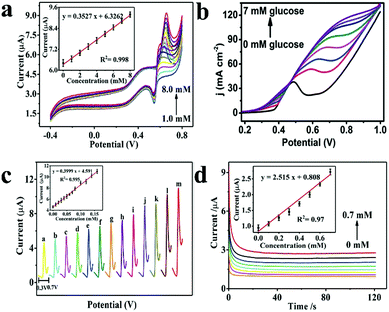 | ||
| Fig. 4 (a) CV curves of the Ni–Fe hybrid nanocube/Nafion/GCE in 0.1 M NaOH containing various concentrations of glucose from 1.0 mM to 8.0 mM (scan rate at 50 mV s−1).24 (b) LSV curves for the Ni-MOF/NF in 0.1 M NaOH in the presence of varying glucose concentrations from 0 to 7 mM (scan rate at 30 mV s−1).25 (c) DPV curves of Ni–Fe nanocube/Nafion/GCE in 0.1 M NaOH with various glucose concentrations: 0, 0.1, 0.2, 0.3, 0.4, 0.5, 0.6, 0.7, 0.8, 1.0, 1.2, 1.4, and 1.6 mM, potential range: 0.3–0.7 V.24 (d) Current–time curves at 0.63 V obtained for increasing glucose concentrations ranging from 0 mM to 0.7 mM in 0.1 M NaOH.24 Reproduced from ref. 24 and 25 with permission from The Royal Society of Chemistry and the Centre National de la Recherche Scientifique, copyright 2019, 2018. | ||
The CV method achieves the measurement of the electrochemical system by applying a triangular wave potential, which is the most basic electrochemical research method. It has been widely used in the study of the properties and mechanisms of electrochemical reactions and the kinetic parameters of electrode processes. The CV method can be used to judge the reversible degree of the electrode process and help researchers to explore the reaction mechanism. In the design of glucose non-enzyme sensors, the CV method is usually used to characterize the fabrication process of the sensor and explore the kinetic details of glucose catalysis at the working electrode. In addition, the CV method can be used to find the linear relationship between glucose concentration and electrochemical signal, which is a very widely used electrochemical technology.
The LSV method is a method to measure the corresponding polarization current at different potentials. The potential on the working electrode increases linearly with the scanning rate. However, compared with CV, the LSV method is less frequently used in glucose non-enzyme sensor related experiments. The LSV curve is a peak curve and can be described by Randles–Sevcik eqn (1) as follows:
| ip = 2.69 × 10⁵n3/2D1/2v1/2Ac | (1) |
The mechanism of the DPV method is to select the excitation signal as the sum of the pulse with a step potential or a linear potential and a fixed amplitude. The current is sampled twice before and after the pulse signal is used. The electrolytic current is obtained by subtracting the two currents. The DPV method is suitable for trace analysis because of its low background current, high detection sensitivity and low detection limit. DPV technology is usually used to find the linear relationship of the sensor and is used frequently.
EIS measured the alternating current impedance of the electrode by controlling the alternating current potential of the electrode to make the alternating current change in accordance with the rule of sinusoidal wave with a small amplitude. Through EIS experiments, the resistance of the corresponding electrode can be obtained to determine its conductivity. EIS technology is mainly used to characterize the sensor assembly process, and the change of impedance is measured to indicate whether the functional nanomaterial successfully adheres to the electrode surface.
The amperometric response method is a control potential analysis method, by which the i–t curve of current variation with time is obtained. This method can be used to explore the dynamic reaction process of the electrode with high sensitivity. This electrochemical technique is frequently used in glucose sensor experiments, which can not only be used to find the linear relationship between glucose concentration and electrochemical signal, but also be used in anti-interference experiments.
3. Influencing factors of glucose non-enzyme sensors
On the premise of ensuring accuracy, in order to fully explore the performance of the sensor and seek a wider linear range, higher sensitivity and lower detection limit, the experimental conditions should be optimized during the assembly process of the sensor, including the pH of the supporting electrolyte, the amount of functional materials on the electrode and the scan rate.3.1 The pH of the supporting electrolyte
The reaction of the analyte on the electrode usually involves H+ and OH−, that is, the pH of the supporting electrolyte will have a great influence on the electrochemical signal. The involvement of protons and electrons in the reaction process can be determined by using the Nernst equation to investigate the relationship between electric potential and pH. For example, when the slope is −58.5 mV pH−1, it indicates that the number of protons involved is equal to the number of electrons.26,27In the design of glucose non-enzyme sensors, the supporting electrolyte is usually NaOH solution with a concentration of 0.1 M, and in some reports, the concentration reached 0.5 M.28–30 In addition, a few glucose non-enzyme sensors chose neutral PBS solution as the supporting electrolyte.31,32 Due to the low glucose activity under acidic conditions, there are few reports about it.33 The reason why glucose is easily catalysed by working electrodes under alkaline conditions has been explained by Sun et al. using density functional theory (DFT) calculations.34 Sun et al. designed a glucose non-enzyme sensor based on cobalt phosphide (CoP) nanorods and calculated that glucose with OH− was more likely to participate in the reaction than glucose solution. In the process of catalysis, electrode materials played a role in accelerating electron transfer and improving catalytic performance. Gluconic acid was produced by the transfer of OH− from the CoP surface without any transition states, as shown in eqn (2):
| Glucose + 2OH− → gluconolactone + 2H2O + 2e− | (2) |
Physiological environment analysis is tremendously important for accurate detection of glucose. The pH of human blood is 7.3–7.5. A great deal of research has been focused on the detection of glucose under physiological pH conditions. Zhang's group reported a teamed boronate affinity-based molecular imprinting microelectrode module with active temperature regulation that was fabricated for blood glucose detection in a physiological environment.35 Zang et al. present a novel copper nanowires/MOFs/graphene oxide nanocomposite for glucose detection in a neutral pH environment. The sensor exhibits a wide linear range (20–26.6 mM) and a low detection limit of 7 μM, which can be used for the analysis of glucose in human serum samples.36 Mello et al. studied the electro-oxidation of glucose using cyclic voltammetry under physiological pH conditions (pH = 7) on low-index Pt single crystal surfaces. It is clearly seen that glucose electro-oxidation is strongly dependent of the electrode structure in terms of catalytic activity and reaction mechanism. The final outcome of glucose electro-oxidation is mainly associated with the production of cyclic carbonate on Pt(100) sites in neutral solution.37 Ernst et al. reported the process of electrooxidation of glucose studied in a buffer solution with pH 7.5. It is observed that the rate determining step of the experiment may be the dehydrogenation of the C1-atom adjacent to the hemiacetal OH-group and the primary oxidation product is gluconolactone.38 Therefore, glucose detection under neutral pH is also accomplished.
Electrochemical detection of glucose in acid-supported electrolytes has not been reported. However, in the process of glucose photochemical detection, acidic medium is allowed. For example, in the process of glucose detection by Fe-PCN-224 photochemical detection, the electrolyte is an acetic acid buffer system with pH 3.5.39
3.2 Scan rate
The scan rate is closely related to the peak shape of the electrochemical signal. Generally, the peak strength of the electrochemical signal is positively correlated with the scan rate. In the CV curve, the details of electrode reaction kinetics can be obtained by seeking the linear relationship between sweep velocity and response current. If there is a linear relationship between the response current and the square root of the sweeping velocity, it demonstrates that a diffusion controlled redox reaction occurs on the electrode; if there is a linear relationship between the response current and the scan rate, then there is an adsorption controlled redox reaction on the electrode. In the design of glucose non-enzyme sensors, the scan rate is generally controlled below 100 mV s−1, such as 50 mV s−1.3.3 Selectivity
The ultimate goal of an electrochemical glucose sensor is to be applied to clinical detection. It is well known that blood is a complex system consisting mainly of plasma and blood cells. The plasma is mainly composed of water, small biological molecules and plasma proteins. Glucose is present in the plasma. Serum is a non-coagulable mixture formed by the removal of fibrinogen from plasma, retaining most of the components in the plasma, and can maintain blood viscosity, pH, and osmotic pressure. In addition to glucose, serum also includes inorganic salt ions, such as Na+, K+, Ca2+, Cl−etc., small biotrophic molecules such as sugars, amino acids, and some cell metabolites. These substances should be fully considered as interferents in selective experiments with electrochemical glucose sensors.In general, amperometric methods are usually used for selective experimentation. At the same time, CV and DPV technology have also been reported for the selectivity study. In the design of an experimental process, special attention should be paid to the selection of potential, the types and concentrations of interfering substances and the supporting electrolyte, which has a very important influence on the selective study. The chosen potential should have a strong catalytic effect on glucose, while no catalytic effect or little effect on the interferents. Generally, potential optimization should be carried out first before the selectivity study of an amperometric experiment. The interferents should contain the serum and compositions which simulate the real environment of the human blood. Meanwhile, the concentration of interferents is higher by several times that of glucose, so as to make the experimental results more convincing. The testing environment usually selects the optimized supporting electrolyte solution that has been selected for previous electrochemical tests.
Luo et al. constructed an electrochemical glucose sensor using Cu-MOF. The selectivity of an electrochemical sensor experiment by choosing sucrose, fructose, NaCl, ascorbic acid, uric acid, dopamine hydrochloride and L-cysteine as interferents. The experimental results show that an obvious current corresponding to the addition of glucose emerged and no obvious current change corresponding to the addition of the interferents, proving that the glucose sensor has a superior selectivity.40 Xin et al. used porous flower-like Ni5P4 to construct an electrochemical glucose sensor. The selective experiment was conducted by selecting uric acid, ascorbic acid, and dopamine as interferents by DPV technology. The oxidation peak of glucose does not change after the addition of interferents, proving that the electrochemical sensor has good selectivity.41 In addition, Janyasupab et al. investigated the selectivity of electrochemical glucose sensors based on bimetallic CoFe-nitrogen-doped graphene using CV technology.42
4. Non-enzyme electrochemical sensors
At present, a variety of glucose non-enzyme sensors have been developed, which is mainly due to the rapid development of the nano field. The synthesis strategy of multi-functional and multi-morphologic nanomaterials has been developed, enriching the field of nanotechnology and bringing infinite possibilities for electrochemical sensors. According to the present research progress, there are three methods for the material synthesis of non-enzyme electrochemical glucose sensors: (i) small size, porous precious metal materials such as nanotubes, nanoflowers and nanoclusters were synthesized by using nanotechnology; (ii) combining with other materials, such as metals, inorganic carbon materials, metal–organic frameworks materials, organic materials, etc.; (iii) the surface of the electrode or nanomaterial is modified to increase the roughness and thus add the electrochemical active site.4.1 Types of materials involved in the electrochemical sensor
In the design of glucose sensors, there are many types of substances involved, such as metals and their compounds, inorganic carbon materials, conductive polymers, metal–organic frameworks (MOFs), etc. These materials, individually or in combination, construct the sensor's working electrode. These composite materials give full play to their own advantages in the construction of glucose non-enzyme sensors, thus improving the performance of non-enzyme sensors, such as wider linear range, higher sensitivity and lower detection limit.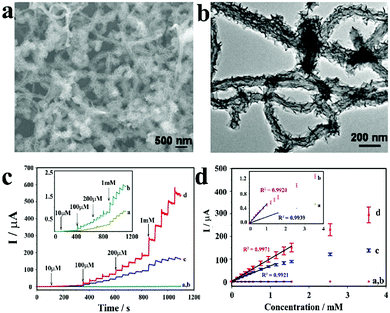 | ||
| Fig. 5 (a) SEM image of NiCoO2@CNT. (b) TEM image of NiCoO2@CNT. (c) Amperometric responses to the successive additions of glucose. (d) The calibration curves obtained in the 0.1 M NaOH/NaAc buffer (pH 12.0). Reproduced ref. 47 with permission from Elsevier B.V., copyright 2015. | ||
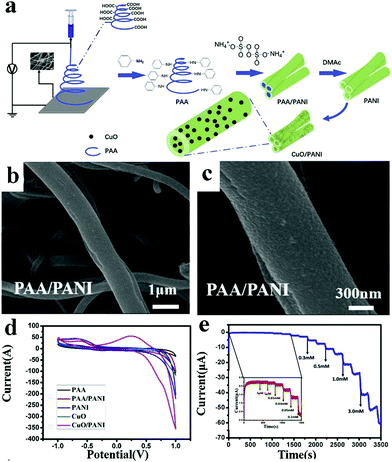 | ||
| Fig. 6 (a) Schematic diagram of CuO/PANI nano-hybrid fiber synthesis. (b) Low magnification SEM image of the PAA hybrid nanofiber covered by PANI. (c) High magnification SEM image of the PAA hybrid nanofiber covered by PANI. (d) CV curves of GCEs modified with CuO/PANI nano-hybrid fibers. (e) Amperometric response of GCEs modified with CuO/PANI nano-hybrid fibers. Reproduced ref. 48 with permission from Elsevier B.V., copyright 2019. | ||
![[thin space (1/6-em)]](https://www.rsc.org/images/entities/char_2009.gif) 886 μA cm−2 mM−1 and a detection limit as low as 1.3 nM (Fig. 7).52
886 μA cm−2 mM−1 and a detection limit as low as 1.3 nM (Fig. 7).52
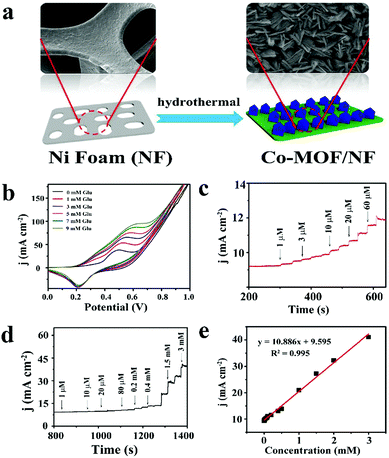 | ||
| Fig. 7 (a) Schematic diagram of Co-MOF/NF synthesis. (b) CV curves of Co-MOF/NF in 0.1 M NaOH in the presence of various glucose concentrations. (c) and (d) The amperometric responses of Co-MOF/NF with successive addition of glucose in 0.1 M NaOH. (e) Calibration curve for the current response to different glucose concentrations. Reproduced ref. 52 with permission from Elsevier B.V., copyright 2018. | ||
From the above discussion, the construction of glucose non-enzyme sensors is based on the organic combination of various materials, which fully reflects the method of combination. Table 1 shows the performance of some glucose non-enzyme sensors based on metals, carbon materials, conductive polymers and MOFs.
| Electrode matrix | Sensitivity (μA mM−1 cm−2) | Linear range (mM) | Detection limit (μM) | Electrolyte | Ref. |
|---|---|---|---|---|---|
| NiCoP/Ti | 14![[thin space (1/6-em)]](https://www.rsc.org/images/entities/char_2009.gif) 856 856 |
1–7 | 0.13 | 0.1 M NaOH | 53 |
| Ni–Co–S/TM | 3291.5 | 0.001–3 | 0.12 | 0.1 M NaOH | 54 |
| Fe3N–Co2N/CC | 4333.7 | 0.0001–1 | 0.077 | 0.1 M NaOH | 55 |
| NiO–CdO nanofiber | 32.9 | 0–1.94 | 1.28 | 0.1 M NaOH | 56 |
| NiCo/NiCoOx–FeOOH | 7138 | 0.001–8 | 0.82 | 0.1 M NaOH | 57 |
| CuCo2O4 NWAs/CC | 3930 | 0.001–0.93 | 0.5 | 0.1 M NaOH | 58 |
| CuTiPNPs | — | 0.025–2 | 7 | 0.1 M NaOH | 59 |
| Cu NF@ AuNPs–GO NFs | — | 0.001–0.1 | 0.018 | 0.1 M NaOH | 60 |
| amorphous Co–Ni hydroxid | 11911.5 | 0.0025–5 | 0.127 | 0.5 M NaOH | 61 |
| NiCo–LDH/CC | 5.12 | 0.001–1.5 | 0.12 | 0.1 M NaOH | 62 |
| Cu-BTC (MOFs) | 943.3 | 0.0005–2.8 | 0.1 | 0.1 M NaOH | 63 |
| PAA-VS-PANI/GPL-FePc/GOx-CH | — | 1–20 | 6.4 | 0.1 M PBS | 64 |
| g-C3N4 | — | 1–12 | 11 | PBS (pH = 6.8) | 65 |
| GA@GNs/GNs | — | 0.001–16 | 4 × 10⁻⁶ | 0.1 M PBS | 66 |
| Pt/PANI/rGO/CuO | 1252 | 0–13 | 1.5 | 0.1 M NaOH | 67 |
| Chitosan–polypyrrole | — | 0.5–147 | 0.155 | 0.1 M PBS | 68 |
| Ni–Co–S/PPy/NF | — | 0.002–0.14 | 0.82 | 0.1 M NaOH | 69 |
| 0.14-2 | |||||
| APBA-PEI | — | 0.5–50 | 2.5 × 10⁻⁵ | 0.1 M NaOH | 70 |
| NiP0.1SnOx/PANI/ | 1625 | 0.01–1 | 0.13 | 0.1 M NaOH | 71 |
| CuO/cotton | 1325 | 1–10 | |||
| NiCo2O4/PPy/NF | 3059 | 0.001–20 | 0.22 | 0.1 M NaOH | 72 |
| Au-N-GQDs | — | 1.0 × 10⁻⁵–5 × 10⁻³ | 3.3 × 10⁻³ | 0.1 M NaOH | 73 |
| CPO-27-NiII | 40.95 | 0.04–6 | 1.46 | 0.1 M NaOH | 74 |
| Ag@ZIF-67/GCE | 0.379 | 0.002–1 | 0.66 | 0.1 M NaOH | 75 |
| Ni-MOF | 14![[thin space (1/6-em)]](https://www.rsc.org/images/entities/char_2009.gif) 845 845 |
0.04–2 | 0.085 | 0.1 M NaOH | 25 |
| Conductive Ni-MOF | 21![[thin space (1/6-em)]](https://www.rsc.org/images/entities/char_2009.gif) 744 744 |
0.001–8 | 0.66 | 0.1 M NaOH | 76 |
4.2 Metal non-enzyme electrochemical sensors
With the exception of alkali metals, most metals are good conductors of heat and electricity. Due to the strength of the metal bond, the properties of different metals show great differences.At present, precious metals represented by gold and platinum and transition metals represented by cobalt and nickel have been widely used in the design of glucose non-enzyme sensors.
Platinum and gold are widely used in the construction of glucose sensors due to their excellent electrochemical performance, sufficient stability and reproducibility. In order to improve the catalytic ability of noble metals to glucose, so as to achieve the best performance of the sensor, the synthesis of nano-sized, porous, rough surface precious metal materials has become a research hotspot.77–80 Some nanostructures and the electrochemical performance of the glucose sensors are shown in Fig. 8.77,80
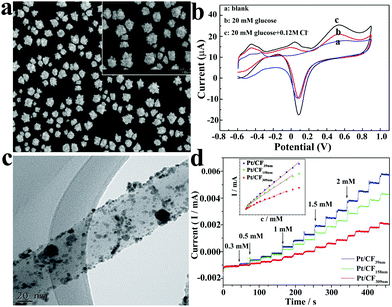 | ||
| Fig. 8 (a) SEM image of Pt nanoflowers.77 (b) CV curves of the Pt nanoflower electrode in 0.2 M neutral PBS.77 (c) TEM image of the Pt nanoparticles on carbon fibers.80 (d) Amperometric current–time response of Pt/CF in 0.1 M NaOH solution after the successive injection of different concentrations of glucose.80 Reproduced ref. 77 and 80 with permission from Elsevier B.V., copyright 2011, 2015. | ||
Platinum and gold can be used in many applications, such as monetary metal, jewellery, pharmaceuticals (such as gold nanoparticles for psoriasis treatment81), and chemical catalysts. Generally speaking, large bulks of gold and platinum will not be directly used in the catalytic process of the reaction, for many reasons. Taking platinum as an example, it has excellent catalytic ability for glucose in neutral solution, but it also has disadvantages, in the presence of chloride ions, platinum's ability to oxidize glucose is reduced; in addition, it is easily affected by uric acid and other interferents, and has a poor selectivity.82 In order to overcome these disadvantages, various means are used to synthesize nanoscale small size precious metal materials to increase the specific surface area and roughness, which is one of the strategies to solve the problem. Yeast extract was introduced into the synthesis of Pt nanoparticles; it contains many biological molecules, such as amino acids and proteins, which provides enough sites for the reduction of H2PtCl6, and at the same time, the yeast extract can be used as a stabilizer, so it was selected as the template for the synthesis of Pt nanoclusters and enriched the preparation methods of noble metal nanomaterials.83 Guo et al. electrodeposited platinum nanocrystals with an average diameter of 960 nm on a gold electrode using ultrasonic electrodeposition. In neutral medium, the non-enzyme sensor showed good catalytic performance for glucose with a sensitivity of 1.87 μA cm−2 mM−1, linear range from 1 mM to 16 mM, and detection limit of 48 μM.77
In the process of glucose oxidation, Au has a low oxidation potential and a strong selectivity. Since its 3D orbitals are fully filled, Au also has a strong anti-interference ability; however, Au has low electrocatalytic capacity and high cost.84 Zhong et al. creatively synthesized three-dimensional porous gold networks using an egg shell membrane as a template; this Au nanostructure has a very good catalytic effect on glucose, the electrochemical sensor using Au networks as the working electrode has good performance with the linear range 1.0–500 μM and 4.0–12 mM, and the detection limit is 0.2 μM (Fig. 9).85 Shu et al. electrodeposited dendrite-like Au nanostructures on GCE, a non-enzyme sensor that also has superior performance.86 In addition, platinum nanotubes, gold foam and other structures have also been used to design glucose non-enzyme sensors.87–89 The reaction mechanism of platinum and gold catalysing glucose has been discussed in detail in related articles, and relevant details can be consulted.90–92
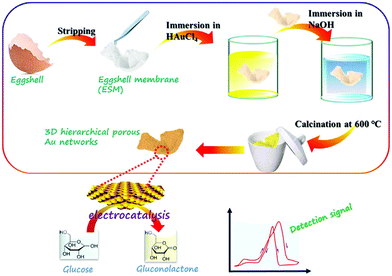 | ||
| Fig. 9 Schematic diagram of 3D hierarchical porous Au network synthesis. Reproduced ref. 85 with permission from Elsevier B.V., copyright 2017. | ||
In addition to the elemental states discussed above, precious metals often appear in the form of alloys in the design of nonenzyme sensors. In terms of constituent elements, the alloy includes precious-precious metals, precious-other metals (metallic oxide) and in terms of the number of metals, the alloy combination includes bimetallic alloys and trimetallic alloys. Lin et al. constructed an electrochemical sensor by loading a PtAu alloy onto a GCE electrode. The presence of Au reduces the surface energy of Pt, which weakens the force between Pt and gluconolactone, thus increasing the stability of the catalyst based on the synergistic effect of the metals (Fig. 10).93 Zhao et al. reached a similar conclusion in the construction of electrochemical sensors using PdCr alloy. Compared with single metal, the current density of the electrochemical sensors based on the PdCr alloy was greatly improved and could prevent Cl− from deactivating the catalyst.94 Jia et al. constructed an electrochemical sensor based on PtAu alloy on a GCE electrode. The performance of the sensor based on alloy material is greatly improved. With the increasing of Pt, the response current firstly increased and then decreased, indicating that the proportion of metal in the alloy would affect the catalytic performance. This can be explained by the synergistic effect of the alloy and the change of catalytic sites.95 Cao et al. also found that the bimetal PtCu alloys are superior in stability and catalytic efficiency due to electron coupling and ligand effects. PtCu alloy provides abundant activation sites for glucose oxidation, Pt atoms provide adsorption sites, and Cu atoms promote the formation of Cu-OR species, and can be used as electron donors.96 In addition, synergies also exist in the study of electrochemical glucose sensors built by Au–Ni alloy, Au@Ag core nanorods, and Au–Ir alloy nanofibers.97–99 Chakraborty et al. attached Au nanoparticles to CuO nanorods and demonstrated glucose sensitivity of 2009 μA mM−1 cm−2, linear range of 5 μM to 1.325 mM, detection limit of 0.17 μM, and the synthesis schematic diagram and reaction mechanism are shown in Fig. 11.100
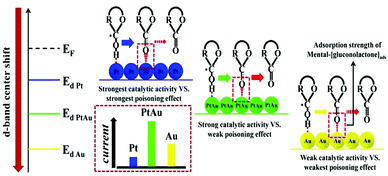 | ||
| Fig. 10 Synergistic effect of PtAu alloy in the process of glucose oxidation. Reproduced ref. 93 with permission from Elsevier B.V., copyright 2020. | ||
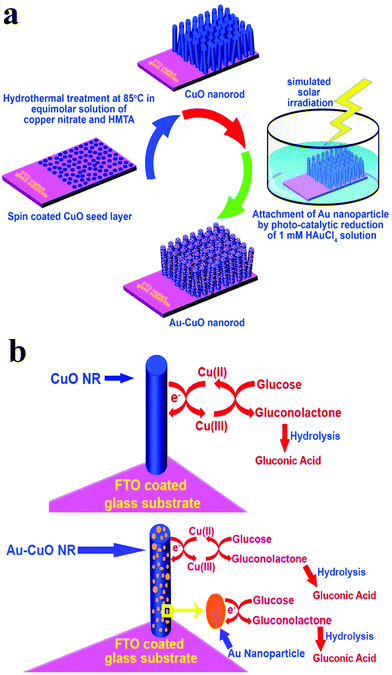 | ||
| Fig. 11 (a) Schematic diagram of Au@CuO nanomaterial synthesis; (b) schematic representation of the glucose sensing mechanism. Reproduced from ref. 100 with permission from Elsevier B.V., copyright 2018. | ||
The combination of precious metals and carbon materials has become one of the trends in the design of glucose electrochemicalsensors, specifically, carbon-based materials generally exist as supports. Li et al. used PtPd nanoparticles loaded with ionic liquid functionalized reduced graphene to construct an electrochemical sensor. The corresponding time of the sensor was as low as 3 seconds, and the linear range was from 0.1 to 22 mM, with good repeatability, stability and selectivity.101 Zhao et al. used electrodeposition to attach PtNi nanoparticles to multiwalled carbon nanotubes and systematically investigated the effect of Pt/Ni ratio on catalytic performance. The experimental results showed that when the ratio of Pt to Ni was 3![[thin space (1/6-em)]](https://www.rsc.org/images/entities/char_2009.gif) :
:![[thin space (1/6-em)]](https://www.rsc.org/images/entities/char_2009.gif) 7, the electrochemical sensor had the best performance with the detection range of glucose up to 15 mM and the detection limit was 0.3 μM (Fig. 12).102 In addition to the type and number of metals, the size of carbon material also affects the performance of the sensor. Ye et al. studied the influence of carbon fiber diameter on the performance of a Pt nanoparticle-based glucose sensor, and found that higher curvature and smaller diameter resulted in a greater number of Pt atoms on the surface, and the performance of the sensor is excellent with the linear range of 0.3–17 mM and the detection limit of 33 μM.80 Nonenzymatic glucose sensors based on noble metals have been widely reported. The performance of some sensors is shown in Table 2.
7, the electrochemical sensor had the best performance with the detection range of glucose up to 15 mM and the detection limit was 0.3 μM (Fig. 12).102 In addition to the type and number of metals, the size of carbon material also affects the performance of the sensor. Ye et al. studied the influence of carbon fiber diameter on the performance of a Pt nanoparticle-based glucose sensor, and found that higher curvature and smaller diameter resulted in a greater number of Pt atoms on the surface, and the performance of the sensor is excellent with the linear range of 0.3–17 mM and the detection limit of 33 μM.80 Nonenzymatic glucose sensors based on noble metals have been widely reported. The performance of some sensors is shown in Table 2.
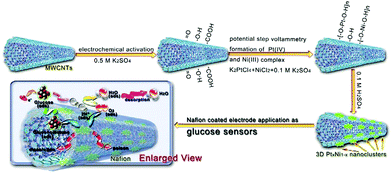 | ||
| Fig. 12 Schematic diagram of the synthesis and reaction mechanism of the glucose sensor based on the flower-like 3D PtxNi1−x/MWCNT catalysts. Reproduced ref. 102 with permission from Elsevier B.V., copyright 2016. | ||
| Electrode matrix | Sensitivity (μA mM−1 cm−2) | Linear range (mM) | Detection limit (μM) | Electrolyte | Ref. |
|---|---|---|---|---|---|
| Pt nanotube arrays | 0.1 | 2–14 | 1 | 0.1 M NaOH | 88 |
| Nanoporous Pt | 642 | 0.1–1.5 | — | 0.1 M NaOH | 103 |
| Pt NFs | 1.87 | 1–16 | 48 | 0.1 M NaOH | 77 |
| Pt-C NF | 2.03 | 0.3–17 | 33 | 0.1 M NaOH | 80 |
| Pt19.2/f-CNF80.8 NF | 22.7 | 0–10 | 0.42 | 0.1 M PBS | 104 |
| Pt film/Cu foam | 9.62 | 1–11 | 385 | 0.1 M PB | 105 |
| Pt 3D dendritic | 12.1 | 1–20 | 1.2 | 0.1 M NaOH | 106 |
| Pt nanoflower | 11 | 1–7 | — | 0.1 M NaOH | 107 |
| PdCuPt NC | 553 | 1–10 | 1.29 | 0.1 M NaOH | 130 |
| Pt-Pb NW | 11.25 | 0–11 | 8 | 0.1 M PB | 108 |
| Pt NPs/CNTs | — | 0.028–46.6 | 28 | 0.1 M NaOH | 109 |
| Pt–Cu nanochains | 135 | 0.01–14 | 2.5 | 0.1 M NaOH | 96 |
| Pt Nps/graphene | 6.36 | 0.01–12.55 | 1 | 0.1 M NaOH | 110 |
| Au foam | — | 0.0005–12 | 0.14 | 0.3 M NaOH | 89 |
| Au-Co/GO | — | 0.001–0.1 | 0.18 | 0.1 M PBS (pH = 7.4) | 111 |
| Au-CuO/FTO | 2009 | 0.005–1.325 | 0.17 | 0.1 M NaOH | 100 |
| Au-NPs/ZnO-NRs | 157.34 | 0.5–10 | 55 | 0.1 M NaOH | 79 |
| Au NPs/Ni(OH)2 NS | 82.71 | 0.002–6 | 0.66 | 0.1 M NaOH | 112 |
| Au@CuO NWs | 4398.8 | 5 × 10⁻⁵–5.9 | 0.5 | 0.1 M NaOH | 113 |
| Porous Au | 11.8 | 2–10 | 5 | 0.1 M NaOH | 114 |
| Nanoporous Au film | 66.0 | 1 × 10⁻⁵–11 | 8.7 | 0.1 M NaOH | 115 |
| 3D porous Au-graphene | 5.2 | 0.1–2 | 25 | 0.1 M PBS, (pH = 7.4) | 116 |
| 4.56 | 2–16 | ||||
| Macroporous Au–Pt | 39.53 | 1–20 | 25 | 0.1 M NaOH | 129 |
| 3DGFE | 46.6 | 0.005–10 | 3.2 | 0.1 M NaOH | 117 |
| Au dendrite | 190.7 | 0.1–25 | 50 | 0.1 M PB | 86 |
| GOD/AuNPs/rGO | — | 0.005–0.9 | 0.08 | 0.2 M PBS (pH = 7.4) | 118 |
| Pt/Pb CNTs | 17.8 | Up to 11 | 1.8 | 10 mM PBS | 119 |
| PdCu alloy | — | 1–30 | 1.9 | 0.1 M NaOH | 120 |
| PtCu flowers | — | 0.01–2 | 0.1 | PBS | 78 |
| Pt/Ni@rGO | 171.92 | 0.002–5 | 6.3 | 0.1 M NaOH | 121 |
| Pt–Au alloy/Si substrate | 352 | 0.006–11 | 6.0 | 0.1 M NaOH | 122 |
| Pt–Au/CD-R | 0.25 | 1–33 | 5 | 0.1 M PB | 123 |
| PtAu/C | 4.7 | 0–10 | 2 | 0.1 M PBS (pH = 7.4) | 124 |
| PtAu dendritic | 31.2 | 0–7.5 | — | 0.1 M NaOH | 125 |
| Pt2Pb NPs | — | 0–10 | — | 0.1 M PBS (pH = 7.4) | 126 |
| PtAu/MWCNTs | 10.7 | 0–24.44 | 10 | 0.1 M PBS (pH = 7.4) | 127 |
| Pd/Au cluster | 75.3 | 0.1–30 | 50 | 0.1 M NaOH | 128 |
As a common transition metal element, nickel is widely used in catalytic chemistry. Previous reports have demonstrated that nickel nanoparticles can be used in catalysis of organic reactions and can directly oxidize glucose in alkaline media.131,132 However, nickel-based catalysts also have obvious disadvantages, such as poor electrical conductivity and mechanical strength, being easily affected by the external environment, and agglomeration occuring after a period of time.133,134 Ni-based materials are widely used in glucose catalysis such as Ni, NiO, Ni(OH)2, Ni3N, Ni2P, Ni3(PO4)2, Ni-MOF and Ni alloys discussed above since Fleishman et al. demonstrated that Ni can partially electrooxidize organic matter under alkaline conditions.135,136 The electrooxidation of glucose occurs on the surface of nickel-based materials, and electron transfer occurs between the Ni3+/Ni2+ redox couple, regardless of the original form of nickel-based materials.137 The mechanism of nickel-based material detecting glucose is shown in the following eqn (3)–(5):138,139
| Ni + 2OH− → Ni(OH)2 + 2e− | (3) |
| Ni(OH)2 + OH− → NiOOH + H2O + e− | (4) |
| NiOOH + glucose → Ni(OH)2 + glucolactone | (5) |
Lu et al. directly used the commercial Ni foam (NF) as the working electrode to detect glucose. The linear range of the sensor was 0.05–7.35 mM, and the detection limit was 2.2 μM, which may be the simplest electrochemical glucose sensor based on Ni-based materials.140 In the electrocatalytic process of glucose, Ni nanoparticles need the assistance of supports. For example, for graphene, Darvishi et al. used Ab Initio theoretical calculation and found that Ni element attached to the surface of graphene in the form of Ni13 nanoclusters to complete the catalysis of glucose.133 In addition, silica nanochannel membrane as a support has also been reported.141 Compared with nickel, NiO has higher stability and lower toxicity.142 Guo et al. loaded NiO on NF and constructed an electrochemical glucose sensor with a linear range of 0.005 mM to 5.5 mm and a detection limit of 0.46 μM.143 Similar to nickel foam, carbon nanosheets and carbon nanotubes can be used as supports in NiO electrochemical sensors, and the electrochemical glucose sensor based on Ni(OH)2 is very similar to NiO.29,135,144 In recent studies, nickel nitrides and phosphides have attracted attention due to their advantages in corrosion resistance and electron transfer, and these electrochemical sensors have shown excellent performance.145–147 As a porous material, Ni-MOF is also used to detect glucose, and the pores in the material provide excellent adsorption sites for glucose.74 The performance of some nickel-based glucose sensors is shown in Table 3.
| Electrode matrix | Sensitivity (μA mM−1 cm−2) | Linear range (mM) | Detection limit (μM) | Electrolyte | Ref. |
|---|---|---|---|---|---|
| Ni NP rGO/GCE | 0.0025 | 0.00025–12 | 0.01 | 0.1 M NaOH | 133 |
| Ni 3D porous film | 2900 | 0.0005–4 | 0.07 | 0.1 M NaOH | 134 |
| 3D NiO/Ni foam | 6658 | 0–5.5 | 0.46 | 0.1 M NaOH | 143 |
| NiO microfiber/FTO | 1785.41 | 0.001–0.27 | 0.033 | 0.1 M NaOH | 148 |
| NiO-C/Ti foil | 582.6 | 0–2.6 | 2 | 0.1 M NaOH | 135 |
| RGO-Ni(OH)2/GCE | 11.43 | 0.002–3.1 | 0.6 | 0.1 M NaOH | 29 |
| NiO-BP2 | 2701 | 0.5–9 | 31 | 0.1 M NaOH | 144 |
| NiCo2O4/GCE | 1917 | 0.01–0.3 | 0.6 | 0.2 M NaOH | 149 |
| Ni@SNM/FTO | 62.3 | 0.01–12 | 0.44 | 0.1 M NaOH | 141 |
| Ni3N/Ti | 7688 | 0.2–1.5 | 0.06 | 0.1 M NaOH | 145 |
| Ni3(PO4)2/CSs | 219.898 | 0.005–2.5 | 1.67 | 0.1 M NaOH | 150 |
| 480.15 | 2.5–7.5 | ||||
| Ni2P NA/TM | 7792 | 0.001–3 | 0.18 | 0.1 M NaOH | 146 |
| NiO nanosheets | 838.09 | 0.0005–2.31 | 0.145 | 0.1 M NaOH | 151 |
| NiCPNP/rGO/GCE | — | 0.01–8.75 | 0.14 | 0.1 M NaOH | 152 |
| Ni5P4/GCE | — | 0.002–5.3 | 0.7 | 0.1 M NaOH | 41 |
| Ni/NC-800 | 660.3 | 0.002–4.658 | 0.12 | 0.1 M NaOH | 153 |
| Ni(OH)2/TiO2 | 192 | 0.03–14 | 8 | 0.1 M NaOH | 154 |
| 3D porous Ni foam | — | 0.05–7.35 | 2.2 | 0.1 M NaOH | 140 |
| Ni nanoflakes | 7320 | 0.05–0.6 | 1.2 | 0.5 M NaOH | 155 |
Copper-based materials are also very popular catalytic materials for glucose due to their lower cost, non-toxicity and high electrochemical activity. Like nickel-based materials, copper-based materials can be used in many forms to electrically catalyse glucose. Metallic copper, CuO, Cu2O, Cu(OH)2, Cu3N, CuS and Cu3P participate in the reaction in various forms of morphological structures, such as nanorod, nanowire, nanoflower, nanoflake and nanocube. Considering high aspect ratio, metallic copper often appears in electrochemical glucose sensors in the form of nanowires. Zhang et al. used Cu nanowires to electrooxidize glucose, and the detection limit of the sensor was 35 nM with a sensitivity of 420.3 μA mM−1 cm−2.156 Na et al. prepared Cu nanowires by a hydrothermal method and further reduced the detection limit based on Cu nanowire sensors to 1 nM.157 In order to further prevent Cu from being oxidized and improve the performance of glucose sensors, Ye et al. used a carbon shell wrapped around Cu cubes to form a core–shell structure to construct the sensor. The linear range of the sensor is 40 μM to 40 mM, with sensitivity of 2565 μA mM−1 cm−2 and detection limit of 21.35 μM (Fig. 13).158 CuO is the most widely studied Cu-based material, and its catalytic glucose mechanism is similar to that of Ni, which is mainly completed by the Cu3+/Cu2+ redox couple under alkaline conditions. The catalytic mechanism is shown below (6) and (7):159
| CuO − OH− → CuOOH + e− | (6) |
| CuOOH + glucose + e− → glucose + CuO + OH− | (7) |
 | ||
| Fig. 13 Schematic diagram of well-aligned Cu@C core–shell nanocube synthesis. Reproduced from ref. 158 with permission from Elsevier B.V., copyright 2019. | ||
CuO itself has poor conductivity and selectivity, when combined with precious metals or carbon materials, the sensor shows good catalytic performance for glucose.113,160,161 In addition, Fu et al. and Sun et al. successfully synthesized copper sulfide, copper nitride and copper phosphide respectively and applied them to electrochemical detection of glucose. The sensor also showed excellent performance.162–164 The performance of some Cu-based sensors is shown in Table 4.
| Electrode matrix | Sensitivity (μA mM−1 cm−2) | Linear range (mM) | Detection limit (μM) | Electrolyte | Ref. |
|---|---|---|---|---|---|
| Cu-NW-CNT-BL | 1907 | 0.01–2 | 0.0011 | 0.1 M NaOH | 165 |
| CuO nanotubes array | 1890 | 0.005–3 | 0.1 | 1.0 M NaOH | 166 |
| Cu3(BTC)2–CuO nanorod | 1523.5 | 1.2–5 | 1 | 0.1 M NaOH | 167 |
| Cu/Cu(OH)2 NRA/CF | 9180 | 0.001–1 | 0.45 | 0.1 M NaOH | 168 |
| CuNW_GSS | — | — | 0.001 | 0.1 M NaOH | 157 |
| Cu3N NA/CF | 52.11 | 0.001–2 | 0.013 | 0.1 M NaOH | 163 |
| Cu/CuO/Cu(OH)2 | 223.17 | 0–20 | 20 | 0.1 M NaOH | 169 |
| CuO/Cu2O film | 1950 | 0.1–6 | 1 | 0.1 M NaOH | 170 |
| CuO nanoflowers | 2217 | 0–6 | 0.96 | 0.1 M NaOH | 171 |
| Cu@C core–shell nanocubes | 2565 | 0.04–40 | 21.35 | 0.1 M NaOH | 158 |
| CuO NPs | — | 0.005–2.3 | 0.5 | 0.1 M NaOH | 172 |
| Cu-RGO | 50![[thin space (1/6-em)]](https://www.rsc.org/images/entities/char_2009.gif) 400 400 |
0.002–2 | 0.5 | 0.1 M NaOH | 173 |
| CuS-Cu2S | 1923 | 0.001–2 | 0.33 | 0.1 M NaOH | 164 |
| Cu2O/GNs | — | 0.3 to 3.3 | 3300 | 0.1 M NaOH | 174 |
| Cu nanowires | 420.3 | 0–3 | 35 | 0.1 M NaOH | 156 |
| Cu Nps/rGO | 447.7 | 0–1.2 | 3.4 | 0.1 M NaOH | 175 |
As an environmentally friendly element, cobalt-based materials are also popular in the design of glucose non-enzyme sensors. Different from nickel and copper, cobalt has more valence states, so the reaction mechanism is slightly more complex. As shown in eqn (8) and (9), the mechanism of glucose electrocatalyzed by CoP is:176
| CoOOH + OH− → CoO2 + H2O + e− | (8) |
| CoO2 + glucose + H2O → CoOOH + OH− + gluconolactone | (9) |
At present, a variety of cobalt-based materials including cobalt alloy, Co3O4, Co(OH)2 and CoOOH are involved in the design of glucose sensors in various nanostructures.177 Cobalt oxide, represented by Co3O4, is a standard semiconducting material that is biologically compatible but poorly conductive, so it is often combined with other materials, such as graphene, to form hybrids during the design of the cobalt based catalyst. Wang et al. synthesized the glucose electrocatalyst by loading the Co3O4 nanoclusters onto the three-dimensional Kenaf Stem-derived carbon (3D-KSCs), and the linear range of the sensor is 0.088 to 7 mM, and the detection limit is 26 μM.178 Xiong et al. used the microplasma-based synthesis method to load Co(OH)F nanoflowers on the carbon cloth at room temperature and the sensor's sensitivity was 1806 μA mM−1 cm−2 and the detection limit was as low as 0.75 μM.179 In addition to combining with other materials, the synthesis of new cobalt-based materials also attracted attention. Sun et al. successfully synthesized Co3N and CoP, and further improved the performance of the sensor by utilizing the excellent conductive properties of transition metal nitride and phosphide (Fig. 14).180 The sensitivity of glucose sensors based on Co3N and CoP was 3325.6 μA mM−1 cm−2 and 5168.6 μA mM−1 cm−2, and the detection limits were 1 μM and 0.5 μM, respectively.176,180 The performance of some Co-based sensors is shown in Table 5.
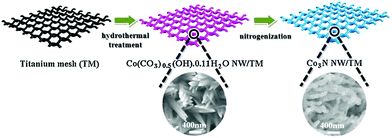 | ||
| Fig. 14 Schematic diagram of Co3N NW/TM synthesis. Reproduced ref. 180 with permission from Elsevier B.V., copyright 2017. | ||
| Electrode matrix | Sensitivity (μA mM−1 cm−2) | Linear range (mM) | Detection limit (μM) | Electrolyte | Ref. |
|---|---|---|---|---|---|
| Co3O4/NiCo2O4 DSNCs@G | 304 | 0.01–3.52 | 0.384 | 0.1 M NaOH | 181 |
| Co3O4 bio-inspired pyrolytic carbon | 1377 | 0.05–18 | 12 | 0.3 M NaOH | 178 |
| Co3O4/CuO NRA/CC | 5405 | 0.001–0.5 | 0.38 | 0.1 M NaOH | 182 |
| Co3O4/Ni heterostructure | 13855 | 0.04–3.6 | 1.0 | 0.1 M NaOH | 183 |
| Graphene–Co3O4 needle | — | 0.05–0.3 | <10 | 0.1 M NaOH | 28 |
| CoP nanowire/Ti mesh | 5168.6 | 0.0005–1.5 | 0.1 | 0.1 M NaOH | 176 |
| Co3N NW/TM | 3325.6 | 0.001–2.5 | 0.05 | 0.1 M NaOH | 180 |
| CoO–Co–NC–rGO | 3172 | 0.00005–0.01 | 0.34 | 0.1 M NaOH | 184 |
| Co2Nx/NG | 1167 | 0.01–4.75 | 6.93 | 0.1 M NaOH | 185 |
| CoSe/rGO | 480 | 0–10 | 2.5 | 0.3 M NaOH | 186 |
| CoP NR | 116.8 | 0.001–5.5 | 9 | 0.1 M NaOH | 34 |
| Co3O4 NW | 300.8 | 0.005–0.57 | 5 | 0.1 M NaOH | 187 |
| Electrode matrix | Sensitivity (μA mM−1 cm−2) | Linear range (mM) | Detection limit (μM) | Electrolyte | Ref. |
|---|---|---|---|---|---|
| Zn–Sn/Cu | 2135 | 0.0005–0.1 | — | 0.1 M NaOH | 191 |
| Mn-NiO | 3212.52 | 0.002–0.67 | 0.8 | 0.1 M NaOH | 189 |
| ZnO–Cu–ZO | — | 0.001–0.01 | 0.001 | 0.1 M NaOH | 192 |
| g-C3N4/α-Fe2O3 | — | 0.0025–0.58 | 0.58 | 0.1 M NaOH | 193 |
| CdS nanoribbon | 1.436 | 0.002–0.225 | 0.08 | 0.1 M NaOH | 194 |
| MoS2 | 570.71 | 0–30 | — | 0.1 M NaOH | 31 |
| La0.6Sr0.4Coδ3/RGO | 330 | 0.002–3.350 | 0.063 | 0.1 M NaOH | 195 |
| AgNPs–G | — | 2–10 | 10 | 0.1 M NaOH | 196 |
| AgNPs/PANINFs | — | 1–12 | 250 | 0.2 M PBS (pH = 7.4) | 197 |
| AgNPs | 540.7 | 0.0286–9.8 | 5.5 | 0.1 M NaOH | 198 |
| α-MnO2 | 3730 | 0.535-0.855 | — | 0.1 M NaOH | 199 |
| MnO2 MWCNT | — | 0.5–4.4 | 53 | 0.5 M NaOH | 200 |
| Co7Fe3/NPCSs | 795.28 | 0.001-2.2 | 401.98 | 0.1 M NaOH | 201 |
| 2.2-14 | 1 | ||||
| ZrO2–Cu(I) | — | 1–10 | 250 | 0.1 M NaOH | 202 |
| ZnO@C | 2.97 | 0.1–10 | — | 0.1 M NaOH | 203 |
| Au–Ru nanocomposite/chitosan | 240 | 0–6 | 1.7 | 0.1 M NaOH | 204 |
5. Introduction to other methods for glucose detection
In addition to immense amounts of research about nanomaterials, new methods and instruments have been developed to detect glucose in recent years, such as colorimetry,205–208 optical methods,209,210 surface plasmon resonance,211 surface acoustic wave resonator (SAW),212 paper-based analytical devices,213 molecularly imprinted devices,214etc.Luo et al. created a Surfac Acoustic Wave (SAW) glucose sensor based on Mn-doped ZnO multilayer structure. The experimental results confirmed that the sensitivity of the SAW glucose biosensor is 7.184 MHz mM−1 and the accuracy is 6.96 × 10⁻³ mM; in addition, the modified sensor has good stability and repeatability (Fig. 15a).212 Karpova et al. proposed use of a flow-through glucose biosensor to monitor diabetes by continuous analysis immediately after excretion of undiluted sweat. Based on Prussian blue and glucose oxidase immobilized in perfluorosulfonated ionomer or gel of alkoxysilane, the sensor shows a high sensitivity with the latter reaching in batch mode 0.23 A M−1 cm−2, and the detection range is from 0.001 to 1 mM (flow-through mode). Because the sensor records the dynamic glucose concentration of sweat in good agreement with the dynamic glucose level without any time delay, it thus offers broad prospects for monitoring blood glucose (Fig. 15b).215 Wen and his colleagues constructed a signal-off photocopying biosensor based on polymer phenylethnylcopper (PPhECu). The sensor's linear range was 0.0005 to 5 mM, with a detection limit of 0.16 μM (Fig. 15c).216
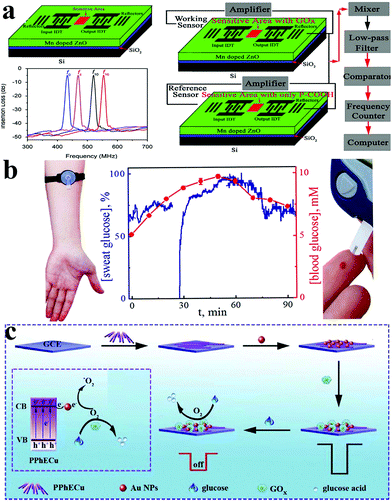 | ||
| Fig. 15 (a) Schematic diagram of the glucose biosensor based on a Mn–ZnO/SiO2/Si Love-mode SAW resonator and glucose biosensor measurement system.212 (b) The used biosensors are based on Prussian Blue and glucose oxidase immobilized in perfluorosulfonated ionomer or gel of alkoxysilane.215 (c) Synthesis and mechanism diagram of a glucose sensor based on PPhECu.216 Reproduced ref. 212, 215 and 216 with permission from Elsevier B.V., American Chemical Society, Elsevier B.V., copyright 2013, 2019, 2019. | ||
6. Summary and prospectives
In this review, we briefly summarize the development of non-enzymatic glucose sensors in recent years, and discuss the mechanisms and electrochemical techniques involved. The performance of glucose non-enzyme sensors is closely related to the selection of working electrode materials. Currently, there are mainly two approaches to improve the performance of enzyme-free glucose sensors: one is to increase the specific surface and electrochemical active sites by changing the topological structure of the material and the other is to form hybrids by doping or combining with other materials. With the continuous development of science and technology, many emerging materials, including nanodots, organic conductive materials and MOF materials, have been developed in the field of electrochemical analysis, further enriching the choice of electrocatalysts for glucose.The blood glucose concentration of normal people is maintained between 3.9 mM and 6.1 mM in a fasting state. In the process of applying the experimental results to the clinic, the detection range of the electrochemical sensors should be selected first. If the linear range of the sensor is not within the physiological concentration, the actual sample needs to be diluted to the linear range in the actual detection. Soumabha et al. used Ni60Nb40 nanoglass to construct an electrochemical sensor with a linear range of 0.0001–10 mM.217 Wu et al. fabricated a glucose sensor based on NiCo/NiCoOx hybrid nanoclusters with a linear range of 0.001–8 mM.57 Yuan et al. constructed a sensor with the linear range of 2–14 mM using a platinum-nanotubule array.88 Hu et al. built a glucose sensor based on platinum-replaced porous copper frameworks with a linear range of 1–11 mM.105 Zang et al. presented a novel copper nanowires/MOFs/graphene oxide nanocomposite for glucose detection. The sensor exhibits a wide linear range (0.02–26.6 mM), which can be used for the analysis of glucose in human serum samples.36 All of the above sensors can be used for glucose detection in the physiological concentration range, and are potential clinical candidates.
At present, common glucometers in the market are mainly divided into photochemical type and electrochemical type. Electrochemical type is mainly based on enzyme electrochemical glucose sensors. Glucose in the blood reacts with enzymes in the test paper, generating electrical signals that are converted by sensors into glucose concentrations. In the design of future glucometers, the combination of multiple technologies brings unlimited possibilities for blood glucose detection. Xu et al. developed a microelectrode module for the detection of blood glucose in a physiological environment (Fig. 16)35 and Hong et al. developed a system that could analyze glucose levels in sweat and simultaneously monitor vital signs such as heart rate (Fig. 17).218 Functional nanomaterials are expected to be used as sensing chips and the electrode of the glucometer. The glucometer will develop towards the direction of integration, miniaturization and wearability, so as to realize rapid, accurate, low-cost, real-time, noninvasive detection of glucose.
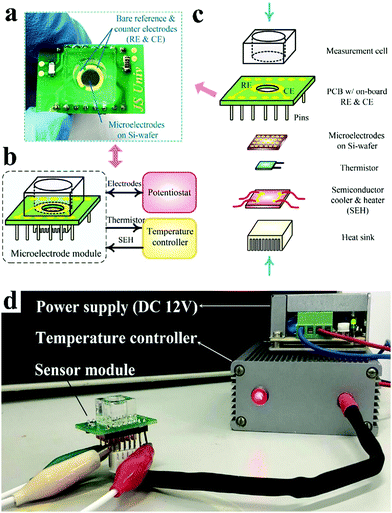 | ||
| Fig. 16 (a) Optical photograph of the microelectrode module. (b) Typical application of the microelectrode module. (c) Structure of the microelectrode module. (d) Optical photograph of the microelectrode module under working conditions. Reproduced ref. 35 with permission from Elsevier B.V., copyright 2020. | ||
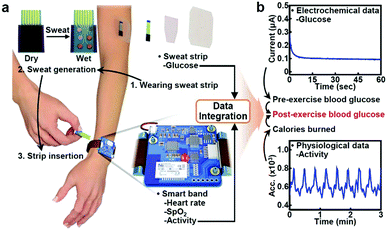 | ||
| Fig. 17 (a) Schematic illustration of the wearable health monitoring system. (b) Schematic illustration showing combined use of electrochemical and physiological data. Reproduced from ref. 218 with permission from Wiley-VCH Verlag GmbH & Co. KGaA, Weinheim, copyright 2018. | ||
Conflicts of interest
There are no conflicts to declare.Acknowledgements
This work was supported by the National Natural Science Foundation of China (No. 21575137 and 21705103), the Applied Basic Research Project of Shanxi Province (No. 201801D221392), the Graduate Education Innovation Project of Shanxi Province (2018SY057), the Graduate Education Innovation Project of Shanxi Normal University (2019XBY019), Collaborative Innovation Center for Shanxi Advanced Permanent Materials and Technology (2019-05), and the 1331 Engineering of Shanxi Province.References
- L. Zhang, J. Wang, F. Liu, Y. Xiong, Z. Liu, D. Jiang, Y. Li, D. Tu, Y. Wang and X. Pu, RSC Adv., 2017, 7, 12576–12585 RSC.
- K. Li, W. Liu, Y. Ni, D. Li, D. Lin, Z. Su and G. Wei, J. Mater. Chem. B, 2017, 5, 4811–4826 RSC.
- M. Mohammadniaei, J. Yoon, T. Lee, B. G. Bharate, J. Jo, D. Lee and J.-W. Choi, Small, 2018, 14, 1703970 CrossRef.
- Y. Ya, C. W. Jiang, L. X. Mo, T. Li, L. P. Xie, J. He, L. Tang, D. J. Ning and F. Y. Yan, Food Anal. Methods, 2017, 10, 1479–1487 CrossRef.
- Y. Fu, Q. An, R. Ni, Y. Zhang, Y. Li and H. Ke, Colloids Surf., A, 2018, 559, 289–296 CrossRef CAS.
- A. G. M. Ferrari, O. Amor-Gutierrez, E. Costa-Rama and M. T. Fernandez-Abedul, Sens. Actuators, B, 2017, 253, 1207–1213 CrossRef.
- J. Jin, J. Kim, J. Lee and N. Min, Analyst, 2011, 136, 1910–1915 RSC.
- Q. Niu, C. Bao, X. Cao, C. Liu, H. Wang and W. Lu, Biosens. Bioelectron., 2019, 141, 111445 CrossRef CAS.
- A. Pandikumar, G. T. Soon How, T. P. See, F. S. Omar, S. Jayabal, K. Z. Kamali, N. Yusoff, A. Jamil, R. Ramaraj, S. A. John, H. N. Lim and N. M. Huang, RSC Adv., 2014, 4, 63296–63323 RSC.
- A. L. Galant, R. C. Kaufman and J. D. Wilson, Food Chem., 2015, 188, 149–160 CrossRef CAS.
- E. Wiercigroch, E. Szafraniec, K. Czamara, M. Z. Pacia, K. Majzner, K. Kochan, A. Kaczor, M. Baranska and K. Malek, Spectrochim. Acta, Part A, 2017, 185, 317–335 CrossRef CAS.
- M. Sud, X. Wang, P. C. Austin, L. L. Lipscombe, G. E. Newton, J. V. Tu, R. S. Vasan and D. S. Lee, Eur. Heart J., 2015, 36, 924–931 CrossRef.
- S. A. Amiel, B. M. Frier, S. R. Heller, R. J. McCrimmon, K. Khunti, P. Aschner, B. Childs, P. E. Cryer, L. Gonder-Frederick, E. R. Seaquist, B. E. de Galan, T. Jones, S. Zoungas, L. A. Leiter, Y. Y. Luo, U. Pedersen-Bjergaard and G., The Int Hypoglycaemia Study, Lancet Diabetes Endocrinol., 2019, 7, 385–396 CrossRef.
- L. Heinemann, G. Freckmann, D. Ehrmann, G. Faber-Heinemann, S. Guerra, D. Waldenmaier and N. Hermanns, Lancet, 2018, 391, 1367–1377 CrossRef CAS.
- J. B. Buse, D. J. Wexler, A. Tsapas, P. Rossing, G. Mingrone, C. Mathieu, D. A. D'Alessio and M. J. Davies, Diabetologia, 2020, 63, 221–228 CrossRef.
- D. Papandreou, E. Magriplis, M. Abboud, Z. Taha, E. Karavolia, C. Karavolias and A. Zampelas, Nutrients, 2019, 11, 2171 CrossRef CAS.
- P. Mirmiran, S. Hosseinpour-Niazi, L. Moghaddam-Banaem, M. Lamyian, A. Goshtasebi and F. Azizi, Int. J. Vitam. Nutr. Res., 2019, 89, 37–44 CrossRef CAS.
- H. Wang and A. R. Lee, J. Food Drug Anal., 2015, 23, 191–200 CrossRef CAS.
- H. Lee, Y. J. Hong, S. Baik, T. Hyeon and D. H. Kim, Adv. Healthcare Mater., 2018, 7, 1701150 CrossRef.
- S. Ferri, K. Kojima and K. Sode, J. Diabetes Sci. Technol., 2011, 5, 1068–1076 CrossRef.
- J. Wang, Chem. Rev., 2008, 108, 814–825 CrossRef CAS.
- J. Okuda-Shimazaki, H. Yoshida and K. Sode, Bioelectrochemistry, 2020, 132, 107414 CrossRef CAS.
- L. C. Clark Jr. and C. Lyons, Ann. N. Y. Acad. Sci., 1962, 102, 29–45 CrossRef CAS.
- C. Bao, Q. Niu, X. Cao, C. Liu, H. Wang and W. Lu, New J. Chem., 2019, 43, 11135–11140 RSC.
- W. Lu and X. Wu, New J. Chem., 2018, 42, 3180–3183 RSC.
- W. Sun, M. Xi, L. Zhang, T. Zhan, H. Gao and K. Jiao, Electrochim. Acta, 2010, 56, 222–226 CrossRef CAS.
- P. Wu, Q. Shao, Y. Hu, J. Jin, Y. Yin, H. Zhang and C. Cai, Electrochim. Acta, 2010, 55, 8606–8614 CrossRef CAS.
- X. Wang, X. Dong, Y. Wen, C. Li, Q. Xiong and P. Chen, Chem. Commun., 2012, 48, 6490–6492 RSC.
- Y. Zhang, F. Xu, Y. Sun, Y. Shi, Z. Wen and Z. Li, J. Mater. Chem., 2011, 21, 16949–16954 RSC.
- T. Zhe, X. Sun, Y. Liu, Q. Wang, F. Li, T. Bu, P. Jia, Q. Lu, J. Wang and L. Wang, Microchem. J., 2019, 151, 104197 CrossRef CAS.
- Y. Zhai, J. Li, X. Chu, M. Xu, F. Jin, X. Li, X. Fang, Z. Wei and X. Wang, J. Alloys Compd., 2016, 672, 600–608 CrossRef CAS.
- Y.-L. T. Ngo, W. M. Choi, J. S. Chung and S. H. Hur, Sens. Actuators, B, 2019, 282, 36–44 CrossRef CAS.
- F. Largeaud, K. B. Kokoh, B. Beden and C. Lamy, J. Electroanal. Chem., 1995, 397, 261–269 CrossRef.
- Q. Sun, M. Wang, S.-J. Bao, Y. C. Wang and S. Gu, Analyst, 2016, 141, 256–260 RSC.
- X. Xu, C. Liu, W. Zhang and X. Zou, Sens. Actuators, B, 2020, 324, 128720 CrossRef CAS.
- G. Zang, W. Hao, X. Li, S. Huang, J. Gan, Z. Luo and Y. Zhang, Electrochim. Acta, 2018, 277, 176–184 CrossRef CAS.
- G. A. B. Mello, W. Cheuquepán and J. M. Feliu, J. Electroanal. Chem., 2020, 878, 114549 CrossRef CAS.
- S. Ernst, J. Heitbaum and C. H. Hamann, J. Electroanal. Chem. Interfacial Electrochem., 1979, 100, 173–183 CrossRef CAS.
- T. Li, P. Hu, J. Li, P. Huang, W. Tong and C. Gao, Colloids Surf., A, 2019, 577, 456–463 CrossRef CAS.
- Y. Luo, Q. Wang, J. Li, F. Xu, L. Sun, Y. Bu, Y. Zou, H.-B. Kraatz and F. Rosei, Inorg. Chem. Front., 2020, 7, 1512–1525 RSC.
- X. Xiao, Y. Wang, H. Cheng, Y. Cui, Y. Xu, T. Yang, D. Zhang and X. Xu, Mater. Chem. Phys., 2020, 240, 122202 CrossRef CAS.
- M. Janyasupab, C.-W. Liu, N. Chanlek, S. Chio-Srichan, C. Promptmas and W. Surareungchai, Sens. Actuators, B, 2019, 286, 550–563 CrossRef CAS.
- C. Zhu, D. Du, A. Eychmüller and Y. Lin, Chem. Rev., 2015, 115, 8896–8943 CrossRef CAS.
- Y. Jiao, Y. Zheng, M. Jaroniec and S. Z. Qiao, Chem. Soc. Rev., 2015, 44, 2060–2086 RSC.
- D.-W. Hwang, S. Lee, M. Seo and T. D. Chung, Anal. Chim. Acta, 2018, 1033, 1–34 CrossRef CAS.
- S. K. Krishnan, E. Singh, P. Singh, M. Meyyappan and H. S. Nalwa, RSC Adv., 2019, 9, 8778–8881 RSC.
- X. Tang, B. Zhang, C. Xiao, H. Zhou, X. Wang and D. He, Sens. Actuators, B, 2016, 222, 232–239 CrossRef CAS.
- T. Liu, Y. Guo, Z. Zhang, Z. Miao, X. Zhang and Z. Su, Sens. Actuators, B, 2019, 286, 370–376 CrossRef CAS.
- S. Kitagawa and R. Matsuda, Coord. Chem. Rev., 2007, 251, 2490–2509 CrossRef CAS.
- Q. Yang, Q. Xu and H. Jiang, Chem. Soc. Rev., 2017, 46, 4774–4808 RSC.
- J. Zhou and B. Wang, Chem. Soc. Rev., 2017, 46, 6927–6945 RSC.
- Y. Li, M. Xie, X. Zhang, Q. Liu, D. Lin, C. Xu, F. Xie and X. Sun, Sens. Actuators, B, 2019, 278, 126–132 CrossRef CAS.
- Z. Wang, X. Cao, D. Liu, S. Hao, G. Du, A. M. Asiri and X. Sun, Chem. Commun., 2016, 52, 14438–14441 RSC.
- X. Cao, K. Wang, G. Du, A. M. Asiri, Y. Ma, Q. Lu and X. Sun, J. Mater. Chem. B, 2016, 4, 7540–7544 RSC.
- D. Zhou, X. Cao, Z. Wang, S. Hao, X. Hou, F. Qu, G. Du, A. M. Asiri, C. Zheng and X. Sun, Chem. – Eur. J., 2017, 23, 5214–5218 CrossRef CAS.
- Y. Ding, Y. Wang, L. Zhang, H. Zhang and Y. Lei, J. Mater. Chem., 2012, 22, 980–986 RSC.
- D. Wu, Z. Zou, X. Lu, K. Guo, N. Yang and C. Xu, J. Mater. Sci., 2019, 54, 10695–10704 CrossRef CAS.
- X. Luo, M. Huang, L. Bie, D. He, Y. Zhang and P. Jiang, RSC Adv., 2017, 7, 23093–23101 RSC.
- D. Martín-Yerga, J. Carrasco-Rodríguez, J. L. G. Fierro, F. J. García Alonso and A. Costa-García, Electrochim. Acta, 2017, 229, 102–111 CrossRef.
- S. H. Baek, J. Roh, C. Y. Park, M. W. Kim, R. Shi, S. K. Kailasa and T. J. Park, Mater. Sci. Eng., C, 2020, 107, 110273 CrossRef CAS.
- H. Li, L. Zhang, Y. Mao, C. Wen and P. Zhao, Nanoscale Res. Lett., 2019, 14, 135 CrossRef.
- X. Wang, Y. Zheng, J. Yuan, J. Shen, J. Hu, A.-J. Wang, L. Wu and L. Niu, Electrochim. Acta, 2017, 224, 628–635 CrossRef CAS.
- L. Li, Y. Liu, L. Ai and J. Jiang, J. Ind. Eng. Chem., 2019, 70, 330–337 CrossRef CAS.
- H. Al-Sagur, K. Shanmuga sundaram, E. N. Kaya, M. Durmuş, T. V. Basova and A. Hassan, Biosens. Bioelectron., 2019, 139, 111323 CrossRef CAS.
- J. Tian, Q. Liu, C. Ge, Z. Xing, A. M. Asiri, A. O. Al-Youbi and X. Sun, Nanoscale, 2013, 5, 8921–8924 RSC.
- R. Li, J. Zhang, Z. Li, J. Liu, Z. Gu and G. Wang, Sens. Actuators, B, 2015, 208, 421–428 CrossRef CAS.
- L. Fang, Q. Zhu, Y. Cai, B. Liang and X. Ye, J. Electroanal. Chem., 2019, 841, 1–9 CrossRef CAS.
- Y. Fang, Y. Ni, G. Zhang, C. Mao, X. Huang and J. Shen, Bioelectrochem., 2012, 88, 1–7 CrossRef CAS.
- H. Dai, P. Cao, D. Chen, Y. Li, N. Wang, H. Ma and M. Lin, Synth. Met., 2018, 235, 97–102 CrossRef CAS.
- H. Çiftçi, E. Alver, F. Çelik, A. Ü. Metin and U. Tamer, Microchim. Acta, 2016, 183, 1479–1486 CrossRef.
- A. Sedighi, M. Montazer and S. Mazinani, Biosens. Bioelectron., 2019, 135, 192–199 CrossRef CAS.
- X. Duan, K. Liu, Y. Xu, M. Yuan, T. Gao and J. Wang, Sens. Actuators, B, 2019, 292, 121–128 CrossRef CAS.
- P. Ran, J. Song, F. Mo, J. Wu, P. Liu and Y. Fu, Microchim. Acta, 2019, 186, 276 CrossRef.
- N. S. Lopa, M. M. Rahman, F. Ahmed, S. C. Sutradhar, T. Ryu and W. Kim, J. Electroanal. Chem., 2018, 822, 43–49 CrossRef CAS.
- W. Meng, Y. Wen, L. Dai, Z. He and L. Wang, Sens. Actuators, B, 2018, 260, 852–860 CrossRef CAS.
- Y. Qiao, Q. Liu, S. Lu, G. Chen, S. Gao, W. Lu and X. Sun, J. Mater. Chem. B, 2020, 8, 5411–5415 RSC.
- M. Guo, H. Hong, X. Tang, H. Fang and X. Xu, Electrochim. Acta, 2012, 63, 1–8 CrossRef CAS.
- H. Yang, Z. Wang, Q. Zhou, C. Xu and J. Hou, Microchim. Acta, 2019, 186, 631 CrossRef.
- P. Rattanawarinchai, N. Khemasiri, N. Soyeux, S. Jessadaluk, A. Klamchuen, S. Wirunchit, A. Rangkasikorn, N. Kayunkid, D. Phromyothin, S. Rahong and J. Nukeaw, Jpn. J. Appl. Phys., 2019, 58, SDDE04 CrossRef CAS.
- J. Ye, Z. Liu, C. Lai, C. Lo and C. Lee, Chem. Eng. J., 2016, 283, 304–312 CrossRef CAS.
- A. S. Thakor, J. Jokerst, C. Zavaleta, T. F. Massoud and S. S. Gambhir, Nano Lett., 2011, 11, 4029–4036 CrossRef CAS.
- G. Chang, H. Shu, Q. Huang, M. Oyama, K. Ji, X. Liu and Y. He, Electrochim. Acta, 2015, 157, 149–157 CrossRef CAS.
- L. Jin, Z. Meng, Y. Zhang, S. Cai, Z. Zhang, C. Li, L. Shang and Y. Shen, ACS Appl. Mater. Interfaces, 2017, 9, 10027–10033 CrossRef CAS.
- W. Zhao, R. Zhang, S. Xu, J. Cai, X. Zhu, Y. Zhu, W. Wei, X. Liu and J. Luo, Biosens. Bioelectron., 2018, 100, 497–503 CrossRef CAS.
- S. Zhong, J. Zhuang, D. Yang and D. Tang, Biosens. Bioelectron., 2017, 96, 26–32 CrossRef CAS.
- H. Shu, L. Cao, G. Chang, H. He, Y. Zhang and Y. He, Electrochim. Acta, 2014, 132, 524–532 CrossRef CAS.
- K. Cai, Z. Lv, K. Chen, L. Huang, J. Wang, F. Shao, Y. Wang and H. Han, Chem. Commun., 2013, 49, 6024–6026 RSC.
- J. Yuan, K. Wang and X. Xia, Adv. Funct. Mater., 2005, 15, 803–809 CrossRef CAS.
- N. Shen, H. Xu, W. Zhao, Y. Zhao and X. Zhang, Sensors, 2019, 19, 1203 CrossRef CAS.
- M. W. Hsiao, J. Electrochem. Soc., 1996, 143, 759 CrossRef CAS.
- S. Park, H. Boo and T. D. Chung, Anal. Chim. Acta, 2006, 556, 46–57 CrossRef CAS.
- M. Pasta, F. La Mantia and Y. Cui, Electrochim. Acta, 2010, 55, 5561–5568 CrossRef CAS.
- L. Lin, S. Weng, Y. Zheng, X. Liu, S. Ying, F. Chen and D. You, J. Electroanal. Chem., 2020, 865, 114147 CrossRef CAS.
- D. Zhao, Z. Wang, J. Wang and C. Xu, J. Mater. Chem. B, 2014, 2, 5195–5201 RSC.
- H. Jia, G. Chang, M. Lei, H. He, X. Liu, H. Shu, T. Xia, J. Su and Y. He, Appl. Surf. Sci., 2016, 384, 58–64 CrossRef CAS.
- X. Cao, N. Wang, S. Jia and Y. Shao, Anal. Chem., 2013, 85, 5040–5046 CrossRef CAS.
- W.-C. Lee, K.-B. Kim, N. G. Gurudatt, K. K. Hussain, C. S. Choi, D.-S. Park and Y.-B. Shim, Biosens. Bioelectron., 2019, 130, 48–54 CrossRef CAS.
- H. L. Chia, C. C. Mayorga-Martinez, R. Gusmão, F. Novotny, R. D. Webster and M. Pumera, Chem. Commun., 2020, 56, 7909–7912 RSC.
- A. Yu, S. Moon, T. Kwon, Y.-B. Cho, M. H. Kim, C. Lee and Y. Lee, Sens. Actuators, B, 2020, 310, 127822 CrossRef CAS.
- P. Chakraborty, S. Dhar, K. Debnath, T. Majumder and S. P. Mondal, Sens. Actuators, B, 2019, 283, 776–785 CrossRef CAS.
- M. Li, X. Bo, Y. Zhang, C. Han and L. Guo, Biosens. Bioelectron., 2014, 56, 223–230 CrossRef CAS.
- Y. Zhao, L. Fan, B. Hong, J. Ren, M. Zhang, Q. Que and J. Ji, Sens. Actuators, B, 2016, 231, 800–810 CrossRef CAS.
- S. Joo, S. Park, T. D. Chung and H. C. Kim, Anal. Sci., 2007, 23, 277 CrossRef.
- B. Singh, E. Dempsey, C. Dickinson and F. Laffir, Analyst, 2012, 137, 1639–1648 RSC.
- Y. Hu, X. Niu, H. Zhao, J. Tang and M. Lan, Electrochim. Acta, 2015, 165, 383–389 CrossRef CAS.
- Q. Shen, L. Jiang, H. Zhang, Q. Min, W. Hou and J.-J. Zhu, J. Phys. Chem. C, 2008, 112, 16385–16392 CrossRef CAS.
- S. Badhulika, R. K. Paul, Rajesh, T. Terse and A. Mulchandani, Electroanalysis, 2014, 26, 103–108 CrossRef CAS.
- Y. Bai, Y. Sun and C. Sun, Biosens. Bioelectron., 2008, 24, 579–585 CrossRef CAS.
- G. Wei, F. Xu, Z. Li and K. D. Jandt, J. Phys. Chem. C, 2011, 115, 11453–11460 CrossRef CAS.
- L. Meng, Y. Xia, W. Liu, L. Zhang, P. Zou and Y. Zhang, Electrochim. Acta, 2015, 152, 330–337 CrossRef CAS.
- X. Qiao, X. Wei, Y. Hao, Y. Zhang, M. Xu and B. Ye, Mater. Lett., 2019, 236, 476–479 CrossRef CAS.
- J. Xu, T. Chen, X. Qiao, Q. Sheng, T. Yue and J. Zheng, Colloids Surf., A, 2019, 561, 25–31 CrossRef CAS.
- A. K. Mishra, B. Mukherjee, A. Kumar, D. K. Jarwal, S. Ratan, C. Kumar and S. Jit, RSC Adv., 2019, 9, 1772–1781 RSC.
- Y. Li, Y.-Y. Song, C. Yang and X.-H. Xia, Electrochem. Commun., 2007, 9, 981–988 CrossRef CAS.
- Y. Xia, W. Huang, J. Zheng, Z. Niu and Z. Li, Biosens. Bioelectron., 2011, 26, 3555–3561 CrossRef CAS.
- H. Shu, G. Chang, J. Su, L. Cao, Q. Huang, Y. Zhang, T. Xia and Y. He, Sens. Actuators, B, 2015, 220, 331–339 CrossRef CAS.
- Y. Bai, W. Yang, Y. Sun and C. Sun, Sens. Actuators, B, 2008, 134, 471–476 CrossRef CAS.
- X. Qin, Q. Li, A. M. Asiri, A. O. Al-Youbi and X. Sun, Gold Bull., 2014, 47, 3–8 CrossRef CAS.
- H. Cui, J. Ye, W. Zhang, C. Li, J. H. T. Luong and F. S. Sheu, Anal. Chim. Acta, 2007, 594, 175–183 CrossRef CAS.
- H. Yang, Z. Wang, C. Li and C. Xu, J. Colloid Interface Sci., 2017, 491, 321–328 CrossRef CAS.
- R. Ayranci, B. Demirkan, B. Sen, A. Şavk, M. Ak and F. Şen, Mater. Sci. Eng., C, 2019, 99, 951–956 CrossRef CAS.
- C. Li, H. Wang and Y. Yamauchi, Chem. – Eur. J., 2013, 19, 2242–2246 CrossRef CAS.
- N. Tavakkoli and S. Nasrollahi, Aust. J. Chem., 2013, 66, 1097–1104 CrossRef CAS.
- B. Singh, F. Laffir, T. McCormac and E. Dempsey, Sens. Actuators, B, 2010, 150, 80–92 CrossRef CAS.
- K.-J. Chen, W.-N. Su, C.-J. Pan, S.-Y. Cheng, J. Rick, S.-H. Wang, C.-C. Liu, C.-C. Chang, Y.-W. Yang, C.-H. Wang and B.-J. Hwang, J. Mater. Chem. B, 2013, 1, 5925–5932 RSC.
- Y. Sun, H. Buck and T. E. Mallouk, Anal. Chem., 2001, 73, 1599–1604 CrossRef CAS.
- J. Ryu, K. Kim, H.-S. Kim, H. T. Hahn and D. Lashmore, Biosens. Bioelectron., 2010, 26, 602–607 CrossRef CAS.
- C. Shen, J. Su, X. Li, J. Luo and M. Yang, Sens. Actuators, B, 2015, 209, 695–700 CrossRef CAS.
- Y.-J. Lee and J.-Y. Park, Sens. Actuators, B, 2011, 155, 134–139 CrossRef CAS.
- S. Fu, C. Zhu, J. Song, M. Engelhard, H. Xia, D. Du and Y. Lin, ACS Appl. Mater. Interfaces, 2016, 8, 22196–22200 CrossRef CAS.
- H. Ai, X. Huang, Z. Zhu, J. Liu, Q. Chi, Y. Li, Z. Li and X. Ji, Biosens. Bioelectron., 2008, 24, 1048–1052 CrossRef CAS.
- S. Bilal, W. Ullah and A.-U.-H. Ali Shah, Electrochim. Acta, 2018, 284, 382–391 CrossRef CAS.
- S. Darvishi, M. Souissi, F. Karimzadeh, M. Kharaziha, R. Sahara and S. Ahadian, Electrochim. Acta, 2017, 240, 388–398 CrossRef CAS.
- X. Niu, M. Lan, H. Zhao and C. Chen, Anal. Chem., 2013, 85, 3561–3569 CrossRef CAS.
- X. Li, A. Hu, J. Jiang, R. Ding, J. Liu and X. Huang, J. Solid State Chem., 2011, 184, 2738–2743 CrossRef CAS.
- M. Wang, D. He, M. Huang, X. Wang and P. Jiang, J. Alloys Compd., 2019, 786, 530–536 CrossRef CAS.
- Q. Wa, W. Xiong, R. Zhao, Z. He, Y. Chen and X. Wang, ACS Appl. Nano Mater., 2019, 2, 4427–4434 CrossRef CAS.
- H. Nie, Z. Yao, X. Zhou, Z. Yang and S. Huang, Biosens. Bioelectron., 2011, 30, 28–34 CrossRef CAS.
- Y. Mu, D. Jia, Y. He, Y. Miao and H.-L. Wu, Biosens. Bioelectron., 2011, 26, 2948–2952 CrossRef CAS.
- W. Lu, X. Qin, A. M. Asiri, A. O. Al-Youbi and X. Sun, Analyst, 2013, 138, 417–420 RSC.
- J. Ding, X. Li, L. Zhou, R. Yang, F. Yan and B. Su, J. Mater. Chem. B, 2020, 8, 3616–3622 RSC.
- C. Li, Y. Liu, L. Li, Z. Du, S. Xu, M. Zhang, X. Yin and T. Wang, Talanta, 2008, 77, 455–459 CrossRef CAS.
- C. Guo, Y. Wang, Y. Zhao and C. Xu, Anal. Methods, 2013, 5, 1644–1647 RSC.
- T. Zhu, Y. Zhang, L. Luo and X. Zhao, ACS Appl. Mater. Interfaces, 2019, 11, 10856–10861 CrossRef CAS.
- F. Xie, T. Liu, L. Xie, X. Sun and Y. Luo, Sens. Actuators, B, 2018, 255, 2794–2799 CrossRef CAS.
- T. Chen, D. Liu, W. Lu, K. Wang, G. Du, A. M. Asiri and X. Sun, Anal. Chem., 2016, 88, 7885–7889 CrossRef CAS.
- Z. Ji, Y. Wang, Q. Yu, X. Shen, N. Li, H. Ma, J. Yang and J. Wang, J. Colloid Interface Sci., 2017, 506, 678–684 CrossRef CAS.
- F. Cao, S. Guo, H. Ma, D. Shan, S. Yang and J. Gong, Biosens. Bioelectron., 2011, 26, 2756–2760 CrossRef CAS.
- W. Huang, Y. Cao, Y. Chen, J. Peng, X. Lai and J. Tu, Appl. Surf. Sci., 2017, 396, 804–811 CrossRef CAS.
- T. Zhan, H. Yin, J. Zhu, J. Chen, J. Gong, L. Wang and Q. Nie, J. Alloys Compd., 2019, 786, 18–26 CrossRef CAS.
- M. Guo, L. Wei, Y. Qu, F. Zeng and C. Yuan, Mater. Lett., 2018, 213, 174–177 CrossRef CAS.
- W. Lu, X. Qin, A. M. Asiri, A. O. Al-Youbi and X. Sun, Analyst, 2013, 138, 429–433 RSC.
- W. Gao, Q. Li, M. Dou, Z. Zhang and F. Wang, J. Mater. Chem. B, 2018, 6, 6781–6787 RSC.
- A. Gao, X. Zhang, X. Peng, H. Wu, L. Bai, W. Jin, G. Wu, R. Hang and P. K. Chu, Sens. Actuators, B, 2016, 232, 150–157 CrossRef CAS.
- Q. Yi, W. Huang, W. Yu, L. Li and X. Liu, Electroanalysis, 2008, 20, 2016–2022 CrossRef CAS.
- Y. Zhang, L. Su, D. Manuzzi, H. V. E. de los Monteros, W. Jia, D. Huo, C. Hou and Y. Lei, Biosens. Bioelectron., 2012, 31, 426–432 CrossRef CAS.
- W. Na, J. Lee, J. Jun, W. Kim, Y. K. Kim and J. Jang, J. Ind. Eng. Chem., 2019, 69, 358–363 CrossRef CAS.
- J. Ye, D. Deng, Y. Wang, L. Luo, K. Qian, S. Cao and X. Feng, Sens. Actuators, B, 2020, 305, 127473 CrossRef CAS.
- K. Tian, M. Prestgard and A. Tiwari, Mater. Sci. Eng., C, 2014, 41, 100–118 CrossRef CAS.
- Z. Chen, B. Zhao, X.-Z. Fu, R. Sun and C.-P. Wong, J. Electroanal. Chem., 2017, 807, 220–227 CrossRef CAS.
- S. Pourbeyram, J. Abdollahpour and M. Soltanpour, Mater. Sci. Eng., C, 2019, 94, 850–857 CrossRef CAS.
- L. Xie, A. M. Asiri and X. Sun, Sens. Actuators, B, 2017, 244, 11–16 CrossRef CAS.
- Z. Wang, X. Cao, D. Liu, S. Hao, R. Kong, G. Du, A. M. Asiri and X. Sun, Chem. – Eur. J., 2017, 23, 4986–4989 CrossRef CAS.
- Y. Fu and W. Jin, Mater. Sci. Eng., C, 2019, 105, 110120 CrossRef CAS.
- Y. P. Palve and N. Jha, Mater. Chem. Phys., 2020, 240, 122086 CrossRef CAS.
- L. Xu, Q. Yang, X. Liu, J. Liu and X. Sun, RSC Adv., 2014, 4, 1449–1455 RSC.
- K. Kim, S. Kim, H. N. Lee, Y. M. Park, Y.-S. Bae and H.-J. Kim, Appl. Surf. Sci., 2019, 479, 720–726 CrossRef CAS.
- L. Bie, X. Luo, Q. He, D. He, Y. Liu and P. Jiang, RSC Adv., 2016, 6, 95740–95746 RSC.
- P. Viswanathan, J. Park, D.-K. Kang and J.-D. Hong, Colloids Surf., A, 2019, 580, 123689 CrossRef CAS.
- R. Li, X. Liu, H. Wang, Y. Wu, K. C. Chan and Z. Lu, Electrochim. Acta, 2019, 299, 470–478 CrossRef CAS.
- C. Kong, J. Lv, X. Hu, N. Zhao, K. Liu, X. Zhang, G. Meng, Z. Yang and S. Yang, Mater. Lett., 2018, 219, 134–137 CrossRef CAS.
- S. Liu, J. Tian, L. Wang, X. Qin, Y. Zhang, Y. Luo, A. M. Asiri, A. O. Al-Youbi and X. Sun, Catal. Sci. Technol., 2012, 2, 813–817 RSC.
- B. Wang, Y. Wu, Y. Chen, B. Weng and C. Li, Sens. Actuators, B, 2017, 238, 802–808 CrossRef CAS.
- M. Liu, R. Liu and W. Chen, Biosens. Bioelectron., 2013, 45, 206–212 CrossRef CAS.
- Q. Wang, Q. Wang, M. Li, S. Szunerits and R. Boukherroub, RSC Adv., 2015, 5, 15861–15869 RSC.
- Y. Liu, X. Cao, R. Kong, G. Du, A. M. Asiri, Q. Lu and X. Sun, J. Mater. Chem. B, 2017, 5, 1901–1904 RSC.
- M. Huang, X. Luo, D. He and P. Jiang, Anal. Methods, 2017, 9, 5903–5909 RSC.
- L. Wang, Y. Zhang, Y. Xie, J. Yu, H. Yang, L. Miao and Y. Song, Appl. Surf. Sci., 2017, 402, 47–52 CrossRef CAS.
- Q. Wang, Y. Chen, R. Zhu, M. Luo, Z. Zou, H. Yu, X. Jiang and X. Xiong, Sens. Actuators, B, 2020, 304, 127282 CrossRef CAS.
- F. Xie, X. Cao, F. Qu, A. M. Asiri and X. Sun, Sens. Actuators, B, 2018, 255, 1254–1261 CrossRef CAS.
- B. Xue, K. Li, L. Feng, J. Lu and L. Zhang, Electrochim. Acta, 2017, 239, 36–44 CrossRef CAS.
- S. Cheng, S. DelaCruz, C. Chen, Z. Tang, T. Shi, C. Carraro and R. Maboudian, Sens. Actuators, B, 2019, 298, 126860 CrossRef CAS.
- H. Xu, C. Xia, S. Wang, F. Han, M. K. Akbari, Z. Hai and S. Zhuiykov, Sens. Actuators, B, 2018, 267, 93–103 CrossRef CAS.
- Y. Zhang, Y. Zhang, H. Zhu, S. Li, C. Jiang, R. J. Blue and Y. Su, J. Alloys Compd., 2019, 780, 98–106 CrossRef CAS.
- L. Kong, Z. Ren, S. Du, J. Wu and H. Fu, Chem. Commun., 2014, 50, 4921–4923 RSC.
- M. C. D. Cooray, X. Zhang, Y. Zhang, S. J. Langford, A. M. Bond and J. Zhang, J. Mater. Chem. A, 2017, 5, 19289–19296 RSC.
- L. Kang, D. He, L. Bie and P. Jiang, Sens. Actuators, B, 2015, 220, 888–894 CrossRef CAS.
- W. Raza and K. Ahmad, Mater. Lett., 2018, 212, 231–234 CrossRef CAS.
- J. Gao, T. Meng, S. Lu, X. Ma, Y. Zhang, D. Fu, Z. Lu and C. M. Li, J. Electroanal. Chem., 2020, 863, 114071 CrossRef CAS.
- X. Luo, Z. Zhang, Q. Wan, K. Wu and N. Yang, Electrochem. Commun., 2015, 61, 89–92 CrossRef CAS.
- S. Khan, M. A. Rasheed, A. Waheed, A. Shah, A. Mahmood, T. Ali, A. Nisar, M. Ahmad, S. Karim and G. Ali, Mater. Sci. Semicond. Process., 2020, 109, 104953 CrossRef CAS.
- A. Mahmoud, M. Echabaane, K. Omri, L. El Mir and R. Ben Chaabane, J. Alloys Compd., 2019, 786, 960–968 CrossRef CAS.
- L. Liu, J. Wang, C. Wang and G. Wang, Appl. Surf. Sci., 2016, 390, 303–310 CrossRef CAS.
- B. Saha, S. K. Jana, S. Majumder and S. Banerjee, Sens. Actuators, B, 2019, 283, 116–123 CrossRef CAS.
- J. He, J. Sunarso, Y. Zhu, Y. Zhong, J. Miao, W. Zhou and Z. Shao, Sens. Actuators, B, 2017, 244, 482–491 CrossRef CAS.
- Y. Zhang, S. Liu, L. Wang, X. Qin, J. Tian, W. Lu, G. Chang and X. Sun, RSC Adv., 2012, 2, 538–545 RSC.
- G. Chang, Y. Luo, W. Lu, X. Qin, A. M. Asiri, A. O. Al-Youbi and X. Sun, Catal. Sci. Technol., 2012, 2, 800–806 RSC.
- M. Ghiaci, M. Tghizadeh, A. A. Ensafi, N. Zandi-Atashbar and B. Rezaei, J. Taiwan Inst. Chem. Eng., 2016, 63, 39–45 CrossRef CAS.
- R. Ponnusamy, R. Venkatesan, M. Kandasamy, B. Chakraborty and C. S. Rout, Appl. Surf. Sci., 2019, 487, 1033–1042 CrossRef CAS.
- C. Guo, H. Li, X. Zhang, H. Huo and C. Xu, Sens. Actuators, B, 2015, 206, 407–414 CrossRef CAS.
- M. Li, J. Yang, M. Lu, Y. Zhang and X. Bo, J. Colloid Interface Sci., 2019, 555, 449–459 CrossRef CAS.
- L. Parashuram, S. Sreenivasa, S. Akshatha, V. Udayakumar and S. Sandeep kumar, Food Chem., 2019, 300, 125178 CrossRef CAS.
- R. Chung, A. Wang, Q. Liao and K. Chuang, Nanomaterials, 2017, 7, 36 CrossRef.
- J. H. Shim, A. Cha, Y. Lee and C. Lee, Electroanalysis, 2011, 23, 2057–2062 CrossRef CAS.
- S. Liu, J. Tian, L. Wang, Y. Luo and X. Sun, RSC Adv., 2012, 2, 411–413 RSC.
- M. N. Karim, S. R. Anderson, S. Singh, R. Ramanathan and V. Bansal, Biosens. Bioelectron., 2018, 110, 8–15 CrossRef CAS.
- S. Liu, J. Tian, L. Wang, Y. Zhang, Y. Luo, H. Li, A. M. Asiri, A. O. Al-Youbi and X. Sun, ChemPlusChem, 2012, 77, 541–544 CrossRef CAS.
- Y. Zhang, J. Tian, S. Liu, L. Wang, X. Qin, W. Lu, G. Chang, Y. Luo, A. M. Asiri, A. O. Al-Youbi and X. Sun, Analyst, 2012, 137, 1325–1328 RSC.
- M.-S. Steiner, A. Duerkop and O. S. Wolfbeis, Chem. Soc. Rev., 2011, 40, 4805–4839 RSC.
- Y. Cui, F. Chen and X.-B. Yin, Biosens. Bioelectron., 2019, 135, 208–215 CrossRef CAS.
- L. Wang, W. Zhu, W. Lu, X. Qin and X. Xu, Biosens. Bioelectron., 2018, 111, 41–46 CrossRef CAS.
- J. Luo, P. Luo, M. Xie, K. Du, B. Zhao, F. Pan, P. Fan, F. Zeng, D. Zhang, Z. Zheng and G. Liang, Biosens. Bioelectron., 2013, 49, 512–518 CrossRef CAS.
- S. Chaiyo, E. Mehmeti, W. Siangproh, T. L. Hoang, H. P. Nguyen, O. Chailapakul and K. Kalcher, Biosens. Bioelectron., 2018, 102, 113–120 CrossRef CAS.
- D.-M. Kim, J.-M. Moon, W.-C. Lee, J.-H. Yoon, C. S. Choi and Y.-B. Shim, Biosens. Bioelectron., 2017, 91, 276–283 CrossRef CAS.
- E. V. Karpova, E. V. Shcherbacheva, A. A. Galushin, D. V. Vokhmyanina, E. E. Karyakina and A. A. Karyakin, Anal. Chem., 2019, 91, 3778–3783 CrossRef CAS.
- Y. X. Wen, S. G. Liu, B. X. Tao, H. Q. Luo and N. B. Li, Sens. Actuators, B, 2020, 304, 127279 CrossRef CAS.
- S. Bag, A. Baksi, S. H. Nandam, D. Wang, X. Ye, J. Ghosh, T. Pradeep and H. Hahn, ACS Nano, 2020, 14, 5543–5552 CrossRef CAS.
- Y. J. Hong, H. Lee, J. Kim, M. Lee, H. J. Choi, T. Hyeon and D. H. Kim, Adv. Funct. Mater., 2018, 28, 1805754 CrossRef.
Footnote |
| † These authors contributed equally to this work. |
| This journal is © The Royal Society of Chemistry 2020 |


