 Open Access Article
Creative Commons Attribution 3.0 Unported Licence
Complexity of dissolved organic matter in the molecular size dimension: insights from coupled size exclusion chromatography electrospray ionisation mass spectrometry†
J. A.
Hawkes
 *a,
P. J. R.
Sjöberg
 a,
J.
Bergquist
 a and
L. J.
Tranvik
 b
b
aAnalytical Chemistry, Department of Chemistry - BMC, Uppsala University, Uppsala, Sweden. E-mail: jeffrey.hawkes@kemi.uu.se
bDepartment of Limnology, Uppsala University, Uppsala, Sweden
First published on 25th January 2019
Abstract
This paper investigates the relationship between apparent size distribution and molecular complexity of dissolved organic matter from the natural environment. We used a high pressure size exclusion chromatography (HPSEC) method coupled to UV-Vis diode array detection (UV-DAD) and electrospray ionisation mass spectrometry (ESI-MS) in order to compare the apparent size of natural organic matter, determined by HPSEC-UV and the molecular mass determined online by ESI-MS. We found that there was a clear discrepancy between the two methods, and found evidence for an important pool of organic matter that has a strong UV absorbance and no ESI-MS signal. Contrary to some previous research, we found no evidence that apparently high molecular weight organic matter is constituted by aggregates of low molecular weight (<1000 Da) material. Furthermore, our results suggest that the majority of apparent size variability within the ESI ionisable pool of organic matter is due to secondary interaction and exclusion effects on the HPSEC column, and not true differences in hydrodynamic size or intermolecular aggregation.
Introduction
Dissolved organic matter (DOM) in aquatic environments is by far the most abundant form of organic matter in natural waters. It is an ultra-complex mixture of phenolic, carboxylic acid rich material that ranges in concentration from >50 mg L−1 C−1 in terrestrial wetlands down to <0.5 mg L−1 C−1 in the deep sea. DOM is operationally defined as organic matter that is not retained by filtration, typically using pore sizes between 0.2 and 0.7 μm. It may consist of truly dissolved molecules, aggregates and high molecular weight colloids. The size distribution across this wide spectrum is critical to the biogeochemical processing of DOM, including microbial transformation and mineralization, photochemical reactions, and susceptibility to interact with metals, sorb to surfaces or aggregates, and subsequently form aggregates that settle out of the water column.The biogeochemical utilisation and transformation of DOM along the natural gradient from soils to inland waters to the sea is an important part of the carbon cycle, and slight changes to production and removal processes could lead to significant positive and negative feedbacks in the global climate. There is therefore great interest in the nature and reactivity of DOM, but investigations into its chemistry are always confounded by its extreme complexity.1,2 The complexity of natural DOM is easily demonstrated by high resolution electrospray ionisation mass spectrometry (HR-ESI-MS), as any aquatic sample contains thousands of molecular peaks with different molecular formulas.3,4 Each molecular formula is constituted by an unknown number of structural isomers, making compositional analysis extremely challenging.5,6 Complexity can also be demonstrated using one dimensional chromatography, whereby an unresolvable complex mixture is obtained, no matter which separation mechanism is used.7–15 It is important to remember that standard compounds do not exist for natural DOM, and natural mixtures are made up of possibly millions of unknown, interacting constituents at trace concentrations.3,5,16,17
One of the major debates about the nature of DOM in aquatic environments regards its physical speciation and true molecular size in solution.18,19 Filtration through different pore size membranes and size exclusion usually suggest that DOM has a large mass range of 0.1–100 kDa,18,20–24 whereas HR-ESI-MS generally finds molecules restricted to masses of 200–800. One possible explanation for this apparent duality is that naturally occurring molecular aggregates are broken up by sample processing and analysis – e.g. during dissolution in organic solvent, ESI and ion trapping steps,4,25 and natural solutions contain weak aggregates of monomers with masses of 200–800 Da.18,26–29 Another (less popular) explanation is that negative mode HR-ESI-MS preferentially detects low molecular weight carboxylic acids, and genuine (not aggregated) high molecular weight compounds are masked by the more easily ionisable or volatile lower masses, and are not detected. Either case, or their relative importance, would have major implications for the way that we interpret HR-ESI-MS data with regards to the nature and reactivity of DOM, and the potential effect it can have on topics such as contaminant mobility and drinking water quality.18,30,31
High pressure size exclusion chromatography (HPSEC) coupled online with UV-DAD and HR-ESI-MS can be used to investigate this problem. Molecules are separated by hydrodynamic size by HPSEC, and measured according to their UV light attenuation by UV-DAD and according to their mass to charge ratio (m/z) by HR-ESI-MS. Ideally, the estimated HPSEC-UV-DAD size and measured HR-ESI-MS mass would scale together, but molecular shape, charge repulsion and secondary retention effects on the column stationary phase can complicate the chromatography,19,32 while ionisation efficiency and ionisation effects like adduct formation and disaggregation can still bias ESI-MS, even after simplification of the mixture by separation.4,25,33 We investigated the HPSEC behaviour of DOM from different sources and compared it with various size standards of differing charge density in order to evaluate the two main theories about the size distribution of DOM presented above. Based on current paradigms about DOM size distribution and aggregation, we expected to find that high molecular weight material measured by HPSEC-UV-DAD would be detected by ESI-MS as monomers with m/z 200–800, however, our results instead provided evidence for the existence of genuinely large, UV active and ESI-MS invisible DOM, and no evidence for the expected molecular aggregates.
Methods
Chemicals and samples
Ultrapure water (18.2 MΩ resistivity) was generated with a MilliQ system (Millipore, Burlington MA, USA). Methanol was high purity hypergrade (LiChroSolv for LCMS, Merck, Kenilworth, NJ, USA). High purity ammonium acetate (NH4Ac), hydrochloric acid and ammonia were obtained from Fluka (Steinheim, Germany), Merck and Sigma Aldrich (St. Louis, MO, USA), respectively. Model compounds with m/z 369 were purchased from Sigma Aldrich: 2-(4-(2,2-dicarboxy-ethyl)-2,5-dimethoxy-benzyl)-malonic acid (model compound a), 7,8-dihydroxy-6-methoxycoumarin-8-β-D-glucopyranoside (fraxin, model compound b), and isoferulic acid 3-O-β-D-glucuronide (model compound c). Poly(styrene sulfonate) standards (PSS) were purchased from American Polymer Standards Corporation (Mentor, OH, USA) at 6 average weights (218 kDa, 38 kDa, 15 kDa, 4.4 kDa, 1.4 kDa, and 206 Da) and stored at room temperature as powders. Poly(propylene glycol) standards (PPG) were purchased from Aldrich Chemie (Steinheim, Germany) at average masses 1 kDa and 2 kDa, and from Aldrich Chemical Company (Milwaukee, WI, USA) at 425 Da average mass, and stored as liquids at 4 °C.Suwannee River Fulvic Acid standard (lot 2S101F) was purchased from the International Humic Substances Society (IHSS), and four other samples were prepared as follows:
Soil humic and fulvic acids – 1.42 g of soil from Stadsskogen, Uppsala, Sweden (59.840 N, 17.636 E), was mixed with 10 mL 0.25% ammonia. The mixture was shaken, sonicated and vortexed twice, left at room temperature for 90 minutes, and then centrifuged at 4000 rpm for 10 minutes. One aliquot (2 mL) was taken from the supernatant without further modification and labelled ‘Humic acids’, and a second aliquot (2 mL) was acidified to pH 2 by adding 40 μL 6 M hydrochloric acid, labelled ‘Fulvic acids’. The two aliquots were centrifuged to remove precipitated material and the resulting supernatants were injected onto the SEC column at 100 μL injection volume without further treatment.
Wetland stream reverse osmosis DOM – organic matter was concentrated from a small stream that drains a wetland named Börje Sjö near Uppsala, Sweden (59.918 N, 17.347 E) using a RealSoft PROS/2S portable reverse osmosis system.34 DOM was concentrated to 700 mg L−1 C−1. This sample was stored for >2 years at 4 °C in the dark, and was filtered through glass fibre filter (GF/F 0.7 μm) before injection (20 μL) onto the SEC column.
Leaf cold water extract – 25.96 g of green birch (Betula sp.) leaves were taken from a tree beside the Biomedical Centrum, Uppsala, Sweden (59.841 N, 17.634 E), and mixed with 554 g ultrapure water. The mixture was kept at 4 °C in the dark for 18 hours to extract ‘rainwater extractable DOM’. A sample (2 mL) was taken to an Eppendorf tube, dried down by vacuum centrifuge (Eppendorf Concentrator Plus) and redissolved in 100 μL 20![[thin space (1/6-em)]](https://www.rsc.org/images/entities/char_2009.gif) :
:![[thin space (1/6-em)]](https://www.rsc.org/images/entities/char_2009.gif) 80 methanol
80 methanol![[thin space (1/6-em)]](https://www.rsc.org/images/entities/char_2009.gif) :
:![[thin space (1/6-em)]](https://www.rsc.org/images/entities/char_2009.gif) water, 25 mM NH4Ac for injection (80 μL) onto the SEC column.
water, 25 mM NH4Ac for injection (80 μL) onto the SEC column.
High pressure liquid chromatography-mass spectrometry
High pressure size exclusion chromatography (HPSEC; Tosoh TSKgel G3000SW 300 × 7.5 mm, 10 μm) was conducted with an Agilent 1100 HPLC system using combinations of water, methanol and NH4Ac as the mobile phase, with a flow rate of 1 mL min−1. A YMC-Pack-Diol-300 (300 × 8 mm, 5 μm) column was also tested, but found to be much more affected by hydrophobic interactions between analytes and the stationary phase than the Tosoh column. UV light absorbing DOM was detected using a UV-Vis Diode Array Detector (DAD; Agilent 1100) at wavelength 254 nm.For online ESI-MS analysis, the flow was split (after UV-Vis DAD) approximately 9![[thin space (1/6-em)]](https://www.rsc.org/images/entities/char_2009.gif) :
:![[thin space (1/6-em)]](https://www.rsc.org/images/entities/char_2009.gif) 1 to waste, leaving a flow of ∼100 μL min−1 for heated ESI-MS (100 °C, sheath gas setting 28, 2.5 kV negative mode). The splitting and heating were to assist with vaporisation of the solvent, which in most cases was largely water. The time delay from UV-Vis DAD detection and ESI-MS detection was determined to be 0.28 minutes using the 206 Da PSS standard, and all ESI-MS times are reported so as to be aligned with UV-Vis DAD detection times. The effect of injection volume was tested by analysing SRFA at four concentrations (0.25–5 mg L−1 C−1) with differing injection volumes (1–100 μL) in various combinations (Fig. SI1†), and this had minimal effect on the retention profile determined by UV-DAD and ESI-MS.
1 to waste, leaving a flow of ∼100 μL min−1 for heated ESI-MS (100 °C, sheath gas setting 28, 2.5 kV negative mode). The splitting and heating were to assist with vaporisation of the solvent, which in most cases was largely water. The time delay from UV-Vis DAD detection and ESI-MS detection was determined to be 0.28 minutes using the 206 Da PSS standard, and all ESI-MS times are reported so as to be aligned with UV-Vis DAD detection times. The effect of injection volume was tested by analysing SRFA at four concentrations (0.25–5 mg L−1 C−1) with differing injection volumes (1–100 μL) in various combinations (Fig. SI1†), and this had minimal effect on the retention profile determined by UV-DAD and ESI-MS.
The LTQ is a linear ion trap that is used to collect ions before transfer to the Orbitrap analyser, and is also used for collision induced fragmentation (CID) using nitrogen gas. The ion trap was set to trap and transfer ions with masses 200–2000, and the Orbitrap mass analyser was set to fill to 1 × 10⁶ ions (maximum fill time 250 ms) at a resolution setting of ‘100![[thin space (1/6-em)]](https://www.rsc.org/images/entities/char_2009.gif) 000’, giving an actual resolution >115
000’, giving an actual resolution >115![[thin space (1/6-em)]](https://www.rsc.org/images/entities/char_2009.gif) 000 at m/z 401. Formulas were assigned in each transient as in our recent papers35 up to C40H80O30NS13C. The formula possibilities were restricted to the following rules: O/C < 1.0, H/C 0.3–2.2, m/z 200–800, double bond equivalence minus oxygen (DBE-O) < 10,36 N + S + 13C < 2. Formulas were assigned if a peak in the resulting list could be found within 3 ppm (Δm/m × 1 × 10⁶) of a measured peak in each individual transient. Isotopologues containing one 13C were assigned but not considered in further data processing (i.e. molecular formulas were not counted twice via isotopologues).
000 at m/z 401. Formulas were assigned in each transient as in our recent papers35 up to C40H80O30NS13C. The formula possibilities were restricted to the following rules: O/C < 1.0, H/C 0.3–2.2, m/z 200–800, double bond equivalence minus oxygen (DBE-O) < 10,36 N + S + 13C < 2. Formulas were assigned if a peak in the resulting list could be found within 3 ppm (Δm/m × 1 × 10⁶) of a measured peak in each individual transient. Isotopologues containing one 13C were assigned but not considered in further data processing (i.e. molecular formulas were not counted twice via isotopologues).
Calibration and method validation was conducted with PSS standards (representing charged polymers), PPG standards (representing uncharged polymers) and three model compounds with 0, 2 and 4 carboxylic groups, but the same m/z (369) and formula (C16H18O10). The size standards of PSS and PPG were prepared to 1 mg mL−1 in 10 mM NH4Ac and analysed at a 2 μL injection volume with detection by UV-Vis DAD. After initial testing, the PSS standards were mixed into two mixed standards at equal volumes (A: 218 kDa, 15 kDa, 1.4 kDa and acetone, B: 38 kDa, 4.4 kDa, 206 Da) and injected at a 10 μL volume. The model compounds (a malonic acid derivative, fraxin and an isoferulic acid glucuronide) were prepared to 1 ppm concentration in 50![[thin space (1/6-em)]](https://www.rsc.org/images/entities/char_2009.gif) :
:![[thin space (1/6-em)]](https://www.rsc.org/images/entities/char_2009.gif) 50 water
50 water![[thin space (1/6-em)]](https://www.rsc.org/images/entities/char_2009.gif) :
:![[thin space (1/6-em)]](https://www.rsc.org/images/entities/char_2009.gif) methanol, and 50 μL of the solution was injected onto the SEC column. They were distinguished by their unique fragments after collision induced dissociation (CID) in the ion trap. This was carried out at a normalised collision energy of 25 eV after selected ion monitoring (SIM) of m/z 368.5–369.5.
methanol, and 50 μL of the solution was injected onto the SEC column. They were distinguished by their unique fragments after collision induced dissociation (CID) in the ion trap. This was carried out at a normalised collision energy of 25 eV after selected ion monitoring (SIM) of m/z 368.5–369.5.
In one experiment, chromatographic fractions were collected manually after UV-Vis detection, and fractions (1.5 minutes = 1.5 mL) were dried by vacuum centrifuge (Eppendorf Concentrator Plus) and redissolved in 100 μL 50![[thin space (1/6-em)]](https://www.rsc.org/images/entities/char_2009.gif) :
:![[thin space (1/6-em)]](https://www.rsc.org/images/entities/char_2009.gif) 50 water
50 water![[thin space (1/6-em)]](https://www.rsc.org/images/entities/char_2009.gif) :
:![[thin space (1/6-em)]](https://www.rsc.org/images/entities/char_2009.gif) methanol. They were then reinjected onto the column at an 80 μL injection volume. This was done to examine potential redistribution of aggregates when size fractions were isolated in solution.
methanol. They were then reinjected onto the column at an 80 μL injection volume. This was done to examine potential redistribution of aggregates when size fractions were isolated in solution.
Molecular peaks are later discussed in terms of their polydispersity (PD), which is calculated as:
Results and discussion
Development of a HPSEC method for DOM
Coupling HR-ESI-MS to HPSEC imposes important restrictions on the mobile phase used in the chromatography, in that it has to be volatile and high ionic strength should be avoided. Three types of standard were used to evaluate size exclusion behaviour. PSS was used, as in most recent literature, as a charged polymer that is similar in hydrodynamic size to natural humic substances,17,31,32,37 but the validity of PSS standards or any other model compound in representing the HPSEC retention of DOM must be questioned, as DOM is so chemically diverse.17,31,32,37 PPG is uncharged and was used to compare the behaviour of analytes that would not be subject to charge exclusion, and three model compounds with identical mass but differing charge in solution were analysed to confirm the differences found in the two polymer series.We used the PSS polymer series to test combinations of NH4Ac in water and methanol with measured pH > 6, similar to most natural aquatic systems with low DOC. The highest molecular weight standard, 218![[thin space (1/6-em)]](https://www.rsc.org/images/entities/char_2009.gif) 400 Da, was always found at ∼4.9 minutes, which we suppose is near to the interstitial volume (V0) of the column. Linearity of response in log(MW) vs. time was only achieved up to the 37
400 Da, was always found at ∼4.9 minutes, which we suppose is near to the interstitial volume (V0) of the column. Linearity of response in log(MW) vs. time was only achieved up to the 37![[thin space (1/6-em)]](https://www.rsc.org/images/entities/char_2009.gif) 500 Da standard, making this the maximum estimated PSS-equivalent mass. Later, it will be shown that most DOM was retained within the linear range, but some DOM can elute at V0, making it an unknown size higher than 37.5 kDa in PSS equivalence (i.e. taking charge repulsion into account, as explained below). The total volume of mobile phase in the column was not measured reliably (e.g. with D2O32), and the retention time of acetone (58 Da) varied depending on the extent of hydrophobic interaction imposed by the mobile phase conditions (Fig. 1; see discussion later), meaning that linearity between log(MW) and retention time always broke down at the low mass end.
500 Da standard, making this the maximum estimated PSS-equivalent mass. Later, it will be shown that most DOM was retained within the linear range, but some DOM can elute at V0, making it an unknown size higher than 37.5 kDa in PSS equivalence (i.e. taking charge repulsion into account, as explained below). The total volume of mobile phase in the column was not measured reliably (e.g. with D2O32), and the retention time of acetone (58 Da) varied depending on the extent of hydrophobic interaction imposed by the mobile phase conditions (Fig. 1; see discussion later), meaning that linearity between log(MW) and retention time always broke down at the low mass end.
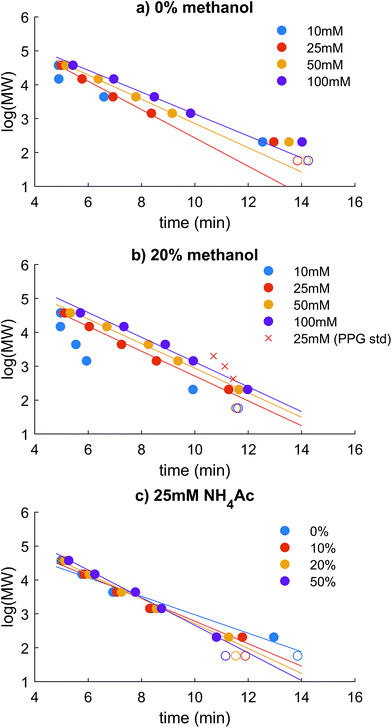
In aqueous phase, without addition of methanol, calibration curves of log(MW) vs. time using PSS were not linear across the entire range, and instead flattened significantly from the 1440 standard to the 206 Da standard and acetone (Fig. 1a). This non-linearity has also been documented using ammonium bicarbonate solutions as the mobile phase.2,11 An increase in NH4Ac from 10–100 mM improved retention of the PSS standards due to decreased influence of ionic exclusion, which greatly affects charged molecules in SEC19,32,38 due to repulsive interactions between charged analytes and the slightly charged stationary phase.39 The increase in NH4Ac in pure aqueous solvent did not improve the flattening of the calibration at low masses. The adjusted r2 of the slopes using all 5 standards up to 37.5 kDa was 0.93–0.98. At the lowest NH4Ac concentration, no retention was found for the standards >14![[thin space (1/6-em)]](https://www.rsc.org/images/entities/char_2009.gif) 800 Da because of ion exclusion, and retention of the 37
800 Da because of ion exclusion, and retention of the 37![[thin space (1/6-em)]](https://www.rsc.org/images/entities/char_2009.gif) 500 Da standard began at 25 mM NH4Ac, similarly to the previous observations.32,40
500 Da standard began at 25 mM NH4Ac, similarly to the previous observations.32,40
An increase in methanol notably improved linearity by decreasing the retention time of the 206 Da standard and acetone, while not greatly affecting the higher molecular weight standards (Fig. 1b and c). This suggests that the longer time in the column of the low molecular weight standards allows a greater toll to be taken by secondary hydrophobic interaction effects on the stationary phase in aqueous solution. The flattening of the calibration curve away from linearity due to hydrophobic retention is not desirable as it leads to an incorrect assessment of the molecular size of small, hydrophobic constituents, and unpredictable and variable chromatographic resolution at the crucial mass range of 200–2000.11 An addition of 10% methanol made a large improvement to linearity by decreasing the retention of the smallest standards (adjusted r2 0.96 compared with 0.93; Fig. 1c), and 20% methanol made the calibration nearly linear (adjusted r2 0.99) across the range 206–37![[thin space (1/6-em)]](https://www.rsc.org/images/entities/char_2009.gif) 500 Da. The methanol also improves the quality of spray observed with ESI, being more volatile and decreasing surface tension, leading to a better signal to noise in the MS detection. We also noticed at the highest NH4Ac concentration, and particularly at high sample concentrations of DOM, that organic matter began to appear more hydrophobic (longer retention times, data not shown). This may be due to decreased solubility of the DOM in the high ionic strength solution and resulting non-linear chromatography behaviour where the phase equilibria are not linear.41 In other words, the concentrations of components in the stationary phase at equilibrium are no longer proportional to the concentrations in the mobile phase. This effect was not investigated further, but was not observed for NH4Ac concentrations ≤ 50 mM.
500 Da. The methanol also improves the quality of spray observed with ESI, being more volatile and decreasing surface tension, leading to a better signal to noise in the MS detection. We also noticed at the highest NH4Ac concentration, and particularly at high sample concentrations of DOM, that organic matter began to appear more hydrophobic (longer retention times, data not shown). This may be due to decreased solubility of the DOM in the high ionic strength solution and resulting non-linear chromatography behaviour where the phase equilibria are not linear.41 In other words, the concentrations of components in the stationary phase at equilibrium are no longer proportional to the concentrations in the mobile phase. This effect was not investigated further, but was not observed for NH4Ac concentrations ≤ 50 mM.
The PPG standards retained much longer than PSS, as expected32 (Fig. 1b), and the model compounds also varied in retention according to charge density37 (Fig. 2). These compounds vary in charge density in pH 6.6 solution from 0–4 charges (Fig. SI4†), and represent the range of charge density expected for natural DOM. The neutral compound, fraxin, was retained longer than acetone when methanol was not added to the mobile phase, indicating hydrophobic retention on the column, and was generally comparable with PPG. The least well retained was the malonic acid derivative, due to its high charge density, leading to an overestimated molecular weight based on the calibration using the PSS standards. The isoferulic acid glucuronide (two carboxylic acid groups) was the most comparable in retention to its equivalent mass in the PSS calibration curve. Some variability in retention time may also be explained by differing hydrodynamic volume, but charge density likely explains the major differences found.
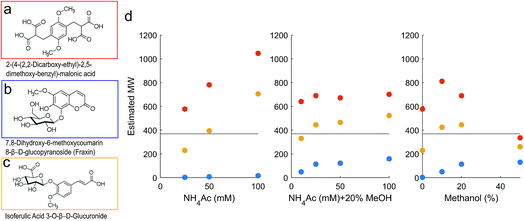 | ||
| Fig. 2 (a–c) Model compounds with neutral mass 370. (d) Estimated molecular weight of compound (a) (malonic acid derivative; red), (b) (fraxin; blue) and (c) (isoferulic acid glucuronide; yellow). All three compounds have true neutral mass 370, marked with a horizontal line. The compounds were detected as compound-specific fragments after CID fragmentation and the peak position at the apex was converted to mass using the relevant calibration in Fig. 1. | ||
The large range in predicted molecular weights for these three isomers demonstrates the limitations of HPSEC for complex mixtures (Fig. 2). Adding 20% methanol to the mobile phase improved the consistency of the predicted molecular weight across different NH4Ac concentrations, and with 20% methanol, the malonic acid derivative never appeared as more than double its true weight. It remains possible that the compound dimerised in solution and was truly present at ∼740 Da, but more likely is that charge repulsion was higher for this compound than the PSS standards it is being compared with. It is likely that DOM contains a high occurrence of carboxylic acid groups, according to its reactive chemistry42,43 and fragmentation patterns when studied by MS,6,44 but a higher density of carboxylic acids than the malonic acid derivative compound is unlikely. We therefore take comfort that its predicted weight is only two-fold higher than its true value. Also concerning was fraxin, which was retained for far too long compared with the equivalent retention time from the PSS calibration curve, and likely represents all neutral compounds in this sense. Addition of 20% methanol improved the estimated MW for fraxin, and seemed to stabilise the response with respect to NH4Ac concentration for the two carboxylic acids (Fig. 2). At 0% methanol, increasing NH4Ac concentration increased the estimated MW of the carboxylic acids. It might be considered that this high NH4Ac concentration promoted self-aggregation of these standards,45 but this possibility is difficult to test, as only the monomer mass was detected by ESI-MS.
The final selection of mobile phase has many implications for this study. It is important to have effective retention and resolution by HPSEC, meaning that the NH4Ac concentration must be at least 25 mM and contain at least 10% methanol. The ESI spray efficiency is poor when the methanol content is too low or the salt content is too high, so this favours keeping the salt concentration as low as possible. Sample loading was tested from 2.5–50 μg with no variability in UV retention profile observed (Fig. SI1†), with higher loading giving a better signal and a higher number of assigned peaks by MS. Additionally, the study is improved by making the pH, salt and organic solvent conditions as similar to those of environmental samples as possible, so that the speciation of the DOM by HPSEC is comparable. Buffer capacity and ionic strength change dramatically across landscapes, particularly from terrestrial to marine waters. Marine conditions (0.5 M NaCl) are permissible for HPSEC but incompatible with ESI-MS, so the system was optimised for terrestrial samples of low salinity and buffer strength, usually below 3 meq. Overall, the optimal mobile phase for HPSEC-ESI-MS was chosen as 25 mM NH4Ac in 20% methanol (pH measured at 6.6), as a compromise between effective masking of ionic repulsion effects, limiting hydrophobic interaction and salting out of compounds from solution, optimising spray quality for ESI whilst keeping the salt and alcohol concentration low enough to mimic environmental conditions.
Size distribution of DOM samples according to HPSEC-UV-Vis DAD and HPSEC-HESI-Orbitrap-MS
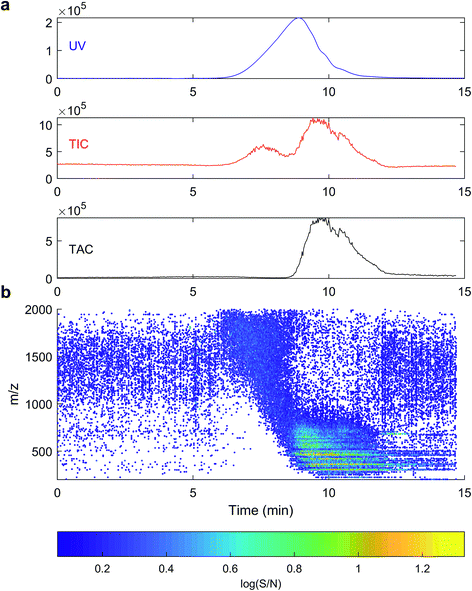
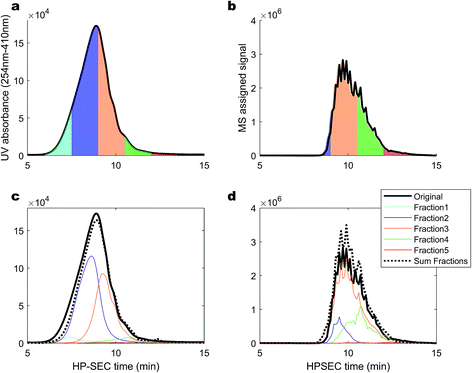
The signal from ESI-MS detection was rather different.48 The total ion count showed two broad, unresolved peaks from 7–9 minutes and 9–12.5 minutes, with apexes at 7.7 and 9.8 minutes, or 3572 and 608 Da PSS. A dot plot (Fig. 3b) of all detected ions m/z 150–2000 shows a broad signal of material with m/z 800–2000 at 7–9 minutes, then starting from 9 minutes, m/z 150–800 were detected with higher intensity. Generally, each m/z in the range 150–800 was detected over a broad retention time range from 9–12 minutes, and all assignments were singly charged, as is typical for DOM.49
High resolution mass spectrometry allows accurate formula assignment of the material eluting from HPSEC. The resolution and mass accuracy of the Orbitrap instrument dictates the mass range over which formulas can be assigned (up to about m/z 800). Although this range is limited in the context of this study, multiply charged compounds with higher mass could theoretically be detected and assigned a formula, and ions with m/z up to 2000 can be detected, if not assigned. Fig. 3a shows the chromatogram of the summed intensity of all assigned formulas (total assigned current; TAC), and assigned current was only found in the second hump of material, unlike in some previous results, which did not compare MS assignments to UV data.29 The high molecular weight material (apex 7.5 minutes, Fig. 3a) with strong UV absorbance was not constituted by aggregated monomers (i.e. clusters) that could be dissociated during ESI or with in-source CID (Fig. SI2†), unlike previous results using variable cone voltage (similar to in-source CID) on a triple quadrupole MS.48 Instead, this data supports the alternative hypothesis that there is genuinely high molecular mass material in the sample that has strong UV absorbance and cannot be dissociated and ionised (either as monomers or multiply charged ions) in the range 200–800 Da. It remains a possibility that the measured compounds aggregate in solution in natural waters,48 but our data provides no evidence that these aggregates had low retention volumes (high hydrodynamic size) by our HPSEC method.
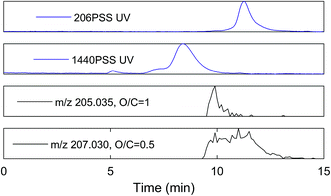
An extracted ion current of any individual formula shows that molecular peaks can appear at HPSEC retention times higher than predicted for the measured mass. This is likely due to charge density for ESI ionisable carboxylic acids, as discussed above (Fig. 2). The chromatographic peak width can also be greater than the PSS standards, indicating an isomeric diversity in HPSEC response (Fig. 4), similarly to other separation methods.8,9
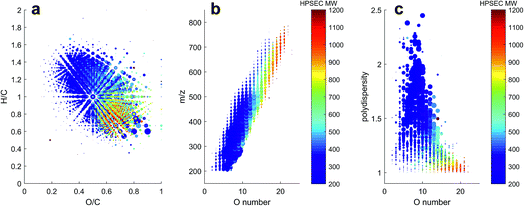
The variability in chromatographic elution time (i.e. number averaged molecular weight, Mn) of molecular peaks in SRFA is almost certainly due to variation in charge density, as shown for model compounds in Fig. 2 and for two peaks with similar mass and differing charge density (assumed from the oxygen to carbon ratio (O/C)) in Fig. 4. Inspection of all formulas in a van Krevelen diagram or m/z vs. oxygen number diagram shows that charge density (equivalent to oxygen density for unsaturated humic compounds) explains as much variation in obtained peak apex as measured m/z, as manifested by the increase in apparent MW with oxygen for any measured m/z region (Fig. 5). The polydispersity (apparent range in molecular weight) was generally low (<1.5), particularly for molecular formulas with high charge density and high apparent mass. The most disperse peaks (with broader retention profiles) were mainly low oxygen number peaks with presumably more hydrophobic character and more susceptibility to hydrophobic retention on the column, leading to peak tailing.
Elution fractions were collected, dried down, re-dissolved in the mobile phase and re-injected, in order to investigate whether the high MW material that elutes first in HPSEC originates from monomers that could aggregate, or the dis-aggregation of larger clusters when alone in solution.50 Fractions were taken at 4–5.5 minutes (blank), 6–7.5 minutes (emerging UV, no MS signal), 7.5–9 minutes (strong UV, weak MS), 9–10.5 minutes (strong UV, strong MS), 10.5–12 minutes (weak UV, strong MS) and 12–13.5 minutes (no UV, weak MS). The fractions are depicted in Fig. 6 as UV signals (a) and MS signals (b). In panels (c) and (d), the signals for the re-injected fractions are shown, along with the summed, re-constituted signal. In general, the molecular distribution in each fraction remained in the size range that it was collected from,51 especially when considering the poor chromatographic resolution of HPSEC. Certainly; it was not found that fraction 3 (orange) reformed some signal in fraction 1 (sky blue). However, fraction 1 was diminished in magnitude and appeared at lower apparent mass when re-injected, resulting in a slight decrease in the reconstituted total signal at higher apparent masses. This might indicate that some of the higher m/z values present in SRFA are supported by self-aggregation due to some form of solubility limit of the slightly smaller material in fraction 2.27,45 The MS profile was almost perfectly maintained in the separated fractions, and no signal was drawn from fraction 1 in isolation, contrary to previous results using low resolution MS,50 and similarly to other previous results that found collected fractions to be stable in retention behaviour over several weeks.51 This provides further support for the hypothesis that the molecular size distribution of riverine DOM is due to a large range in hydrodynamic sizes, and not dynamic, weak aggregation of small molecules. Overall, our investigations of this complex natural mixture suggest that there is limited aggregation of ionisable molecules (carboxylic acids) in this mobile phase, and variation in retention time for masses detected by ESI-MS can be explained by variation in charge density and hydrophobicity. These non-aggregated ions have recently been shown to have a small cross-sectional area (<250 Å2) using ion mobility separation following ESI.15 There is strong evidence for a second pool of compounds, unrelated to the carboxylic acids, which strongly absorb UV light and have a very weak MS signal at m/z from 1000 to an unknown range higher than 2000.
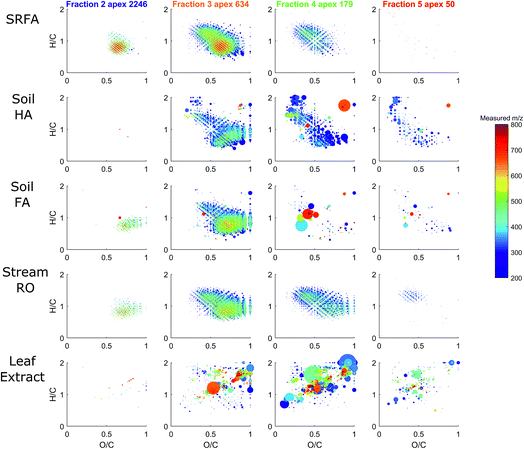
HPSEC fractions of these samples were isolated in silico in the same time windows as described in Fig. 6, and the assigned MS peaks are presented in van Krevelen diagrams in Fig. 8. The river/soil samples were broadly similar in extent across the van Krevelen space, although the SRFA and Stream RO sample had considerably more saturated compounds with H/C > 1.0 and O/C < 0.5 than the soil extracts. This also accounts for the lower abundance of material in the soil extracts in fractions 4–5, where more saturated compounds tend to elute due to their lower charge density (Fig. 5). The leaf extract was very different from the other samples, containing many more labile biomolecules52 with H/C > 1.5, including likely sugar and glycoside molecules with high oxygen and hydrogen saturation. These eluted across fractions 3–5.
Further discussion
Discrepancy between UV and MS results and the ‘true’ size distribution of DOM
The diverse chemistry of DOM has an important influence on its detection and characterisation by optical properties and mass spectrometry, and this study has demonstrated that there is a clear distinction in natural terrestrial mixtures between what is optically active and what is efficiently ionised by electrospray ionisation, with only moderate overlap between the two pools. These two pools are not separable with reversed-phase chromatography.9,35 The compounds that have high light attenuation and low MS signal are not considered in mass spectrometry studies, whereas they probably dominate the results in studies that use optical methods for the characterisation of DOM. The size range difference between optically active and ionisable DOM probably explains why solid phase extraction, which is poor at extracting high molecular weight components,53,54 has a minimal effect on ESI-MS results,54 but a large effect on absorption and fluorescence spectroscopy.55 Great care should therefore be taken in studies that aim to link the optical and MS character of terrestrial DOM56–60 or the concentration of DOC and MS signal,61 as the results being compared are not necessarily representing the same pools of carbon,47,48,62 and relationships are likely to be coincidental, albeit related.This larger molecular weight pool, which we refer to as phenolic compounds (Fig. 9), may be the coloured constituents that are most rapidly lost from terrestrial systems along transport to the sea,63–65 as well as the easiest components to remove during groundwater transport, surface sorption and drinking water treatment.66,67 This reactivity makes their characterisation highly important, and high resolution ESI-MS appears to be unsuitable for this particular task. Other ionisation techniques, such as atmospheric pressure photoionisation (APPI) and (matrix-assisted) laser desorption ionisation (MA)LDI, and different types of mass spectrometer with higher mass ranges may be useful in future work characterising this ‘phenolic’ material, but it is unlikely that one technique will be able to cover the full required analytical window due to the specificity and bias of each ionisation source.3,68,69
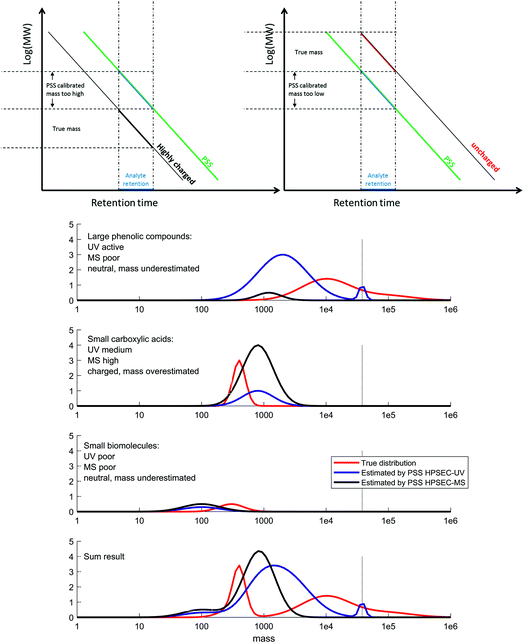 | ||
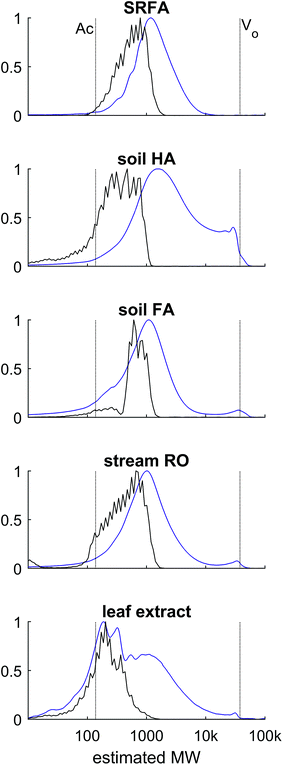
| Fig. 9 Conceptual figure summarising our results and conclusions. Top: calibration and apparent mass is highly affected by charge (Fig. 2), meaning a conceptual adjustment needs to be made when considering different analyte types. Bottom: DOM can be grouped into three main classes: large phenolic compounds (top), carboxylic acids (second), biomolecules (third) and the sum of all three (last). The true size distribution of each is plotted in red, and the obtained distribution by UV detection and MS detection is shown in blue and black, respectively. The amplitude of the distributions is affected by the response factor of the detector for that type of molecule, and the size distribution is affected by secondary effects on the column, depending mainly on charge. The direction and extent of bias for each class depends on the polymer used for calibration (in our case, PSS). V0 is indicated with a vertical dotted line. | ||
The true size distribution of DOM remains elusive using HPSEC due to the important secondary retention and exclusion effects that disrupt the technique. However, knowledge of how model compounds behave, along with information from UV and MS detection, allow us to form a better picture of the likely size distribution of DOM in natural systems based on our results (Fig. 9). We divide the DOM material into three classes, which we loosely name ‘phenolic’, ‘carboxylic’ and ‘small biomolecules’. These classes clearly have some overlaps, and are meant here only as a guide. We note that previous work using HPSEC coupled to NMR also determined three conceptual classes, in that case named ‘carbohydrate + aromatic’, ‘carboxylic rich alicyclic’ and ‘linear terpenoids’, respectively.17
How useful is chemical separation prior to detection in non-targeted complex mixture analysis?
Recent studies have shown that adding a separation to complex mixture analysis brings a new dimension of complexity to the data analysis, often without achieving the goal of separating individual isomers from the mixture.7,9,11,17,70,71 This may cast doubt on whether the added complexity and time are worthwhile, or simply complicate results that can already be taken from broadband analysis. We feel that the robust chemical information given by separation, especially coupled online to detection, is reason enough for its use. Reversed-phase chromatography can determine reliable solubility partitioning coefficients for the unknown analytes,72 and chromatography can separate functional classes from complex mixtures with implications for characterisation via NMR17 fluorescence spectroscopy,10,73 FT-infrared spectroscopy2 and mass spectrometry.8,9,29 Additionally, recent advances have shown that isomeric complexity can be fully resolved in certain cases when methods add enough dimensionality to the separations.8,16,28Unfortunately, there is no clear path towards one method that gives information about every single complex dimension of DOM. In terms of separation, HPSEC seems to be useful for broad analysis of intermolecular speciation and size, while reversed-phase and hydrophilic interaction chromatography are important for functional ‘smearing’ of material into broad classes, and certainly give clearer information about functionality than HPSEC. Other separation techniques, both old and new,74 may become useful depending on the particular research question. It may be useful to combine orthogonal chromatographic methods into 2D separations, but this is likely to involve too much complication for the wider community to embrace as a standard technique.
This study makes it clear that the choice of the analysis can have important consequences for the nature and completeness of data obtained. We recently analysed 74 headwater stream samples without prior solid phase extraction using a reversed-phase-high resolution MS technique,35 and separated material into three chromatographic fractions. Each fraction had a UV and MS response, but the high molecular weight, UV rich material with no MS response was hidden among the three fractions, and was not revealed in that study (Fig. SI3†). The analytical window and inherent biases of any chosen method must be considered in any study of complex mixtures, and the best tools moving forward will include various analytical windows in order to validate assumptions and to thoroughly explore correlations and dependencies within the data.48,60 Pitfalls to be aware of include limited analytical windows in ionisation and detection methods, interactions between DOM and the stationary phase during chromatography and other separations/extractions, and molecules occurring as aggregates and other inter-molecular effects, either naturally or during chromatography and analysis. Considering the diversity of DOM and the different rates at which different fractions of it react in natural waters,75,76 a full coverage of the molecular diversity of DOM is needed in order to understand its biogeochemistry. Our results support the view that an accurate understanding of DOM and its behaviour in natural environments requires a battery of different techniques, including methods that allow characterisation of molecules larger than those detectable by the currently common ESI-FTICRMS and ESI-Orbitrap MS techniques.
Conflicts of interest
There are no conflicts to declare.References
- N. Hertkorn, M. Frommberger, M. Witt, B. P. Koch, P. Schmitt-Kopplin and E. M. Perdue, Anal. Chem., 2008, 80, 8908–8919 CrossRef CAS.
- C. Landry and L. Tremblay, Environ. Sci. Technol., 2012, 46, 1700–1707 CrossRef CAS.
- N. Hertkorn, M. Frommberger, M. Witt, B. P. Koch, P. Schmitt-Kopplin and E. M. Perdue, Anal. Chem., 2008, 80, 8908–8919 CrossRef CAS PubMed.
- A. C. Stenson, W. M. Landing, A. G. Marshall and W. T. Cooper, Anal. Chem., 2002, 74, 4397–4409 CrossRef CAS.
- J. A. Hawkes, C. Patriarca, P. J. R. Sjöberg, L. J. Tranvik and J. Bergquist, Limnol. Oceanogr. Lett., 2018, 3, 21–30 CrossRef CAS.
- M. Zark, J. Christoffers and T. Dittmar, Mar. Chem., 2017, 191, 9–15 CrossRef CAS.
- G. C. Woods, M. J. Simpson, P. J. Koerner, A. Napoli and A. J. Simpson, Environ. Sci. Technol., 2011, 45, 3880–3886 CrossRef CAS.
- T. A. Brown, B. A. Jackson, B. J. Bythell and A. C. Stenson, J. Chromatogr. A, 2016, 1470, 84–96 CrossRef CAS PubMed.
- C. Patriarca, J. Bergquist, P. J. R. Sjöberg, L. Tranvik and J. A. Hawkes, Environ. Sci. Technol., 2018, 52, 2091–2099 CrossRef CAS PubMed.
- U. J. Wünsch, K. R. Murphy and C. A. Stedmon, Environ. Sci. Technol., 2017, 51, 11900–11908 CrossRef PubMed.
- T. Reemtsma and A. These, Anal. Chem., 2003, 75, 1500–1507 CrossRef CAS PubMed.
- P. Schmitt-Kopplin, A. W. Garrison, E. M. Perdue, D. Freitag and A. Kettrup, J. Chromatogr. A, 1998, 807, 101–109 CrossRef CAS.
- R. M. B. O. Duarte, A. C. Barros and A. C. Duarte, J. Chromatogr. A, 2012, 1249, 138–146 CrossRef CAS.
- S. Sandron, P. N. Nesterenko, M. V. McCaul, B. Kelleher and B. Paull, J. Sep. Sci., 2014, 37, 135–142 CrossRef CAS.
- K. Lu, W. S. Gardner and Z. Liu, Environ. Sci. Technol., 2018, 52, 7182–7191 CrossRef CAS PubMed.
- N. Arakawa, L. I. Aluwihare, A. J. Simpson, R. Soong, B. M. Stephens and D. Lane-coplen, Sci. Adv., 2017, 3, e1602976 CrossRef PubMed.
- G. C. Woods, M. J. Simpson, B. P. Kelleher, M. McCaul, W. L. Kingery and A. J. A. J. Simpson, Environ. Sci. Technol., 2010, 44, 624–630 CrossRef CAS PubMed.
- A. Piccolo and P. Conte, Adv. Environ. Res., 2000, 3, 508–521 Search PubMed.
- B. Varga, G. Kiss, I. Galambos, A. Gelencsér, J. Hlavay and Z. Krivácsy, Environ. Sci. Technol., 2000, 34, 3303–3306 CrossRef CAS.
- S. A. Huber, A. Balz, M. Abert and W. Pronk, Water Res., 2011, 45, 879–885 CrossRef CAS PubMed.
- G. Riise, P. Van Hees, U. Lundström and L. Tau Strand, Geoderma, 2000, 94, 237–247 CrossRef CAS.
- I. Christl, H. Knicker, I. Kögel-Knabner and R. Kretzschmar, Eur. J. Soil Sci., 2000, 51, 617–625 CrossRef CAS.
- L. J. Tranvik, Appl. Environ. Microbiol., 1990, 56, 1672–1677 CAS.
- M. Pivokonsky, J. Safarikova, M. Baresova, L. Pivokonska and I. Kopecka, Water Res., 2014, 51, 37–46 CrossRef CAS PubMed.
- B. Koch, M. Witt, R. Engbrodt, T. Dittmar and G. Kattner, Geochim. Cosmochim. Acta, 2005, 69, 3299–3308 CrossRef CAS.
- P. Conte and A. Piccolo, Chemosphere, 1999, 38, 517–528 CrossRef CAS PubMed.
- M. Kerner, H. Hohenberg and S. Ertl, Nature, 2003, 422, 147–150 CrossRef PubMed.
- A. J. Simpson, L. H. Tseng, M. J. Simpson, M. Spraul, U. Braumann, W. L. Kingery, B. P. Kelleher and M. H. B. Hayes, Analyst, 2004, 129, 1216–1222 RSC.
- T. Reemtsma, A. These, A. Springer and M. Linscheid, Water Res., 2008, 42, 63–72 CrossRef CAS PubMed.
- D. N. Kothawala, R. D. Evans and P. J. Dillon, Water Resour. Res., 2006, 42, 1–8 CrossRef.
- M. Hutta, R. Góra, R. Halko and M. Chalányová, J. Chromatogr. A, 2011, 1218, 8946–8957 CrossRef CAS PubMed.
- S. Mori, Anal. Chem., 1989, 61, 530–534 CrossRef CAS.
- S. M. Hunt, M. M. Sheil, M. Belov and P. J. Derrick, Anal. Chem., 1998, 70, 1812–1822 CrossRef CAS PubMed.
- S. M. Serkiz and E. M. Perdue, Water Res., 1990, 24, 911–916 CrossRef CAS.
- J. A. Hawkes, N. Radoman, J. Bergquist, M. B. Wallin, L. J. Tranvik and S. Löfgren, Sci. Rep., 2018, 8, 16060 CrossRef PubMed.
- P. Herzsprung, N. Hertkorn, W. von Tümpling, M. Harir, K. Friese and P. Schmitt-Kopplin, Anal. Bioanal. Chem., 2014, 406, 7977–7987 CrossRef CAS PubMed.
- J. Peuravuori and K. Pihlaja, Anal. Chim. Acta, 1997, 337, 133–149 CrossRef CAS.
- M. Gavrilov and M. J. Monteiro, Eur. Polym. J., 2015, 65, 191–196 CrossRef CAS.
- P. L. Dubin, Aqueous Size-Exclusion Chromatography, Elsevier, 1988 Search PubMed.
- M. Berdén and D. Berggren, J. Soil Sci., 1990, 41, 61–72 CrossRef.
- G. Guiochon, A. Felinger, D. G. Shirazi and A. M. Katti, Fundamentals of Preparative and Nonlinear Chromatography, Elsevier Academic Press, 2nd edn., 2006 Search PubMed.
- A. Zherebker, Y. Kostyukevich, A. Kononikhin, O. Kharybin, A. I. Konstantinov, K. V. Zaitsev, E. Nikolaev and I. V. Perminova, Anal. Bioanal. Chem., 2017, 409, 2477–2488 CrossRef CAS PubMed.
- J. A. Leenheer, R. L. Wershaw and M. M. Reddy, Environ. Sci. Technol., 1995, 29, 393–398 CrossRef CAS PubMed.
- M. Witt, J. Fuchser and B. P. Koch, Anal. Chem., 2009, 81, 2688–2694 CrossRef CAS PubMed.
- M. Baalousha, M. Motelica-Heino and P. Le Coustumer, Colloids Surf., A, 2006, 272, 48–55 CrossRef CAS.
- B. C. McAdams, G. R. Aiken, D. M. McKnight, W. A. Arnold and Y. P. Chin, Environ. Sci. Technol., 2018, 52, 722–730 CrossRef CAS PubMed.
- N. Her, G. Amy, D. Foss and J. Cho, Environ. Sci. Technol., 2002, 36, 3393–3399 CrossRef CAS PubMed.
- A. These and T. Reemtsma, Anal. Chem., 2003, 75, 6275–6281 CrossRef CAS PubMed.
- N. R. Novotny, E. N. Capley and A. C. Stenson, J. Mass Spectrom., 2014, 49, 316–326 CrossRef CAS PubMed.
- A. Piccolo and M. Spiteller, Anal. Bioanal. Chem., 2003, 377, 1047–1059 CrossRef CAS PubMed.
- M. B. Müller, D. Schmitt and F. H. Frimmel, Environ. Sci. Technol., 2000, 34, 4867–4872 CrossRef.
- J. D’Andrilli, W. T. Cooper, C. M. Foreman and A. G. Marshall, Rapid Commun. Mass Spectrom., 2015, 29, 2385–2401 CrossRef PubMed.
- J. A. Hawkes, C. T. Hansen, T. Goldhammer, W. Bach and T. Dittmar, Geochim. Cosmochim. Acta, 2016, 175, 68–85 CrossRef CAS.
- J. Raeke, O. J. Lechtenfeld, M. Wagner, P. Herzsprung and T. Reemtsma, Environ. Sci.: Processes Impacts, 2016, 18, 918–927 RSC.
- U. J. Wünsch, J. K. Geuer, O. J. Lechtenfeld, B. P. Koch, K. R. Murphy and C. A. Stedmon, Mar. Chem., 2018, 207, 33–41 CrossRef.
- A. M. Kellerman, F. Guillemette, D. C. Podgorski, G. R. Aiken, K. D. Butler and R. G. M. Spencer, Environ. Sci. Technol., 2018, 52, 2538–2548 CrossRef CAS PubMed.
- E. E. Lavonen, D. N. Kothawala, L. J. Tranvik, M. Gonsior, P. Schmitt-Kopplin and S. J. Köhler, Water Res., 2015, 85, 286–294 CrossRef CAS PubMed.
- S. Wagner, R. Jaffé, K. Cawley, T. Dittmar and A. Stubbins, Front. Chem., 2015, 3, 1–14 Search PubMed.
- P. Herzsprung, W. Von Tümpling, N. Hertkorn, M. Harir, O. Büttner, J. Bravidor, K. Friese and P. Schmitt-Kopplin, Environ. Sci. Technol., 2012, 46, 5511–5518 CrossRef CAS PubMed.
- U. J. Wünsch, E. Acar, B. P. Koch, K. R. Murphy, P. Schmitt-Kopplin and C. A. Stedmon, Anal. Chem., 2018, 90, 14188–14197 CrossRef PubMed.
- A. Mostovaya, J. A. Hawkes, B. Koehler, T. Dittmar and L. J. Tranvik, Environ. Sci. Technol., 2017, 51, 11571–11579 CrossRef CAS PubMed.
- A. A. Malik, V. N. Roth, M. Hébert, L. Tremblay, T. Dittmar and G. Gleixner, Soil Biol. Biochem., 2016, 100, 66–73 CrossRef CAS.
- G. A. Weyhenmeyer, M. Fröberg, E. Karltun, M. Khalili, D. Kothawala, J. Temnerud and L. J. Tranvik, Glob. Chang. Biol., 2012, 18, 349–355 CrossRef.
- T. Dittmar, K. Whitehead, E. C. Minor and B. P. Koch, Mar. Chem., 2007, 107, 378–387 CrossRef CAS.
- S. J. Köhler, D. Kothawala, M. N. Futter, O. Liungman and L. Tranvik, PLoS One, 2013, 8, 1–12 Search PubMed.
- C. H. Specht, M. U. Kumke and F. H. Frimmel, Water Res., 2000, 34, 4063–4069 CrossRef CAS.
- T. K. Nissinen, I. T. Miettinen, P. J. Martikainen and T. Vartiainen, Chemosphere, 2001, 45, 865–873 CrossRef CAS PubMed.
- D. Cao, H. Huang, M. Hu, L. Cui, F. Geng, Z. Rao, H. Niu, Y. Cai and Y. Kang, Anal. Chim. Acta, 2015, 866, 48–58 CrossRef CAS PubMed.
- J. D. Andrilli, T. Dittmar, B. P. Koch, J. M. Purcell, A. G. Marshall and W. T. Cooper, Rapid Commun. Mass Spectrom., 2010, 24, 643–650 CrossRef PubMed.
- T. Dittmar, B. Koch, N. Hertkorn and G. Kattner, Limnol. Oceanogr.: Methods, 2008, 6, 230–235 CrossRef CAS.
- S. Sandron, N. W. Davies, R. Wilson, A. R. Cardona, P. R. Haddad, P. N. Nesterenko and B. Paull, Chromatographia, 2018, 81, 203–213 CrossRef CAS.
- K. Namjesnik-Dejanovic and S. E. Cabaniss, Environ. Sci. Technol., 2004, 38, 1108–1114 CrossRef CAS.
- W. T. Li, S. Y. Chen, Z. X. Xu, Y. Li, C. D. Shuang and A. M. Li, Environ. Sci. Technol., 2014, 48, 2603–2609 CrossRef CAS PubMed.
- S. Sandron, A. Rojas, R. Wilson, N. W. Davies, P. R. Haddad, R. A. Shellie, P. N. Nesterenko, B. P. Kelleher and B. Paull, Environ. Sci.: Processes Impacts, 2015, 17, 1531–1567 RSC.
- A. M. Kellerman, T. Dittmar, D. N. Kothawala and L. J. Tranvik, Nat. Commun., 2014, 5, 1–8 Search PubMed.
- B. Koehler, E. Von Wachenfeldt, D. Kothawala and L. J. Tranvik, J. Geophys. Res.: Biogeosci., 2012, 117, 1–14 Search PubMed.
Footnote |
| † Electronic supplementary information (ESI) available. See DOI: 10.1039/c8fd00222c |
| This journal is © The Royal Society of Chemistry 2019 |


