 Open Access Article
Lanthanide doping induced electrochemical enhancement of Na2Ti3O7 anodes for sodium-ion batteries†
Jiale
Xia‡
a,
Hongyang
Zhao‡
ab,
Wei Kong
Pang
 c,
Zongyou
Yin
 *d,
Bo
Zhou
e,
Gang
He
 a,
Zaiping
Guo
 c and
Yaping
Du
 *af
*af
aFrontier Institute of Science and Technology, Xi'an Jiaotong University, 99 Yanxiang Road, Yanta District, Xi'an, Shaanxi 710054, China. E-mail: ypdu@nankai.edu.cn
bSchool of Science, Xi'an Jiaotong University, 28 Xianning West Road, Xi'an, Shaanxi 710049, China
cInstitute for Superconducting and Electronic Materials, University of Wollongong, 2522 NSW, Australia
dResearch School of Chemistry, The Australian National University, Canberra, Australian Capital Territory 2601, Australia. E-mail: zongyou.yin@anu.edu.au
eDepartment of Physics, Northwest University, Shaanxi 710069, China
fSchool of Materials Science and Engineering, National Institute for Advanced Materials, Nankai University, 38 Tongyan Road, Haihe Education Park, Tianjin 300350, China
First published on 20th February 2018
Abstract
Na2Ti3O7 is considered as a promising anode material for sodium ion batteries (SIBs) due to its excellent high-rate performance compared with hard carbons. However, the electrochemical performance of Na2Ti3O7 is heavily limited by its low electrical conductivity. In this study, we synthesized a series of lanthanide (Ln = La, Ce, Nd, Sm, Gd, Er, and Yb) doped microsized Na2Ti3O7 anode materials and systematically studied the electrochemical performance. Compared with pristine Na2Ti3O7, all the doped samples show superior electrochemical performance. Especially, the Yb3+ doped sample not only delivers a high reversible capacity of 89.4 mA h g−1 at 30C, but also maintains 71.6 mA h g−1 at 5C after 1600 cycles, nearly twice that of pristine Na2Ti3O7. It is found for the first time that the enhancement in doped samples is attributed to the introduction of lanthanides which induces lattice distortion and oxygen vacancies.
Introduction
Insertion-type electrodes are always the first choice for battery electrodes because alkali metal ions can repeatedly intercalate into the layers of electrode materials without destroying their crystal lattices which will occur in transition-type and alloy-type electrodes.1–4 The excellent performance of insertion-type electrodes can be interpreted as being due to intercalation pseudocapacitance, in which the capacity is independent of rate in an appropriate current range.5 Therefore, insertion-type electrodes usually have excellent cycle life and good rate capability. However, limited kinds of materials can be used for anodes for insertion-type sodium ion batteries (SIBs). Materials with excellent rate performance in lithium ion batteries (LIBs) cannot maintain their performance when used for SIBs due to the larger ionic radius of sodium.Na2Ti3O7 (NTO) is a promising insertion-type anode material because the TiO6 octahedron layer can reversibly accommodate sodium ions during cycling, with a theoretical capacity of 178 mA h g−1.6 Besides, NTO has an efficient low charge–discharge plateau of 0.3 V and is the first ever reported oxide to reversibly react with sodium at such a low voltage.7 However, the low electrical conductivity makes it difficult to reach its theoretical capacity and the specific capacity of NTO is quite low compared with those of hard carbons or even some organic anodes.8–10 In addition, the fast capacity fading during long-time cycling has greatly limited its practical application for SIBs.11 Based on the above concerns, there is an urgent need to find a way to enhance the intrinsic electrical conductivity of NTO.
It is reported that creating defects in the crystal lattice can enhance the conductivity as well as the capacity of metal oxide electrodes.12–15 As an important kind of dopant in LIB electrodes, lanthanide ions can significantly enhance both the capacity and rate performance of the electrodes.16–18 Even a trace amount of lanthanide introduction would lead to a great enhancement of specific capacity as well as rate performance of LIBs. This inspired us to transplant such a doping strategy from LIBs to SIBs. To date, lanthanide doped electrodes for SIBs, especially insertion-type anode materials, have never been reported. In order to systematically study the doping effect, we used microsized NTO to eliminate the contribution of surface redox reactions. La, Ce, Nd, Sm, Gd, Er and Yb as representatives of light, middle and heavy lanthanides were chosen as dopants and introduced into NTO (labeled NTO:Ln).
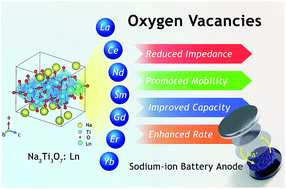
Compared with pristine NTO, the doped samples show superior electrochemical performance. Especially, NTO:Yb not only delivers a high reversible capacity of 89.4 mA h g−1 at 30C, but also maintains 71.6 mA h g−1 at 5C after 1600 cycles, nearly twice that of pristine NTO. Therefore, NTO:Yb is selected as a representative to illustrate the effects of doping a lanthanide on the structure and the electrochemical performance of NTO. It is found for the first time that the electrochemical enhancement in doped samples could be attributed to the introduction of lanthanides, which induces lattice distortion and oxygen defects, resulting in improved electrical conductivity and charge storage kinetics (Fig. 1).
Results and discussion
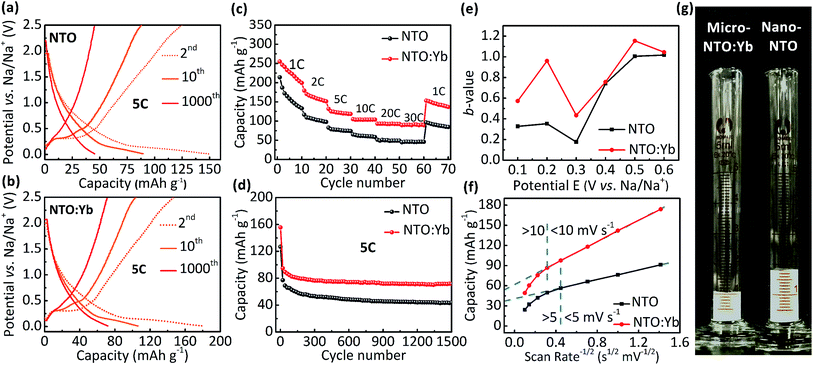
The electrochemical performance is evaluated between 0.01 and 2.5 V. It can be observed that both NTO and NTO:Yb have low voltage plateaus at 0.3 V (Fig. 2a and b), which are consistent with the CV measurements (Fig. S1, ESI†). The voltage plateaus of both NTO and NTO:Yb gradually disappear in the following charge/discharge process which may be attributed to the reconstructed crystal structure during the sodium intercalation or the electrode polarization.19,20 However, after 1000 cycles, there is still a small voltage plateau of NTO:Yb while the plateau of NTO almost disappeared, suggesting that doping Yb3+ could stabilize the electrode structure during the charge/discharge process, thereby leading to a better rate performance of NTO:Yb, which will be further discussed later.The initial discharge capacity of NTO is 214.1 mA h g−1 at the current rate of 1C and then decreases to a mere 44.9 mA h g−1 at the highest current rate of 30C. In the meantime, NTO:Yb delivers a much better rate performance with the delivered capacity being 89.4 mA h g−1 at 30C, almost twice as much as the capacity of NTO (Fig. 2c). Additionally, when the current rate returns back to 1C after a high rate cycling at 30C, the capacity of NTO:Yb increases to 153.1 mA h g−1 with 60.02% retention of the initial capacity, while the capacity of NTO recovered to only 96.4 mA h g−1 with a capacity retention of 45.03%. After 1500 cycles at 5C, the discharge capacity of NTO is 43.9 mA h g−1 with a capacity retention of 34.58%, but for NTO:Yb, the discharge capacity remains at 71.6 mA h g−1 with a capacity retention of 46.02% (Fig. 2d). The capacities of both NTO and NTO:Yb decline rapidly after several cycles at 5C, and the irreversible capacity loss could be attributed to the increasing polarization caused by the electrolyte decomposition or side reaction and the formation of a solid electrolyte interface (SEI) layer.11,20
To further analyze the kinetics of NTO and NTO:Yb at different rates, we calculate the b-values of the materials through the analysis of CV plots (Fig. S2, ESI†). In a CV scan, the current i is a function of the scan rate v through the following relationship:21
| i = avb | (1) |
The microstructures of NTO and NTO:Yb are further elucidated by HRTEM and Rietveld XRD refinement (Fig. S4, ESI†). It is clearly demonstrated that the obtained lattice parameters of a, b and c decrease after Yb3+ doping, and the tiny shrink of the lattice distance may attribute to the stronger bonding energy of the Yb–O bond. It is believed that the crystal lattice distortion owing to the introduction of lanthanide ions will give rise to the generation of oxygen vacancies.25 The reaction for oxygen vacancy formation using Kroger–Vink notation can be expressed as:
 | (2) |
As oxygen vacancies can act as shallow donors and thereby increase the carrier density as well as the electrical conductivity,26 the improved electrochemical performance can be attributed to the formation of oxygen vacancies, and comprehensive studies are carried out to illustrate the existence and effects of oxygen vacancies.
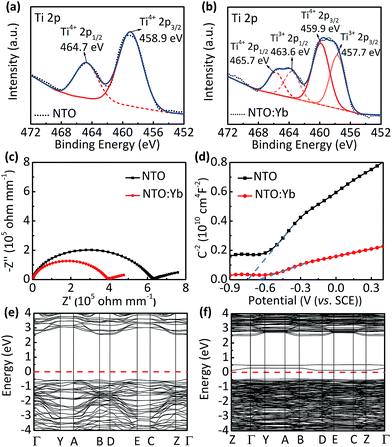
Furthermore, X-ray photoelectron spectroscopy (XPS) shows additional peaks corresponding to Ti 2p doublets of Ti3+ at 457.7 and 463.6 eV in NTO:Yb, suggesting that there is a small quantity of Ti ion reduced from Ti4+ to Ti3+ to maintain the charge compensation (Fig. 3a and b).27 These results indicate that doping Yb3+ into the structure of NTO causes the generation of oxygen vacancies, leading to partial reduction of the Ti element as well as the increasing number of unlocalized electrons, which will improve the electrical conductivity and show better electrochemical performance of NTO:Yb.
Thermogravimetric analysis (TGA) is employed to provide a greater insight into the oxygen vacancies in both NTO and NTO:Yb.28 The larger mass discrepancies of NTO:Yb between air and N2 suggest a larger oxygen vacancy concentration (Fig. S5, ESI†), which is consistent with the results of XPS analysis. The electrical conductivity is investigated by EIS and a four-probe test. The bulk conductivity of NTO is calculated to be 1.188 × 10⁻⁷ S cm−1, which is lower than the value of NTO:Yb at 1.888 × 10⁻⁷ S cm−1 (Fig. 3c). Besides, the conductivities obtained by the four probe method (Table S1, ESI†) agree with the results of EIS, indicating a better electron transport in the bulk of Yb3+ doped materials, corresponding to the better rate performance of NTO:Yb.
In addition, Mott–Schottky (M–S) analysis is also employed to calculate donor densities. It can be obviously observed that NTO:Yb delivers a larger donor density than NTO owing to the lower slope in the M–S plots (Fig. 3d), and the values of donor densities are calculated to be 3.5292 × 1026 and 11.1549 × 1026 cm−3 for NTO and NTO:Yb, respectively. The improvement of electron conductivity and donor densities after doping Yb3+ can be ascribed to the increasing oxygen vacancies.
First principles calculations are carried out to obtain further insight into the electronic conductivity change of NTO:Yb. The Yb3+ doped Na2Ti3O7 system is modeled by substituting one of the 18 Ti ions with a Yb ion (Fig. S6, ESI†). The band structure and density of states (DOS) of NTO and NTO:Yb which can initially describe the intrinsic characterization of electronic conductivity are presented in Fig. 3e and f and S7 (ESI†).26 It can be seen that NTO shows a direct bandgap of 3.07 eV while the bandgap of NTO:Yb decreased to 0.58 eV, which indicates that the polaron migration energy barrier along the constrained pathway is decreased,25 thus attributing to a larger electronic conductivity of NTO:Yb.
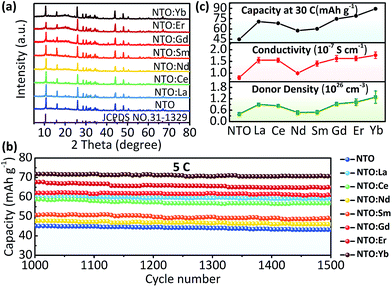
Finally, we have an overview of structure and electrochemical performance of all NTO:Ln samples. The major diffraction peaks of XRD patterns of all samples match well with the standard XRD trace of Na2Ti3O7 (JCPDS no. 31-1329) (Fig. 4a). The existence of Ti3+ as well as other Ln3+ ions is confirmed by XPS (Fig. S8 and S9, ESI†). Besides, all samples are micro-sized materials (Fig. S10, ESI†). The rate and long-term cycling performances (Fig. 4b, S11 and S12, ESI†) show that all the Ln3+ doped samples exhibited better electrochemical performance than NTO. Among all these electrodes, NTO:Yb presented the best performance, followed by NTO:Er, NTO:Gd, NTO:La, NTO:Ce, NTO:Sm and NTO:Nd successively. Importantly, it's clear that the capacity as well as the conductivity and donor density of each sample are in a sort order (Fig. 4c, S13 and Table S2, ESI†), which is well consistent with the concentrations of oxygen vacancies of each sample (Fig. S14, ESI†).
Conclusions
In summary, we have synthesized for the first time a series of lanthanide doped NTO electrode materials through a high-temperature solid-state method. All the lanthanide doped NTO samples exhibited superior electrochemical performance to pristine NTO. For the first time, we have achieved high performance for NTO anodes without nanosizing and carbon-coating. The introduction of lanthanide into the structure of NTO leads to a slight lattice distortion, thus giving rise to the generation of oxygen vacancies, which significantly improves the electronic conductivity and donor density of NTO and promotes faster charge storage kinetics, thereby ensuring a superior rate performance and long-time cycle performance. We believe that the incorporation of lanthanides into insertion-type electrode materials could provide a new avenue for constructing anode materials with excellent electrochemical performance for large-scale energy storage.Conflicts of interest
There are no conflicts to declare.Acknowledgements
We appreciate Prof. Chunhua Yan for his kind suggestions. The research reported in this publication was supported by the China National Funds for Excellent Young Scientists (grant no. 21522106), the National Key R&D Program of China (2017YFA0208000), and the ANU Futures Scheme (Grant No. Q4601024). Financial support provided by the Australian Research Council (ARC) (FT150100109, FT160100251 and DP170102406) is gratefully acknowledged.Notes and references
- J. M. Tarascon and M. Armand, Nature, 2001, 414, 359–367 CrossRef CAS PubMed.
- V. Aravindan, J. Gnanaraj, Y. S. Lee and S. Madhavi, Chem. Rev., 2014, 114, 11619–11635 CrossRef CAS PubMed.
- L. Shen, S. Chen, J. Maier and Y. Yu, Adv. Mater., 2017, 29, 1701571 CrossRef PubMed.
- L. Shen, E. Uchaker, X. Zhang and G. Cao, Adv. Mater., 2012, 24, 6502–6506 CrossRef CAS PubMed.
- V. Augustyn, P. Simon and B. Dunn, Energy Environ. Sci., 2014, 7, 1597 CAS.
- S. Dong, L. Shen, H. Li, G. Pang, H. Dou and X. Zhang, Adv. Funct. Mater., 2016, 26, 3703–3710 CrossRef CAS.
- P. Senguttuvan, G. Rousse, V. Seznec, J.-M. Tarascon and M. R. Palacín, Chem. Mater., 2011, 23, 4109–4111 CrossRef CAS.
- L. Zhao, J. Zhao, Y.-S. Hu, H. Li, Z. Zhou, M. Armand and L. Chen, Adv. Energy Mater., 2012, 2, 962–965 CrossRef CAS.
- A. Rudola, K. Saravanan, C. W. Mason and P. Balaya, J. Mater. Chem. A, 2013, 1, 2653 CAS.
- Y. Park, D.-S. Shin, S. H. Woo, N. S. Choi, K. H. Shin, S. M. Oh, K. T. Lee and S. Y. Hong, Adv. Mater., 2012, 24, 3562–3567 CrossRef CAS PubMed.
- H. Pan, X. Lu, X. Yu, Y.-S. Hu, H. Li, X.-Q. Yang and L. Chen, Adv. Energy Mater., 2013, 3, 1186–1194 CrossRef CAS.
- J. M. Feckl, K. Fominykh, M. Doblinger, D. Fattakhova-Rohlfing and T. Bein, Angew. Chem., Int. Ed., 2012, 51, 7459–7463 CrossRef CAS PubMed.
- S. Balendhran, J. Deng, J. Z. Ou, S. Walia, J. Scott, J. Tang, K. L. Wang, M. R. Field, S. Russo, S. Zhuiykov, M. S. Strano, N. Medhekar, S. Sriram, M. Bhaskaran and K. Kalantar-zadeh, Adv. Mater., 2013, 25, 109–114 CrossRef CAS PubMed.
- X. K. Hu, Y. T. Qian, Z. Song, J. R. Huang, R. Cao and J. Q. Xiao, Chem. Mater., 2008, 20, 1527–1533 CrossRef CAS.
- Y. Ding, P. Zhang, Y. Jiang and D. Gao, Solid State Ionics, 2007, 178, 967–971 CrossRef CAS.
- P. Zhang, Y. Huang, W. Jia, Y. Cai, X. Wang, Y. Guo, D. Jia, Z. Sun and Z. Guo, Electrochim. Acta, 2016, 210, 935–941 CrossRef CAS.
- G. B. Xu, L. W. Yang, X. L. Wei, J. W. Ding, J. X. Zhong and P. K. Chu, J. Power Sources, 2015, 295, 305–313 CrossRef CAS.
- Y. Zhang, S. Xia, Y. Zhang, P. Dong, Y. Yan and R. Yang, Sci. Bull., 2012, 57, 4181–4187 CrossRef CAS.
- T. Brezesinski, J. Wang, S. H. Tolbert and B. Dunn, Nat. Mater., 2010, 9, 146–151 CrossRef CAS PubMed.
- H. Wu, G. Zheng, N. Liu, T. J. Carney, Y. Yang and Y. Cui, Nano Lett., 2012, 12, 904–909 CrossRef CAS PubMed.
- H. Lindström, S. Södergren, A. Solbrand, H. Rensmo, J. Hjelm, A. Hagfeldt and S.-E. Lindquist, J. Phys. Chem. B, 1997, 101, 7717–7722 CrossRef.
- J. Wang, J. Polleux, J. Lim and B. Dunn, J. Phys. Chem. C, 2007, 111, 14925–14931 CAS.
- V. Augustyn, J. Come, M. A. Lowe, J. W. Kim, P. L. Taberna, S. H. Tolbert, H. D. Abruna, P. Simon and B. Dunn, Nat. Mater., 2013, 12, 518–522 CrossRef CAS PubMed.
- H. Vogt, Electrochim. Acta, 1994, 39, 1981–1983 CrossRef CAS.
- F. Ning, B. Xu, J. Shi, M. Wu, Y. Hu and C. Ouyang, J. Phys. Chem. C, 2016, 120, 18428–18434 CAS.
- C. Ouyang, Y. Du, S. Shi and M. Lei, Phys. Lett. A, 2009, 373, 2796–2799 CrossRef CAS.
- D. Gonbeau, C. Guimon, G. Pfister-Guillouzo, A. Levasseur, G. Meunier and R. Dormoy, Surf. Sci., 1991, 254, 81–89 CrossRef CAS.
- H. S. Kim, J. B. Cook, H. Lin, J. S. Ko, S. H. Tolbert, V. Ozolins and B. Dunn, Nat. Mater., 2017, 16, 454–460 CrossRef CAS PubMed.
Footnotes |
| † Electronic supplementary information (ESI) available. See DOI: 10.1039/c7sc05185a |
| ‡ These authors contributed equally. |
| This journal is © The Royal Society of Chemistry 2018 |


