 Open Access Article
Nopinone-based aggregation-induced emission (AIE)-active difluoroboron β-diketonate complex: photophysical, electrochemical and electroluminescence properties†
Qian
Jiang
a,
Mingguang
Zhang
a,
Zhonglong
Wang
a,
Jie
Song
b,
Yiqin
Yang
ac,
Wenchao
Li
d,
Wen
Gu
ac,
Xu
Xu
*ac,
Haijun
Xu
*ac and
Shifa
Wang
 *ac
*ac
aCollege of Chemical Engineering, Nanjing Forestry University, Nanjing, 210037, P. R. China
bDepartment of Chemistry and Biochemistry, University of Michigan-Flint, Flint, MI 48502, USA
cCo-Innovation Center of Efficient Processing and Utilization of Forest Resources, Nanjing Forestry University, Nanjing, 210037, P. R. China
dSinofert, Sinochem Group, Beijing, 100031, P. R. China
First published on 24th August 2018
Abstract
Four difluoroboron (BF2) β-diketonate nopinone complexes 3a–3d that exhibited typical aggregation-induced emission (AIE) properties were synthesized using the natural renewable β-pinene derivative nopinone as the starting material. The thermal, photophysical, electrochemical and electroluminescent properties as well as the AIE properties of complexes 3a–3d were analyzed systematically. The data of photophysical and electrochemical demonstrated that compound 3b with a methoxy group exhibited the largest bathochromic shift, the highest absolute photoluminescence quantum yields and narrowest optical bandgap among 3a–3d. Using 3b as the emitter, electroluminescent (EL) device I exhibits blue-green light with CIE coordinates of (0.2774, 0.4531) and showed a better performance with a luminous efficacy (ηp) of 7.09 lm W−1 and correlated color temperature (TC) of 7028 K. The results demonstrate that new AIE compounds are promising solid-state luminescent materials with practical utility in electroluminescent materials.
1. Introduction
In recent years, organoboron complexes as the most important type of fluorescent dyes,1,2 have caused great interest. Difluoroboron (BF2) complexes based on N- and O-donor ligands are known to show intense fluorescence in solution and solid state.3,4 Besides, they have outstanding fluorescence properties such as high quantum yield, large stokes shifts, intense emission, thermal and photochemical stability.5–8 These features have been exploited in NIR9,10 and molecular probes,11 optical imaging,12,13 solar cells,14 oxygen15 and mechanical sensors,16,17 laser dyes,18 anion receptors19,20 and organogels.21 For example, some difluoroboron (BF2) β-diketonate complexes showed mechanochromic luminescence.22 In 2015, some new difluoroboron complexes were reported as biological oxygen sensors.23,24Traditional luminophores generally suffer from the aggregation-caused quenching (ACQ) effect, which reduced the performance of traditional luminophores when used in optoelectronic devices. In 2001, Tang discovered the phenomenon of aggregation-induced emission (AIE): luminophores show non-fluorescent in solutions, but highly emissive in aggregate formation or in crystalline state.25 The main cause of the AIE effects is restriction of intramolecular motions (RIM), including rotation and vibration along the C–C single bond.26 Many fluorescent organic dyes showing AIE properties are studied, they include tetraphenylethene,27,28 siloles,29–31 BODIPY dyes,32,33 triphenylethene,34,35 tetraphenyl-1,4-butadiene (TPBD),36 pentacenequinone37 and isophorone38 based dyes. Recently, the exploration of new AIE fluorophores is still a challenging field to synthetic chemist. In this paper, a simple strategy to synthesize high-performance solid-state light emitters with AIE property is proposed.
As a rich and cheap plant essential oils, the annual output of turpentine is about 100![[thin space (1/6-em)]](https://www.rsc.org/images/entities/char_2009.gif) 000 tons or more. Nopinone is a derivative synthesized from β-pinene, which is a main ingredient of turpentine. In recent years, many nopinone derivatives have been synthesized such as 3-cyanopyridine derivatives,39 chiral 1,3-aminoalcohols and 1,3-diols,40 terpenyl diselenides,41 quinazolin-2-amine nopinone derivatives.42 However, there is no work about using the pinane frame to construct some new EL materials.
000 tons or more. Nopinone is a derivative synthesized from β-pinene, which is a main ingredient of turpentine. In recent years, many nopinone derivatives have been synthesized such as 3-cyanopyridine derivatives,39 chiral 1,3-aminoalcohols and 1,3-diols,40 terpenyl diselenides,41 quinazolin-2-amine nopinone derivatives.42 However, there is no work about using the pinane frame to construct some new EL materials.
In this paper, we designed and synthesized four novel nopinone derivatives-containing difluoroboron β-diketonate groups. The synthetic route is illustrated in Scheme 1. The structures of these compounds are characterized with 1H NMR, 13C NMR, HRMS and X-ray analyses. The thermal, photophysical, electrochemical properties, and molecular orbital distribution of four new fluorescent compounds are also investigated. Finally, two of them have been successfully applied to electroluminescent devices. This is the first report of nopinone-based fluorescent compounds for electroluminescence materials application.
2. Experimental
2.1. Materials and measurements
Reagents and solvents were purchased from commercial suppliers and used without further purification. Mass spectra were carried out on an America Agilent 5975c mass spectrometer. The 1H NMR and 13C NMR spectra were recorded in CDCl3 solutions on a Bruker AV 400 spectrometer. Melting points were performed with an X-6 microscopic melting point apparatus. UV-visible absorption spectra were investigated by PerkinElmer Lambda 950. PL emission spectra were investigated by PerkinElmer LS55 fluorescence spectrophotometer scan from 320 nm to 600 nm with a 100 nm min−1 of scan speed. Thermogravimetric analysis (TGA) was carried out on a TGA 2050 thermogravimetric analyzer under nitrogen at a heating rate of 10 °C min−1, and Td was reported as the temperatures at 5% weight losses. Cyclic voltammetry was taken on a CHI-600E electrochemical analyzer. The measurements were determined using a conventional three-electrode configuration consisting of a glassy carbon working electrode, a platinum wire auxiliary electrode and an Ag/AgCl reference electrode, the scan rate was 10 mV s−1. Fluorescence lifetimes were taken on a steady and transient state fluorometer (Quantaurus-Tau, C11367). The absolute photoluminescence quantum yield (ΦPL) was measured with a Hamamatsu absolute PL quantum yield spectrometer equipped (Quantaurus-QY, C11347). X-ray data were collected on a Bruker D8 Venture area diffractometer.2.2. Fabrication of electroluminescent (EL) devices and testing
Devices was fabricated by embedding the luminophores and curing agent in a transparent silicone resin; the mixture was stirred sufficiently to become homogenous and then dispersed on a InGaN chip with 380 nm emitting, and the package was solidified in oven at 120 °C for 40 min.2.3. Synthesis
Compound 2a was a pale yellow solid, yield: 69.2%, mp: 127.2–128.8 °C. 1H NMR (400 MHz, CDCl3) δ: 15.61 (s, 1H), 7.64–7.57 (m, 2H), 7.24 (d, J = 8.0 Hz, 2H), 2.70 (dd, J = 3.1, 1.2 Hz, 2H), 2.61–2.49 (m, 2H), 2.40 (s, 3H), 2.28 (tt, J = 6.0, 3.1 Hz, 1H), 1.45 (d, J = 9.5 Hz, 1H), 1.34 (s, 3H), 0.96 (s, 3H). 13C NMR (100 MHz, CDCl3) δ: 209.07, 173.14, 140.50, 132.45, 128.92, 128.16, 103.54, 54.72, 39.91, 39.50, 28.40, 27.80, 25.84, 21.53, 21.48. HRMS (m/z): [M + Na]+ calculated for C17H20O2+Na+, 279.1361; found, 279.1356.
Compound 2b was a yellow solid, yield: 65.7%, mp: 113.2–113.8 °C. 1H NMR (400 MHz, CDCl3) δ: 15.79 (s, 1H), 7.77–7.68 (m, 2H), 6.97–6.94 (m, 2H), 3.86 (s, 3H), 2.73 (d, J = 3.0 Hz, 2H), 2.60–2.51 (m, 2H), 2.30 (tt, J = 5.7, 2.9 Hz, 1H), 1.46 (d, J = 9.2 Hz, 1H), 1.35 (s, 3H), 0.96 (s, 3H). 13C NMR (100 MHz, CDCl3) δ: 208.76, 172.94, 161.13, 130.05, 127.72, 113.57, 103.09, 55.35, 54.64, 39.99, 39.47, 28.66, 27.86, 25.82, 21.49. HRMS (m/z): [M + Na]+ calculated for C17H20O3+Na+, 295.1310; found, 295.1305.
Compound 2c was a pale yellow solid, yield: 45.8%, mp: 114.1–114.5 °C. 1H NMR (400 MHz, CDCl3) δ: 15.59 (s, 1H), 7.78–7.65 (m, 2H), 7.20–7.07 (m, 2H), 2.68 (t, J = 2.8 Hz, 2H), 2.66–2.51 (m, 2H), 2.30 (tt, J = 6.0, 3.1 Hz, 1H), 1.45 (d, J = 9.5 Hz, 1H), 1.35 (s, 3H), 0.96 (s, 3H). 13C NMR (100 MHz, CDCl3) δ: 209.24, 171.81, 164.87, 162.38, 130.40, 115.34, 103.72, 54.71, 39.86, 39.54, 28.35, 27.76, 25.80, 21.52. HRMS (m/z): [M + Na]+ calculated for C16H17FO2+Na+, 283.1111; found, 283.1105.
Compound 2d was a yellow solid, yield: 59.1%, mp: 133.3–133.9 °C. 1H NMR (400 MHz, CDCl3) δ: 15.51 (s, 1H), 7.60 (s, 4H), 2.69 (t, J = 2.9 Hz, 2H), 2.63–2.53 (m, 2H), 2.31 (tt, J = 6.0, 3.1 Hz, 1H), 1.47 (d, J = 9.6 Hz, 1H), 1.37 (s, 3H), 0.98 (s, 3H). 13C NMR (100 MHz, CDCl3) δ: 209.42, 171.40, 134.07, 131.50, 129.79, 124.66, 104.06, 54.77, 39.80, 39.56, 28.26, 27.73, 25.81, 21.55. HRMS (m/z): [M + Na]+ calculated for C16H17BrO2+Na+, 343.0310; found, 343.0304.
Compound 3a was a pale yellow solid, yield: 92.6%, mp: 139.3–139.6 °C. 1H NMR (400 MHz, CDCl3) δ: 7.87–7.80 (m, 2H), 7.30 (d, J = 8.1 Hz, 2H), 2.94–2.83 (m, 2H), 2.84–2.74 (m, 1H), 2.68 (dd, J = 11.0, 5.7 Hz, 1H), 2.44 (s, 3H), 1.49 (d, J = 10.1 Hz, 1H), 1.42 (s, 3H), 1.26 (s, 1H), 0.97 (s, 3H). 13C NMR (100 MHz, CDCl3) δ: 201.83, 179.42, 144.19, 130.60, 129.62, 129.33, 104.19, 51.25, 40.39, 39.79, 28.49, 28.41, 25.49, 21.72, 21.42. HRMS (m/z): [M + Na]+ calculated for C17H19BF2O2+Na+, 327.1344; found, 327.1341.
Compound 3b was a yellow solid, yield: 89.3%, mp: 147.7–148.2 °C. 1H NMR (400 MHz, CDCl3) δ: 8.04–7.96 (m, 2H), 7.04–6.92 (m, 2H), 3.90 (s, 3H), 2.89 (dd, J = 14.6, 3.0 Hz, 2H), 2.77 (t, J = 5.6 Hz, 1H), 2.73–2.60 (m, 1H), 2.42 (tt, J = 5.9, 3.0 Hz, 1H), 1.49 (d, J = 10.0 Hz, 1H), 1.42 (s, 3H), 0.97 (s, 3H). 13C NMR (100 MHz, CDCl3) δ: 200.80, 178.45, 163.72, 132.26, 125.68, 114.05, 103.54, 55.61, 51.17, 40.31, 39.90, 28.80, 28.57, 25.50, 21.39. HRMS (m/z): [M + Na]+ calculated for C17H19BF2O3+Na+, 343.1293; found, 343.1291.
Compound 3c was a white solid, yield: 81.9%, mp: 160.2–160.8 °C. 1H NMR (400 MHz, CDCl3) δ: 8.04–7.92 (m, 2H), 7.25–7.12 (m, 2H), 2.92–2.78 (m, 3H), 2.70 (dd, J = 10.5, 5.8 Hz, 1H), 2.43 (tt, J = 5.9, 3.0 Hz, 1H), 1.50 (d, J = 10.2 Hz, 1H), 1.43 (s, 3H), 0.97 (s, 3H). 13C NMR (100 MHz, CDCl3) δ: 202.81, 177.96, 166.66, 164.11, 132.13, 129.57, 115.94, 104.22, 51.38, 40.49, 39.75, 28.39, 25.47, 21.42. HRMS (m/z): [M + Na]+ calculated for C16H16BF3O2+Na+, 331.1093; found, 331.1091.
Compound 3d was a yellow solid, yield: 86.9%, mp: 175.2–175.7 °C. 1H NMR (400 MHz, CDCl3) δ: 7.83–7.74 (m, 2H), 7.69–7.59 (m, 2H) 2.91–2.75 (m, 3H), 2.71 (dd, J = 10.6,5.8 Hz, 1H), 2.43 (tt, J = 5.9, 3.1 Hz, 1H), 1.49 (d, J = 10.2 Hz, 1H), 1.43 (s, 3H), 0.97 (s, 3H). 13C NMR (100 MHz, CDCl3) δ: 203.26, 178.01, 132.21, 131.97, 130.81, 128.07, 104.57, 51.45, 40.56, 39.71, 28.41, 28.20, 25.50, 21.47. HRMS (m/z): [M + Na]+ calculated for C16H16BBrF2O2+Na+, 391.0293; found, 391.0290.
3. Results and discussion
3.1. Synthesis
The synthetic routines of four fluorescent compounds were shown in Scheme 1. The compounds 2a–2d were prepared from nopinone and compounds 1a–1d according to the Claisen condensation. Target compounds 3a–3d were then synthesized by reaction of compounds 2a–2d with BF3·(C2H5)2O with high yields. The chemical structures of the synthesized compounds were confirmed by 1H NMR, 13C NMR, and HRMS. Compounds were readily soluble in common organic solvents like THF, chloroform, ethyl acetate. The structure of 2a was also verified by X-ray crystallography (Fig. S1†). Suitable single crystals of 2a for X-ray structural analysis was obtained by slow evaporation of methanol solution at room temperature.3.2. Photophysical properties
The photophysical properties of the resultant compounds 3a–3d in neat film were investigated. The UV-vis absorption spectra of 3a–3d at room temperature are shown in Fig. 1. The compounds 3c, 3a, 3d, 3b, exhibited a strong absorption maximum in neat film at 366 nm to 368 nm, 374 nm, and 388 nm, respectively. The photoluminescence (PL) spectra of 3a–3d at room temperature are shown in Fig. 1. All obtained compounds showed obvious fluorescence emission (emission maxima λem = 496 nm for 3bvs. 480 nm for 3d, 463 nm for 3a, and 441 nm for 3c, Table 1), which can be ascribed to the different electron density dispersed on the molecules. Obviously, compound 3c showed bathochromic shift due to the presence of electron-donating methoxy, which enhanced intramolecular charge transfer (ICT) process between the electron-donating methoxy and the electron-accepting BF2dbm unit, and led to shift the λmax to the long wavelength. The ICT process of these compounds were further studied in both experimental investigation (Fig. S2†) and theoretical calculation (Fig. 2).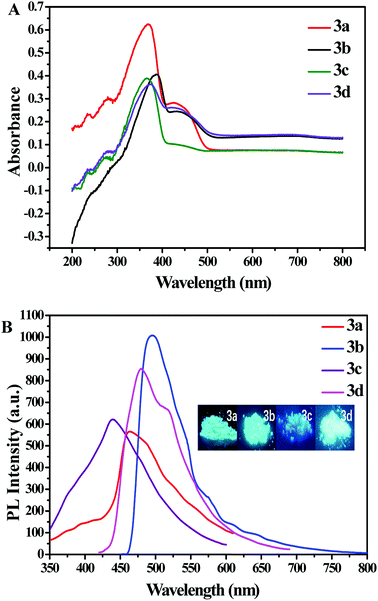 | ||
| Fig. 1 (A) Absorbance spectra and (B) emission spectra of 3a–3d in neat film at room temperature. Inset: Photographs of 3a–3d under 365 nm UV light illumination. | ||
| Compound | λ abs (nm) | λ em (nm) | Φ F a | τ F (ns) | K f b (109 s−1) | K nr c (109 s−1) |
|---|---|---|---|---|---|---|
| a Φ F is the absolute photoluminescence quantum yields. b Radiative rate constant (kf = Φf/τf). c Non radiative rate constant (knr = (1 − Φf)/τf). | ||||||
| 3a | 368 | 463 | 1.99% | 1.52 | 0.01 | 0.64 |
| 3b | 388 | 496 | 37.16% | 4.52 | 0.08 | 0.14 |
| 3c | 366 | 441 | 4.94% | 1.10 | 0.04 | 0.86 |
| 3b | 374 | 480 | 12.03% | 2.15 | 0.06 | 0.41 |
The absolute photoluminescence quantum yields for compounds 3a–3d in solid state are summarized in Table 1, and the values of compounds 3a–3d were 1.99%, 47.16%, 4.94% and 21.03%, respectively. It was found that introduction of methyl, fluorine, bromine moiety did not make an obvious difference in terms of the fluorescence lifetime (3a, τf = 1.52 ns; 3c, τf = 1.10 ns; 3d, τf = 2.15 ns). However, compared with other compounds, the fluorescence lifetime of 3b substituted with methoxy has increased by 2 times (3b, τf = 4.52 ns). Based on fluorescence lifetimes of these compounds, radiative and non-radiative rate constants (kf and knr) were respectively estimated.44,45 As shown in Table 1, methoxy group increased the kf (the radiative rate constant) and decreased the knr (the non-radiative rate constant) of BF2 complexes. Thus, the introduction of different substituent functional groups can significantly affect the photoluminescence properties of BF2 complexes.
3.3. Electrochemical properties and theoretical calculations
The electrochemical properties of 3a–3d were examined using cyclic voltammetry. The cyclic voltammograms of the 3a–3d are shown in Fig. S2,† the onset oxidation potentials (EOX) were found to be 1.30, 1.26, 1.34 and 1.35 V for compounds 3a–3d. According to the equation [HOMO = −(4.40 + EOX)], the HOMO energy levels were calculated. The lowest unoccupied molecular orbital energy levels (ELUMO) is calculated based on the equation of ELUMO = EHOMO + Eg, in which energy band gap (Eg = 4.1 eV for 3a, 3.89 eV for 3b, 4.11 eV for 3c and 4.05 eV for 3d, respectively) were estimated from the UV-vis absorption. HOMO–LUMO gap is usually used to characterize the ICT occurred in chromophore molecules. The HOMO, LUMO and Eg are listed in Table 2. The CV curves of these compounds remained unchanged under multiple successive scans, demonstrating their good stability against electrochemical oxidation.| Compounds | HOMO (eV) | LUMO (eV) | E g (eV) | T d (°C) | |||
|---|---|---|---|---|---|---|---|
| Exptla | Calc | Exptla | Calc | Exptlb | Calc | ||
| a Estimated from HOMO = −(4.4 + EOX); LUMO = HOMO + Eg. b Estimated from the onset of the absorption spectra. | |||||||
| 3a | 5.70 | −5.94 | −1.60 | −1.64 | 4.10 | 4.30 | 252.3 |
| 3b | 5.66 | −5.82 | −1.77 | −1.70 | 3.89 | 4.12 | 296.6 |
| 3c | 5.74 | −6.10 | −1.63 | −1.77 | 4.11 | 4.33 | 232.8 |
| 3d | 5.75 | −6.12 | −1.70 | −1.88 | 4.05 | 4.24 | 285.4 |
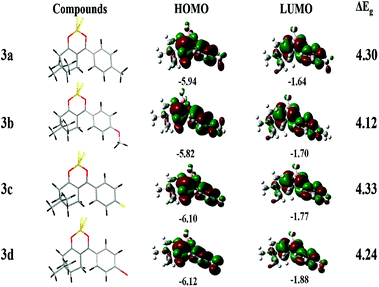
To further investigate the relationship between the emission and the structure property of the four compounds at the molecular level, the geometrical structures of compounds 3a–3d were analyzed employing DFT calculations. The electron density distributions of target compounds are illustrated in Fig. 2. The electron clouds of the HOMOs and LOMOs for 3a, 3c, 3d were mainly distributed over whole molecule. The electron clouds of the HOMOs in 3b were mainly distributed over the whole molecule, and the electron clouds of the LUMOs were mostly distributed over BF2dbm unit due to electron withdrawing ability of the BF2dbm unit. These results further prove that the ICT process occurs from the donor to the acceptor moiety. The corresponded data are summarized in Table 2. According to the calculations, introduction of methoxy may reduce the HOMO–LUMO energy gap (4.12 eV for 3b, 4.24 eV for 3d, 4.3 eV for 3a and 4.33 eV for 3c, respectively) which is consistent with the results of cyclic voltammetry. The HOMO and LUMO gap of compound 3b is lower than that of 3a, 3c, 3d, which could lead to a red-shift in the absorption and fluorescence spectra. The conclusion is coincident with the experimental results.
3.4. Thermal properties
The thermal stabilities of four new compounds were evaluated by thermogravimetric analysis (TGA) under a stream of N2 with a scanning rate of 10 °C min−1. Their TGA curves are shown in Fig. S3† and their degradation temperatures (Td) for 5% weight loss are listed in Table 2. The degradation temperatures Td for compounds 3a–3d were 252.3, 296.6, 232.8 and 285.4 °C, respectively. The data demonstrate that the resulting compounds can possess good thermal properties, which is desirable for the application in electroluminescent materials.3.5. Aggregation-induced emission performances
The PL emission spectra of resultant compounds 3a–3d in DMF/water mixtures with different water fractions (fw: 0–90%) in Fig. S4–S6,†Fig. 3 reveals that the PL intensity of 3b is slightly weakened upon addition of a small amount of water (fw ≤ 20%) and the dramatic enhancement of luminescence is observed for the water fraction (fw) of 30%. Similar observation is seen for 3c, 3a and 3d. All compounds showed higher emission intensity when water fractions (fw) was 90%.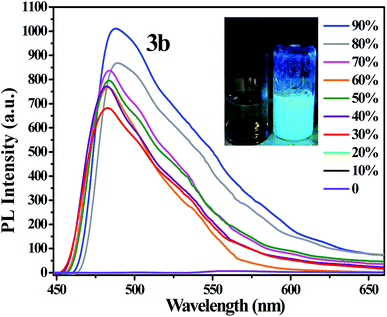 | ||
| Fig. 3 PL spectra of 3b in DMF/water mixtures with different water fractions. Inset: Photographs of 3b in DMF/water mixtures (fw = 0% and 90%), taken under 365 nm UV light illumination. | ||
According to the Fig. S7,† the emission of 3b is weaker in pure DMF solution owing to the twisted intramolecular charger transfer (TICT) emission. The emission spectra remained almost unchanged when the water volume fraction was gradually increased from 0% to 20%. When the water content was further increased from 30% to 90%, the fluorescence intensity was swiftly enhanced, which attributed to the restriction of intramolecular rotation (RIR)46–48 According to the Fig. S7,† the emission of 3b in the water fraction (fw) of 60% is weaker than that of 50%, which is probably due to the difference in aggregate morphology.49,50 It is obvious that the poor solvent water could induce the fluorescence intensity increase, demonstrating the AIE characteristics of the four compounds.
3.6. Electroluminescent devices
Owing to relatively high absolute fluorescence quantum yields of 3b and 3d, EL devices based on 3b and 3d were fabricated. As shown in Fig. 4 and Fig. S8,† both of the devices I and II display blueish-green light (peak at 499.2 nm and peak at 500.4 nm, respectively), the Commission Internationale de L'Eclairage (CIE) coordinates of devices I and devices II are located at (0.2774, 0.4531) and (0.3084, 0.4800) respectively, which are close to their solid PL spectra.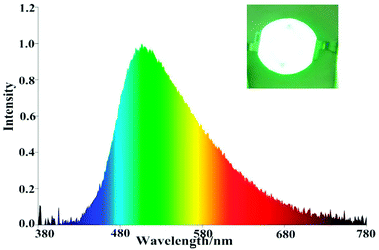 | ||
| Fig. 4 EL spectra of device I (3b). Inset: Photographs of device I (3b) at a current density of 9.9 mA. | ||
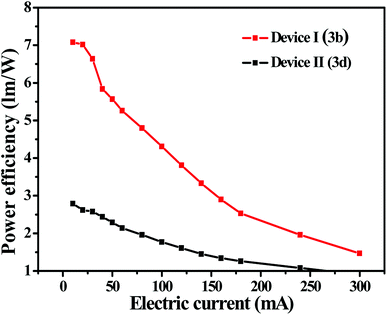
As showed in Fig. 5 and Table 3, the EL performances of the luminescent materials substituted with methoxy was better than the luminescent materials substituted with bromine, which is identical to the order of photophysical properties in the solid state. For the device of I, a luminous efficacy (ηp) of 7.09 lm W−1, a color rendering index (Ra) of 54.4 and a correlated color temperature (TC) of 7028 K at a current density of 9.9 mA were achieved. Therefore, the nopinone derivative containing difluoroboron is still one effective strategy for new EL materials.
| Device | V F (V) | EL (nm) | η p (lm W−1) | T C (K) | CIE (x, y) | R a |
|---|---|---|---|---|---|---|
| I | 3.075 | 499.2 | 7.08 | 7028 | (0.2774, 0.4531) | 54.4 |
| II | 3.06 | 500.4 | 2.79 | 6087 | (0.3084, 0.4800) | 55.4 |
4. Conclusions
In summary, four novel nopinone derivative containing difluoroboron β-diketonate groups 3a–3d were synthesized with a simple method. The photophysical experiments demonstrated that the maximum absorption wavelengths of new compounds were in the range of 360–390 nm and the maximum fluorescence wavelengths of new compounds were in the range of 440–500 nm. These compounds also exhibited emission enhancement in their aggregate state. Besides, four target compounds 3a–3d exhibited high thermal stabilities, which is necessary for fabricating long lifetime devices. Theoretical calculations (DFT) were performed to provide further insights into our experimental results. Furthermore, devices I and II were fabricated which displayed blueish-green EL emission (peak at 499.2 nm and 500.4 nm, respectively). Among the two devices, the device of I exhibited the highest device performance with a luminous efficacy (ηp) of 7.09 lm W−1, a color rendering index (Ra) of 54.4 and a correlated color temperature (TC) of 7028 K, which provide guidance for the design and synthesis of new efficient EL materials in the future.Conflicts of interest
There are no conflicts to declare.Acknowledgements
The research was supported by the National Natural Science Foundation of China (No. 31470592), the Natural Science Foundation of Jiangsu Province (Grants No. BK20151513), Jiangsu Provincial Key Lab for the Chemistry and Utilization of Agro-Forest Biomass, and Priority Academic Program Development of Jiangsu Higher Education Institutions, China.References
- A. Kamkaew, S. H. Lim and H. B. Lee, Chem. Soc. Rev., 2013, 42, 77–88 RSC.
- N. Boens, V. Leen and W. Dehaen, Chem. Soc. Rev., 2012, 41, 1130–1172 RSC.
- F. Cardona, J. Rocha and A. M. S Silva, Dyes Pigm., 2014, 111, 16–20 CrossRef CAS.
- S. Guieu, F. Cardona and J. Rocha, New J. Chem., 2014, 38, 5411–5414 RSC.
- S. Xu, R. E. Evans and T. Liu, Inorg. Chem., 2013, 52, 3597–3610 CrossRef CAS.
- P. Galer, R. C. Korošec and M. Vidmar, J. Am. Chem. Soc., 2014, 136, 7383–7394 CrossRef CAS PubMed.
- S. Guieu, J. Pinto and V. L. M. Silva, Eur. J. Org. Chem., 2015, 3423–3426 CrossRef CAS.
- H. Zhang, C. Liu and J. Xiu, Dyes Pigm., 2017, 136, 798–806 CrossRef CAS.
- C. T. Poon, W. H. Lam and H. L. Wong, J. Am. Chem. Soc., 2010, 132, 13992–13993 CrossRef CAS.
- A. D'Aléo, D. Gachet and V. Heresanu, Chem.– Eur. J, 2012, 18, 12764–12772 CrossRef.
- H. X. Zhang, J. B. Chen and X. F. Guo, Anal. Chem., 2014, 86, 3115–3121 CrossRef CAS.
- W. Liu, F. Li and X. Chen, J. Am. Chem. Soc., 2014, 136, 4468–4471 CrossRef CAS.
- Y. Zhou, Y. Z. Chen and J. H. Cao, Dyes Pigm., 2015, 112, 162–169 CrossRef CAS.
- S. Chambon, A. D'Aléo and C. Baffert, Chem. Commun., 2013, 49, 3555–3557 RSC.
- G. Q. Zhang and J. B. Chen, J. Am. Chem. Soc., 2007, 129, 8942–8943 CrossRef CAS.
- G. Zhang, J. Lu and M. Sabat, J. Am. Chem. Soc., 2010, 132, 2160–2162 CrossRef CAS.
- M. Y. Liu, Z. Lu and J. B. Sun, Dyes Pigm., 2016, 128, 271–278 CrossRef CAS.
- I. García-Moreno, F. Amat-Guerri and M. Liras, Adv. Funct. Mater., 2010, 17, 3088–3098 CrossRef.
- H. Maeda, T. Shirai and S. Uemura, Chem. Commun., 2013, 49, 5310–5312 RSC.
- R. Yamaka, T. Sakurai and W. Matsuda, Chem.– Eur. J, 2016, 22, 626–638 CrossRef.
- X. Sun, X. Zhang and X. Li, J. Mater. Chem., 2012, 22, 17332–17339 RSC.
- Q. Chong, M. Y. Liu and G. H. Hong, Org. Biomol. Chem., 2015, 13, 2986–2991 RSC.
- C. A. Derosa and Z. Fan, Macromolecules, 2015, 48, 2967–2977 CrossRef CAS.
- J. Samonina-Kosicka, C. A. Derosa and W. A. Morris, Macromolecules, 2014, 47, 3736–3746 CrossRef CAS.
- J. D. Luo, Z. L. Xie and B. Z. Tang, Chem. Commun., 2001, 18, 1740–1741 RSC.
- B. Xu, J. He and Y. Mu, Chem. Sci., 2015, 6, 3236–3241 RSC.
- M. Luo, X. Zhou and Z. Chi, Dyes Pigm., 2014, 101, 74–84 CrossRef CAS.
- Z. Zhao, W. Y. L. Lam and B. Z. Tang, J. Mater. Chem., 2012, 22, 23726–23740 RSC.
- J. Yang, N. Sun and J. Huang, J. Mater. Chem. C, 2015, 3, 2624–2631 RSC.
- L. Chen, Y. Jiang and H. Nie, Adv. Funct. Mater., 2014, 24, 3621–3630 CrossRef CAS.
- J. Mei, J. Wang and J. Z. Sun, Chem. Sci., 2012, 3, 549–558 RSC.
- S. Choi, J. Bouffard and Y. Kim, Chem. Sci., 2013, 5, 751–755 RSC.
- R. Hu, C. F. Gómez-Durán and J. W. Lam, Chem. Commun., 2012, 48, 10099–10101 RSC.
- C. Liu, W. He and G. Shi, Dyes Pigm., 2015, 112, 154–161 CrossRef CAS.
- X. Zhang, Z. Chi and B. Xu, J. Mater. Chem., 2012, 22, 18505–18513 RSC.
- Y. Guo, X. Feng and T. Han, J. Am. Chem. Soc., 2014, 136, 15485–15488 CrossRef CAS.
- S. Kaur, A. Gupta and V. Bhalla, J. Mater. Chem. C, 2014, 2, 7356–7363 RSC.
- Z. Zheng, Z. Yu and M. Yang, J. Org. Chem., 2013, 78, 3222–3234 CrossRef CAS.
- S. Liao, S. Shang and M. Shen, Bioorg. Med. Chem. Lett., 2016, 26, 1512–1515 CrossRef CAS.
- Z. Szakonyi, T. Gonda and F. Fülöp, Tetrahedron: Asymmetry, 2014, 25, 1138–1145 CrossRef CAS.
- J. Ścianowski, J. Szumera and P. Kleman, Tetrahedron: Asymmetry, 2016, 27, 238–245 CrossRef.
- J. Yang, H. Xu and X. Xu, Dyes Pigm., 2016, 128, 75–85 CrossRef CAS.
- T. Wu and X. You, J. Phys. Chem. A, 2012, 116, 8959–8964 CrossRef CAS.
- M. Lin, Y. Yu and L. Li, Org. Electron., 2018, 57, 123–132 CrossRef.
- H. Liu, Z. Lu and B. Tang, Dyes Pigm., 2018, 149, 284–289 CrossRef CAS.
- G. W. Kim, D. R. Yang and C. K. Yong, Dyes Pigm., 2016, 136, 8–16 CrossRef.
- H. Dong, M. Luo and S. Wang, Dyes Pigm., 2016, 139, 118–128 CrossRef.
- C. Li, W. Yang and W. Zhou, New J. Chem., 2016, 40, 8837–8845 RSC.
- F. Zhang, Y. Guan and S. Wang, Dyes Pigm., 2016, 130, 1–8 CrossRef CAS.
- W. Li, T. Xu and G. Chen, Dyes Pigm., 2018, 149, 266–272 Search PubMed.
Footnote |
| † Electronic supplementary information (ESI) available. CCDC 1848721. For ESI and crystallographic data in CIF or other electronic format see DOI: 10.1039/c8ra05031g |
| This journal is © The Royal Society of Chemistry 2018 |


