In situ hydrogenation and decarboxylation of oleic acid into heptadecane over a Cu–Ni alloy catalyst using methanol as a hydrogen carrier†
Zihao
Zhang
 a,
Qiwei
Yang
a,
Hao
Chen
a,
Kequan
Chen
a,
Qiwei
Yang
a,
Hao
Chen
a,
Kequan
Chen
 b,
Xiuyang
Lu
a,
Pingkai
Ouyang
ab,
Jie
Fu
 *acd and
Jingguang G.
Chen
 *cd
*cd
aKey Laboratory of Biomass Chemical Engineering of Ministry of Education, College of Chemical and Biological Engineering, Zhejiang University, Hangzhou 310027, China. E-mail: jiefu@zju.edu.cn; Tel: +86-571-87951065
bState Key Laboratory of Materials-Oriented Chemical Engineering, College of Biotechnology and Pharmaceutical Engineering, Nanjing Tech University, Nanjing 211816, China
cDepartment of Chemical Engineering, Columbia University, New York 10027, USA. E-mail: jgchen@columbia.edu; Tel: +1-212-854-6166
dChemistry Department, Brookhaven National Laboratory, Upton, New York 11973, USA
First published on 13th October 2017
Abstract
In this work, supported Cu–Ni bimetallic catalysts were synthesized and evaluated for the in situ hydrogenation and decarboxylation of oleic acid using methanol as a hydrogen donor. The supported Cu–Ni alloy exhibited a significant improvement in both activity and selectivity towards the production of heptadecane in comparison with monometallic Cu and Ni based catalysts. The formation of the Cu–Ni alloy is demonstrated by high-angle annular dark-field scanning transmission electron microscopy (HADDF-STEM), energy dispersive X-ray spectroscopy (EDS-mapping), X-ray diffraction (XRD) and temperature programmed reduction (TPR). A partially oxidized Cu in the Cu–Ni alloy is revealed by diffuse reflectance infrared Fourier transform spectroscopy (DRIFTS) following CO adsorption and X-ray photoelectron spectroscopy (XPS). The temperature programmed desorption of ethylene and propane (ethylene/propane-TPD) suggested that the formation of the Cu–Ni alloy inhibited the cracking of C–C bonds compared to Ni, and remarkably increased the selectivity to heptadecane. The temperature programmed desorption of acetic acid (acetic acid-TPD) indicated that the bimetallic Cu–Ni alloy and Ni catalysts had a stronger adsorption of acetic acid than that of the Cu catalyst. The formation of the Cu–Ni alloy and a partially oxidized Cu facilitates the decarboxylation reaction and inhibits the cracking reaction of C–C bonds, leading to enhanced catalytic activity and selectivity.
1. Introduction
Biodiesel, as an alternative to conventional fuel, has attracted considerable attention. The first generation of biodiesel was fatty acid (methyl) esters (FAME). However, the high cloud points and pour points of FAME as well as engine compatibility issues limit their applications in some geographical areas during cold weather.1 The second generation biodiesel products consist of hydrocarbons. These products can successfully solve the cloud and pour point issues and also meet the requirements set by the European diesel fuel standard (EN590).2 Therefore, the removal of oxygen is a vital step to produce second generation biodiesel and hydrodeoxygenation (HDO) processes have been extensively applied to achieve this goal.3,4 However, HDO typically requires a considerable amount of molecular hydrogen because oxygen is removed in the form of H2O, which potentially hinders its development and applications on a large scale.1,5 To solve this issue, Murzin et al.6,7 firstly reported a direct decarboxylation of lipids to produce paraffin and a high conversion of fatty acid was achieved, but the conversion rate of fatty acid ester was still low. Afterwards, Fu et al. proposed consecutive steps of the hydrolysis of fatty acid ester to fatty acid, followed by the decarboxylation of fatty acid to corresponding n-alkanes. Up to the present, both precious and non-precious metal catalysts, such as Pt, Pd and Ni, have shown good activity to produce corresponding alkanes from saturated fatty acids with no added H2.8–16Compared to saturated fatty acids, the deoxygenation of unsaturated fatty acids that widely exist in the hydrolysate products of lipids is much more difficult to occur. For example, more than 90% of the selectivity of n-alkanes could be achieved from the corresponding saturated fatty acid (stearic, palmitic and lauric acid) over Pt/C; however, unsaturated fatty acids (oleic and linoleic acid) exhibited a low yield of 9.2% for the decarboxylation products.17 The deoxygenation of unsaturated acids involves the hydrogenation of double bonds, followed by the decarboxylation of saturated acids to produce hydrocarbons.8,18,19 The hydrogenation of double bonds still needs to consume a large amount of hydrogen. Vardon et al.20 reported the in situ hydrogenation and decarboxylation of oleic acid with glycerol as a hydrogen donor, but the activity was significantly influenced by the initial hydrogen pressure. As the initial hydrogen pressure increased, the yield of heptadecane increased from 7% (0 MPa initial H2 pressure) to 83% (5.17 MPa initial H2 pressure). It is generally known that hydrogen has potential issues in safety, storage and transportation.21 Na et al. reported that oleic acid could be completely converted at 400 °C in 3 h over 5% Pt/C without using any hydrogen donor, and the selectivity of 8-heptadecene and heptadecane was around 72%.22 However, considering the cost and scarcity of precious metals, the development of non-precious metal catalysts becomes more and more important. Although a series of non-precious metal catalysts, such as Fe-MSN, Co0.5Mo0.5, SnAlMg-2 and MgO-Al2O3, were also tested for the hydrogenation and decarboxylation of oleic acid without using hydrogen, the heptadecane selectivity was rather low (less than 12%).5,23–25
Herein, supported Cu–Ni bimetallic catalysts were synthesized and studied for the in situ hydrogenation and decarboxylation of oleic acid using methanol as a hydrogen donor. HADDF-STEM, EDS-mapping, XRD and TPR were utilized to probe the catalyst structure. CO-DRIFTS and XPS were used to determine electron transfer between Cu and Ni in bimetallic catalysts. Ethylene/propane-TPD was also employed to reveal the interaction between the C–C bonds on the catalyst surface. The catalytic activities of the Cu–Ni bimetallic catalysts were evaluated to identify the reaction pathway over Cu–Ni bimetallic catalysts and the synergistic effect of Cu and Ni on the in situ hydrogenation and decarboxylation.
2. Experimental methods
2.1. Experimental procedures
All experiments were carried out in a microbatch reactor (1.67 mL), which was assembled from one 3/8-inch tube and two 3/8-inch caps purchased from Swagelok, USA. The microbatch reactor was charged with 50 mg of oleic acid, 15 mg of a catalyst and a specific amount of water and methanol. The sealed reactor was heated and maintained at the reaction temperature in a fluidized sand bath (Techne SBL-2). The reactor was soaked in cold water to quench the reaction after reaching the desired reaction time. Afterwards, the reaction mixture in the reactor was centrifuged to recover the solid catalyst and the liquid phase was rinsed and diluted in a 10 mL volumetric flask with acetone and then analyzed.2.2. Analysis methods
Quantification of the liquid reaction products in acetone was performed using a gas chromatograph (GC, Agilent 7890A) equipped with a 30 m × 0.32 mm × 0.25 μm HP-5 capillary column and an FID detector. The products were analyzed by a gas chromatograph (GC, Agilent 7693) equipped with a CP-FFAP CB column and an FID detector in the low-temperature experiments. The carrier gas was nitrogen with a flow rate of 11 mL min−1. The temperatures of the injector and detector were 280 °C and 300 °C, respectively. Quantitative analysis was performed using calibration curves for each compound in the mixture. The liquid reaction products were identified on a gas chromatography-mass spectrometry (Agilent 5977A MSD) system and then by matching gas chromatograph retention times with known standards.Reactant mole conversions were defined as the number of moles of the reactant consumed divided by the initial number of moles of the reactant added into the reactor. Selectivities were displayed by the number of moles of the product recovered divided by the number of moles of the reactant reacted. Uncertainties reported were standard deviations determined by replicate experiments. Experiments for every reaction condition were repeated three times.
3. Results and discussion
3.1. Characterization
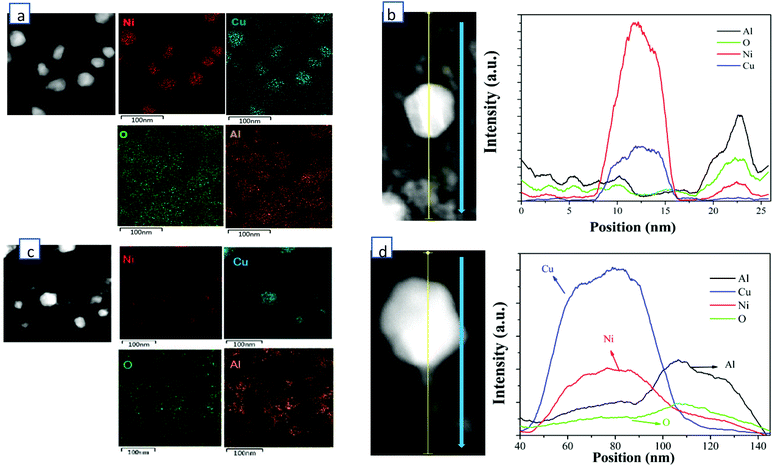
HADDF-STEM, EDS-mapping, XRD, CO-DRIFTS, TPR, XPS and ethylene/propane-TPD were performed for the synthesized catalysts of 60 wt% Cu/Al2O3 (CuAl), 40 wt% Cu-20 wt% Ni/Al2O3 (Cu2NiAl), 30 wt% Cu-30 wt% Ni/Al2O3 (CuNiAl), 20 wt% Cu-40 wt% Ni/Al2O3 (CuNi2Al) and 60 wt% Ni/Al2O3 (NiAl). In Fig. S1 and S2,† the TEM-mapping and line-scanning results of CuAl and NiAl indicated that monometallic Cu and Ni were observed and dispersed on the Al2O3 support. The high-resolution TEM (HRTEM) images of CuAl, Cu2NiAl, CuNi2Al and NiAl (Fig. S3†) exhibited the presence of metal grains containing different surface facets. The lattice spacing of these catalysts decreased from 2.13 Å to 1.99 Å as the percentage of Ni increased, suggesting that the alloying state existed in the samples of CuNi2Al and Cu2NiAl. Furthermore, as expected the Cu/Ni ratios of the CuNi alloy of CuNi2Al and Cu2NiAl were different. To further prove the existence of the Cu–Ni alloy in bimetallic catalysts, the STEM dark field image and EDS mapping of Cu2NiAl and CuNi2Al were performed, as shown in Fig. 1. The results indicated that Cu and Ni X-ray signals were uniformly mixed together, and Al and O also exhibited a similar phenomenon. These results suggest the existence of the Cu–Ni alloy in the samples of CuNi2Al and Cu2NiAl, which was in good accordance with the results of XRD and H2-TPR. The TEM image of CuNi2Al in Fig. S4† displayed that Cu–Ni alloy particles were detected as relatively darker spots, with an average size of 32.7 nm. Besides, CuNi2Al showed a stronger signal of nickel than that of copper from the line-scanning result shown in Fig. 1b. Furthermore, the EDS results presented the trace spectrum of CuNi2Al, and the weight ratio of Ni and Cu is about 1.6, similar to the value of 1.7 obtained from ICP-OES (Table S1†). Cu2NiAl exhibited a more intense signal of copper than that of nickel from the line-scanning result shown in Fig. 1b. The weight ratio of Cu and Ni obtained from EDS is about 2.7, similar to the value of 2.6 obtained from ICP-OES (Table S1†). These characterization results are consistent with the presence of uniform Cu–Ni alloy particles supported on Al2O3.N2 adsorption–desorption results given in Table S3† show that the surface areas and pore sizes of NiAl were much larger than those of CuAl, consistent with the XRD results that the Ni particles of NiAl were smaller than the Cu particles of CuAl. The surface areas of Cu2NiAl, CuNiAl and CuNi2Al increased as the ratio of Cu/Ni decreased. With the decrease of the Cu/Ni ratio, the pore volume of the corresponding catalysts increased firstly and then decreased. CuNi2Al shows the highest pore volume of 0.576 cm3 g−1.
XRD patterns of the reduced catalysts with different Cu/Ni mole ratios are shown in Fig. 2. A strong diffraction of the metallic nickel phase (JCPDS #04-0850) was observed in the XRD pattern of NiAl at 2θ = 44.5, 51.8 and 76.4°, and a strong diffraction of the metallic copper phase (JCPDS #65-9743) was observed in the XRD pattern of CuAl at 2θ = 43.4, 50.6 and 74.3°. The sharper diffraction peaks observed for the metal Cu in CuAl relative to the metal Ni in NiAl indicate that the Cu particle was much larger than the Ni particle. The location of diffraction peaks gradually shifted to larger 2θ degrees of the metallic nickel phase when the Cu/Ni ratios decreased from 1![[thin space (1/6-em)]](https://www.rsc.org/images/entities/char_2009.gif) :
:![[thin space (1/6-em)]](https://www.rsc.org/images/entities/char_2009.gif) 2 to 2
2 to 2![[thin space (1/6-em)]](https://www.rsc.org/images/entities/char_2009.gif) :
:![[thin space (1/6-em)]](https://www.rsc.org/images/entities/char_2009.gif) 1. These results further proved the existence of the Cu–Ni alloy in Cu2NiAl, CuNiAl and CuNi2Al, and the Cu/Ni ratios were different in three bimetallic catalysts, consistent with the characterization results of STEM-EDS and H2-TPR.
1. These results further proved the existence of the Cu–Ni alloy in Cu2NiAl, CuNiAl and CuNi2Al, and the Cu/Ni ratios were different in three bimetallic catalysts, consistent with the characterization results of STEM-EDS and H2-TPR.
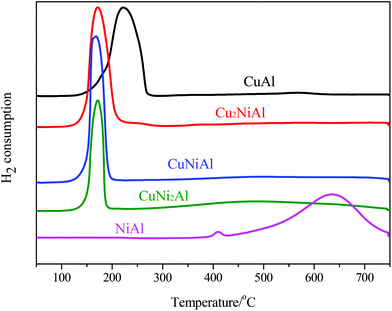
In Fig. 3, the TPR profile of NiAl shows a main peak at 635 °C and a small peak at 408 °C. The low temperature signal was attributed to the reduction of NiO to Ni, and the high temperature signal was ascribed to the reduction of the Ni–Al spinel, since a strong interaction between Ni and the aluminum matrix should lead to a higher reduction temperature.26 For CuAl, only one reduction peak at 222 °C was detected, attributed to the reduction of CuO to Cu. For Cu2NiAl, CuNiAl, and CuNi2Al, only one main reduction peak was detected around 170 °C, which shifted to a lower temperature compared to the peaks for CuAl and NiAl. Therefore, these results suggested that the Cu–Ni alloy oxides were more easily reduced than the monometallic oxides.
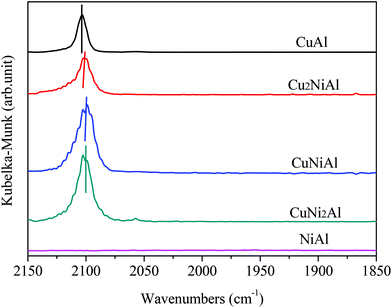
Fig. 4 presents the XPS spectra of Cu 2p3/2, Ni 2p3/2 and Al 2p for CuAl, Cu2NiAl, CuNi2Al and NiAl. The XPS peak of Cu 2p3/2 for CuAl was at 932.4 eV as shown in Fig. 4a, typical of the XPS feature of Cu0. The binding energies in Cu2NiAl and CuNi2Al shifted to higher binding energies of 933.4 eV and 933.5 eV, respectively. The increase in the Cu 2p3/2 binding energy should be ascribed to the partially oxidized Cu on the surface of the Cu–Ni alloy. The XPS spectra of Al 2p for the four catalysts do not show any difference as shown in Fig. 4b. In Fig. 4c, the position of Ni 2p3/2 varies between 855.8 and 855.9 eV, which should be ascribed to the formation of NiO in air on the surface of Ni and Cu–Ni alloy particles during the test. For Ni 2p3/2, a satellite feature was detected at higher binding energy values. There was no obvious shift in the binding energy of Ni 2p3/2 in Cu2NiAl, CuNi2Al and NiAl, suggesting the presence of the oxidized Ni on the surface of the Cu–Ni alloy and Ni particles. The DRIFTS-IR spectra using adsorbed CO as the probes of CuAl, Cu2NiAl, CuNiAl, CuNi2Al and NiAl are shown in Fig. 5. CO bands were observed on CuAl, Cu2NiAl, CuNiAl, CuNi2Al, but not on NiAl. The band observed around 2100 cm−1 could be assigned to CO adsorbed on Cu. No CO adsorbed on Ni was found, probably because of the formation of NiO on the surface of Ni.27 With the increase in Ni loading, a red shift on bimetallic Cu–Ni catalysts to lower vibrational frequencies was observed, suggesting an electron transfer phenomenon in Cu. Therefore, we deduced that charge transfer on the surface of Cu occurred, contributing to the red shift.
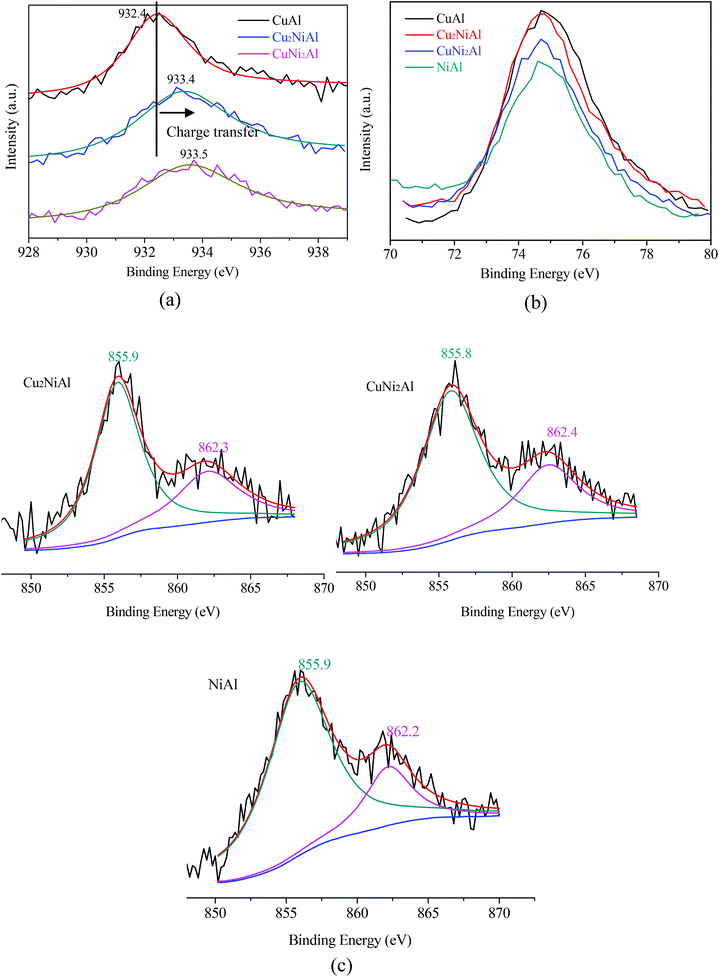 | ||
| Fig. 4 XPS spectra for (a) Cu 2p3/2 of three reduced samples; (b) Al 2p of four reduced samples; (c) Ni 2p3/2 of three reduced samples. | ||
Ethylene, propane and acetic acid-TPD were carried out for CuAl, CuNi2Al and NiAl. The ethylene/propane-TPD results indicated that all the catalysts showed the adsorption of ethylene and propane as shown in Fig. 6a and b. The adsorption amounts on CuNi2Al and CuAl were very low, but that of NiAl was much higher. An intense desorption peak of propane was only detected from NiAl in the temperature region between 330 and 350 °C, suggesting that the addition of Cu into Ni reduced the adsorption ability with respect to C–C and C![[double bond, length as m-dash]](https://www.rsc.org/images/entities/char_e001.gif) C bonds. Therefore, the adsorption ability of C–C and C
C bonds. Therefore, the adsorption ability of C–C and C![[double bond, length as m-dash]](https://www.rsc.org/images/entities/char_e001.gif) C for NiAl is much higher than those for CuAl and CuNi2Al. The acetic acid-TPD results given in Fig. 6c show that there were three peaks in the spectra of CuAl and NiAl, but only two peaks were observed in the spectrum of CuNi2Al. The peaks in the range of 250–400 °C should be associated with the chemisorption of acetic acid on the three catalysts. The temperatures of the main desorption peaks of CuNi2Al (320 °C) and NiAl (283 °C) were higher than that of CuAl (246 °C), indicating that the adsorption strength of the carboxyl group on CuNi2Al and NiAl was stronger than that on CuAl.
C for NiAl is much higher than those for CuAl and CuNi2Al. The acetic acid-TPD results given in Fig. 6c show that there were three peaks in the spectra of CuAl and NiAl, but only two peaks were observed in the spectrum of CuNi2Al. The peaks in the range of 250–400 °C should be associated with the chemisorption of acetic acid on the three catalysts. The temperatures of the main desorption peaks of CuNi2Al (320 °C) and NiAl (283 °C) were higher than that of CuAl (246 °C), indicating that the adsorption strength of the carboxyl group on CuNi2Al and NiAl was stronger than that on CuAl.
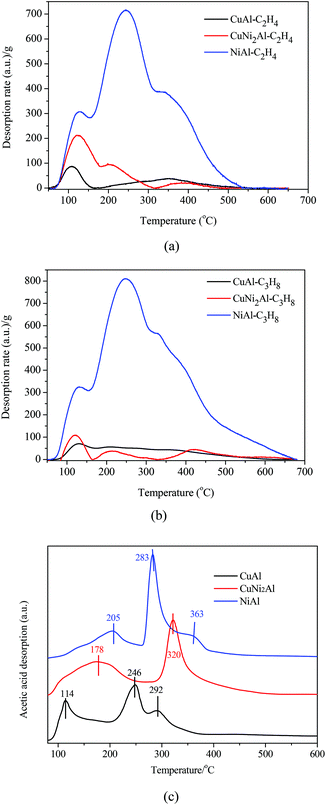 | ||
| Fig. 6 Temperature-programmed desorption (TPD) of (a) C2H4, (b) C3H8 and (c) acetic acid on CuAl, CuNi2Al and NiAl. | ||
3.2. Catalytic activity of different catalysts for the conversion of oleic acid
As shown in Fig. 7, Cu2NiAl, CuNiAl and CuNi2Al exhibited better activity towards heptadecane production at 330 °C after 1 h compared to Pt/C,28 CuAl and NiAl. The molar yield of heptadecane over CuNi2Al attained 92.7% at 330 °C after 1 h; meanwhile, stearic acid and octadecanol were not detected. To prove that stearic acid and octadecanol were the intermediates in the conversion of oleic acid over CuNi2Al, the reaction time was shortened to identify the existence of these potential reaction intermediates. Fig. 7b shows the GC-FID chromatograms for the variation of oleic acid conversion over CuNi2Al as time elapsed, illustrating that stearic acid and octadecanol can be converted to heptadecane from 10 min to 60 min. During this reaction period, oleic acid was converted completely, and small amounts of octadecanol and stearic acid were also obtained at 10 min, which were further converted to heptadecane at a longer reaction time. As shown in Fig. 7d, stearic acid, methyl stearate and octadecanol were converted to heptadecane under the same reaction conditions, suggesting that they were intermediates for the conversion of oleic acid. Table 1 shows the performance of the CuNi2Al catalyst and a comparison with previous published studies.5,11,12,17,20,22,24,28–31 CuNi2Al showed the best selectivity for heptadecane production from the conversion of oleic acid without hydrogen, even better than precious metal catalysts. Furthermore, CuNi2Al also showed good performance for the deoxygenation of gutter oil hydrolysate according to the results before and after the reaction shown in Fig. S5.†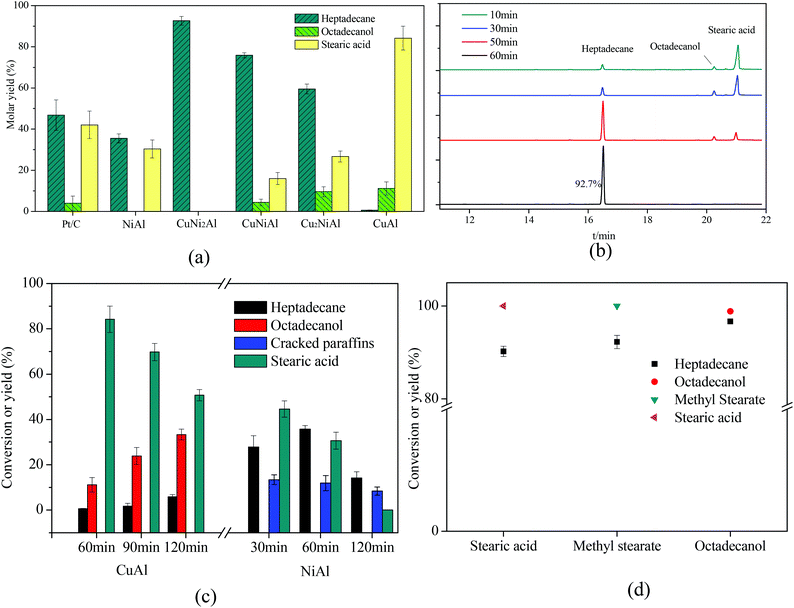 | ||
| Fig. 7 (a) Mole yields of different products for the in situ hydrogenation and decarboxylation of oleic acid over 5% Pt/C,26 CuAl, Cu2NiAl, CuNiAl, CuNi2Al, and NiAl with the reaction time of 1 h. (b) GC/FID chromatograms over CuNi2Al with reaction time. (c) The product distribution with reaction time over CuAl and NiAl. (d) Stearic acid, methyl stearate and octadecanol were chosen as the reactants. Reaction conditions: T = 330 °C, reactant loading = 50 mg, catalyst loading = 15 mg, methanol loading = 10 mg, and water = 0.5 mL. Cracked paraffins stand for the total yield of decane, hendecane, dodecane, tridecane, tetradecane, pentadecane and hexadecane. | ||
| Entry | Catalyst | Reaction conditions | Hydrogen source & solvent | Conversion (%) | Heptadecane selectivity (%) | Heptadecane yield (%) | Ref. |
|---|---|---|---|---|---|---|---|
| 1 | 5% Pt/C | 350 °C, 3 h | No H2, no solvent | 99 | 71 | 70.3 | 22 |
| 2 | Pt3Sn/C | 350 °C, 3 h | No H2, water | 100 | 60 | 60 | 29 |
| 3 | SnAlMg-2 | 300 °C, 6 h | No H2, no solvent | 71.1 | 3.7 | 2.6 | 25 |
| 4 | Co0.5Mo0.5 | 300 °C, 3 h | No H2, no solvent | 88.1 | 6.1 | 5.4 | 24 |
| 5 | MgO–Al2O3 | 400 °C, 3 h | No H2, no solvent | 98 | 6.9 | 6.8 | 5 |
| 6 | NiWC/Al-SBA-15 | 400 °C, 4 h | No H2, water | 97.3 | 5.2 | 5.1 | 11 |
| 7 | Activity carbon | 370 °C, 3 h | No H2, water | 80 | 7 | 5.6 | 12 |
| 8 | 5% Pt/C | 330 °C, 1.5 h | No H2, water | 68.9 | 13.4 | 9.2 | 17 |
| 9 | Ni/MgO–Al2O3 | 350 °C, 3 h | No H2, water | 67.5 | 12.5 | 8.4 | 31 |
| 10 | 5% Pt/C | 330 °C, 1 h | Methanol, water | 100 | 72.2 | 72.2 | 28 |
| 11 | Pt–Re/C | 300 °C, 3 h | Glycerol, water | — | — | 7 | 20 |
| 12 | CuNi2Al | 330 °C, 1 h | Methanol, water | 100 | 92.7 | 92.7 | Our work |
To identify the specific reason why heptadecane could not be obtained over CuAl, the reaction time was prolonged as shown in Fig. 7c, and the main products were detected as octadecanol and stearic acid at a the reaction time range of 1–2 h. Only 5.8% yield of heptadecane could be achieved at 2 h, suggesting that oleic acid was completely converted to stearic acid in a short time and stearic acid was easier to be hydrogenated to produce octadecanol than decarboxylated to produce heptadecane over CuAl. Therefore, it was difficult to cleave the C1–C2 bonds (Fig. S7†) in stearic acid and octadecanol over CuAl. However, octadecanol was not detected over NiAl as shown in Fig. 7d and S6a.† It has been reported that the addition of Cu into the CuNi alloy would weaken the binding energy of hydrogen on Ni, and improve the hydrodeoxygenation activity,32 which could explain that octadecanol was obtained over the Cu and Cu–Ni alloy catalysts, but not over the Ni catalyst. Fig. 7c shows the product distribution over NiAl under the same reaction conditions, and the yield of heptadecane increased firstly and then decreased with the decrease in the yield of stearic acid. At the same time the yield of cracked paraffins (C10–16 alkanes) slightly decreased with the reaction time, and alkanes with a carbon number less than 10 were also detected. For CuAl, NiAl and CuNi2Al, heptadecene was not detected, indicating that the decarboxylation of oleic acid was difficult to occur before the hydrogenation of the C![[double bond, length as m-dash]](https://www.rsc.org/images/entities/char_e001.gif) C double bond in this catalysis system. Fu et al.17 reported that the decarboxylation of unsaturated fatty acid was more difficult to occur compared to saturated fatty acid; however, hydrogen donors were not used to solve this issue. These results indicated that the hydrogenation of oleic acid to stearic acid was completed in a very short time followed by the decarboxylation of stearic acid to heptadecane with methanol. To further prove this hypothesis, oleic acid was reacted at 250 °C for 0.5 h over Pt/C and CuNi2Al with/without methanol. As shown in Fig. S6b,† the GC/FID results indicated that oleic acid was much easier to be hydrogenated to produce stearic acid with methanol at 250 °C over Pt/C and CuNi2Al. Immer et al.33 also reported that the adsorption of the unsaturated fatty acids via the cis C–C double bond in the alkyl chain might inhibit the decarboxylation of oleic acid. In conclusion, hydrogen, achieved from methanol steam reforming, can facilitate the hydrogenation of C
C double bond in this catalysis system. Fu et al.17 reported that the decarboxylation of unsaturated fatty acid was more difficult to occur compared to saturated fatty acid; however, hydrogen donors were not used to solve this issue. These results indicated that the hydrogenation of oleic acid to stearic acid was completed in a very short time followed by the decarboxylation of stearic acid to heptadecane with methanol. To further prove this hypothesis, oleic acid was reacted at 250 °C for 0.5 h over Pt/C and CuNi2Al with/without methanol. As shown in Fig. S6b,† the GC/FID results indicated that oleic acid was much easier to be hydrogenated to produce stearic acid with methanol at 250 °C over Pt/C and CuNi2Al. Immer et al.33 also reported that the adsorption of the unsaturated fatty acids via the cis C–C double bond in the alkyl chain might inhibit the decarboxylation of oleic acid. In conclusion, hydrogen, achieved from methanol steam reforming, can facilitate the hydrogenation of C![[double bond, length as m-dash]](https://www.rsc.org/images/entities/char_e001.gif) C in oleic acid. Methanol was converted to H2, CO and CO2, via the cleavage of C–H and O–H bonds to form H2 and CO, followed by the water–gas shift reaction to form CO2 and H2.34 In addition, the decarboxylation and decarbonylation reactions did not occur at low temperatures. Therefore, heptadecene was not detected in this reaction system. For comparing the hydrogenation capacity of CuAl, CuNi2Al and NiAl, the conversions of oleic acid over these three catalysts at 250 °C for 0.5 h are shown in Fig. S6c.† The results indicated that the hydrogenation activity of the C
C in oleic acid. Methanol was converted to H2, CO and CO2, via the cleavage of C–H and O–H bonds to form H2 and CO, followed by the water–gas shift reaction to form CO2 and H2.34 In addition, the decarboxylation and decarbonylation reactions did not occur at low temperatures. Therefore, heptadecene was not detected in this reaction system. For comparing the hydrogenation capacity of CuAl, CuNi2Al and NiAl, the conversions of oleic acid over these three catalysts at 250 °C for 0.5 h are shown in Fig. S6c.† The results indicated that the hydrogenation activity of the C![[double bond, length as m-dash]](https://www.rsc.org/images/entities/char_e001.gif) C bond in oleic acid increased in the order of Cu < CuNi2 < Ni.
C bond in oleic acid increased in the order of Cu < CuNi2 < Ni.
3.3. Reaction pathways of oleic aicd conversion over CuNi2Al
For NiAl, the main side reaction was a short-chain hydrocarbon production from the cracking of C–C bonds, as shown in Fig. 7c. Alwan et al.11 also reported that NiWC/Al-SBA-15 possessed some cracking activity to form C11–C16 hydrocarbons. For CuAl, the weak adsorption strength of the carboxyl group inhibited the decarboxylation reaction and then hindered the production of heptadecane. As shown in Fig. 6, CuAl, CuNi2Al and NiAl showed a certain degree of adsorption ability of ethylene and propane, but the adsorption ability of NiAl was much higher than those of CuNi2Al and CuAl. Strong desorption peaks of ethylene and propane can only be observed on Ni at a reaction temperature between 330 and 350 °C. Therefore, the adsorption ability of C–C and C![[double bond, length as m-dash]](https://www.rsc.org/images/entities/char_e001.gif) C for Ni is much stronger than that for Cu and CuNi2. We deduced that the cracking reaction of fatty acid proceeds before decarboxylation owing to the stability of heptadecane. There are no cracking products from heptadecane under the same reaction conditions, as shown in Fig. S8.† Therefore, the existence of the carboxyl group is necessary for the cracking of C–C bonds. The formation of the Cu–Ni alloy inhibited the cracking of C–C bonds compared to Ni, and remarkably increased the decarboxylation ability to produce heptadecane. Overall, CuNi2Al appears to combine the advantages of CuAl for the in situ hydrogenation and NiAl for the decarboxylation of unsaturated fatty acids.
C for Ni is much stronger than that for Cu and CuNi2. We deduced that the cracking reaction of fatty acid proceeds before decarboxylation owing to the stability of heptadecane. There are no cracking products from heptadecane under the same reaction conditions, as shown in Fig. S8.† Therefore, the existence of the carboxyl group is necessary for the cracking of C–C bonds. The formation of the Cu–Ni alloy inhibited the cracking of C–C bonds compared to Ni, and remarkably increased the decarboxylation ability to produce heptadecane. Overall, CuNi2Al appears to combine the advantages of CuAl for the in situ hydrogenation and NiAl for the decarboxylation of unsaturated fatty acids.
4. Conclusions
In situ hydrogenation and decarboxylation of oleic acid using methanol as a hydrogen donor were studied on CuAl, Cu2NiAl, CuNiAl, CuNi2Al and NiAl. Cu–Ni bimetallic catalysts exhibited remarkably improved activities for in situ hydrogenation and decarboxylation compared to monometallic catalysts. The results from experimental measurements and characterization indicate that the enhanced activity of bimetallic catalysts can be attributed to the Cu–Ni alloy formation and a partially oxidized Cu. Ethylene, propane and acetic acid-TPD results suggest that the formation of the Cu–Ni alloy inhibits the cracking of C–C bonds compared to Ni, and enables the stronger adsorption of the carboxyl group on CuNi2Al compared to CuAl, leading to an increased selectivity to heptadecane. Furthermore, the CuNi2 alloy also shows an equally promising performance for the in situ hydrogenation and decarboxylation of mixed fatty acids from the hydrolysis of gutter oil.Conflicts of interest
There are no conflicts to declare.Acknowledgements
This work was supported by the National Natural Science Foundation of China (No. 21436007, 21676243), the Zhejiang Provincial Natural Science Foundation of China (No. LR17B060002, LZ14B060002), and the China Scholarship Council. BNL researchers acknowledge support of this work under contract DE-AC02-98CH10886 with the U.S. Department of Energy (DOE) and by the Brookhaven National Laboratory Directed Research and Development (LDRD) Project No. 16-045.References
- E. Santillan-Jimenez and M. Crocker, J. Chem. Technol. Biotechnol., 2012, 87, 1041–1050 CrossRef CAS.
- M. Snåre and D. Y. Murzin, Ind. Eng. Chem. Res., 2006, 45, 6875–6875 CrossRef.
- A. Centeno, E. Laurent and B. Delmon, J. Catal., 1995, 154, 288–298 CrossRef CAS.
- G. W. Huber, P. O'Connor and A. Corma, Appl. Catal., A, 2007, 329, 120–129 CrossRef CAS.
- J.-G. Na, B. E. Yi, J. N. Kim, K. B. Yi, S.-Y. Park, J.-H. Park, J.-N. Kim and C. H. Ko, Catal. Today, 2010, 156, 44–48 CrossRef CAS.
- I. Kubičková, M. Snåre, K. Eränen, P. Mäki-Arvela and D. Y. Murzin, Catal. Today, 2005, 106, 197–200 CrossRef.
- P. Mäki-Arvela, I. Kubickova, M. Snåre, K. Eränen and D. Y. Murzin, Energy Fuels, 2007, 21, 30–41 CrossRef.
- M. Snåre, I. Kubickova, P. Mäki-Arvela, K. Eränen and D. Y. Murzin, Ind. Eng. Chem. Res., 2006, 45, 5708–5715 CrossRef.
- J. Fu, X. Lu and P. E. Savage, Energy Environ. Sci., 2010, 3, 311–317 CAS.
- I. Simakova, B. Rozmysłowicz, O. Simakova, P. Mäki-Arvela, A. Simakov and D. Y. Murzin, Top. Catal., 2011, 54, 460–466 CrossRef CAS.
- B. Al Alwan, S. O. Salley and K. Y. S. Ng, Appl. Catal., A, 2015, 498, 32–40 CrossRef CAS.
- J. Fu, F. Shi, L. T. Thompson, X. Lu and P. E. Savage, ACS Catal., 2011, 1, 227–231 CrossRef CAS.
- J. Wu, J. Shi, J. Fu, J. A. Leidl, Z. Hou and X. Lu, Sci. Rep., 2016, 6, 27820 CrossRef CAS PubMed.
- C. Yang, R. Nie, J. Fu, Z. Hou and X. Lu, Bioresour. Technol., 2013, 146, 569–573 CrossRef CAS PubMed.
- B. Rozmysłowicz, P. Mäki-Arvela, A. Tokarev, A.-R. Leino, K. Eränen and D. Y. Murzin, Ind. Eng. Chem. Res., 2012, 51, 8922–8927 CrossRef.
- E. Santillan-Jimenez, T. Morgan, J. Shoup, A. E. Harman-Ware and M. Crocker, Catal. Today, 2014, 237, 136–144 CrossRef CAS.
- J. Fu, X. Lu and P. E. Savage, ChemSusChem, 2011, 4, 481–486 CrossRef CAS PubMed.
- M. Snåre, I. Kubičková, P. Mäki-Arvela, D. Chichova, K. Eränen and D. Y. Murzin, Fuel, 2008, 87, 933–945 CrossRef.
- M. Ahmadi, A. Nambo, J. B. Jasinski, P. Ratnasamy and M. A. Carreon, Catal. Sci. Technol., 2015, 5, 380–388 CAS.
- D. R. Vardon, B. K. Sharma, H. Jaramillo, D. Kim, J. K. Choe, P. N. Ciesielski and T. J. Strathmann, Green Chem., 2014, 16, 1507 RSC.
- A. Berenblyum, V. Y. Danyushevsky, E. Katsman, T. Podoplelova and V. Flid, Pet. Chem., 2010, 50, 305–311 CrossRef.
- J.-G. Na, B. E. Yi, J. K. Han, Y.-K. Oh, J.-H. Park, T. S. Jung, S. S. Han, H. C. Yoon, J.-N. Kim, H. Lee and C. H. Ko, Energy, 2012, 47, 25–30 CrossRef CAS.
- K. Kandel, J. W. Anderegg, N. C. Nelson, U. Chaudhary and I. I. Slowing, J. Catal., 2014, 314, 142–148 CrossRef CAS.
- J.-O. Shim, D.-W. Jeong, W.-J. Jang, K.-W. Jeon, S.-H. Kim, B.-H. Jeon, H.-S. Roh, J.-G. Na, Y.-K. Oh, S. S. Han and C. H. Ko, Catal. Commun., 2015, 67, 16–20 CrossRef CAS.
- D. S. Tong, C. H. Zhou, M. Y. Li, W. H. Yu, J. Beltramini, C. X. Lin and Z. P. Xu, Appl. Clay Sci., 2010, 48, 569–574 CrossRef CAS.
- I. Obregon, I. Gandarias, N. Miletic, A. Ocio and P. L. Arias, ChemSusChem, 2015, 8, 3483–3488 CrossRef CAS PubMed.
- C. H. Bartholomew and R. B. Pannell, J, Catal., 1980, 65, 390 CrossRef CAS.
- J. Wu, T. Wang, J. Fu, Z. Hou and X. Lu, Energy Environ. Focus, 2016, 5, 163–168 CrossRef.
- T. M. Yeh, R. L. Hockstad, S. Linic and P. E. Savage, Fuel, 2015, 156, 219–224 CrossRef CAS.
- D. S. Tong, C. H. Zhou, M. Y. Li, W. H. Yu, J. Beltramini, C. X. Lin and Z. P. Xu, Appl. Clay Sci., 2010, 48, 569–574 CrossRef CAS.
- H.-S. Roh, I.-H. Eum, D.-W. Jeong, B. E. Yi, J.-G. Na and C. H. Ko, Catal. Today, 2011, 164, 457–460 CrossRef CAS.
- O. V. Cherstiouk, P. A. Simonov, A. G. Oshchepkov, V. I. Zaikovskii, T. Y. Kardash, A. Bonnefont, V. N. Parmon and E. R. Savinova, J. Electroanal. Chem., 2016, 783, 146–151 CrossRef CAS.
- J. G. Immer, M. J. Kelly and H. H. Lamb, Appl. Catal., A, 2010, 375, 134–139 CrossRef CAS.
- S. Sá, H. Silva, L. Brandão, J. M. Sousa and A. Mendes, Appl. Catal., B, 2010, 99, 43–57 CrossRef.
Footnote |
| † Electronic supplementary information (ESI) available. See DOI: 10.1039/c7gc02774e |
| This journal is © The Royal Society of Chemistry 2018 |

