 Open Access Article
Synthesis and investigation of a self-assembled hydrogel based on hydroxyethyl cellulose and its in vitro ibuprofen drug release characteristics
Nan
Sun
a,
Ting
Wang
 *ab and
Xiufeng
Yan
b
aDepartment of Chemistry, College of Science, Northeast Forestry University, Harbin 150040, P. R. China. E-mail: thundersking@aliyun.com
bAlkali Soil Natural Environmental Science Center, Northeast Forestry University, Key Laboratory of Saline-alkali Vegetation Ecology Restoration in Oil Field, Ministry of Education, Harbin 150040, P. R. China
First published on 31st January 2017
Abstract
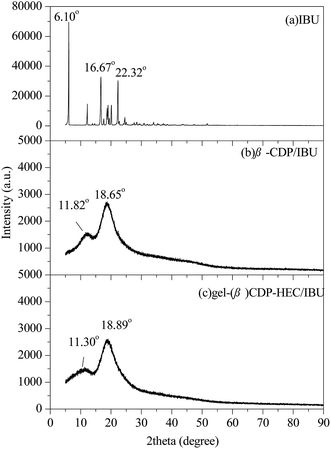
Self-assembled cellulose-based hydrogels are a new type of supramolecular architecture with potential in biomedical applications. By our preparation, hydrophobic lauryl side-chains were grafted onto hydroxyethyl cellulose (HEC-C12) and ibuprofen molecules were encapsulated and solubilized by poly(β-cyclodextrin) (β-CDP/IBU). The content of active residual cavities in β-CDP with inclusion abilities in β-CDP/IBU was determined to be 31.3 wt% by the phenolphthalein probe method, then the residual cavities were used to spontaneously form a self-assembled hydrogel (gel-(β)CDP-HEC/IBU) in water with the hydrophobic C12 side-chains on HEC-C12. The critical concentrations of HEC-C12 and β-CDP/IBU in the self-assembled hydrogel were fixed at 30 mg mL−1 and 35 mg mL−1 respectively, as shown by the dynamic viscosity results. The synthesized macromolecules and hydrogels were characterized by proton nuclear magnetic resonance (1H NMR) and Fourier transform infrared (FTIR) spectroscopy, Scanning Electron Microscopy (SEM), Gel Permeation Chromatography (GPC) and powder X-ray diffractometry (PXRD). A swelling study and the in vitro drug release characteristics of IBU in gel-(β)CDP-HEC/IBU were investigated. The results showed that the loaded content of IBU in gel-(β)CDP-HEC/IBU was 5 wt%, and that IBU encapsulated in gel-(β)CDP-HEC/IBU presented sustained release characteristics over 1440 min. In addition, the Korsmeyer–Peppas kinetic model gave a better correlation for the release of IBU, and the release procedure was a non-Fickian diffusion process.
Introduction
Hydrogels are a kind of three-dimensional network which consists of covalently crosslinked hydrophilic polymers, and may absorb many times their dry weight of water without being dissolved.1–3 In recent years, hydrogels have been widely studied due to their promising applications in cosmetics, biomaterials, drug delivery systems, wastewater purification, and so on.4–10 Among them, considerable research attention has been focused on CD-based hydrogels. As we know, CDs are non-reducing cyclic maltooligosaccharides produced from starch by cyclodextrin glycosyltransferase and are composed of hydrophilic outer surfaces and hydrophobic inner cavities.11–16 This structure with its remarkable abilities can form inclusion complexes with a wide range of guest moieties and hydrophobic side chains,17–23 which is a supramolecular interaction without covalent bonds. Therefore, CD-based hydrogels have become one of the most widely studied functional hydrogels in the field of self-assembly,24,25 especially in biomedical and pharmaceutical fields.5,26–29In many application fields, ordinarily traditional gels are based on organic synthetic polymers, such as poly(acrylamide), poly(2-hydroxyethylacrylate), poly(2-hydroxymethylacrylamide), poly(hydroxyethyl methacrylate) and so on.30–32 Synthetic polymers are non-biodegradable, and the commercialization of these organic synthetic polymer gels is usually limited by the fact that the preparation of the polymer matrices requires large amounts of potentially toxic organic solvents, which are often not able to meet the severe requirements of applications in drug delivery, bio-pharmaceuticals and so on. Herein, HEC, which is a kind of non-ionic cellulose ether with good water solubility and can be easily manufactured using natural cellulose as a raw material, is used as the hydrogel matrix, instead of synthetic polymers, taking advantage of cellulose resources, including its renewable nature, biocompatibility and biodegradability.33–35 To our knowledge, no studies have been performed on the formation of self-assembled supramolecular hydrogels between hydrophobically modified HEC and β-CDP.
Ibuprofen, a non-steroidal anti-inflammatory drug, is usually formulated into many topical preparations to reduce the adverse side effects and avoid hepatic first-pass metabolism. But it is difficult to maintain effective concentrations by topical delivery due to its poor skin permeation ability.36 So far, hydrogel matrices such as carbomer 940,37 xanthan gum,38,39 carrageenan,37 dextran22 and cellulose40 have been used to increase the viscosity of hydrogels for the topical application of IBU.37 However, there are few reports that utilize self-assembly methods to prepare IBU hydrogels, especially CD based hydrogels. Owing to its simple preparation using the technique of self-assembly and the intrinsic advantages for drug delivery from CD, the loading of IBU by CD in a hydrogel through the technique of self-assembly is no doubt a desirable subject of study, whether in theory or in practice. In that case, the purpose of this study is to focus on the synthesis of a self-assembled IBU-loaded hydrogel based on CDs and HEC. According to the literature, IBU is a functional molecule that is efficacious in restraining soft-tissue pain and osteoarthritis. However, the hydrophobic properties of IBU restrain its distribution in hydrogels, which decreases the bioavailability in medical applications. Therefore the solubility of IBU was enhanced through formation of inclusion complexes with β-CDP. First, HEC-C12 and β-CDP were synthesized in a controlled manner. Then, IBU was encapsulated by β-CDP and the content of active residual cavities in β-CDP in β-CDP/IBU was determined. After that, the HEC based gel-(β)CDP-HEC/IBU was obtained just in aqueous solution due to the self-assembly process between the C12 side-chains and the residual hydrophobic cavities of β-CDP, with the IBU drug encapsulated in β-CDP, as mentioned previously. Hence, the synthesized novel gel-(β)CDP-HEC/IBU was a safe, nonirritating, biocompatible and biodegradable hydrogel for biomedical applications. Subsequently, the IBU-loading content, swelling and the in vitro release characteristics were evaluated.
Experimental
Materials
HEC (720![[thin space (1/6-em)]](https://www.rsc.org/images/entities/char_2009.gif) 000 g mol−1, DS = 1.0–1.2, MS = 2.5) was purchased from Sigma-Aldrich Co., Ltd., USA. β-CD (1135 g mol−1, >98%), IBU (206.28 g mol−1, >98%), 1-chlorododecane (C12, AR), EPI (AR) and phenolphthalein (AR) were obtained from Aladdin Industrial Co., Ltd., China. N,N-Dimethylacetamide (DMAc, AR), lithium chloride (LiCl, AR), pyridine (AR) and sodium hydroxide (NaOH, AR) were supplied by Kermel Chemical Reagent Co., Ltd., China. Other reagents were used without further purification.
000 g mol−1, DS = 1.0–1.2, MS = 2.5) was purchased from Sigma-Aldrich Co., Ltd., USA. β-CD (1135 g mol−1, >98%), IBU (206.28 g mol−1, >98%), 1-chlorododecane (C12, AR), EPI (AR) and phenolphthalein (AR) were obtained from Aladdin Industrial Co., Ltd., China. N,N-Dimethylacetamide (DMAc, AR), lithium chloride (LiCl, AR), pyridine (AR) and sodium hydroxide (NaOH, AR) were supplied by Kermel Chemical Reagent Co., Ltd., China. Other reagents were used without further purification.
Preparation of HEC-C12
HEC-C12 was synthesized using a Williamson etherification reaction.22 2 g of HEC was added to 80 mL of DMAc (2 g of LiCl was mixed in for solubilization) at 80 °C, and the mixture was dissolved under continuous mechanical stirring for 24 h. Then 0.68 mL of pyridine and 2 mL of 1-chlorododecane were added to the HEC solution successively. After 8 h of stirring at 80 °C, the solution was cooled to room temperature. Subsequently, it was poured into a dialysis bag (MWCO 8–12 kDa, Biosharp, USA) and dialyzed for 7 days. Finally, the products were obtained by freeze drying.Preparation of β-CDP
β-CDP was synthesized by reaction of β-CD with EPI in alkaline environment.41–44 First, 10 g of β-CD was dissolved in 15 mL of 15 wt% NaOH by stirring overnight at room temperature. Then the mixture was heated to 35 °C and 7 mL of EPI was added in a 1![[thin space (1/6-em)]](https://www.rsc.org/images/entities/char_2009.gif) :
:![[thin space (1/6-em)]](https://www.rsc.org/images/entities/char_2009.gif) 10 β-CD
10 β-CD![[thin space (1/6-em)]](https://www.rsc.org/images/entities/char_2009.gif) :
:![[thin space (1/6-em)]](https://www.rsc.org/images/entities/char_2009.gif) EPI molar ratio. After 200 min, the mixture was poured into a dialysis bag (MWCO 8–12 kDa, Biosharp, USA) and dialyzed for 7 days. Finally, the products were obtained by freeze drying.
EPI molar ratio. After 200 min, the mixture was poured into a dialysis bag (MWCO 8–12 kDa, Biosharp, USA) and dialyzed for 7 days. Finally, the products were obtained by freeze drying.
Solubilization of IBU by β-CDP
The hydrophobic IBU molecules were encapsulated in the self-assembled hydrogel by formation of inclusion complexes with β-CDP before mixing with HEC-C12, and the solubility of IBU could be enhanced in this way at the same time. Phase solubility studies were carried out in water at room temperature according to the method described by Higuchi and Connors.45 An excess amount of IBU was mixed with aqueous solutions containing increasing amounts of β-CDP. The suspensions were stirred at room temperature for 24 h to reach equilibrium. Then the solutions were filtered and the filtrate was lyophilized to obtain the synthesized β-CDP/IBU. The concentration of IBU in solution was determined using a UV spectrophotometer (TU1901, Persee, China) at a wavelength of 219 nm according to the calibration curve of IBU. The solubility of IBU in the β-CDP solution was calculated and the phase-solubility diagram for the solubility of IBU versus concentration of β-CDP was plotted. All experiments were performed in triplicate.46 The apparent stability constant (K1![[thin space (1/6-em)]](https://www.rsc.org/images/entities/char_2009.gif) :
:![[thin space (1/6-em)]](https://www.rsc.org/images/entities/char_2009.gif) m) can be determined from the phase-solubility diagrams.
m) can be determined from the phase-solubility diagrams.
Determination of active residual cavities of β-CDP in β-CDP/IBU
The content of active residual cavities in β-CDP with inclusion abilities in β-CDP/IBU can be determined by the phenolphthalein probe method, as our previous work mentioned.47,48 For determination, 0.02 g of dried β-CDP/IBU was dissolved in 5 mL of 10−3 mol L−1 phenolphthalein in a 50 mL comparison tube and then 15 mL of a Na2CO3–NaHCO3 buffer solution (pH = 10.5) was added. The mixed solution was kept in the dark and stirred for 12 h for complete inclusion equilibrium. After that, the solution was transferred to a 200 mL volumetric flask, and diluted with a Na2CO3–NaHCO3 buffer solution (pH = 10.5) to volume. Then the content of active residual cavities in β-CDP in β-CDP/IBU was determined using a UV spectrophotometer (TU1901, Persee, China) at a wavelength of 553 nm.Preparation of gel-(β)CDP-HEC/IBU
The residual hydrophobic cavities of β-CDP in β-CDP/IBU can encapsulate hydrophobic C12 side-chains due to host–guest interactions. Gel-(β)CDP-HEC/IBU was prepared by mixing equal volumes of aqueous solutions of β-CDP/IBU (0 mg mL−1 to 50 mg mL−1) and HEC-C12 (5 mg mL−1 to 40 mg mL−1). Each sample was obtained by vigorously stirring at room temperature for 3 days so that β-CDP could encapsulate the C12 side-chains thoroughly. Then the dynamic viscosities (η) of the obtained samples were measured using a NDJ-1 rotary viscometer (Jingke, China) at 25 ± 0.01 °C, and the optimum concentrations of β-CDP/IBU and HEC-C12 for preparing gel-(β)CDP-HEC/IBU were proposed accordingly. The hydrogels were repeatedly centrifuged (10![[thin space (1/6-em)]](https://www.rsc.org/images/entities/char_2009.gif) 000 rpm, 15 min) and washed with 5 mL of distilled water 3 times. After that, gel-(β)CDP-HEC/IBU was freeze-dried.
000 rpm, 15 min) and washed with 5 mL of distilled water 3 times. After that, gel-(β)CDP-HEC/IBU was freeze-dried.
Characterization
Swelling and IBU in vitro release studies
Swelling studies of gel-(β)CDP-HEC/IBU were carried out by a gravimetric method. A dry hydrogel sample was weighed (recorded as Wd (g)) and allowed to swell in phosphate-buffered saline buffer solution (PBS, 0.1 mmol L−1, pH = 7.4) at 37 °C.49 At different time intervals, the swelling hydrogel was removed from the aqueous solution and its surface was dried with a filter paper, the weight was measured as Ws (g). The swelling ratio (SR) of the hydrogel at different time intervals is determined using eqn (1)50 and the values of SR were measured and calculated in triplicate. | (1) |
In vitro release of IBU was carried out using a dialysis bag diffusion technique.51–53 PBS buffer solution (0.1 mmol L−1, pH 7.4) was used as the release medium.54 For the release experiment, a control group HEC-C12/IBU was synthesized by dissolving 0.5 g of HEC-C12 in a mixed solution of 20 mL of water and 20 mL of 250 mg L−1 IBU ethanol solution. The obtained HEC-C12/IBU was freeze-dried to get a dry product. After that, 0.1 g of gel-(β)CDP-HEC/IBU and HEC-C12/IBU were dissolved in 20 mL of distilled water, separately. Each solution was transferred to a dialysis bag (MWCO 12–14 kDa, Biosharp, USA) with the two ends fixed by clips and then placed in a preheated release medium (50 mL) at 37 °C under moderate stirring. At different time intervals, 1 mL of the external medium was withdrawn and then an equal volume of fresh medium was added.
Kinetic study of swelling and IBU release
Based on the relative rate of diffusion of water into the hydrogel matrix and the rate of polymer chain relaxation, the swelling of the polymers and the IBU release profile from gel-(β)CDP-HEC/IBU could be simulated by four kinetic models,55–57 the models are listed below.The zero order kinetic model:
 | (2) |
The first order kinetic model:
 | (3) |
The Higuchi kinetic model is widely used to describe the empirical process of drug delivery, which complies with Fick’s law and can be expressed as:58
 | (4) |
The Korsmeyer and Peppas kinetic model described the first 60 wt% of the release behavior of a hypothetical distribution, and it attempts to explain release mechanisms where erosion and/or dissolution of the matrix occurs and is represented as follows:59,60
 | (5) |
Results and discussion
Characterization of HEC-C12
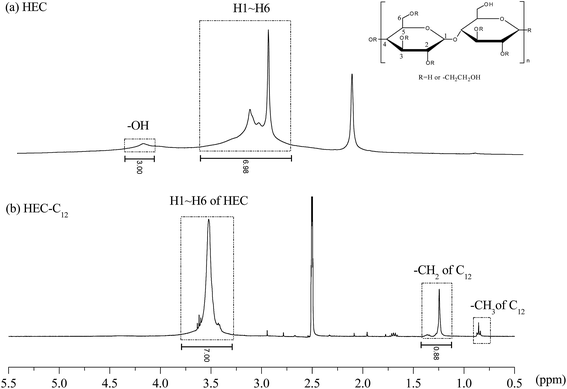
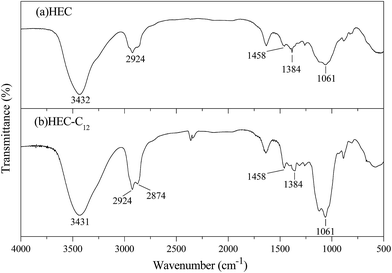
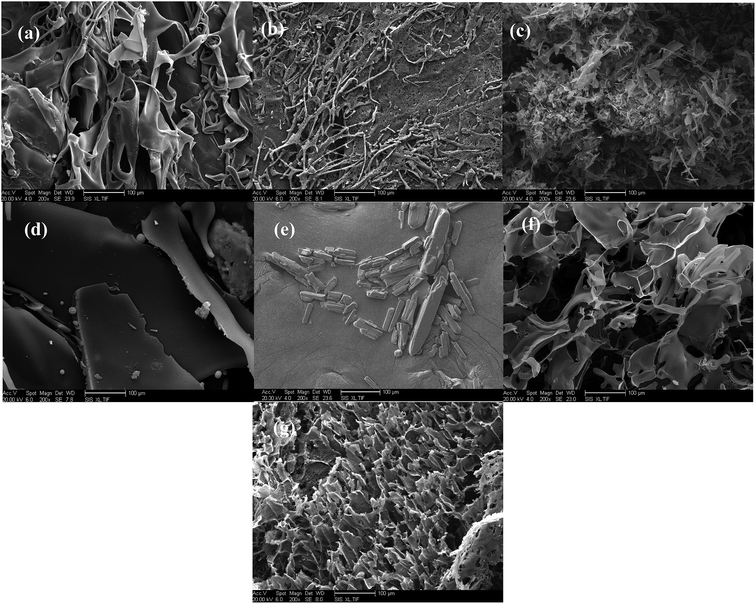
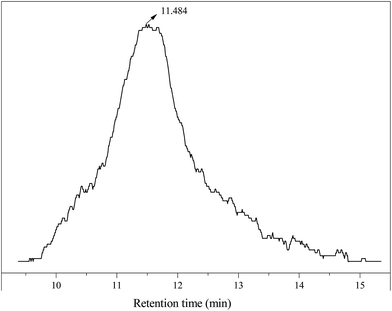
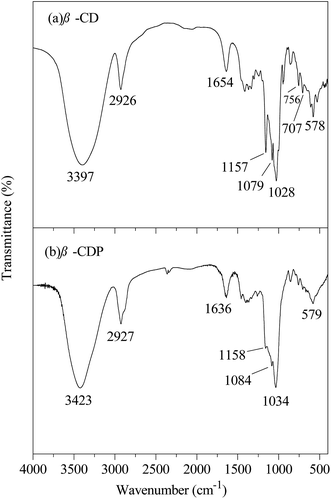
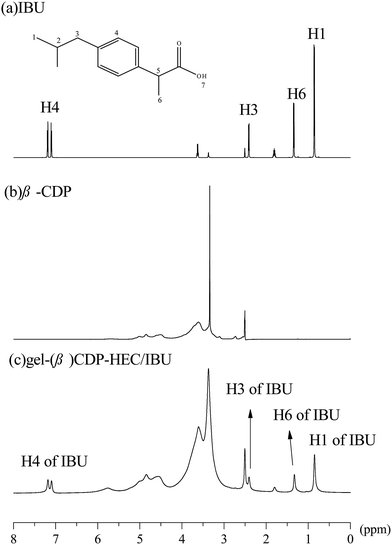
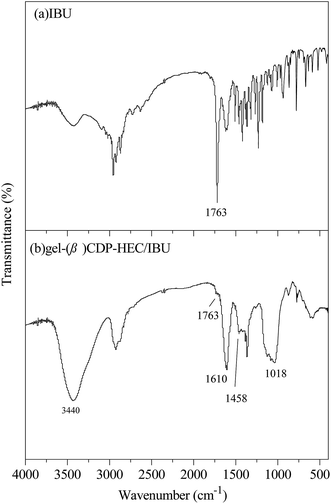
The hydrophobic C12 side-chains are grafted onto HEC using a Williamson etherification reaction, and the grafting of the C12 side-chains on HEC was characterized using 1H NMR, FTIR and SEM.Characterization of β-CDP
Phase solubility studies
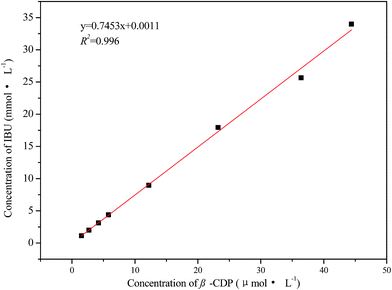
Phase-solubility diagrams are widely used for studying hydrophobic drug/CD complexes because they provide information on both the solubilizing ability of CDs and the apparent stability constants of the inclusion complexes.45,62,63 The solubilized IBU concentration was calculated according to the calibration curve of IBU, which is established as seen in eqn (6), with a correction coefficient (R2) of 0.9986:| A = 6394.68cIBU + 0.723 | (6) |
From Fig. 6, it can be seen that the concentration of solubilized IBU linearly increased with the concentration of β-CDP (R2 = 0.998). This relationship could be defined as the classic AL-type of Higuchi,45 where an A-type curve indicates the formation of a soluble complex and AL-type indicates a linear increase in solubility. The result demonstrates that an inclusion complex with the molar ratio 1![[thin space (1/6-em)]](https://www.rsc.org/images/entities/char_2009.gif) :
:![[thin space (1/6-em)]](https://www.rsc.org/images/entities/char_2009.gif) 1 between IBU molecules and β-CDP formed, and the apparent stability constant K1
1 between IBU molecules and β-CDP formed, and the apparent stability constant K1![[thin space (1/6-em)]](https://www.rsc.org/images/entities/char_2009.gif) :
:![[thin space (1/6-em)]](https://www.rsc.org/images/entities/char_2009.gif) 1 (L mmol−1) can be calculated from the phase-solubility diagram according to eqn (7):
1 (L mmol−1) can be calculated from the phase-solubility diagram according to eqn (7):
 | (7) |
The K1![[thin space (1/6-em)]](https://www.rsc.org/images/entities/char_2009.gif) :
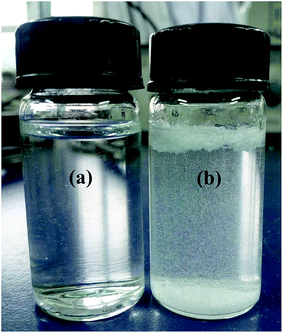
:![[thin space (1/6-em)]](https://www.rsc.org/images/entities/char_2009.gif) 1 value for β-CDP/IBU is found to be 2660 L mmol−1 at room temperature. With an increasing concentration of β-CDP, the water solubility of IBU becomes much higher than its original values. Thus, β-CDP could significantly improve the water solubility of IBU, and 1.50 g of β-CDP was used to solubilize 0.17 g of IBU in 30 mL of distilled water here to form β-CDP/IBU inclusion complexes. The physical maps of the solubilized IBU and its control group without the addition of β-CDP are shown in Fig. 7a and b, respectively.
1 value for β-CDP/IBU is found to be 2660 L mmol−1 at room temperature. With an increasing concentration of β-CDP, the water solubility of IBU becomes much higher than its original values. Thus, β-CDP could significantly improve the water solubility of IBU, and 1.50 g of β-CDP was used to solubilize 0.17 g of IBU in 30 mL of distilled water here to form β-CDP/IBU inclusion complexes. The physical maps of the solubilized IBU and its control group without the addition of β-CDP are shown in Fig. 7a and b, respectively.
Inclusion ability of the active residual cavities of β-CDP in β-CDP/IBU
As mentioned above, IBU molecules can be encapsulated into the cavities contained in β-CDP. However, the question is whether or not β-CDP/IBU still has the inclusion ability to form self-assembled hydrogels with HEC-C12. The answer is given by the detection results of the phenolphthalein probe method. Due to the decolorization of purple phenolphthalein upon complexation with β-CD at pH = 10.5, the content of active residual cavities in β-CDP with inclusion abilities in β-CDP/IBU can be determined.The calibration curve of active β-CD is seen in eqn (8), with R2 of 0.9990:
| ΔA = 9635.7cCD + 0.00181 | (8) |
The content of active residual cavities in β-CDP in β-CDP/IBU is calculated using eqn (9):
 | (9) |
The content of active residual cavities in β-CDP in β-CDP/IBU is determined to be 31.3 wt% by UV spectroscopy after storing overnight, which verifies that β-CDP/IBU still has the ability to form inclusion complexes with the C12 side-chains on HEC.64
Characterization of gel-(β)CDP-HEC/IBU
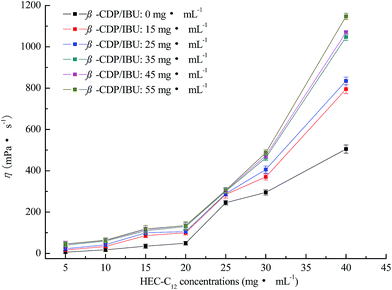
Dynamic viscosities of gel-(β)CDP-HEC/IBU at different HEC-C12 and β-CDP/IBU concentrations are shown in Fig. 8. Without the addition of β-CDP/IBU, as the concentrations of HEC-C12 are more than 20 mg mL−1, the η values of the mixtures are significantly increased. This phenomenon can be explained by the thickening effect of HEC.65,66 When the concentrations of β-CDP/IBU ranged from 15 mg mL−1 to 55 mg mL−1, the η values of the mixtures changed a lot, especially at concentrations of HEC-C12 ranging from 30 mg mL−1 to 40 mg mL−1. It can be inferred that enough hydrophobic C12 side-chains are the requirement for forming hydrogel polymer networks due to CD inclusion chemistry. When the concentration of HEC-C12 was 30 mg mL−1, the η value showed a significant increase compared to that without the addition of β-CDP/IBU. This result demonstrates that the critical concentration of HEC-C12 for forming self-assembled hydrogels can be fixed at 30 mg mL−1. The self-assembly process is represented in Fig. 9. In Fig. 9, HEC-C12 and β-CDP are synthesized and IBU is solubilized and encapsulated by β-CDP. Then C12 side-chains are grafted on HEC to form inclusion complexes with the cavities of β-CDP in β-CDP/IBU through host–guest interactions.
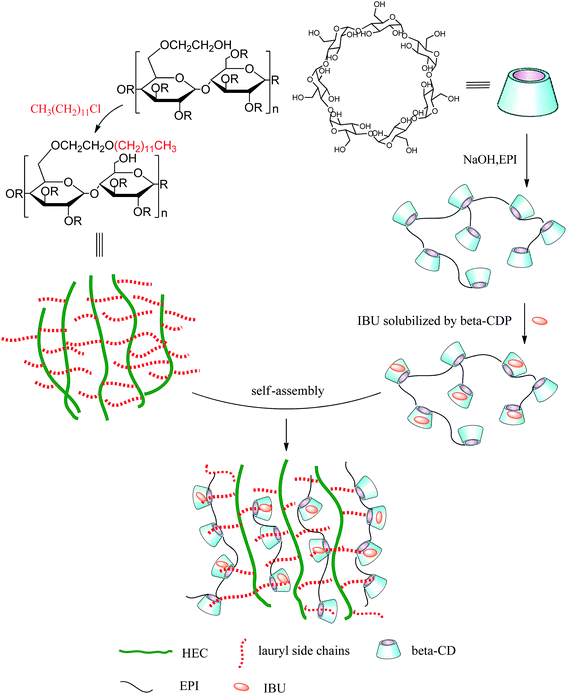 | ||
| Fig. 9 Schematic representation of the formation of self-assembled hydrogels and their drug-loading pattern. | ||
From Fig. 8, when the concentration of HEC-C12 is 30 mg mL−1, the η values of the mixtures change a little as the concentrations of β-CDP/IBU range from 35 mg mL−1 to 55 mg mL−1. It can be inferred that C12 on HEC is encapsulated enough by 35 mg mL−1 of β-CDP/IBU to form a hydrogel when the concentration of HEC-C12 is 30 mg mL−1. Moreover, an increase in the concentration of β-CDP/IBU cannot give benefits for the formation of hydrogels, so the critical concentration of β-CDP/IBU can be fixed at 35 mg mL−1.
Loading content of IBU in gel-(β)CDP-HEC/IBU
As mentioned above, 1.50 g of β-CDP was used to solubilize 0.17 g of IBU for the synthesis of β-CDP/IBU, and the concentrations of β-CDP/IBU and HEC-C12 were fixed at 35 mg mL−1 and 30 mg mL−1 for preparation of gel-(β)CDP-HEC/IBU, respectively. So the content of IBU loaded in gel-(β)CDP-HEC/IBU can be calculated using eqn (10): | (10) |
The content of IBU loaded in gel-(β)CDP-HEC/IBU was calculated as 5 wt% according to the equation above.
Swelling and in vitro release characteristics of IBU from gel-(β)CDP-HEC/IBU
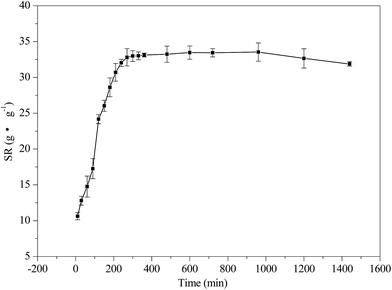
The swelling of hydrogels has a great effect on the rate of drug release. Diffusion-controlled drug release increases with an increase in the swelling of the hydrogel.67 Therefore, in order to better understand the IBU release mechanism, the swelling characteristics of gel-(β)CDP-HEC/IBU were investigated. The swelling profile at different time intervals is shown in Fig. 13. From the graph it can be seen that the values of SR for gel-(β)CDP-HEC/IBU increase with time in the first 270 min. A sharp increase in this initial state is due to the diffusion of water molecules into the hydrogel network and polymer expansion. From 270 min to 960 min, the values of SR plateau due to the water molecules reaching equilibrium in gel-(β)CDP-HEC/IBU. After 960 min, the SR values decrease with time, this phenomenon may be attributed to the fact that the matrices of gel-(β)CDP-HEC/IBU have degraded in the PBS buffer solution after the long duration.In vitro release characteristics of IBU in gel-(β)CDP-HEC/IBU were investigated. The released IBU content can be detected by a UV spectrophotometer (TU1901, Persee, China) at a wavelength of 219 nm according to the calibration curve of IBU as described above and the IBU cumulative release efficiency (R, wt%) was calculated using eqn (11).68,69
 | (11) |
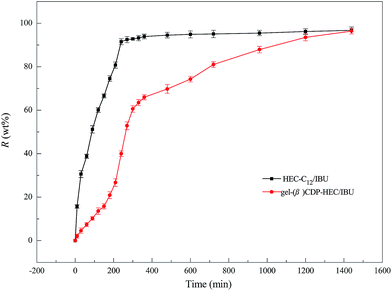
As a control group, the release characteristics of HEC-C12/IBU were also studied in order to evaluate the role of β-CDP in the hydrogels for the sustained release of IBU. The release profile is presented in Fig. 14. Most IBU molecules (91.5 wt%) were released quickly from HEC-C12/IBU within 240 min, while gel-(β)CDP-HEC/IBU presented a significant sustained release of IBU over 1440 min through the dialysis bag. In combination with the results of the swelling characteristics, the release of IBU in the first 960 min can be attributed to IBU molecules escaping from the cavities of β-CDP in gel-(β)CDP-HEC/IBU. From 960 min to 1440 min, IBU is probably released through the degradation of gel-(β)CDP-HEC/IBU matrices in the buffer solution. This phenomenon demonstrates that IBU encapsulated in the cavities of β-CDP in gel-(β)CDP-HEC/IBU can be released through a long-term mechanism.70
In addition, in order to determine the IBU release kinetic model describing the release mechanism, Origin 8.0 software was used. ANOVA analysis and the kinetic parameters for the different kinetic models were determined by linear and nonlinear curve fittings and the results are summarized in Table 1. From Table 1, the ANOVA results “Prob > F” for the four kinetic models are all far lower than 0.05, and it can be concluded that all the fitted curves in the experimental design are statistically significant at a 95% confidence level. Moreover, the value of the correction coefficient R2 for the Korsmeyer and Peppas kinetic model is extremely high (>0.99), greater than those of the zero order, first order and Higuchi models. Hence, the kinetic model of Korsmeyer and Peppas gives better correlation for the release of IBU from gel-(β)CDP-HEC/IBU. Furthermore, the diffusion exponent “n” was calculated as 0.8731, which is between 0.5 and 1, so the release procedure is a non-Fickian diffusion process. Such results indicate that after swelling, IBU release occurs through the combination of both diffusion and erosion of gel-(β)CDP-HEC/IBU.
Conclusions
A novel self-assembled, drug loaded gel-(β)CDP-HEC/IBU was synthesized through host–guest interactions. Hydrophobic IBU molecules were solubilized and encapsulated by β-CDP and the content of residual cavities in β-CDP with inclusion abilities in β-CDP/IBU was determined to be 31.3 wt%. In the hydrogel self-assembly process, the residual cavities provided binding sites for associating with HEC-C12 and the hydrogel demonstrates a high viscosity when the concentrations of HEC-C12 and β-CDP/IBU are fixed at 30 mg mL−1 and 35 mg mL−1, respectively. Moreover, the encapsulated IBU content in gel-(β)CDP-HEC/IBU was detected as 5 wt%, and gel-(β)CDP-HEC/IBU presents the significant sustained release of IBU over 1440 min, for which gel-(β)CDP-HEC/IBU has potential application value in restraining soft-tissue pain and osteoarthritis. In addition, after swelling, the release of IBU from gel-(β)CDP-HEC/IBU complies with the Korsmeyer and Peppas kinetic model and is a non-Fickian diffusion process; in that case, the release mechanism is the synergistic effect of erosion and dissolution of the gel-(β)CDP-HEC/IBU matrix.Acknowledgements
This study is supported by Fundamental Research Funds for the Central Universities (DL13EA02), and the National Natural Science Fund of China (NSFC, 51403030). The China Postdoctoral Science Foundation (2012M520696) and Heilongjiang Postdoctoral Grant (LBH-Z12009) are also gratefully acknowledged for support.References
- X. Zheng, Q. Zhang, J. Liu, Y. Pei and K. Tang, RSC Adv., 2016, 6, 71999–72007 RSC.
- H. Luo, G. Xiong, Z. Yang, S. R. Raman, H. Si and Y. Wan, RSC Adv., 2014, 4, 14369–14372 RSC.
- J. Kim, B. Wu, S. M. Niedzielski, M. T. Hill, R. M. Coleman, A. Ono and A. Shikanov, J. Biomed. Mater. Res., Part A, 2015, 103, 2701–2710 CrossRef CAS.
- E. A. Appel, J. D. Barrio, X. J. Loh and O. A. Scherman, Chem. Soc. Rev., 2012, 41, 6195–6214 RSC.
- C. Fu, X. Lin, J. Wang, X. Zheng, X. Li, Z. Lin and G. Lin, J. Mater. Sci.: Mater. Med., 2016, 27, 1–7 CrossRef CAS.
- S. K. H. Gulrez, S. Al-Assaf and G. O. Phillips, Prog. Mol. Environ. Bioeng.: Anal. Model. Technol. Appl., 2011, 664–677, DOI:10.5772/24553.
- N. Mohammed, N. Grishkewich, R. M. Berry and K. C. Tam, Cellulose, 2015, 22, 1–14 CrossRef.
- J. Yang, S. Han, L. Yang and H. Zheng, J. Chem. Technol. Biotechnol., 2014, 91, 618–623 CrossRef.
- Q. Yan, Y. Lin, S. Zhang and J. Huang, Chemistry, 2011, 17, 5180–5187 CrossRef PubMed.
- Z. Zhang, R. Zhang, L. Zou and D. J. Mcclements, Food Hydrocolloids, 2016, 58, 160–170 CrossRef CAS.
- S. Ishiwata and M. Kamiya, Chemosphere, 1999, 38, 2219–2226 CrossRef CAS.
- P. Lu, F. Wu and N. Deng, Appl. Catal., B, 2004, 53, 87–93 CrossRef CAS.
- P. Velusamy, S. Pitchaimuthu, S. Rajalakshmi and N. Kannan, J. Adv. Res., 2014, 5, 19–25 CrossRef CAS.
- J. C. M. Uitdehaag, d. V. B. A. Van, L. Dijkhuizen, R. Elber and B. W. Dijkstra, Proteins, 2001, 43, 327–335 CrossRef CAS.
- D. C. Bibby, N. M. Davies and I. G. Tucker, Int. J. Pharm., 2000, 197, 1–11 CrossRef CAS.
- Y. Liu, X. Fan, T. Kang and L. Sun, Macromol. Rapid Commun., 2004, 25, 1912–1916 CrossRef CAS.
- H. Zhou, Z. Wang, X. Duan, L. Jiang, P. Cao and J. Li, Biochem. Eng. J., 2016, 111, 100–107 CrossRef CAS.
- X. Wang, H. Hu, W. Wang, K. I. Lee, C. Gao, L. He, F. Wang, C. Lai, B. Fei and J. H. Xin, Colloids Surf., B, 2016, 143, 342–351 CrossRef CAS.
- M. Wang, J. Wang, Y. Wang, C. Liu, J. Liu, Z. Qiu, Y. Xu and S. F. Lincoln, Colloid Polym. Sci., 2016, 294, 1087–1095 CrossRef CAS.
- X. Cheng, J. Yong, T. Sun, R. Qi, H. Li and W. Fan, Colloids Surf., B, 2016, 141, 44–52 CrossRef CAS.
- J. Shen, X. Xin, T. Liu, L. Tong, G. Xu and S. Yuan, J. Colloid Interface Sci., 2016, 468, 78–85 CrossRef CAS.
- R. Gref, C. Amiel, K. Molinard, S. Daoud-Mahammed, B. Sébille, B. Gillet, J. C. Beloeil, C. Ringard, V. Rosilio, J. Poupaert and P. Couvreur, J. Controlled Release, 2006, 111, 316–324 CrossRef CAS.
- I. Tomatsu, A. Hashidzume and A. Harada, Macromol. Rapid Commun., 2005, 26, 825–829 CrossRef CAS.
- S. Tan, L. Katharina, Q. Fu, A. Blencowe and G. G. Qiao, Macromol. Rapid Commun., 2014, 35, 1166–1184 CrossRef CAS.
- S. Tan, Q. Fu, J. M. P. Scofield, J. Kim, P. A. Gurr, K. Ladewig, A. Blencowe and G. G. Qiao, J. Mater. Chem. A, 2015, 3, 14876–14886 RSC.
- R. Li, X. Zhang, Q. Zhang, H. Liu, J. Rong, M. Tu, R. Zeng and J. Zhao, J. Appl. Polym. Sci., 2015, 133 CAS.
- M. U. Minhas, M. Ahmad, S. Khan, D. L. Ali and M. Sohail, Cellul. Chem. Technol., 2016, 50, 233–242 CAS.
- K. Yang, S. Wan, B. Chen, W. Gao, J. Chen, M. Liu, B. He and H. Wu, Carbohydr. Polym., 2016, 136, 300–306 CrossRef CAS.
- Y. Ye and X. Hu, J. Nanomater., 2016, 2016, 1–8 CrossRef.
- H. Yamaguchi, Y. Kobayashi, R. Kobayashi, Y. Takashima, A. Hashidzume and A. Harada, Nat. Commun., 2012, 3, 19596–19600 Search PubMed.
- M. Nakahata, Y. Takashima and A. Harada, Macromol. Rapid Commun., 2015, 37, 86–92 CrossRef.
- Z. R. Miladinovic, M. Micic and E. Suljovrujic, J. Polym. Res., 2016, 23, 1–12 CrossRef CAS.
- Z. Liu and H. Huang, Carbohydr. Polym., 2016, 147, 226–233 CrossRef CAS PubMed.
- J. K. Pandey, S. H. Ahn, C. S. Lee, A. K. Mohanty and M. Misra, Macromol. Mater. Eng., 2010, 295, 975–989 CrossRef CAS.
- L. Altomare, A. Cochis, A. Carletta, L. Rimondini and S. Farè, J. Mater. Sci.: Mater. Med., 2016, 27, 1–13 CrossRef CAS.
- H. Chen, X. Chang, D. Du, J. Li, H. Xu and X. Yang, Int. J. Pharm., 2006, 315, 52–58 CrossRef CAS.
- H. Chen, D. Mou, D. Du, X. Chang, D. Zhu, J. Liu, H. Xu and X. Yang, Int. J. Pharm., 2007, 341, 78–84 CrossRef CAS.
- L. Djekic, M. Martinovic, R. Stepanović-Petrović, A. Micov, M. Tomić and M. Primorac, Eur. J. Pharm. Sci., 2016, 92, 255–265 CrossRef CAS.
- R. Ray, S. Maity, S. Mandal, T. K. Chatterjee and B. Sa, Adv. Polym. Technol., 2011, 30, 1–11 CrossRef CAS.
- M. Maswal, O. A. Chat and A. A. Dar, Colloid Polym. Sci., 2015, 293, 1723–1735 CrossRef CAS.
- J. Szeman, E. Fenyvesi, J. Szejtli, H. Ueda, Y. Machida and T. Nagai, J. Inclusion Phenom. Macrocyclic Chem., 1987, 5, 427–431 CrossRef CAS.
- E. Renard, A. Deratani, G. Volet and B. Sebille, Eur. Polym. J., 1997, 33, 49–57 CrossRef CAS.
- C. Koopmans and H. Ritter, Macromolecules, 2008, 41, 7418–7422 CrossRef CAS.
- M. F. Oliveira, D. Suarez, J. C. B. Rocha, M. E. Cortés, F. B. D. Sousa and R. D. Sinisterra, Mater. Sci. Eng., C, 2015, 54, 252–261 CrossRef CAS.
- T. Higuchi and K. A. Connors, Adv. Anal. Chem. Instrum., 1965, 4, 117–212 CAS.
- A. Heydari, M. Iranmanesh, F. Doostan and H. Sheibani, Pharm. Chem. J., 2015, 49, 605–612 CrossRef CAS.
- T. Wang, B. Li, H. Si and L. Lin, Surf. Interface Anal., 2011, 43, 1532–1538 CrossRef CAS.
- H. Si, B. Li, T. Wang and Z. Xu, Wood Sci. Technol., 2013, 47, 601–613 CrossRef CAS.
- R. Li, X. Zhang, Q. Zhang, H. Liu, J. Rong, M. Tu, R. Zeng and J. Zhao, J. Appl. Polym. Sci., 2015, 133, 43072 Search PubMed.
- S. K. H. Gulrez, S. Al-Assaf and G. O. Phillips, Hydrogels: Methods of preparation, characterisation and applications, in Molecular and Environmental Bioengineering, Assaf, South Africa, 2010 Search PubMed.
- P. Ji, T. Yu, Y. Liu, J. Jiang, J. Xu, Y. Zhao, Y. Hao, Y. Qiu, W. Zhao and C. Wu, Drug Des., Dev. Ther., 2016, 10, 911–925 CAS.
- M. Halayqa and U. Domańska, Int. J. Mol. Sci., 2014, 15, 23909–23923 CrossRef.
- M. C. Fontana, T. L. Durli, A. R. Pohlmann, S. S. Guterres and R. C. R. Beck, Powder Technol., 2014, 258, 49–59 CrossRef CAS.
- C. Y. Hsu, T. Sato, S. Moriyama and M. Higuchi, Eur. Polym. J., 2016, 83, 499–506 CrossRef CAS.
- A. B. Morales-Cepeda, C. A. Castillo-Miranda, C. F. Castro-Guerrero, H. Salas-Papayanopolos, H. A. Ocejo-Velasco, J. A. González-Sánchez, U. Paramo and H. D. Alva-Salazar, Int. J. Polym. Sci., 2016, 2634104 Search PubMed.
- N. A. Peppas and R. W. Korsmeyer, Hydrogels in Med. Pharm., vol. III. Prop. Appl., 1987, vol. 3, pp. 109–136 Search PubMed.
- P. L. Ritger and N. A. Peppas, J. Controlled Release, 1987, 5, 23–36 CrossRef CAS.
- T. J. Higuchi, J. Pharm. Sci., 1963, 52, 1145–1149 CrossRef CAS.
- R. W. Korsmeyer, R. Gurny, E. Doelker, P. Buri and N. A. Peppas, Int. J. Pharm., 1983, 15, 25–35 CrossRef CAS.
- N. A. Peppas, Pharm. Acta Helv., 1985, 60, 110–111 CAS.
- A. K. Bajpai, S. K. Shukla, S. Bhanu and S. Kankane, Prog. Polym. Sci., 2008, 33, 1088–1118 CrossRef CAS.
- Y. Liao, X. Zhang, C. Li, Y. Huang, M. Lei, M. Yan, Y. Zhou and C. Zhao, Carbohydr. Polym., 2016, 147, 415–425 CrossRef CAS.
- W. Sangpheak, J. Kicuntod, R. Schuster, T. Rungrotmongkol, P. Wolschann, N. Kungwan, H. Viernstein, M. Mueller and P. Pongsawasdi, Beilstein J. Org. Chem., 2015, 11, 2763–2773 CrossRef CAS.
- N. Sun, T. Wang and C. Liu, Wood Sci. Technol., 2016, 50, 1243–1260 CrossRef CAS.
- W. Sun, D. Sun, Y. Wei, S. Liu and S. Zhang, J. Colloid Interface Sci., 2007, 311, 228–236 CrossRef CAS.
- G. Zhao and S. B. Chen, J. Colloid Interface Sci., 2007, 316, 858–866 CrossRef CAS PubMed.
- T. S. Anirudhan, Binusreejayan and J. R. Deepa, J. Appl. Polym. Sci., 2016, 133, 43479 CrossRef.
- T. Wang, B. Li, H. Si, L. Lin and L. Chen, J. Inclusion Phenom. Macrocyclic Chem., 2011, 71, 207–213 CrossRef CAS.
- W. Hao, T. Xia, Y. Shang, S. Xu and H. Liu, Colloid Polym. Sci., 2016, 294, 1107–1116 CrossRef CAS.
- B. Mandal, D. Das, A. P. Rameshbabu, S. Dhara and S. Pal, RSC Adv., 2016, 6, 19605–19611 RSC.
| This journal is © The Royal Society of Chemistry 2017 |

