Electrically controlled release of insulin using polypyrrole nanoparticles†
Niloufar
Hosseini-Nassab‡
a,
Devleena
Samanta‡
a,
Yassan
Abdolazimi
b,
Justin P.
Annes
b and
Richard N.
Zare
*a
aDepartment of Chemistry, Stanford University, Stanford, CA 94305, USA. E-mail: zare@stanford.edu
bDivision of Endocrinology and Metabolism, Department of Medicine, Stanford University School of Medicine, Stanford, CA 94305, USA
First published on 2nd December 2016
Abstract
Conducting polymers present an opportunity for developing programmable, adjustable, spatially, and temporally controllable drug delivery systems. While several small molecule drugs have been released from thin conductive polymeric films successfully, delivering large molecule therapeutics, such as polypeptides and nucleic acids, has remained a significant challenge. Poor drug loading (∼ng cm−2) of thin films coupled with film instability has, in many cases, made conducting polymer films refractory to clinical development. To address these limitations, we have utilized conductive polymer nanoparticulate backbones to controllably release insulin, a high molecular weight, clinically relevant polypeptide. We find that the interaction between insulin and the polymer scaffold can be described by a simple Langmuir-type adsorption model. By modifying the ratio of the amount of nanoparticles to the amount of insulin, we have obtained drug loading percentages estimated to be as high as 51 wt% percent. In vivo experiments in mice confirmed retained bioactivity of the released insulin after electrical stimulation.
Introduction
Peptides and protein-based therapeutics, also known as biologics (molecular weight >5000 Da), are an emerging class of drugs that offer higher potency and greater target specificity compared to conventional small molecule drugs (molecular weight <500 Da).1,2 Currently, biologics are estimated to have a market value exceeding $200 billion per year, comprising approximately 18–20% of the pharmaceutical market.3 Their value is increasing at a rate faster than that of small molecule drugs, and in the future, their market share is expected to grow further.3 A major impediment restricting the use of biologics is lack of effective delivery methods. Most peptides and proteins have oral bioavailabilities of less than 2% owing to degradation and poor absorption in the gastrointestinal tract.4 Consequently, these drugs are most commonly administered through injections which may be invasive, painful, and prone to infectious complications.1An externally controlled, programmable, and implantable drug delivery system could provide an avenue for releasing drugs with spatial and temporal precision in response to patient needs.5–7 By using stimuli-responsive polymers8–10 that can release an incorporated drug when acted upon by external stimuli, it is possible to develop such a system to deliver peptides and proteins. In particular, the use of electric stimuli is attractive because complex instrumentation is not required to generate electric signals, electronic devices can be easily miniaturized, and it is possible to develop wireless implants.11,12 These types of systems are most suitable for treatment of chronic diseases requiring repeated medication.
Most prior studies examining the use of thin electroresponsive films have utilized conducting polymers and hydrogels. For example, small molecule drugs such as, glutamate,13 dexamethasone,14 risperdone,15etc. can be released from conducting polymer thin films. However, releasing large molecules such as peptides, proteins, and growth factors is significantly more challenging. For instance, in 2006, Thompson et al.16 showed electrically stimulated release of neurotrophin-3 (NT-3) from polypyrrole scaffolds. While the drug loading increased on using thicker films, it was found that the cumulative percent release of loaded drug was lower for thicker films indicating the difficulty of releasing drugs from the interior of the film.16 George et al.17 made an important advancement by showing that via biotinylation, drugs can be released from polypyrrole films independent of charge and molecular weight. In this way, they showed release of nerve growth factor. In 2015, Shamaeli et al.18 showed that insulin can be released from gold-nanoparticle functionalized polypyrrole nanowires films. In most of these studies, the drug loading was poor, on the order of ∼10–150 ng cm−2, depending on film thickness. Recently, Teodorescu et al.19 reported a ∼9 wt% drug loading of insulin onto reduced graphene oxide. They were able to release ∼70% of the incorporated drug by applying −0.8 V vs. Ag/AgCl for 30 min. However, the insulin-reduced graphene oxide composite film delaminated from the working electrode on application of higher voltages (−1 V).19
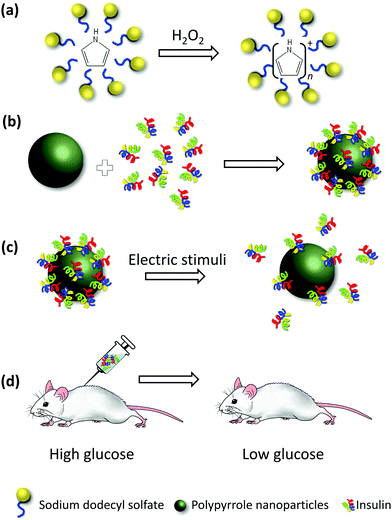
To overcome the difficulties associated with thin films, we use nanoparticles of polypyrrole (PPy NPs). Fig. 1 presents a schematic representation of our experiments. In this work, we use insulin as a model polypeptide for therapeutic delivery. Insulin (INS) was loaded on the surface of the prepared PPy NPs, and its release was triggered by using electrical stimuli. The released insulin was injected in mice, and the blood glucose levels of the mice were monitored as a function of time. By comparing the effect of released insulin to the effect of a standard solution of insulin at the same concentration, we were able to assess the bioactivity of the former.
Our rationale for using nanoparticles was to capitalize on their higher surface-to-volume ratios, which may lead to higher drug loading. For films, more drug release requires a larger surface area of the working electrode, not just an increase in film thickness. In sharp contrast, for nanoparticles, more drug release is achieved simply by increasing the concentration of nanoparticles.20 Another advantage of using nanoparticles is their ease of scale up.
We used INS as a model drug because its clinical use could be enhanced by a controlled release system such as ours. Conventionally, INS is administered by subcutaneous injection several times a day to treat diabetes.21 Prior studies indicate that about one-third of the patients are nonadherent to the prescribed medication22 which may cause serious complications. Our drug delivery system can navigate around these issues by reducing the number of injections from daily to weekly or monthly, depending on the dosage of insulin required. Moreover, it can help to increase patient compliance as the insulin release can be programmed and externally triggered using wireless implants.11
Materials
Pyrrole (reagent grade, 98%), sodium dodecyl sulfate (ReagentPlus®, ≥98.5%), 35 wt% hydrogen peroxide H2O2, platinum wire, FITC-labeled human insulin, recombinant human insulin (dry powder), Pur-A-Lyzer™ Dialysis Kits, and Whatman® Anotop® 25 syringe filters were purchased from Sigma Aldrich. Screen-printed electrodes were purchased from Metrohm. Platinum wire electrodes (0.5 mm diameter, 7.5 cm length) and Ag/AgCl reference electrodes were purchased from BASi. EMD Millipore Amicon™ Ultra-0.5 Centrifugal Filter Units (30 kDa MWCO, 50 kDa MWCO, and 100 kDa MWCO) were purchased from Fisher Scientific.Methods
All syntheses and measurement experiments were performed at room temperature in quadruplicate, unless otherwise mentioned. All procedures involving mice were approved and conducted in accordance with the Stanford Administrative Panel on Laboratory Animal Care (APLAC).Synthesis of polypyrrole nanoparticles (PPy NPs)
To 1 mL of 0.1 M SDS in 40 mM HCl, 20 μL pyrrole was added while stirring. 40 μL of 35 wt% hydrogen peroxide (H2O2) was added to initiate the oxidation of pyrrole to polypyrrole, and the reaction mixture was stirred for 24 h.FITC-INS loading experiments
1 mL of the nanoparticles were placed in Pur-A-Lyzer™ dialysis tubes (MWCO 3.5 kDa) and the tubes were then placed in 50 mL phosphate buffered saline, PBS (supernatant), with stirring for 24 h. The washed PPy NPs were then recovered and their volume was adjusted to 1 mL with PBS. 5 μL PPy NPs were mixed with 5 μL FITC-insulin solution (prepared in PBS) and 740 μL water, vortexed, and filtered through a 20 nm Whatman® Anotop® 25 syringe filter. Six different concentrations of FITC-insulin solution were used: 25, 18, 12.5, 9, 6.25, and 5 mg mL−1, respectively. 100 μL of the filtrate was mixed with 100 μL of 0.1 N NaOH and the absorbance of the resultant solution was monitored between 400–700 nm using a TECAN infinite M1000 plate reader. The concentration of FITC-INS in the filtrate was calculated using a standard calibration curve. Using this value, the amount of FITC-INS attached to PPy NPs was determined. All drug loadings are calculated as wt/wt percentages, with respect to the weight of pyrrole initially added to form the PPy NPs.Size measurements
The size of the nanoparticles was determined using scanning electron microscopy (SEM). 5 μL of PPy NPs, dialyzed against water, were mixed with 5 μL of 10 mg mL−1 INS in 0.01 M HCl and drop casted onto an aluminum stub. Simultaneously, 10 μL of PPy NPs without any INS were drop casted onto another aluminum stub. Both stubs were dried overnight in a vacuum desiccator. After sputter coating the sample with Au/Pd, SEM was performed using a Zeiss Sigma FESEM instrument to characterize the size of the nanoparticles. The size was also corroborated using dynamic light scattering. 5 μL of PPy NPs were mixed with 2 mL water and 1 mL of the resultant solution was used for measurement. A Malvern Zetasizer Nano ZS90 instrument was used to record the size.Calibration curve for FITC-INS and INS
In a well 96-well plate, 20, 40, 60, 80, and 100 μL of a 20 μg mL−1 solution of FITC-INS were placed in 5 wells. The volume of each well was adjusted to 100 μL, followed by addition of 100 μL of 0.1 N NaOH. The absorbance was recorded between 400–700 nm. For INS, 0, 15, 30, 45, 60, 75, and 90 μL of 10 mg mL−1 INS in 0.01 M HCl were added to 7 wells of a 96 well-plate respectively. The volume was adjusted to 150 μL with water, and then 150 μL of 0.1 M NaOH was added to each well. The absorbance was monitored between 230–400 nm. For both molecules, the absorbance maxima were plotted as a function of the concentration, and these points were fit to a straight line by simple linear regression to obtain the final calibration curve.Electrically stimulated pulsed release of FITC-INS
Screen-printed electrodes (SPEs) from Metrohm with carbon working (WE) and Ag/AgCl counter and reference electrodes (CE and RE) were used for all stimulation experiments. The surface area of the working electrode was ∼14 mm2. 5 μL of PPy NPs were mixed with 5 μL of 5 mg mL−1 FITC-INS in PBS. −1 V was applied for 2 min as a pulse to 10 μL of the resulting solution. The sample was then diluted with 400 μL water, and passed through a 100 kDa MWCO EMD Millipore Amicon™ Ultra-0.5 centrifugal filter unit at 10![[thin space (1/6-em)]](https://www.rsc.org/images/entities/char_2009.gif) 000 rpm for 3 min. An Eppendorf Centrifuge 5415 C was used. 100 μL of the filtrate were placed in a Greiner 96-well plate and 100 μL 0.1 N NaOH were added to this. The absorbance reading was taken between 400–700 nm.
000 rpm for 3 min. An Eppendorf Centrifuge 5415 C was used. 100 μL of the filtrate were placed in a Greiner 96-well plate and 100 μL 0.1 N NaOH were added to this. The absorbance reading was taken between 400–700 nm.
Electrically stimulated release of INS for in vivo testing
100 μL PPy NPs, dialyzed against water, were added to 100 μL of 10 mg mL−1 INS in 0.01 M HCl. The resulting mixture was placed in a dialysis tube (6 kDa MWCO). A thin, coiled, Pt wire (∼180 mm2 surface area) was placed inside the dialysis tube as the WE. Outside, 10 mL PBS were placed. A Pt counter electrode and Ag/AgCl reference electrode were used. −1 V was applied for 20 min. As a control, a similar set-up was used, except no voltage was applied. All the solution inside the dialysis tube was retrieved. 6 aliquots of 100 μL each were added to the dialysis tube and retrieved. A total volume of 800 μL of the solution obtained in this way was filtered using a 100 kDa MWCO EMD Millipore Amicon™ Ultra-0.5 centrifugal filter unit at 6000 rpm for 5 min, 50 kDa MWCO EMD Millipore Amicon™ Ultra-0.5 centrifugal filter unit at 6000 rpm for 5 min, and 30 kDa MWCO EMD Millipore Amicon™ Ultra-0.5 centrifugal filter unit at 6000 rpm for 5 min. 150 μL of the filtrate was diluted with 150 μL of 0.1 N NaOH in a 96-well plate and the absorbance was read between 250–400 nm. Using the calibration curve, the concentration of INS released was calculated.Bioactivity of released insulin determined through insulin tolerance test
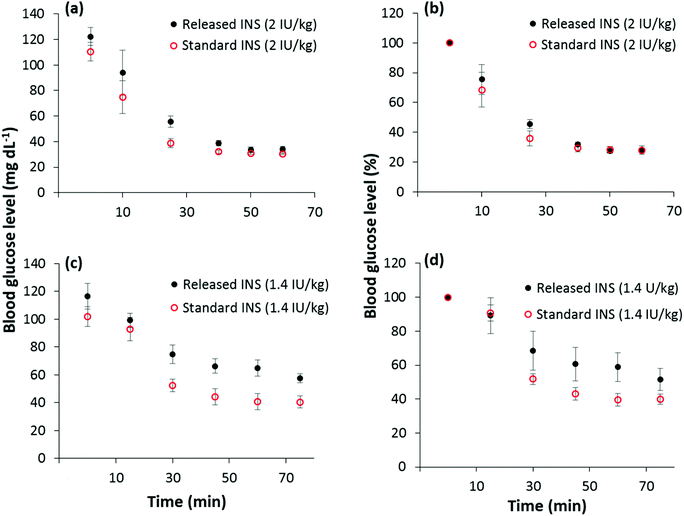
Approximately 8-week-old Swiss Webster mice were fasted for 6 hours before the experiment. First, the dose of INS to be injected to see effective lowering of blood glucose levels was determined (data not shown). Effective doses were determined to lie above 1 IU kg−1. For the bioactivity test, the mice were weighed before the experiment and divided into two groups. The average weight of the two groups were not significantly different. The INS released from INS–PPy NPs and a standard solution of INS were injected intraperitoneally into mice at a concentration of 2 IU kg−1 (4 mice per group) and 1.4 IU kg−1 (6 mice per group). The blood glucose level was measured using a glucometer before the INS injection as well as after the injection as a function of time up to 1 h. Blood glucose levels below 30 mg dL−1 or undetectable by glucometer were considered too low for accurate measurement and therefore assigned a value of 30 mg dL−1.Graphs and figures
The data points plotted on all the graphs are the averages of n replicate measurements. The value of n is mentioned in each figure caption. Error bars correspond to one standard error.Results and discussion
Synthesis and characterization of INS–PPy NPs
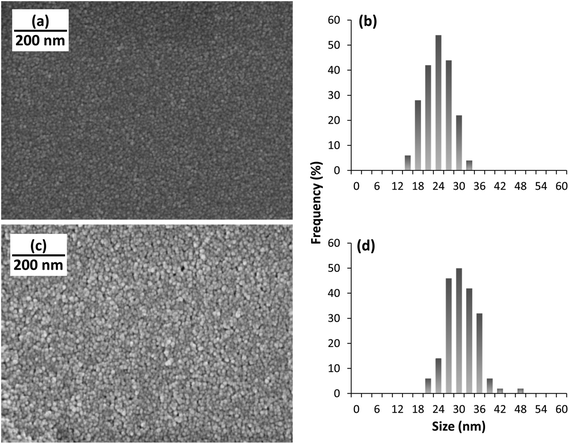
PPy NPs were synthesized using a one-step microemulsion technique as reported before.20,23 Briefly, monomeric pyrrole was added to a micellar solution of sodium dodecyl sulfate. Oxidation of pyrrole was initiated by using hydrogen peroxide, H2O2 (Fig. 1a). The nanoparticles were stirred for 24 h, and then washed via dialysis. The nanoparticles synthesized using this method are fairly monodisperse, their size being ∼22 nm in diameter, as measured using scanning electron microscopy, SEM (Fig. 2). The biocompatibility of polypyrrole is well established,24,25 and previous work in our lab has further corroborated this.26 INS was conjugated to the PPy NPs by mixing a solution of the nanoparticles with a solution of INS. The size of PPy NPs increased to ∼29 nm on INS addition (Fig. 2). This is consistent with a monolayer adsorption of INS on the nanoparticle surface (molecular diameter of INS is 2.68 nm).27,28 The polydispersity indices of both PPy NPs and INS–PPy NPs measured by dynamic light scattering were ∼0.150, confirming the narrow size distribution of the nanoparticles. Also, transmission electron microscopy (TEM) images (Fig. S1†) are in agreement with both SEM and DLS data.Modeling INS binding to PPy NPs
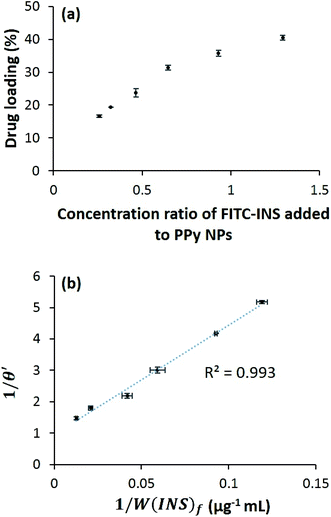
Preliminary experiments were performed with fluorescein isothiocyanate-labeled human insulin (FITC-INS) for ease of detection and quantification using absorbance spectroscopy. It was found that the drug loading was dependent on the concentration of FITC-INS added to the PPy NPs (Fig. 3a), and there existed an equilibrium between the FITC-INS coupled to the PPy NPs and the free FITC-INS in solution. To understand the nature of interaction between FITC-INS and PPy NPs, we examined the relationship between the amount of drug initially added, the amount of drug loaded, and the amount of drug unattached (see ESI†). We found that a simple Langmuir-type adsorption isotherm29 is sufficient to model FITC-INS–PPy binding. Assuming each PPy NP has multiple binding sites for insulin, and only one insulin molecule can be attached to one binding site, we can define θ to be the fraction of binding sites occupied by insulin molecules. To follow Langmuir-type adsorption, a plot of 1/θ versus 1/[INS]f should be linear, where [INS]f is the molar concentration of free insulin. By converting concentrations to weight per unit volume W(INS)f, we find that (see ESI† for more details) a plot of 1/θ′ versus 1/W(INS)f must be linear as well. Here θ′ is the concentration ratio of the bound insulin to PPy NPs. By fitting experimental data to the above model, we do obtain a linear graph, with a R2 value of 0.993 (Fig. 3b). From this figure, it can be extrapolated that the maximum drug loading that can be obtained is about ∼51 wt%. Fig. 3a, in which the drug loading appears to asymptotically approach this value, is consistent with this calculation. It is to be remembered that the Langmuir-type adsorption model is obtained by assuming equilibrium, i.e., the rate of adsorption is equal to the rate of desorption. Therefore, the higher drug loading is, the more will be the free diffusion of the drug from the polymer surface. This indicates, that by tuning the ratio of the drug to polymer, PPy NPs may be tailored for use in sustained release as well as stimuli-responsive release of other polypeptides.Electrically triggered pulsed released of INS
It is believed that FITC-INS is adsorbed on the surface of the PPy NPs, held by a combination of electrostatic and hydrophobic interactions. Drug release is evoked by application of a potential (−1 V vs. Ag/AgCl) that reduces the PPy NPs, thereby altering the strength of interaction with the FITC-INS moiety.20,26 Release experiments were carried out by mixing FITC-INS-loaded PPy NPs with phosphate buffered saline (PBS) solution at pH 7.4. The resulting solution containing the drug-loaded nanoparticles were smeared onto a screen-printed electrode with a carbon working electrode and a Ag/AgCl counter and reference electrode. By applying −1 V for 2 min as a stimulus, it was possible to release FITC-INS in a pulsed manner. From Fig. 4, it can be seen that as the number of pulses increases, the amount of FITC-INS released increases. This observation shows that insulin can be released on demand, and the magnitude of release can be controlled through the applied electrical stimuli. We have shown previously that drug release from PPy NPs is dependent on several factors including pH, current, voltage, time, etc.20 Therefore, in this work, we focus on how to adapt this drug delivery system for release of large molecules. In the future, these drug-loaded PPy NPs may be coupled to a wirelessly controlled, miniaturized implantable chip for drug delivery in vivo. We have performed prototype experiments demonstrating the feasibility of this in an earlier publication.11 The PPy NPs may be localized within a hydrogel or a semi-permeable membrane that selectively allows the drug molecule to pass through. The electronic chip may provide the electrical stimulation necessary for invoking drug release.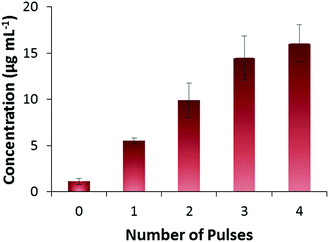 | ||
| Fig. 4 Pulsed release of FITC-INS. 1 pulse = −1 V for 2 min (n = 3). Amount of FITC-INS released increases with increasing number of pulses applied. | ||
Bioactivity test of released insulin in vivo
FITC-INS was used in these experiments to understand the properties of the proposed drug delivery system. Because FITC-INS is not biologically active, bioactivity of the released drug was tested using unlabeled human insulin (INS). To evaluate the bioactivity of the released unlabeled insulin, PPy NPs were mixed with a solution of INS in 0.01 M HCl and kept inside a dialysis tube. A coiled platinum electrode (surface area ∼180 mm2) was used as a working electrode. Using a Pt counter electrode and Ag/AgCl reference electrode, placed outside the dialysis tube, immersed in PBS, −1 V was applied for 20 min. This experimental set up models our envisioned delivery scheme in which the drug-loaded PPy NPs may be confined within a semi-permeable membrane (or a hydrogel) that allows only drug molecules to pass through. This design can be used for both spatially and temporally controlled drug release in vivo.Insulin tolerance testing was used to compare the bioactivity of released insulin to control insulin. INS (Fig. S2†) was delivered by intraperitoneal injection to 8-week old Swiss Webster mice at two concentrations, 1.4 IU kg−1 and 2 IU kg−1. The glucose levels of the mice were serially monitored as a surrogate of insulin activity. The drop in plasma glucose was similar for both the released INS and the standard INS, although there seems to be a trend toward slightly reduced activity of the released insulin at the lower dose (1.4 U kg−1). It should be noted, however, that the difference between the percentage drop in blood glucose levels for the released and standard INS are statistically insignificant (α = 0.05) according to the two-sided student t-test. Hence, the bioactivity of INS is almost completely retained after being released from PPy NPs (Fig. 5).
Conclusions
We have shown that large molecules such as INS can be released from electrically conducting PPy NPs. The interaction between PPy NPs and INS can be modeled by a simple Langmuir-type adsorption isotherm. The INS loading is dependent on the ratio of the concentration of PPy NPs to the concentration of the INS added. The maximum drug loading that can be obtained is about ∼51 wt%, which is a significant improvement over previous methods of incorporating large molecules. At this drug loading, assuming that a typical dose21 of 0.5 IU per kg per day is necessary for treatment of an insulin sensitive diabetic weighing 70 kg, 100 mg INS–PPy is sufficient to provide the dosage required for about 6 weeks. We have also shown in murine models that the bioactivity of the released insulin is retained and can affect drop in blood glucose levels. While we have used insulin as a model, we believe PPy NPs can be used to deliver other polypeptides as well. Thus, drug delivery by electroresponsive polypyrrole nanoparticles appears to show promise in developing a wirelessly activated implantable drug delivery system.Acknowledgements
We are grateful to L. M. Joubert at the Cell Sciences Imaging Facility at Stanford University for help with SEM imaging and S. J. Madsen for help with TEM imaging. We also thank Z. Zhao for technical support with mice experiments. DS thanks the Winston Chen Stanford Graduate Fellowship and the Center for Molecular Analysis and Design at Stanford University for funding. We also acknowledge The Friedenrich BII Diabetes Fund, the SPARK Translational Research Program (NIH-NCATS-CTSA grant UL1TR001085) and the NIH NIDDK (R01DK101530) for funding.References
- S. Mitragotri, P. A. Burke and R. Langer, Nat. Rev. Drug Discovery, 2014, 13, 655–672 CrossRef CAS PubMed.
- E. Waltz, Nat. Biotechnol., 2014, 32, 117 CrossRef CAS.
- IMS Institute for Healthcare Informatics, The Global Use of Medicines: Outlook through 2017, 2013 Search PubMed.
- G. M. Pauletti, S. Gangwar, T. J. Siahaan, J. Aubé and R. T. Borchardt, Adv. Drug Delivery Rev., 1997, 27, 235–256 CrossRef.
- J. T. Santini, M. J. Cima and R. Langer, Nature, 1999, 397, 335–338 CrossRef CAS PubMed.
- A. C. Richards Grayson, I. S. Choi, B. M. Tyler, P. P. Wang, H. Brem, M. J. Cima and R. Langer, Nat. Mater., 2003, 2, 767–772 CrossRef PubMed.
- R. Farra, N. F. Sheppard, L. McCabe, R. M. Neer, J. M. Anderson, J. T. Santini, M. J. Cima and R. Langer, Sci. Transl. Med., 2012, 4, 122ra21 Search PubMed.
- S. Mura, J. Nicolas and P. Couvreur, Nat. Mater., 2013, 12, 991–1003 CrossRef CAS PubMed.
- M. A. C. Stuart, W. T. S. Huck, J. Genzer, M. Müller, C. Ober, M. Stamm, G. B. Sukhorukov, I. Szleifer, V. V. Tsukruk, M. Urban, F. Winnik, S. Zauscher, I. Luzinov and S. Minko, Nat. Mater., 2010, 9, 101–113 CrossRef PubMed.
- Y. Lu, W. Sun and Z. Gu, J. Controlled Release, 2014, 194, 1–19 CrossRef CAS PubMed.
- J. Charthad, S. Baltsavias, D. Samanta, T. C. Chang, M. J. Weber, N. Hosseini-Nassab, R. N. Zare and A. Arbabian, in 2016 38th Annual International Conference of the IEEE, 2016.
- Jt. Santini Jr., A. Richards, R. Scheidt, M. Cima and R. Langer, Angew. Chem., Int. Ed., 2000, 39, 2396–2407 CrossRef.
- B. Zinger and L. L. Miller, J. Am. Chem. Soc., 1984, 106, 6861–6863 CrossRef CAS.
- R. Wadhwa, C. F. Lagenaur and X. T. Cui, J. Controlled Release, 2006, 110, 531–541 CrossRef CAS PubMed.
- D. Svirskis, B. E. Wright, J. Travas-Sejdic, A. Rodgers and S. Garg, Electroanalysis, 2010, 22, 439–444 CrossRef CAS.
- B. C. Thompson, S. E. Moulton, J. Ding, R. Richardson, A. Cameron, S. O'Leary, G. G. Wallace and G. M. Clark, J. Controlled Release, 2006, 116, 285–294 CrossRef CAS PubMed.
- P. M. George, D. A. Lavan, J. A. Burdick, C. Y. Chen, E. Liang and R. Langer, Adv. Mater., 2006, 18, 577–581 CrossRef CAS.
- E. Shamaeli and N. Alizadeh, Colloids Surf., B, 2015, 126, 502–509 CrossRef CAS PubMed.
- F. Teodorescu, L. Rolland, V. Ramarao, A. Abderrahmani, D. Mandler, R. Boukherroub and S. Szunerits, Chem. Commun., 2015, 51, 14167–14170 RSC.
- D. Samanta, N. Hosseini-Nassab and R. N. Zare, Nanoscale, 2016, 8, 9310–9317 RSC.
- Insulin routines http://www.diabetes.org/living-with-diabetes/treatment-and-care/medication/insulin/insulin-routines.html?referrer=https://www.google.com/ (accessed Sep 25, 2016).
- M. Peyrot, A. H. Barnett, L. F. Meneghini and P. M. Schumm-Draeger, Diabetic Med., 2012, 29, 682–689 CrossRef CAS PubMed.
- D. Samanta, J. L. Meiser and R. N. Zare, Nanoscale, 2015, 7, 9497–9504 RSC.
- A. Ramanaviciene, A. Kausaite, S. Tautkus and A. Ramanavicius, J. Pharm. Pharmacol., 2007, 59, 311–315 CrossRef CAS PubMed.
- X. Wang, X. Gu, C. Yuan, S. Chen, P. Zhang, T. Zhang, J. Yao, F. Chen and G. Chen, J. Biomed. Mater. Res., Part A, 2004, 68, 411–422 CrossRef PubMed.
- J. Ge, E. Neofytou, T. J. Cahill, R. E. Beygui and R. N. Zare, ACS Nano, 2012, 6, 227–233 CrossRef CAS PubMed.
- P. R. Shorten, C. D. McMahon and T. K. Soboleva, Biophys. J., 2007, 93, 3001–3007 CrossRef CAS PubMed.
- L. Bromberg, J. Rashba-Step and T. Scott, Biophys. J., 2005, 89, 3424–3433 CrossRef CAS PubMed.
- I. Langmuir, J. Am. Chem. Soc., 1918, 40, 1361–1403 CrossRef CAS.
Footnotes |
| † Electronic supplementary information (ESI) available: Derivation of binding model for INS attachment to PPy NPs, absorbance of INS released for in vivo experiments. See DOI: 10.1039/c6nr08288b |
| ‡ These authors contributed equally. |
| This journal is © The Royal Society of Chemistry 2017 |

