 Open Access Article
First demonstration of surface enhanced-stimulated Raman spectroscopy (SE-SRS) using low-power CW sources
C. L. D.
Lee
and
K. C.
Hewitt
 *
*
Dalhousie University, Department of Physics and Atmospheric Sciences, 6310 Coburg Road, B3H 4R2, Halifax, NS, Canada. E-mail: Kevin.Hewitt@Dal.ca; Tel: +1-902-494-2315
First published on 2nd October 2017
Abstract
Using commercially available nanoparticles, continuous wave Surface-Enhanced Stimulated Raman spectroscopy (CW SE-SRS) is demonstrated for the first time using two Ti:Sapphire lasers producing a pump beam (785 nm, 100 mW) and appropriately varying probe/Stokes beams (860–870 nm, 120 mW). The Ti-Sapphire lasers are co-pumped by a 10 W low noise 532 nm Spectra Physics Millennia laser. Pulsed SE-SRS is also demonstrated using a Coherent Chameleon Ultra laser for the Stokes/probe (863–871 nm) beam and a Coherent Ultra II as the pump laser (785 nm). In both cases lock-in techniques are used to extract the small signal (1 in 109) successfully. These experiments convincingly demonstrate that SRS with CW sources is possible using appropriate nanoparticles, and this realization creates opportunities for a wider range of stimulated Raman spectroscopy applications.
Introduction
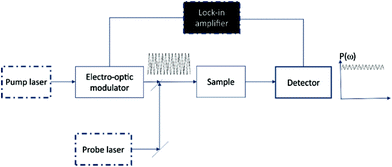
In stimulated Raman spectroscopy, two optical fields coherently drive a vibrational mode while one of these fields (SRS), or a third one (CARS), probes this coherent molecular vibration. The third-order non-linear susceptibility χ(3), which enables the process, has resonances at the vibrational frequencies. Therefore, by tuning the frequency differences between the lasers, one can probe the vibrational spectrum of a molecule. When the frequency difference matches a molecular vibration, the intensity of the pump field experiences a loss (Stimulated Raman Loss – SRL) while the probe field experiences a gain (Stimulated Raman Gain – SRG) because for each probe (Stokes) photon created by stimulated emission, a corresponding pump photon is annihilated. The gain and loss are usually many orders of magnitude less than the overall intensity (1 in 106 to 107) so lock-in techniques are required to extract the small signal. For co-linear pump and probe beams propagating through an isotropic Raman active sample (Fig. 1) the SRG/SRL is proportional to the third-order susceptibility, path length and incident beam intensity.1,2The coherent optical fields can benefit from plasmonic enhancement,3
| GSE-SRS = {|χ(3)ads|2/|χ(3)free|2}|A(ϑL)|4|A(ϑS)|4 |
To probe such non-linear effects one normally employs picosecond or femtosecond pulses to obtain the high peak powers (∼10 MW cm−2) needed to excite third-order processes. Typically, however, the intensity fluctuations in SERS would preclude its use in such an experiment because these fluctuations would swamp the small changes in the SRS intensity at resonance. However, we are able to overcome this difficulty because of the unique stability of the scattering from the Oxonica nanoparticles.
In this contribution we demonstrate SE-SRS using pulsed and (for the first time) CW lasers.
Experimental
In our pulsed laser SE-SRS experiment a Coherent Chameleon Ultra laser is used for the Stokes/probe (863–871 nm) beam and a Coherent Ultra II is used as the pump laser (785 nm). Both lasers have a pulse width of 140 fs at a repetition rate of 80 MHz. Each laser provides a stability of <0.5%, noise of <0.15% and a maximum average power of 150 mW at the sample. To modulate the Stokes laser line, a Hinds PEM 90 with an IFS50 fused silica head modulates the polarization at 50 kHz. We operate the PEM in the quarter-wave retardation mode. A Melles Griot 03PTH005 linear prism polarizer then passes only vertically polarized laser light, so that now the laser intensity is modulated at a frequency of 100 kHz.The laser is focused onto the sample using a long working distance 50× objective lens. The sample is located at the focus of a second 50× lens that collimates the transmitted probe and pump beams.
To filter the modulated probe beam, a Comar 785 nm interference filter with a 10 nm bandwidth is used, allowing only the pump beam to pass to the detector. Because we are detecting the pump beam, it is the wavelength dependence of the SRL in this channel that provides the necessary spectral information. To measure the light intensity, a Thorlabs SM1PDA1 Silicon photodiode is used in the photoconductive mode, for a rapid response at relatively high intensity. The responsivities of the photodiode at the wavelengths used are as follows: 0.646 A W−1 (870 nm), 0.655 A W−1 (880 nm), and 0.563 A W−1 (785 nm).
Since the stimulated emission signal is expected to be small compared to the noise, a lock-in amplifier is needed to demodulate the 100 kHz stimulated emission signal from the electronic and laser noise. In the pulsed laser experiment, a Model 186 Synchro-het Lock-in Amplifier is used for just that purpose. The 100 kHz reference square wave from the PEM is used for the reference in the lock-in.
For our CW laser SE-SRS experiments, a Stanford Research SR510 Lock-in amplifier has been procured, offering faster phase control as well as computer control. Two Spectra Physics 3900S Ti:Sapphire laser cavities are pumped by a Millennia Xs 532 nm (10 W) laser. The output of one of the Ti:Sapphire lasers is set to 785 nm, and the other is tunable over the appropriate range. Otherwise the optical components are identical to our pulsed SE-SRS experiment, with the exception of the placement of a 10 μm pinhole to align the pump (120 mW) and probe (100 mW) beams.
A Jobin-Yvon T64000 Raman system operating in the single grating mode was used for conventional Raman spectroscopy. 632.8 nm laser excitation from a He–Ne laser was focused through a 50× long working distance objective, with 5 mW at the sample.
Results and discussion
Pulsed SE-SRS
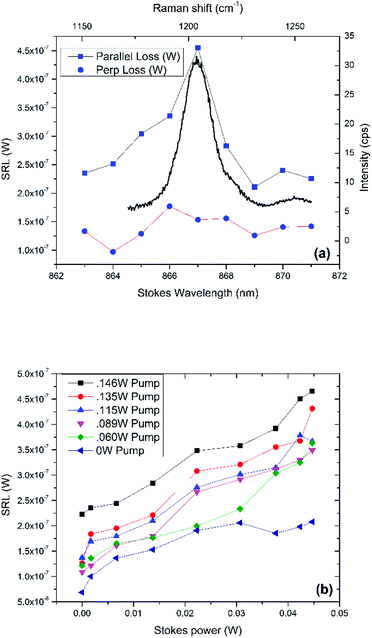
Consistent with most SRS spectra described in the literature, the signal generated from our experiment exhibits (Fig. 2) the same characteristics as the spontaneous Raman signal, without a dispersive response as seen by Frontiera et al.4 In particular, the 1205 cm−1 mode is the most prominent in the SERS spectra, and has been assigned by Zhuang et al.5 to the symmetric stretching of C–C and bending vibrations of pyridl C–N bonds. The SRL is proportional to the pump and Stokes power, as expected.Surface enhanced femtosecond SRS has been reported by the Northwestern group4 using Oxonica nanoparticles. We were able to achieve SE-SRS using power densities that are orders of magnitude smaller than Frontiera et al.4 – our pump beam peak power was 0.01 W cm−2versus 0.1 W cm−2 for theirs, while their probe beam was 10 W cm−2versus 0.004 W cm−2 for ours. Since it is assumed that only dimers contribute to the signal, and they comprise 10% of the sample, one can detect dimer-only concentrations as low as 6 pM. They estimated the time- and ensemble averaged enhancement factor as 104 to 106. We have measured (Fig. 2a) stimulated Raman loss of about 10−7 W in a pump beam with average power of 150 mW. That is, we were able to detect the loss of ∼1 in 108 pump photons using the lock-in techniques.
The SERS nanoparticles are replete with ring systems, similar in structure to benzene.
CW SE-SRS
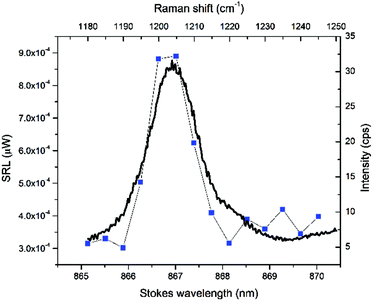
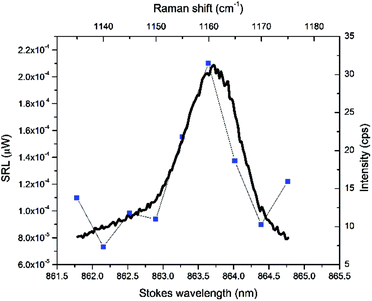
Owyoung6 showed that one can obtain SRS from benzene using low power CW sources in the late 70 s. Our pulsed SE-SRS results establish that surface enhancement generates stimulated Raman for a sample of low picomolar concentration using a pump and a probe beam with a power density of ∼0.001–0.01 MW cm−2, about three to four orders of magnitude lower than that required for conventional SRS. Given that conventional SRS uses samples with concentrations in the micromolar range, this adds another 3 orders of magnitude to the enhancement, leading to an overall enhancement factor of ∼106. Therefore, to achieve CW SE-SRS one expects that a 100 mW pump and probe laser must be focused to the tens of microns – about the size of a cell – to observe the effect.With that estimate in mind, we conducted CW SRS using a 120 mW pump and 100 mW probe focused through a 50× objective lens onto a sample which sits at the focus of a second 50× lens which collects the transmitted light. As shown in Fig. 3 and 4, CW SE-SRS was achieved for two flavours of the Oxonica nanoparticles (S-440 and S-470).
Conclusions
We successfully demonstrate CW and pulsed Surface Enhanced-Stimulated Raman Scattering (SE-SRS) using Oxonica (now Cabot Securities) nanoparticles for particle concentrations as low as 10 picomolar using peak power densities (0.01 MW cm−2) that are three-to-four orders of magnitude smaller than those required for conventional SRS. These reduced incident powers are possible because the laser field is significantly enhanced within the gold nanoparticle dimer crevices, where the molecular species of interest is attached. Diminishing the incident laser power requirements meant that CW lasers of low power (100 mW) focused to tens of microns in diameter could be used to generate SE-SRS, enabling the detection of nanoparticles at picomolar concentrations. Because of the concentration dependence of SRS, the technique should be applicable to larger volumes where species of higher concentrations are found (e.g. the nanomolar or micromolar concentrations of proteins in cells). It should be possible to track molecules attached to these nanoparticles with concentrations that are tens of picomolar or greater. The realization of CW SE-SRS (100 mW pump) creates opportunities for a wider range of stimulated Raman spectroscopy applications.Acknowledgements
We acknowledge the financial support of the Natural Sciences and Engineering Research Council (NSERC) of Canada, the office of the Dean of Science at Dalhousie University, and the Canada Foundation for Innovation (CFI). We also gratefully acknowledge the loan of one of the Ti:Sapphire lasers by Prof. Dr Airton Martin of the Universidade do Vale do Paraiba (Sao Jose dos Campos, SP – Brazil), Dr Sanjiv Gambhir for the Oxonica nanoparticles, and Dr Kimberly Hall for the Hinds PEM 90. We also thank Dr. R. Brownstone for use of his two pulsed femtosecond lasers linked to an optical microscope.References
- C. W. Freudiger, W. Min, B. G. Saar, S. Lu, G. R. Holtom, C. He, J. C. Tsai, J. X. Kang and X. S. Xie, Science, 2008, 322, 1857 CrossRef CAS PubMed; M. B. J. Roeffaers, X. Zhang, C. W. Freudiger, B. G. Saar, M. van Ruijven, G. van Dalen, C. Xiao and X. S. Xie, J. Biomed. Opt., 2011, 16, 021118 CrossRef PubMed.
- P. Nandakumar, A. Kovalev and A. Volkmer, New J. Phys., 2009, 11, 033026 CrossRef.
- K. Kneipp, H. Kneipp and J. Kneipp, Plasmonics for Enhanced Vibrational Signatures, in Plasmonics: Theory and Applications, Challenges and Advances in Computational Chemistry and Physics, ed. T. V. Shahbazyan and M. I. Stockman, Springer, Dordrecht, Germany, 2013, ch. 3, pp. 103–124 Search PubMed.
- R. R. Frontiera, A.-I. Henry, N. L. Gruenke and R. P. Van Duyne, J. Phys. Chem. Lett., 2011, 2, 1199 CrossRef CAS PubMed.
- Z. Zhuang, J. Cheng, H. Jia, J. Zeng, X. Han, B. Zhao, H. Zhang, G. Zhang and W. Zhao, Vib. Spectrosc., 2007, 43, 306 CrossRef CAS.
- A. Owyoung and E. D. Jones, Opt. Lett., 1977, 1, 152 CrossRef CAS PubMed.
| This journal is © The Royal Society of Chemistry 2017 |


