 Open Access Article
Creative Commons Attribution 3.0 Unported Licence
Modelling the morphology and thermomechanical behaviour of low-bandgap conjugated polymers and bulk heterojunction films†
Samuel E.
Root
a,
Nicholas E.
Jackson
b,
Suchol
Savagatrup
a,
Gaurav
Arya
*a and
Darren J.
Lipomi
 *a
*a
aDepartment of NanoEngineering, University of California, 9500 Gilman Drive, Mail Code 0448, San Diego, La Jolla, CA 92093-0448, USA. E-mail: dlipomi@ucsd.edu; garya@ucsd.edu
bInstitute for Molecular Engineering, University of Chicago, IL 60615, USA
First published on 19th December 2016
Abstract
This paper describes the use of molecular dynamics (MD) to predict the nanoscale morphology and thermomechanical behavior of three low-bandgap semiconducting polymers and their blends with PC71BM. While the three polymers modeled in this study—PTB7, PDTSTPD, and TQ1—all exhibit the donor–acceptor motif characteristic of high-performance donor materials in organic solar cells, they exemplify different morphologies in the solid state. Predictions from the atomistic simulations presented here include the average conjugation length of the polymers, the structural arrangement of conjugated donor and acceptor units in neat and bulk heterojunction (BHJ) films, as well as the glass transition temperature and tensile modulus of neat and BHJ polymer films. Calculated tangent correlation functions exhibit oscillatory decay. This finding suggests that DA polymers are more appropriately modeled as ribbon-like chains as opposed to worm-like chains. To account for the range of morphologies accessible by processing manipulations, both a melt-quenched and a self-aggregated morphology are prepared. Owing to the greater free volume of the self-aggregated morphology, these solid structures are found to be softer and weaker than the melt-quenched morphologies. The experimental modulus measured previously for PDTSTPD is similar to the predicted self-aggregated morphology, while the experimental modulus of PTB7 is similar to the predicted melt-quenched modulus. Our comparisons with experiment suggest that solution-processing plays a critical role in optimizing the mechanical properties of conjugated polymeric materials. Overall, the results of this study suggest the promise of MD simulations in determining the ways in which molecular structure influences the morphology and mechanical properties of bulk heterojunction films for solar cells and other organic electronic devices.
Broader contextSemiconducting polymers can form the active layers of organic solar cells that have achieved power conversion efficiencies of over ten percent. The highest efficiency materials generally contain electron-donating units alternating with electron accepting units along the molecular backbone (the “DA polymers”). When these polymers (and composites when mixed with fullerenes) are processed from solution, the morphology that forms upon evaporation of the solvent can be difficult to predict. The morphology, in turn, influences not only the efficiency with which charges are generated and separated, but also the lifetime and stability against fluctuations in temperature and mechanical insults (i.e., in portable applications and in the outdoor environment). This paper describes a computational method to predict the morphology and mechanical properties of DA polymers. It is based on fully atomistic molecular dynamics and can predict the glass transition temperature (i.e., the transition from brittle, glassy behavior to deformable, rubber-like behavior), the tensile modulus, and the statistical distribution of molecular conformation in the solid state. The study highlights the important role of the morphology—as opposed to the molecular structure—in determining the thermal and mechanical properties of DA polymers and their blends with fullerenes in solar cells. |
Introduction
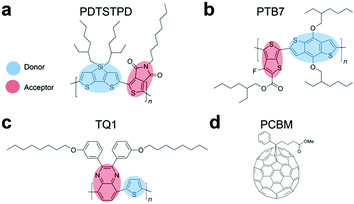
Mechanical deformability underpins many of the advantages of organic semiconductors.1 For example, use of low-cost, ultrathin substrates, fabrication of devices by roll-to-roll printing, stability of devices in portable applications, and biological integration require the active materials to accommodate levels of mechanical strain that are sometimes moderate (e.g., roll-to-roll printing) but often extreme (e.g., biological integration). The mechanical properties of an organic semiconductor depend not only on its molecular structure, but also on how the molecules pack in the solid state.2 This morphology, however, is difficult to predict by simple inspection of the molecular structure.3 This paper describes the use of molecular dynamics (MD) to understand the nanoscale structural features and mechanical properties of low-bandgap polymers that exhibit the donor–acceptor (DA) motif.4,5It has recently been demonstrated experimentally that many of the highest-performing organic semiconductors lack the mechanical stability required for flexible, stretchable, and mechanically robust applications.3 For example, all three of the high-performance polymers shown in Fig. 1a–c have been measured to crack at ≤3% strain using film-on-elastomer techniques.3,6 Furthermore, the addition of electron-accepting fullerene derivatives, such as PC71BM (Fig. 1d) to form an organic bulk heterojunction (BHJ) solar cell, has been shown experimentally7 and computationally8 to result in a significant increase in stiffness and brittleness of the composite film.
The science of organic materials has benefitted from the ability to modify molecular structure and measure the effects of these changes on function.9 This approach has helped to understand charge-transport in organic semiconductors,10 and recently to understand their mechanical behaviour.7,11 Experimental correlations between molecular structure, mechanical, and optoelectronic properties of π-conjugated materials—even large libraries containing over 50 compounds7—have yielded insightful structure–property relationships. However, an understanding of how molecular structure of π-conjugated materials influences formation of films and dissipation of mechanical energy is far from complete. Computational resources and techniques have progressed to a level where it is now feasible to apply them to developing detailed structure–property relationships of polymers whose repeat units contain as many as 100 atoms, e.g., the DA polymers.
MD simulations are a useful tool for understanding both the conformational behaviour and the thermomechanical properties of organic molecular materials. The level of detail accessible by simulation is difficult or impossible to attain experimentally. Modelling of conjugated polymers entails a unique challenge for standard classical force fields. This difficulty arises in part because of the strong geometrical constraints imposed by π-conjugation along the backbone. Specifically, generic force fields are not directly transferrable to these heterocyclic systems, and thus fail to accurately predict the interactions that arise from torsional rotations between rings, as well as atomic partial charges. This shortcoming requires each polymer under study to be parameterized independently from electronic structure calculations.12 Density functional and wave-function based methods for building atomistic models for conjugated polymers have been established and applied to a variety of materials, such as the poly(3-alkylthiophene)s (P3ATs),13,14 and recently to a library of low-bandgap polymers.15 While these atomistic models14—and detailed coarse-grained models derived from them16—have been used to investigate the mechanical properties of P3ATs,8,17 they have not been applied to the more structurally complex low-bandgap polymers. Although P3HT is typically used as a model system, many results obtained from such case studies cannot be directly generalized to the structurally complex low-bandgap polymers.18
In this work, we studied the morphologies and mechanical properties of three low-bandgap polymers and their blends with PC71BM. The goal was to identify the structural determinants and molecular mechanisms for the accommodation of mechanical energy. Our choice of polymers (Fig. 1a–c) was influenced by two requirements: (1) accurate atomistic models exist for these materials15 and (2) the mechanical properties have been measured experimentally.3 Moreover, each of these three polymers occupy specific points on the range of mesoscale ordering available to this class of materials, from the structurally disordered TQ1 polymer19,20 to the locally ordered PTB721,22 and the semi crystalline PDTSTPD.23,24 Our efforts were guided by three questions:
(1) Effect of molecular structure. How do molecular attributes such as the configuration of the side chain (i.e. branched vs. linear) and the connectivity of the conjugated backbone (i.e. fused vs. isolated rings vs. off-axis conjugated units) dictate the solid-state packing and mechanical behaviour of these materials?
(2) Effect of morphology. How do processing conditions affect the mechanical properties of these materials—specifically the ways in which solution-casting generates non-equilibrium kinetically trapped morphologies—and how can these conditions be used to increase the robustness of devices?
(3) Agreement with experiment. More generally, do the results of MD simulations match those of experiments? Can MD simulations be used to complement experimental research aimed at understanding and optimizing the morphology and thermomechanical properties of organic semiconductors?
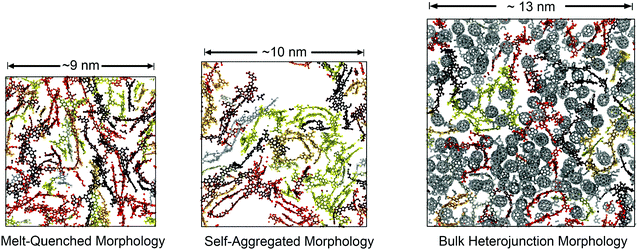
To begin deconvoluting the effects of molecular structure on solid-state packing and bulk mechanical properties, we simulated the melt-phase equilibrium structure of each polymer, as well as their composites with PC71BM. We employed a coarse-grained analysis to compare the equilibrium statistics of key intramolecular degrees of freedom, single-chain conformations, and multi-chain packing preferences. These melt-phase features provided an approximate representation of the thermodynamic forces driving the solidification of films cast from solution. Although it was impractical to simulate the process of solvent evaporation in atomistic detail, we included effects of this process using two disparate simulation protocols which generated two different types of glassy structures. These two protocols approximately simulated the effects of casting films from solvents of different quality and evaporation rates. We simulated the mechanical behaviour of the resulting glassy structures by imposing a uniaxial tensile deformation and computing a stress–strain curve. Our results indicated that differences in processing, composition, and solution-phase behaviour play a significant role in determining the mechanical properties of these materials. These properties may in fact be influenced more strongly by differences between the ways in which the films are formed than by differences in molecular structure. That is, the extent to which the molecular structure dictates the mechanical properties of these materials is limited by the extent to which it influences its structure in solution, and thus in the solid state.
Simulation design
We simulated a set of systems containing 60 monodisperse oligomers with 12 repeat units each. Experimental studies on the mechanical properties of these specific polymers used molecular weights on this order of magnitude (∼10 kDa) and thus direct comparisons could be made.3 Moreover, this chain length marks the onset of self-folding and the formation of photophysical aggregates observable in solution-phase UV-Vis absorption and fluorescence spectra.25 Furthermore, this degree of polymerization has also proven sufficient for predicting the condensed phase behaviour and mechanical properties of P3HT (while allowing for computationally accessible simulations) and has served as the basis for detailed coarse-grained models capable of describing experimentally relevant chain dimensions and polydispersity.16,17 Finally, DA polymers can be difficult to synthesize at a high molecular weight and thus the properties of oligomers are also relevant.26
These morphologies represent opposing ends of a continuum of possible structures available to these chains in the condensed phase. In one method, we used a conventional MD approach for simulating polymer glasses: quenching from the equilibrated melt phase. This approach allowed for the characterization of equilibrium structure in the melt and estimation of the glass transition temperature. We termed the structures prepared in this way “melt-quenched” morphologies. In the other method, we performed simulated annealing on implicitly solvated individual chains to form self-aggregated structures and then packed them together at room temperature to mimic solution casting rapidly from a poor, low boiling point solvent (see Fig. S1, in the ESI,† for a visual comparison of the two protocols). The use of this procedure was influenced by experimental spectroscopic evidence suggesting these materials tend to form aggregated structures in solution.25 We expected that these pre-aggregated chains would be kinetically trapped in the solid state. Pre-aggregation would lead to a lower density of entanglements (and this might be the cause of experimentally observed brittleness in these materials). We termed the structures prepared in this way the “self-aggregated” morphologies. For PTB7 in particular, the structural effects of solution processing have been characterized rigorously by Al-Hussein et al. Their X-ray experiments have determined that spray-coated PTB7 films are kinetically-trapped in a morphology that is significantly more disordered than spin-coated films.30
The morphology of low-bandgap polymers is also known to depend strongly upon interactions with the surface to which they are deposited.31 For PTB7 in particular, the structure has been quantified rigorously by Hammond et al., who employed an array of sophisticated experimental techniques and models to determine the nanoscale morphology of homopolymer and bulk heterojunction films. These researchers determined that PTB7 has a moderate preference for π-stacking in the vertical direction (“face-on”), however, the coherence length for these orientational correlations was determined to be quite small (ca. 1.7 nm).32 This experimental result (and computational constraints) lend credence to our decision to not include a substrate in our simulations and instead use a domain that is periodic in all three dimensions to mimic the mid-section of the thin film.
![[thin space (1/6-em)]](https://www.rsc.org/images/entities/char_2009.gif) 000 atoms. We used custom force fields based on the all-atomistic optimized potential for liquid simulation33 (OPLS-AA). Such models give excellent agreement with experimental values for density, heat capacities, and compressibility of organic liquids. Moreover, these force fields have previously been used to simulate the mechanical behaviour of P3HT and P3HT:PC61BM blends.17,34 A detailed description of the process used to build these models using quantum mechanical methods is given elsewhere.15 All simulations and visualizations were performed with LAMMPS35 and OVITO36 respectively.
000 atoms. We used custom force fields based on the all-atomistic optimized potential for liquid simulation33 (OPLS-AA). Such models give excellent agreement with experimental values for density, heat capacities, and compressibility of organic liquids. Moreover, these force fields have previously been used to simulate the mechanical behaviour of P3HT and P3HT:PC61BM blends.17,34 A detailed description of the process used to build these models using quantum mechanical methods is given elsewhere.15 All simulations and visualizations were performed with LAMMPS35 and OVITO36 respectively.
Results and discussion
Intramolecular melt-phase structure
To analyse the equilibrium dihedral preferences, we defined an orthonormal basis set for each conjugated DA unit such as the one shown in Fig. 2a for PTB7. These geometrical definitions enabled the calculation of probability distributions for dihedral angles between adjacent conjugated rings shown in Fig. 2b–d. Due to the asymmetry of the acceptor unit of PTB7, we split the dihedral angle into two distinct distributions (the one labeled DA is shown in Fig. 2a). Comparing across the three materials we observed several notable features. We found that TQ1 had the highest fraction of syn conformations, while PDTSTPD and PTB7 had approximately equal preferences for syn and anti conformations. The preference of TQ1 for syn conformations is likely due to the small size and rotational flexibility of the donor unit, which contains no side chain.
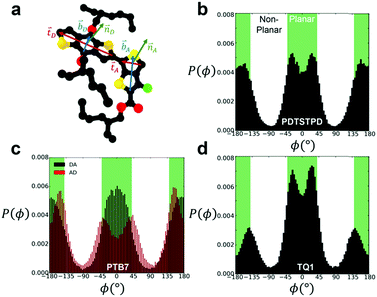 | ||
| Fig. 2 Inter-ring dihedral distributions. (a) Diagram showing definitions of basis sets defining ring orientations for PTB7 monomer. Dihedral distributions, P(ϕ), obtained from simulations at 600 K and 1 atm for (b) PDTSTPD (c) PTB7 (d) TQ1. The syn conformations shown in Fig. 1 represent the planar arrangement that results from ϕ = 0°. | ||
By defining planar conformations as the regions within the green domains on Fig. 2b and c (±40° from true planarity for optimal delocalization of π electrons, see the next paragraph) we found that PDTSTPD had the highest fraction of planar conformations (and thus the greatest energy barrier for rotation) followed by PTB7 and TQ1 (see Table S1 (ESI†) for a quantitative analysis of the distributions). We ascribe the planarity of PDTSTPD to the arrangement of the side chains on the donor unit (in addition to the intrinsic dihedral potential). Since the side chains are attached orthogonally to the conjugated unit, steric forces inhibit rotations from planar conformations.
![[t with combining circumflex]](https://www.rsc.org/images/entities/b_i_char_0074_0302.gif) i·
i·![[t with combining circumflex]](https://www.rsc.org/images/entities/b_i_char_0074_0302.gif) i+j〉. Here,
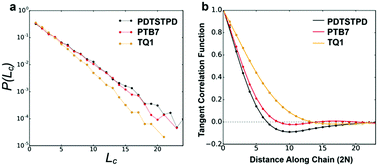
i+j〉. Here, ![[t with combining circumflex]](https://www.rsc.org/images/entities/b_i_char_0074_0302.gif) i represents the unit tangent vector of the ith conjugated unit along the backbone, and the brackets denote an average over all separations j, polymer chains, and time. The computed tangent correlations, shown in Fig. 3b, exhibited an oscillatory decay, implying the existence of a helical structure. Such helical structure has previously been observing in quantum mechanical simulations of TQ1 oligomers, however, tangent correlation functions were not computed.39 This behaviour likely results from the ribbon-like shape of the backbone, which contains planar units of finite width. The tangent correlations of ribbon-like objects have been described previously using the following functional form:
i represents the unit tangent vector of the ith conjugated unit along the backbone, and the brackets denote an average over all separations j, polymer chains, and time. The computed tangent correlations, shown in Fig. 3b, exhibited an oscillatory decay, implying the existence of a helical structure. Such helical structure has previously been observing in quantum mechanical simulations of TQ1 oligomers, however, tangent correlation functions were not computed.39 This behaviour likely results from the ribbon-like shape of the backbone, which contains planar units of finite width. The tangent correlations of ribbon-like objects have been described previously using the following functional form:  .40 Here, l is the length of the monomer unit taken as the average value of the donor and acceptor units. Lp is the persistence length, and λ represents the wavelength of helical structure.
We found that exact fits to the simulation data required a series expansion of the analytical expression, implying multiple modes of periodicity and tangent decay in these complex polymer chains. A detailed description of the fitting procedure, parameters obtained, and their significance is given in Section S2.2 of the ESI.† Numerical values obtained from the first-order fit are shown in Table 1. The dimensionless quantity,  , describes the helical nature of the chain; in the limiting case of Lp ≪ λ, the worm-like chain model is valid. In all cases, we found that
  , suggesting that a worm-like chain is not the best model for interpreting experimental data obtained from neutron or light scattering experiments aimed at probing the conformational structure of low band-gap polymers.41 For both PTB7 and TQ1 we found that
  , while for PDTSTPD
  . This analysis suggests the PDTSTPD is the most ribbon-like of the three polymers, which agrees with the experimentally observed order in PDTSTPD when compared to PTB7 and TQ1.
An important question that arises is whether the helical structures have a handedness. To determine this, we generated Ramachandran plots42 which show the correlations between successive dihedral angles (see Fig. S5, ESI†). We found them to be symmetric in all cases, implying that there is no overall handedness to the helical structures. We expect the existence of a helical structure to have important mechanistic implications for charge-transport43 and the entropic elasticity44 in this class of materials.
Intermolecular melt-phase structure
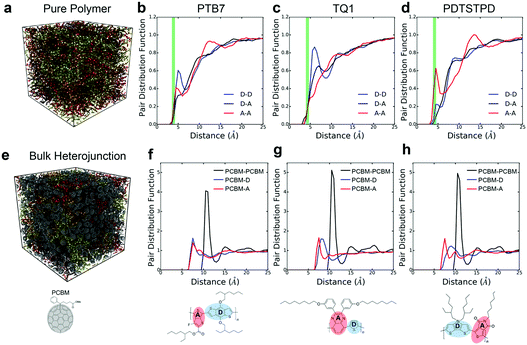 | ||
| Fig. 4 Morphological characterization of pure polymers and BHJs. (a) Snapshot of condensed phase morphology of pure PTB7. Molecules are coloured by indexed values. (b–d) Pair-distribution functions showing intermolecular donor–acceptor stacking preferences in the melt (green lines indicate experimental π–π stacking distances24,47,48). (e) Snapshot of condensed phase morphology of PTB7 BHJ. Polymer molecules are coloured by indexed values. (f–h) Pair-distribution functions showing intermolecular coupling between PCBM and donor/acceptor units. Note: the pair distributions are computed using the centres of masses of the conjugated units, indicated by the shading in the figures (i.e. the centre of mass of the fullerene cage for PCBM). | ||
Focusing on the results for PTB7, we found that although the benzodithiophene (donor) unit has two branched ethylhexyloxy side chains, it has a stronger π-stacking preference than the fluorinated thienothiophene (acceptor) unit that contains a single branched side-chain. This packing feature could be the result of the enhanced flexibility of the side-chains that arises from the higher flexibility of the ether linkage on the benzodithiophene as compared to the ester linkage on the fluorinated thienothiophene. Additionally, the symmetric shape of the benzodithiophene unit allows its side chains to align in the same plane, increasing their overall attraction due to favourable vdW interactions.46 Another distinctive feature in the plots is a broad peak in the A–A interaction at ≈14 Å which seems to indicate a tendency for interdigitation of side chains as evidenced geometrically in the Fig. S6 (ESI†).
The importance of molecular topology on these interactions is further exemplified by the pair distribution functions obtained for TQ1 in Fig. 4c. We observed that the bulky off-axis units on the benzopyrazine (acceptor) unit serve to inhibit efficient π-stacking in comparison to the thiophene (donor) unit, which has no side chain. The direction that the side chain emanates from the conjugated ring also plays an important role in how the polymers pack. This effect can be seen in the plots for PDTSTPD in Fig. 4d where the D–D peak is one third as prominent as the A–A peak due to the two branched side chains extending orthogonally outward from the dithienosilole (donor) unit. We also note that similar to PTB7, a broad peak at ≈12 Å can be seen for the A–A interactions, which is not surprising given the geometric similarity of the acceptor units of PTB7 and PDTSTPD.
For all three polymers, we plotted a vertical green line showing the experimentally determined π-stacking distances. The π-stacking distance of the three polymers have been reported as 4.2 Å,24 3.8–4.0 Å,32,47 and 4.3 Å48 for PDTSTPD, PTB7 and TQ1 respectively. Comparing between simulation and experiment, it can be seen that the experimental stacking distance is slightly smaller than the simulated peak. We attributed this difference to two possible effects. The first is that these curves are obtained from melt-phase simulations at 600 K whereas the experimental results are obtained at room temperature. The second is that the inadequacy of treating the conjugated carbon atoms with a standard Lennard-Jones potential due to extended π-conjugation. Computational studies suggest that a buffered 14-7 potential might provide a more accurate description of excluded volume interactions of these atoms at small interatomic separations.12
For TQ1, shown in Fig. 4g, it can be seen that there is a clear preference (sharper peak) for PCBM-A as opposed to PCBM-D stacking. This preference could be the result of the additional van der Waals forces arising from the off-axis conjugated units forming π-stacks with the fullerene cage. For PDTSTPD, shown in Fig. 4h, we observed that the primary PCBM-A peak was sharper and higher amplitude than the corresponding PCBM-D peak. In addition to this peak, there was a clear secondary peak indicating a preference for bilayer stacking of this moiety with the fullerene cage. Finally, for PTB7, shown in Fig. 4f, we observed that the primary peaks were similar in amplitude, distance, and width. The only observable difference was the secondary peak in the PCBM-A curve indicating the presence of bilayer stacks. Overall, the results of our simulations supported the claim that branched side chains inhibit efficient packing with the fullerene unit.
Thermal properties
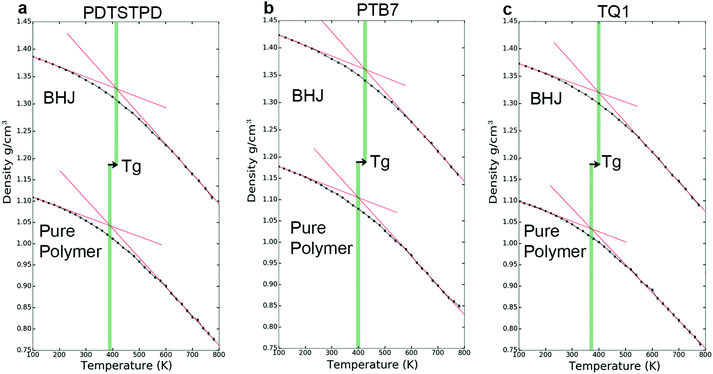
The kinetics of molecular organization during the annealing and solidification of polymer films is important for determining both the solid-state structure and thermal stability of solid films comprising DA polymers. The glass transition temperature (Tg), which marks the onset of thermally activated relaxation processes of the main chain, is thus a critical processing parameter for printing and coating techniques.51 To estimate Tg, we performed thermal quenching simulations while monitoring the density to obtain the thermal curves shown in Fig. 5a–c. The glass-transition region was determined by the narrow range in temperature in which the thermal expansion coefficient underwent a change, and Tg was thus estimated as the intersection of linear fits to the glassy and melt regions. Glassy configurations obtained from these quenching simulations were subsequently used in uniaxial tensile loading simulations where they are denoted as the melt-quenched morphology.Solution-phase conformations
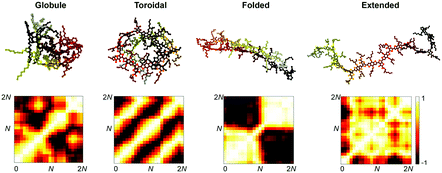
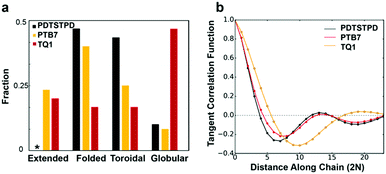
Strong inter- and intramolecular forces that arise from extensive π-conjugation make low bandgap polymers especially difficult to solubilize. These materials exhibit a wide range of solution-phase conformational behaviour that have a profound effect on the morphology of films cast from solution. To take the effects of solvation into account without explicitly simulating the evaporation process, we performed simulated annealing on implicitly solvated individual chains using Langevin dynamics, following an approach originally described by Jackson et al.15 This protocol was used to generate minimum energy self-folded chains that have been demonstrated to be present in DA polymer solutions on the basis of spectroscopic evidence.25The annealed structures can be classified according to the four general polymer conformations: globular, toroidal, folded, and extended (Fig. 6). For each polymer, we performed 60 independent annealing simulations and then classified the resulting structures according to a Q-tensor analysis, based on the Landau–de Gennes order parameter.55 The Q-tensor is a generalized order parameter whose maximum eigenvalue describes the amount of order present in the polymer backbone. A more detailed description of this analysis is given in Section S2.4 of the ESI.† A useful visualization of order in these systems can be obtained by computing an orientational contact map, Mij = ![[t with combining circumflex]](https://www.rsc.org/images/entities/b_i_char_0074_0302.gif) i·
i·![[t with combining circumflex]](https://www.rsc.org/images/entities/b_i_char_0074_0302.gif) j, shown in Fig. 6. The results of our classification scheme for each polymer are shown in Fig. 7a.
j, shown in Fig. 6. The results of our classification scheme for each polymer are shown in Fig. 7a.
We found that the conformational preferences had strong agreement with the experimentally determined ordering in these materials. TQ1, which is known to be one of the most structurally disordered low-bandgap polymers, had the strongest tendency to form globular, disordered conformations. PDTSTPD, which exhibits a distinct lamellar stacking peak in X-ray diffraction experiments, had the strongest tendency to form ordered, folded conformations. PTB7, which has significant short-range order but limited long-range order, had the broadest distribution of conformational classes. Interestingly, we found that the annealing simulations of PDTSTPD resulted in no conformations in an extended state. This behaviour exemplifies the strong thermodynamic driving force for folding of this polymer in solution. We performed the same analysis on the melt-quenched morphology obtained for each of the three polymers and found all the chains to be in an extended conformation according to this classification scheme. This finding was consistent with the absence of an enthalpic driving force for chain folding in the melt. Similar simulations have been performed for P3HT, using an implicitly solvated coarse-grained model.56 It was found that P3HT has a strong preference for adopting toroidal and folded conformations, however, the structures were not characterized using the same order parameter analysis, so a direct comparison cannot be made.
The increased propensity for chain folding in solution also results in a change in the tangent correlation functions when compared to the melt phase. As shown in Fig. 7b, we found that the tangent correlation functions of the isolated polymer chains (Fig. 3b) all exhibited a more pronounced oscillatory shape than chains in the melt phase, but could still be fit to an analytical expression, as described in Section S2.2 of the ESI.† The tangent correlation function is intrinsically related to the conformational preferences of the chain. The folded and toroidal structure result in more oscillatory correlations while the extended and globular conformations result in more of a worm-like structure. The toroidal structure is the only one that is truly a helix; its pitch is approximately equal to the π-stacking distance of the conjugated units.
Solid morphologies
![[thin space (1/6-em)]](https://www.rsc.org/images/entities/char_2009.gif) :
:![[thin space (1/6-em)]](https://www.rsc.org/images/entities/char_2009.gif) 1.5 polymer to PCBM was used, this is a typical composition used in devices.
1.5 polymer to PCBM was used, this is a typical composition used in devices.
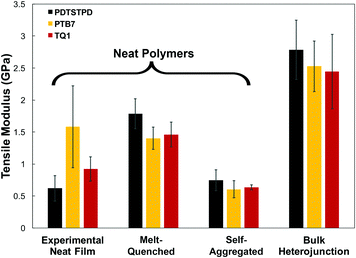
A comparison of the results from the pure polymer simulations to the experiment reveals an interesting finding. As shown in Fig. 11, we observed that the experimental value for the tensile modulus agrees well with the melt-quenched morphology for PTB7, the self-aggregated morphology for PDTSTPD, and is intermediate between the two morphologies for TQ1. Given that PDTSTPD had the strongest tendency to form folded aggregates, it makes sense that the self-aggregated morphology is a more accurate representation of PDTSTPD films cast from solution than is the melt-quenched morphology. The way in which this line of reasoning can be applied to TQ1 and PTB7 is less clear, most likely due to explicit solvation effects that were not taken into account. Nonetheless, the fact that the experimental values for tensile moduli of the three materials span the range bound by the calculated self-aggregated and melt-quenched morphologies suggest a strong role for the different solubility properties of the molecules, and that explicit atomistic simulations of solution-phase structure will be necessary in future work.
In general, these results suggest that differences in the morphology—as opposed to molecular structure—produced the wide range of tensile moduli measured in a library of low-bandgap polymers.3 This conclusion indicates that solution-processing represents a viable route for optimizing the mechanical robustness of these materials. One specific testable prediction is that films cast at high temperature may have improved mechanical stability compared to those cast at room temperature due to an increased extension of polymer chains and corresponding density of entanglements.
It is important to note that we did not observe cracking in any of the tensile loading simulations. This finding, coupled with the fact that all three of these materials exhibited brittle fracture at ≤3% strain experimentally3 led us to conclusion that the dominant fracture mechanism in these materials is likely through chain scission and the presence of macroscopic defects that localize stress, neither of which are present in these simulations. Although the experimental crack-on-set strain was small for all three of these materials, there still were minor differences. Of the three materials TQ1 was able to withstand the most strain (2.7%), followed by PTB7 (2.3%) and finally PDTSTPD (1.2%).3 These values correlate well with the glass transition temperature predicted and measured for these materials giving further evidence that the brittle fracture observed experimentally is the result of bond scission. Since the models employed in these simulations rely on a harmonic bond approximation, they are unsuitable for predicting such fracture behaviour. In future mechanical deformation simulations, bond potentials that allow for cleavage will be parameterized for this class of materials. It would also be instructive to perform similar simulations on materials that are known experimentally to exhibit ductile modes of fracture.3 Such an approach would allow for computational identification of the molecular-scale attributes that enable stress relaxation mechanisms other than bond scission.
Conclusions
In this paper we have demonstrated the utility of MD simulations to elucidate the structural and mechanical behaviour of low-bandgap polymers and composites. A summary of important material parameter predictions is given in Table 1. Through comparison to experimental results for π-stacking distances, glass transition temperatures, and tensile moduli, we have identified the strengths and limitations of this approach and provided suggestions for further refinement of custom models parameterized from electronic structure calculations (e.g., the use of a buffered 14-7 Lennard-Jones potential, and the allowance for bond scission). Through the computation of various distribution functions, we have provided insights that could be of use to synthetic chemists designing new materials. Furthermore, our simulations have revealed several new findings previously unconsidered in the literature that warrant further investigation.We found that the rigid, planar, fused rings along the backbone give rise to the formation of helical structures in the melt-phase that are characteristic of ribbon-like chains. This finding suggests that the classic worm-like chain model might not be appropriate for the interpretation of scattering experiments investigating the conformational behaviour of these polymers. Consideration of DA polymers as ribbon-like chains should also have important implications for the statistical mechanical basis of entropic elasticity44 and charge transport properties43 of these chains.
We found that the extent to which the molecular structure dictates the mechanical behaviour of these materials is limited by the extent to which it contributes to the solution-phase behavior and resulting thin-film morphology. These results have led us to the hypothesis that spin-coating from heated solutions of optimized solvent quality should result in more entangled, mechanically robust films. This hypothesis will be the subject of future experimental and computational investigations.
To simulate the solvent evaporation process of a printing or coating procedure accurately would require detailed coarse-grained models such as those that exist for P3HT16,70 and other complex polymers.71 In principle, the statistics gathered from our melt-phase simulations contain most of the necessary information to build stylistically similar models for these polymers. Additional information, however, must be gathered from explicitly solvated atomistic simulations to compute concentration dependent free energies of interactions capable of accurately modelling the solidification process. This is the subject of ongoing work and will allow for the simulation of an experimentally relevant morphology of a solution-cast thin film containing realistic molecular weight distributions and interfacial effects.
Acknowledgements
This work was supported by the Air Force Office of Scientific Research (AFOSR) Grant Number FA9550-16-1-0220. Additional support was provided by the Hellman Fellowship awarded to D. J. L. and the ARCS Fellowship awarded to S. E. R. Computational resources to support this work were provided by the Extreme Science and Engineering Discovery Environment (XSEDE) Program through the National Science Foundation grant number ACI-1053575.72 Additionally, N. E. J. and S. E. R. would like to thank Professor Mark Ratner for facilitating this collaboration.References
- A. Facchetti, Chem. Mater., 2011, 23, 733–758 CrossRef CAS.
- A. D. Printz and D. J. Lipomi, Appl. Phys. Rev., 2016, 3, 021302 Search PubMed.
- B. Roth, S. Savagatrup, N. De Los Santos, O. Hagemann, J. E. Carle, M. Helgesen, F. Livi, E. Bundgaard, R. R. Søndergaard, F. C. Krebs and D. J. Lipomi, Chem. Mater., 2016, 7, 2363–2373 CrossRef.
- M. C. Scharber, D. Muehlbacher, M. Koppe, P. Denk, C. Waldauf, A. J. Heeger and C. J. Brabec, Adv. Mater., 2006, 18, 789–794 CrossRef CAS.
- K. Müllen and W. Pisula, J. Am. Chem. Soc., 2015, 137, 9503–9505 CrossRef PubMed.
- S. Savagatrup, A. D. Printz, T. F. O’Connor, A. V. Zaretski, D. Rodriquez, E. J. Sawyer, K. M. Rajan, R. I. Acosta, S. E. Root and D. J. Lipomi, Energy Environ. Sci., 2015, 8, 55–80 CAS.
- S. Savagatrup, A. S. Makaram, D. J. Burke and D. J. Lipomi, Adv. Funct. Mater., 2014, 24, 1169–1181 CrossRef CAS.
- S. E. Root, S. Savagatrup, C. J. Pais, G. Arya and D. J. Lipomi, Macromolecules, 2016, 49, 2886–2894 CrossRef CAS.
- G. M. Whitesides, Isr. J. Chem., 2016, 56, 66–82 CrossRef CAS.
- J. L. Brédas, D. Beljonne, V. Coropceanu and J. Cornil, Chem. Rev., 2004, 104, 4971–5003 CrossRef PubMed.
- A. D. Printz, S. Savagatrup, D. J. Burke, T. N. Purdy and D. J. Lipomi, RSC Adv., 2014, 4, 13635–13643 RSC.
- K. H. Dubay, M. L. Hall, T. F. Hughes, C. Wu, D. R. Reichman and R. a. Friesner, J. Chem. Theory Comput., 2012, 8, 4556–4569 CrossRef CAS PubMed.
- V. Marcon and G. Raos, J. Am. Chem. Soc., 2006, 128, 1408–1409 CrossRef CAS PubMed.
- V. Marcon and G. Raos, J. Phys. Chem. B, 2004, 108, 18053–18064 CrossRef CAS.
- N. E. Jackson, K. L. Kohlstedt, B. M. Savoie, M. Olvera de la Cruz, G. C. Schatz, L. X. Chen and M. a. Ratner, J. Am. Chem. Soc., 2015, 137, 6254–6262 CrossRef CAS PubMed.
- D. M. Huang, R. Faller, K. Do and A. J. Moul, J. Chem. Theory Comput., 2010, 6, 526–537 CrossRef CAS PubMed.
- N. R. Tummala, C. Risko, C. Bruner, R. H. Dauskardt and J.-L. Brédas, J. Polym. Sci., Part B: Polym. Phys., 2015, 1–9 Search PubMed.
- A. T. Kleinschmidt, S. E. Root and D. J. Lipomi, J. Mater. Chem. A, 2016 10.1039/C6TA08317J.
- R. Kroon, R. Gehlhaar, T. T. Steckler, P. Henriksson, C. Müller, J. Bergqvist, A. Hadipour, P. Heremans and M. R. Andersson, Sol. Energy Mater. Sol. Cells, 2012, 105, 280–286 CrossRef CAS.
- E. Wang, L. Hou, Z. Wang, S. Hellström, F. Zhang, O. Inganäs and M. R. Andersson, Adv. Mater., 2010, 22, 5240–5244 CrossRef CAS PubMed.
- Y. Liang, Z. Xu, J. Xia, S. T. Tsai, Y. Wu, G. Li, C. Ray and L. Yu, Adv. Mater., 2010, 22, 135–138 CrossRef PubMed.
- L. Lu and L. Yu, Adv. Mater., 2014, 26, 4413–4430 CrossRef CAS PubMed.
- T.-Y. Chu, J. Lu, S. Beaupre, Y. Zhang, J.-R. Pouliot, S. Wakim, J. Zhou, M. Leclerc, Z. Li, J. Ding and Y. Tao, J. Am. Chem. Soc., 2011, 133, 4250–4253 CrossRef CAS PubMed.
- T. Y. Chu, J. Lu, S. Beaupré, Y. Zhang, J. R. Pouliot, J. Zhou, A. Najari, M. Leclerc and Y. Tao, Adv. Funct. Mater., 2012, 22, 2345–2351 CrossRef CAS.
- T. J. Fauvell, T. Zheng, N. E. Jackson, M. A. Ratner, L. Yu and L. X. Chen, Chem. Mater., 2016, 8, 2814–2822 CrossRef.
- F. Brouwer, J. Alma, H. Valkenier, T. P. Voortman, J. Hillebrand, R. C. Chiechi and J. C. Hummelen, J. Mater. Chem., 2011, 21, 1582 RSC.
- Y. Diao, L. Shaw, Z. Bao and S. C. B. Mannsfeld, Energy Environ. Sci., 2014, 7, 2145–2159 CAS.
- S. Guo, E. M. Herzig, A. Naumann, G. Tainter, J. Perlich and P. Müller-Buschbaum, J. Phys. Chem. B, 2014, 118, 344–350 CrossRef CAS PubMed.
- L. Ye, Y. Jing, X. Guo, H. Sun, S. Zhang, M. Zhang, L. Huo and J. Hou, J. Phys. Chem. C, 2013, 117, 14920–14928 CAS.
- M. Al-Hussein, E. M. Herzig, M. Schindler, F. Löhrer, C. M. Palumbiny, W. Wang, S. V. Roth and P. Müller-Buschbaum, Polym. Eng. Sci., 2016, 889–894 CAS.
- A. Salleo, R. J. Kline, D. M. DeLongchamp and M. L. Chabinyc, Adv. Mater., 2010, 22, 3812–3838 CrossRef CAS PubMed.
- M. R. Hammond, R. J. Kline, A. a. Herzing, L. J. Richter, D. S. Germack, H. Ro, C. L. Soles, D. a. Fischer, T. Xu, L. Yu, M. F. Toney and D. M. Delongchamp, ACS Nano, 2011, 8248–8257 CrossRef CAS PubMed.
- W. L. Jorgensen, D. S. Maxwell and J. Tirado-Rives, J. Am. Chem. Soc., 1996, 118, 11225–11236 CrossRef CAS.
- N. R. Tummala, C. Bruner, C. Risko, J.-L. Brédas and R. H. Dauskardt, ACS Appl. Mater. Interfaces, 2015, 18, 9957–9964 Search PubMed.
- S. Plimpton, J. Comput. Phys., 1995, 117, 1–19 CrossRef CAS.
- A. Stukowski, Modell. Simul. Mater. Sci. Eng., 2010, 18, 1–7 Search PubMed.
- G. B. Street, J. L. Bredas, B. Themans and J. M. Andre, J. Chem. Phys., 1985, 83, 1323–1329 CrossRef.
- S. Guo, J. Ning, V. Körstgens, Y. Yao, E. M. Herzig, S. V. Roth and P. Müller-Buschbaum, Adv. Energy Mater., 2015, 5, 1–11 Search PubMed.
- S. Hedstrom and P. Persson, J. Phys. Chem. C, 2012, 116, 26700–26706 Search PubMed.
- L. Giomi and L. Mahadevan, Phys. Rev. Lett., 2010, 104, 2–5 CrossRef PubMed.
- B. Kuei and E. D. Gomez, Soft Matter, 2016 10.1039/c6sm00979d.
- V. Ramachandran, G. N. Ramakrishnan and C. Sasisekharan, J. Mol. Biol., 1963, 7, 95–99 CrossRef PubMed.
- P. Carbone and A. Troisi, J. Phys. Chem. Lett., 2014, 5, 2637–2641 CrossRef CAS PubMed.
- J. F. Marko and E. D. Siggia, Macromolecules, 1995, 28, 8759–8770 CrossRef CAS.
- K. Do, D. M. Huang, R. Faller and A. J. Moulé, Phys. Chem. Chem. Phys., 2010, 12, 14735–14739 RSC.
- H. Yao, L. Ye, H. Zhang, S. Li, S. Zhang and J. Hou, Chem. Rev., 2016, 116, 7397–7457 CrossRef CAS PubMed.
- H. J. Son, W. Wang, T. Xu, Y. Liang, Y. Wu, G. Li and L. Yu, J. Am. Chem. Soc., 2011, 133, 1885–1894 CrossRef CAS PubMed.
- T. Yamamoto, B. L. Lee, H. Kokubo, H. Kishida, K. Hirota, T. Wakabayashi and H. Okamoto, Macromol. Rapid Commun., 2003, 24, 440–443 CrossRef CAS.
- K. R. Graham, C. Cabanetos, J. P. Jahnke, M. N. Idso, A. El Labban, G. O. N. Ndjawa, T. Heumueller, K. Vandewal, A. Salleo, B. F. Chmelka, A. Amassian, P. M. Beaujuge and M. D. Mcgehee, J. Am. Chem. Soc., 2014, 136, 9608–9618 CrossRef CAS PubMed.
- T. Wang, M. K. Ravva and J.-L. Brédas, Adv. Funct. Mater., 2016 DOI:10.1002/adfm.201601134.
- C. Müller, Chem. Mater., 2015, 27, 2740–2754 CrossRef.
- C. Müller, E. Wang, L. M. Andersson, K. Tvingstedt, Y. Zhou, M. R. Andersson and O. S. Inganä, Adv. Funct. Mater., 2010, 20, 2124–2131 CrossRef.
- D. Turnbull and M. H. Cohen, J. Chem. Phys., 1961, 34, 120 CrossRef CAS.
- ASTM Stand. E 1171S, 2001, i, 1–5.
- J. P. Pierre-Gilles de Gennes, The Physics of Liquid Crystals, Clarendon, Oxford, 1974 Search PubMed.
- K. N. Schwarz, T. W. Kee and D. M. Huang, Nanoscale, 2013, 5, 2017–2027 RSC.
- N. D. Treat and M. L. Chabinyc, Annu. Rev. Phys. Chem., 2014, 65, 59–81 CrossRef CAS PubMed.
- J. A. Bartelt, Z. M. Beiley, E. T. Hoke, W. R. Mateker, J. D. Douglas, B. A. Collins, J. R. Tumbleston, K. R. Graham, A. Amassian, H. Ade, J. M. J. Fréchet, M. F. Toney and M. D. Mcgehee, Adv. Energy Mater., 2013, 3, 364–374 CrossRef CAS.
- K. Vandewal, S. Albrecht, E. T. Hoke, K. R. Graham, J. Widmer, J. D. Douglas, M. Schubert, W. R. Mateker, J. T. Bloking, G. F. Burkhard, A. Sellinger, J. M. J. Fréchet, A. Amassian, M. K. Riede, M. D. McGehee, D. Neher and A. Salleo, Nat. Mater., 2014, 13, 63–68 CrossRef CAS PubMed.
- A. J. Moulé and K. Meerholz, Adv. Mater., 2008, 20, 240–245 CrossRef.
- D. T. Duong, B. Walker, J. Lin, C. Kim, J. Love, B. Purushothaman, J. E. Anthony and T. Q. Nguyen, J. Polym. Sci., Part B: Polym. Phys., 2012, 50, 1405–1413 CrossRef CAS.
- O. Oklobia, T. S. Shafai, B. Friedel, T. J. K. Brenner, C. R. McNeill, U. Steiner, N. C. Greenham, G. Li, G. Lu, S. Li, H. Tang, X. Yang, G. Lu, L. Li, J. Li, Y. Wang, X. Yang, S. J. Lou, J. M. Szarko, T. Xu, L. Yu, T. J. Marks, L. X. Chen, W.-H. Baek, T.-S. Yoon, H. H. Lee and Y.-S. Kim, J. Mater. Chem., 2010, 11, 1736–1745 Search PubMed.
- X. Fan, G. J. Fang, P. L. Qin, F. Cheng and X. Z. Zhao, Appl. Phys. A: Mater. Sci. Process., 2011, 105, 1003–1009 CrossRef CAS.
- R. Everaers, Science, 2004, 303, 823–826 CrossRef CAS PubMed.
- S. Shanbhag and M. Kröger, Macromolecules, 2007, 40, 2897–2903 CrossRef CAS.
- R. S. Hoy, K. Foteinopoulou and M. Kröger, Phys. Rev. E: Stat., Nonlinear, Soft Matter Phys., 2009, 80, 14–16 CrossRef PubMed.
- N. C. Karayiannis and M. Kröger, Int. J. Mol. Sci., 2009, 10, 5054–5089 CrossRef CAS PubMed.
- M. Kröger, Comput. Phys. Commun., 2005, 168, 209–232 CrossRef.
- M. L. Jones, D. M. Huang, B. Chakrabarti and C. Groves, J. Phys. Chem. C, 2016, 120, 4240–4250 CAS.
- P. C. Tapping, S. N. Clafton, K. N. Schwarz, T. W. Kee and D. M. Huang, J. Phys. Chem. C, 2015, 119, 7047–7059 CAS.
- V. Agrawal, G. Arya and J. Oswald, Macromolecules, 2014, 47, 3378–3389 CrossRef CAS.
- T. John, T. Cockerill, I. Foster and K. Gaither, Comput. Sci. Eng., 2014, 16, 62–74 Search PubMed.
Footnote |
| † Electronic supplementary information (ESI) available: (1) Simulation details. (2) In-depth analysis of results. (3) LAMMPS data files35 containing atomistic model parameters. See DOI: 10.1039/c6ee03456j |
| This journal is © The Royal Society of Chemistry 2017 |

