 Open Access Article
Creative Commons Attribution 3.0 Unported Licence
Digital droplet LAMP as a microfluidic app on standard laboratory devices†
Friedrich
Schuler
ab,
Clara
Siber
a,
Sebastian
Hin
b,
Simon
Wadle
ab,
Nils
Paust
ab,
Roland
Zengerle
ab and
Felix
von Stetten
*ab
aHahn-Schickard, Georges-Koehler-Allee 103, 79110 Freiburg, Germany. E-mail: Felix.von.Stetten@Hahn-Schickard.de; Fax: +49 761 203-73299
bLaboratory for MEMS Applications, IMTEK – Department of Microsystems Engineering, University of Freiburg, Georges-Koehler-Allee 103, 79110 Freiburg, Germany
First published on 3rd March 2016
Abstract
Digital nucleic acid amplification methods are a growing research field that allows for absolute quantification of DNA making the need of standard curves redundant. However, most of the existing digital amplification systems require specialized laboratory devices and costly investments. The required disposable cartridges are device specific and not interchangeable. Here, we present digital droplet loop-mediated isothermal amplification (ddLAMP) as a microfluidic app on standard laboratory devices. ddLAMP is implemented on a disposable polymer chip (DropChip) in the format of a standard microscope slide. After off-chip DNA denaturation, the reaction mix is emulsified in the DropChip in a mini centrifuge for 6 minutes. The DropChip is transferred to an in situ thermal cycler for 1 hour of incubation. Afterwards, a fluorescence scan in a microarray scanner is performed. The DropChip allows for absolute quantification with a dynamic range of 15–1500 DNA copies per μl. Assay conditions were optimized for ddLAMP and comparison of ddPCR and ddLAMP for genomic E. coli DNA reveals very good concordance.
Introduction
Digital amplification of nucleic acids allows for absolute quantification of nucleic acids with or without the need for standards and the possibility to detect single molecules. The method has been applied to a wide variety of applications such as the detection of rare cancer mutations1 or HIV quantification.2 A digital PCR (dPCR) was developed by Sykes et al. in 19923,4 and has already been commercialized by a number of companies.5–9 However, the devices are still expensive.Recently, the use of isothermal amplification techniques for digital amplification has been introduced. They often enable shorter reaction times than the dPCR. Furthermore, they typically use less electrical power than the dPCR, as they run at lower temperatures and require no temperature changes. This can reduce the price of the needed devices and can be advantageous when battery powered, portable devices are needed, e.g. for resource-poor settings. A variety of digital isothermal amplification systems have been presented using RPA,10 LAMP,11–14 RCA,15 EXPAR16 and DNAzymes.17 Recently, we presented digital droplet RPA (ddRPA) using a polymer cartridge.18 However, the ddRPA requires the addition of Mg2+ directly before the droplet generation to avoid amplification in bulk (i.e. before the droplets are generated) as the initiation of RPA cannot be controlled by a hot-start. In contrast, LAMP can be initiated by a thermal initiation step (warm-start) to activate the employed polymerase, similar to a hot-start in the PCR.19 This makes LAMP reactions much easier to handle.
LAMP is one of the most common isothermal reactions, as it features high specificity,20,21 robustness with regard to the amplification temperature and lower sensitivity towards inhibition compared to the PCR.22 Three digital LAMP solutions have been presented so far. Gansen et al. introduced a self-digitization chip that produces 535 droplets inside small PDMS-chambers without dead volume. The system relies on syringe pumps and has a comparatively high coefficient of variation (CV) of 16%.12 Zhu et al. presented a PDMS based chip that uses the gas solubility of PDMS by degassing the PDMS prior to loading to provide the energy for power-free pumping.11 The cartridge needs to be stored in a vacuum, thus making transportation difficult and reducing shelf-life. A different approach was taken by Sun et al.13 who used the SlipChip23 for digitization of the reaction mixture, enabling a two-step RT-LAMP. As the SlipChip is made from etched glass and assembled under oil, the fabrication of the chip is relatively complex. Moreover, all of the systems use non-standardized cartridge formats or non-standardized laboratory devices. The materials that were used (PDMS and etched glass) are not compatible to scalable production techniques such as injection molding, hot embossing or thermoforming. Moreover, only a maximum of 1280 compartments could be formed, thereby limiting the dynamic range.
Following the microfluidic app concept,24,25 we present a microfluidic disposable cartridge (DropChip) in the standardized format of a microscope slide (ISO 8037-1), which allows for digital droplet LAMP (ddLAMP) using only commercially available laboratory devices. The droplets are generated in the DropChip in a mini centrifuge by centrifugal step emulsification, subsequently the ddLAMP reaction is performed on-chip in an in situ cycler and a fluorescence image of the droplets in the DropChip is taken in a standard microarray scanner.
Materials and methods
The general workflow of ddLAMP is described in Fig. 1. The droplet generation takes place on the DropChip in a mini centrifuge. Afterwards the slide is incubated in an in situ cycler and transferred to a microarray scanner for fluorescence scanning (see Fig. 1).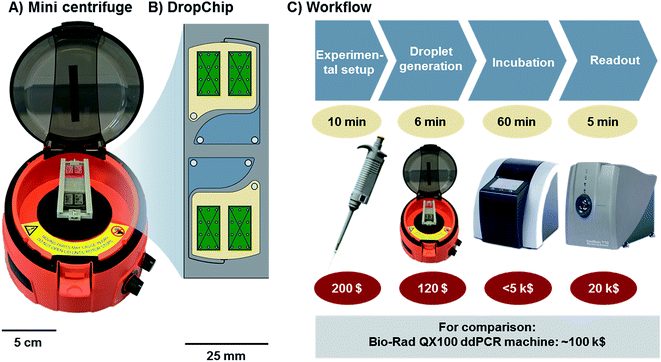 | ||
| Fig. 1 (A) Mini centrifuge with the DropChip mounted. (B) Schematic of the DropChip. It features two identical structures. Each with one inlet, connected via a channel to a nozzle (for details see Fig. 2). Here droplets are generated via centrifugal step emulsification. (C) Workflow of the ddLAMP experiment. The DNA is denatured and mixed with the LAMP reagents. The mix is emulsified by centrifugation using the DropChip. Then, the DropChip is incubated at 62 °C in a commercially available in situ cycler. The last step is readout in a microarray scanner. | ||
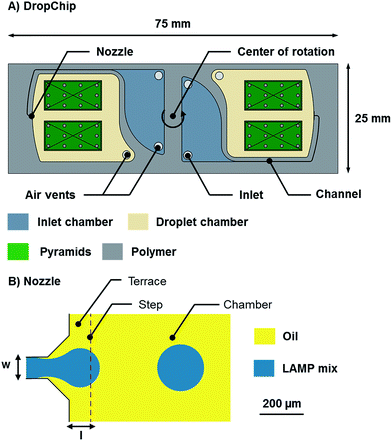 | ||
| Fig. 2 (A) Sketch of the DropChip. The chip has the size of a standard microscope slide (75 mm × 25 mm × 1 mm). (B) Top view of the centrifugal step emulsification nozzle. The channel width (w) was 90 μm in all designs and the terrace length (l) was 100 μm in all designs. For a detailed description see the study by Schuler et al.18 | ||
To prepare the reaction mix, first, the target DNA (E. coli W3110 Reference DNA, Life Technologies, Carlsbad, US) in a dilution buffer (containing 0.2× TE buffer and 10 ng μl−1 herring sperm DNA) is denatured by heating to 85 °C for 2 min and immediately cooled on ice. E. coli DNA (E. coli W3110 Reference DNA, Life Technologies, Carlsbad, US) was used as the target DNA at various concentrations. After denaturation, the target DNA is mixed with the LAMP reagents, adapted from ref. 19, consisting of 1× isothermal amplification buffer (New England BioLabs (NEB), Frankfurt, Germany), Bst 2.0 WarmStart DNA polymerase (640 U ml−1, NEB), MgSO4 (8 mM, NEB), dNTPs (1.4 mM each, Qiagen, Hilden, Germany), BSA (1 g l−1, Sigma-Aldrich, Darmstadt, Germany), FIP and BIP (640 nM each), F3 and B3 (80 nM each), and LoopF and LoopB (160 nM each), where all concentrations refer to their final concentration in the mix. According to Tanner et al.,19 a certain percentage of the primer FIP is quencher-modified (=FIP-Q) and a reverse-complementary fluorogenic probe Fd is used for fluorescence signal generation upon amplification. FIP-Q and Fd were used at final concentrations of 12.8 nM each. For primer and probe sequences see the study by Tanner et al.19 or Table S1.†
The DropChip shown in this work (see Fig. 2) is used for emulsification, incubation and scanning. The inlet chamber is 500 μm deep and has two holes, one is an inlet and the other one is an air vent (either hole can be used as an inlet). The channel is 90 μm wide and 60 μm deep. The droplet chamber is 500 μm deep. Two pyramids are placed in the droplet chamber such that the top of the pyramid is 140 μm lower than the surface of the chip. The angle of the pyramid sides is 2° and 12 pillars of 700 μm diameter are placed on each pyramid to prevent the flexible sealing foil from lamination onto the surface of the pyramid. The pyramids are used to transport any bubbles that might form during the experiment to the side. Furthermore, the pyramids center the emulsion on the DropChip by capillary action as is depicted in Fig. S1.† For a more detailed explanation see the study by Schuler et al.26
Droplet generation was performed by centrifugal step emulsification as described earlier.18 In brief, the channel, nozzle, and droplet chamber are first filled with 30 μl fluorinated oil (Novec 7500, Neuss, Germany) containing 2.5 wt% Picosurf-1 surfactants (all from one batch delivered by Dolomite, Royston, Hertfordshire, UK). The oil is introduced into the inlet and spun down by rotating the DropChip in a mini centrifuge (uniCFUGE 3, Welabo, Nettetal, Germany) at 1500 rpm for 2 min. Afterwards, 20 μl of LAMP mix are introduced into the inlet and the DropChip is rotated at 1500 rpm for 4 min. The centrifugal force drives the LAMP mix down to a nozzle over a backward facing step. Here, instability at the LAMP mix–oil interface is induced by capillary forces and droplets are formed. The break-up process is dominated by capillary forces and does not depend on the flow rate. Using centrifugal step emulsification, a comparatively good monodispersity with a CV of 1.4% could be demonstrated. The average diameter of the droplets was 122 μm (for details see ESI†). As the surrounding fluorinated oil has a much higher density (ρ = 1.6 g ml−1) than the LAMP mix, the droplets rise in the artificial gravity field and do not clog the nozzle. After droplet generation, the DropChip is incubated in a peqStar in situ cycler (PEQLAB Biotechnologie, Erlangen, Germany) at 62 °C (±0.35 °C uncertainty according to the manufacturer of the thermal cycler) for 60 min. During incubation, small bubbles might form. These are removed by capillary driven bubble transport as described above and in an earlier publication.26 After incubation, the DropChip cools to room temperature. The sealing foil becomes hazy at higher temperatures but returns to a fully transparent state again. A fluorescence image of the DropChip is then taken using an Innoscan 710 microarray scanner (Innopsys, Carbonne, France) with a 635 nm excitation laser. The resulting tiff-file is subjected to semi-automatic image recognition (for details see Fig. S2†) that gives the grey values of about 2000 droplets. The number of positive and negative droplets is converted into copy numbers by applying Poisson statistics (for details see ESI†) to correct for multi-occupancies (i.e. more than one DNA molecule per droplet prior to the amplification reaction).
Results and discussion
Influence of DNA denaturation
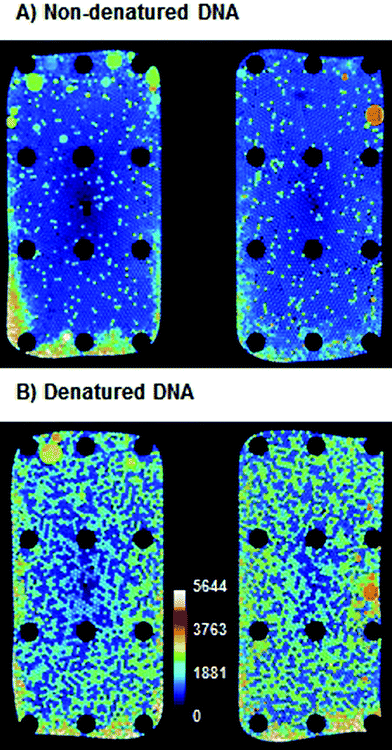
Earlier reports13 showed that in digital LAMP no amplification could be observed without the thermal denaturation of DNA in a preheating step. Therefore, the influence of DNA denaturation was tested by performing a ddLAMP experiment with two aliquots of target DNA from the same vial. One aliquot was denatured as described earlier, while the other was used without treatment. As can be seen in Fig. 3, the denatured sample showed an apparent increase (∼6-fold) in copy number, even though the same amount of target DNA was used in both experiments. We assume that the non-denatured target DNA is not fully accessible to LAMP primers at 62 °C during the LAMP experiment and thus not every single DNA copy is detected. A similar observation has been reported by Sun et al.13 Therefore, all following experiments were performed with a denaturation step prior to loading on the DropChip. As can be seen from Fig. 3, some droplets merge and some edge effects occur. The merging occurs mostly on the pyramid that is closer to the air vent. Hence, the merging might be a result of the evaporation of oil that is faster on the right pyramid than on the left. Merged droplets were automatically excluded from analysis due to their larger size. In ∼15% of the ddLAMP experiments the number of droplets that could be evaluated were only ∼1000. In all other cases 1500–2000 droplets could be evaluated. The higher fluorescence at the emulsion–air-interface is likely due to partial evaporation of droplets. Presumably, the increased salt concentrations lead to unspecific dequenching of the fluorescence signal. Those regions were also excluded from the analysis.In the following sections, the influences of the incubation temperature, incubation time, primer concentration and concentration of the labeled primer were studied. In order to compare the efficiency of the ddLAMP under different conditions, experiments with the same DNA input concentration were performed. Then, the concentration of DNA molecules was measured using ddLAMP under different conditions. The efficiency of the ddLAMP is given as the ratio of the number of DNA molecules measured under given conditions to the number of DNA molecules measured under optimal conditions (as verified by independent ddPCR, see below).
Temperature
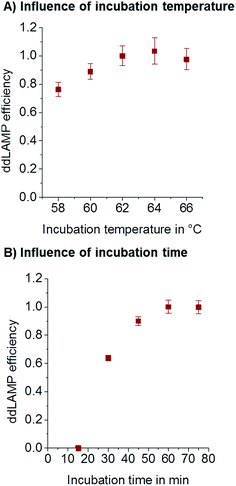
The influence of amplification temperature was evaluated to ensure robust amplification. In order to measure the actual temperature inside the chip, a small thermocouple was inserted into the droplet collection chamber which was filled with fluorinated oil. During incubation, the temperature was measured using a thermocouple inside the chip. It was found to be 2 °C lower than that shown on the cycler. The temperatures given here always reflect the temperatures measured by the thermocouple inside the chip in the reference experiment. LAMP is known to be tolerant towards changes in incubation temperature. As can be seen from Fig. 4A, no significant difference in amplification efficiency can be seen in a temperature range from 60–66 °C. For all subsequent experiments, 62 °C was used.Time
In order to reduce the overall analysis time, the incubation time should be as short as possible without losing sensitivity. To assess the optimal incubation time, ddLAMP reactions were performed with different incubation times and the same number of target DNA molecules. If the incubation time is too short, not every droplet that contains a DNA molecule will have enough time to generate a fluorescence signal above the threshold. As can be seen from Fig. 4B, the observed copy numbers increase with time. 60 min was chosen as an optimal incubation time, as the efficiency is close to 1.Primer concentration
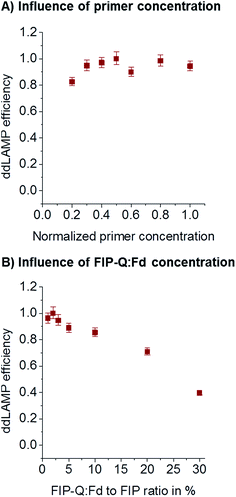
During assay optimization, the concentration of primers is usually varied to find the optimum value. As recently reported,27 the primer concentrations optimized in bulk reactions cannot necessarily be transferred to a small-volume digital LAMP assay. Too few primers might lead to a low efficiency of ddLAMP, as droplets might contain not enough primers to ensure reliable and fast amplification. Too many primers might lead to unspecific side reactions consuming reagents that would be needed for the amplification of the target sequence. Here, the overall primer concentration was varied without changing the ratio of individual primers (8× FIP/BIP: 1× F3/B3: 2× LoopF/LoopB). As can be seen from Fig. 5A, the primer concentration needs to be above a critical value (480 nM for FIP/BIP, 60 nM for F3/B3, and 120 nM for LoopF/LoopB). FIP and BIP 640 nM each, F3 and B3 80 nM each, and LoopF and LoopB 160 nM each were chosen for further experiments.Concentration of the labeled primer
A sequence-specific fluorescence signal generation for LAMP termed DARQ was presented by Tanner et al.19 and is used in this study in order to open the possibility for multiplexing in future. To provide fluorescence generation the 5′-end of the FIP is labeled with a quencher and called FIP-Q. The fluorophore is coupled to the 3′-end of another oligo that is complimentary to the F1c part of the FIP, this is called Fd. As shown before,19 the FIP-Q:Fd duplex seems to inhibit the LAMP at higher concentrations. To investigate the dependency of the ddLAMP efficiency on the FIP-Q:Fd duplex concentration, different concentrations of the FIP-Q:Fd duplex were assessed. As a certain percentage of the unlabeled FIP is replaced by the FIP-Q:Fd duplex, the concentration of the FIP-Q:Fd duplex is given in %. As can be seen from Fig. 5B, lower percentages of FIP-Q:Fd generally yield better results. However, no significant variations can be observed below 3%. In this range, the FIP-Q:Fd duplex does not reduce the efficiency. As the signal-to-noise-ratio (SNR) decreases with decreasing FIP-Q:Fd concentration, 2% was chosen as the optimal value, where the SNR is still good enough to clearly distinguish positive from negative droplets and a safety margin is taken into account in order to keep the efficiency high.ddLAMP vs. ddPCR
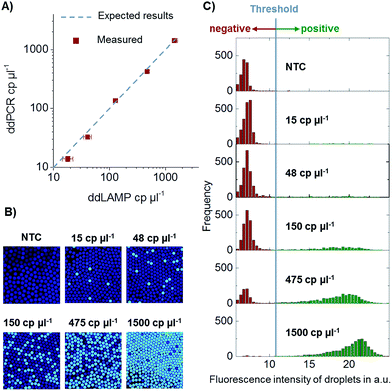
In order to verify the absolute quantification of DNA by ddLAMP, the system was compared to a commercially available ddPCR system by Bio-Rad (QX100). Two aliquots of five different dilution steps spanning a dynamic range of 15–1500 cp. per μl of target DNA and one no template control (NTC) were prepared. One aliquot was measured using ddLAMP, and the other aliquot was measured using ddPCR. The comparison of the values can be seen in Fig. 6. The values measured with ddLAMP correspond well to the values measured with ddPCR proving that the system indeed detects single DNA copies and allows for absolute quantification, at least within the investigated dynamic range. The experiment was repeated two times with no significant deviations observed.Conclusion
We performed ddLAMP on a DropChip, a standardized chip format with the size of a microscope slide, which can be run using only standard laboratory devices. The DropChip allows for the absolute quantification of DNA in the range of 15–1500 cp. per μl. The quantification results are comparable to existing commercial ddPCR devices. The ddLAMP is robust to temperature changes within a 4 °C corridor and relatively insensitive to changes in the primer concentration. In future, the employed sequence specific detection method will allow us to develop multiplexed ddLAMP systems that can absolutely quantify more than one target. The number of droplets should be increased to widen the dynamic range of the system and image recognition and analysis should be fully automated to make the system more user-friendly. Moreover, the denaturation step should be performed inside the DropChip. In order to do this, thermostable polymerases are needed and a better surfactant is needed, which reliably stabilizes the droplets in shallow chambers at temperatures of ∼85 °C. This would also reduce the problem with droplets merging in some cases at 62 °C.Acknowledgements
We gratefully acknowledge the financial support from EU Framework 7 project “ANGELab” (#317635). We want to thank Martin Trotter for helpful discussions. We would like to thank Marie Follo and her team at the Core facility of the University Hospital of Freiburg for the use of the Bio-Rad ddPCR device. We furthermore want to thank the Lab-on-a-Chip Design + Foundry Service of Hahn-Schickard for manufacturing the DropChips.References
- D. Pekin, Y. Skhiri, J.-C. Baret, D. Le Corre, L. Mazutis, C. B. Salem, F. Millot, A. El Harrak, J. B. Hutchison, J. W. Larson, D. R. Link, P. Laurent-Puig, A. D. Griffiths and V. Taly, Lab Chip, 2011, 11, 2156–2166 RSC.
- M. C. Strain, S. M. Lada, T. Luong, S. E. Rought, S. Gianella, V. H. Terry, C. A. Spina, C. H. Woelk and D. D. Richman, PLoS One, 2013, 8, e55943 CAS.
- P. J. Sykes, S. H. Neoh, M. J. Brisco, E. Hughes, J. Condon and A. A. Morley, BioTechniques, 1992, 13, 444–449 CAS.
- B. Vogelstein and K. W. Kinzler, Proc. Natl. Acad. Sci. U. S. A., 1999, 96, 9236–9241 CrossRef CAS.
- Bio-Rad, QX200™ Droplet Digital™ PCR System, http://www.bio-rad.com/en-us/product/qx200-droplet-digital-pcr-system, accessed 4 January 2016 Search PubMed.
- RainDance, RainDrop Digital PCR System, http://raindancetech.com/digital-pcr-tech/raindrop-digital-pcr-system/, accessed 4 January 2016 Search PubMed.
- ThermoFisher Scientific, QuantStudio® 3D Digital PCR System, https://www.thermofisher.com/de/de/home/life-science/pcr/digital-pcr/quantstudio-3d-digital-pcr-system.html, accessed 4 January 2016 Search PubMed.
- Fluidigm, Quantitative real-time digital PCR—qdPCR 37K™ IFC, https://www.fluidigm.com/binaries/content/assets/fluidigm/data-sheets/100-6129_ds.pdf, accessed 4 January 2016 Search PubMed.
- Formulatrix, Constellation Digital PCR, https://formulatrix.com/pcr/index.html, accessed 4 January 2016 Search PubMed.
- F. Shen, E. K. Davydova, W. Du, J. E. Kreutz, O. Piepenburg and R. F. Ismagilov, Anal. Chem., 2011, 83, 3533–3540 CrossRef CAS PubMed.
- Q. Zhu, Y. Gao, B. Yu, H. Ren, L. Qiu, S. Han, W. Jin, Q. Jin and Y. Mu, Lab Chip, 2012, 12, 4755–4763 RSC.
- A. Gansen, A. M. Herrick, I. K. Dimov, L. P. Lee and D. T. Chiu, Lab Chip, 2012, 12, 2247–2254 RSC.
- B. Sun, F. Shen, S. E. McCalla, J. E. Kreutz, M. A. Karymov and R. F. Ismagilov, Anal. Chem., 2013, 85, 1540–1546 CrossRef CAS PubMed.
- G. Nixon, J. A. Garson, P. Grant, E. Nastouli, C. A. Foy and J. F. Huggett, Anal. Chem., 2014, 86, 4387–4394 CrossRef CAS PubMed.
- L. Mazutis, A. F. Araghi, O. J. Miller, J.-C. Baret, L. Frenz, A. Janoshazi, V. Taly, B. J. Miller, J. B. Hutchison, D. Link, A. D. Griffiths and M. Ryckelynck, Anal. Chem., 2009, 81, 4813–4821 CrossRef CAS PubMed.
- K. Zhang, D.-K. Kang, M. M. Ali, L. Liu, L. Labanieh, M. Lu, H. Riazifar, T. N. Nguyen, J. A. Zell, M. A. Digman, E. Gratton, J. Li and W. Zhao, Lab Chip, 2015, 15, 4217–4226 RSC.
- D.-K. Kang, M. M. Ali, K. Zhang, S. S. Huang, E. Peterson, M. A. Digman, E. Gratton and W. Zhao, Nat. Commun., 2014, 5, 5427 CrossRef CAS PubMed.
- F. Schuler, F. Schwemmer, M. Trotter, S. Wadle, R. Zengerle, F. von Stetten and N. Paust, Lab Chip, 2015, 15, 2759–2766 RSC.
- N. A. Tanner, Y. Zhang and T. C. Evans, BioTechniques, 2012, 53, 81–89 CAS.
- T. Notomi, Nucleic Acids Res., 2000, 28, 63 CrossRef.
- Y. Mori, M. Kitao, N. Tomita and T. Notomi, J. Biochem. Biophys. Methods, 2004, 59, 145–157 CrossRef CAS PubMed.
- P. Francois, M. Tangomo, J. Hibbs, E.-J. Bonetti, C. C. Boehme, T. Notomi, M. D. Perkins and J. Schrenzel, FEMS Immunol. Med. Microbiol., 2011, 62, 41–48 CrossRef CAS PubMed.
- W. Du, L. Li, K. P. Nichols and R. F. Ismagilov, Lab Chip, 2009, 9, 2286–2292 RSC.
- D. Mark, F. von Stetten and R. Zengerle, Lab Chip, 2012, 12, 2464–2468 RSC.
- A. Kloke, A. R. Fiebach, S. Zhang, L. Drechsel, S. Niekrawietz, M. M. Hoehl, R. Kneusel, K. Panthel, J. Steigert, F. von Stetten, R. Zengerle and N. Paust, Lab Chip, 2014, 14, 1527–1537 RSC.
- F. Schuler, M. Trotter, M. Geltman, F. Schwemmer, S. Wadle, E. Domínguez-Garrido, M. López, C. Cervera-Acedo, P. Santibáñez, F. von Stetten, R. Zengerle and N. Paust, Lab Chip, 2016, 16, 208–216 RSC.
- E. M. Khorosheva, M. A. Karymov, D. A. Selck and R. F. Ismagilov, Nucleic Acids Res., 2016, 44(2), e10 CrossRef PubMed.
Footnote |
| † Electronic supplementary information (ESI) available. See DOI: 10.1039/c6ay00600k |
| This journal is © The Royal Society of Chemistry 2016 |

