 Open Access Article
Creative Commons Attribution 3.0 Unported Licence
Prediction of enhanced solvent-induced enantioselectivity for a ring opening with a bifurcating reaction path†
Barry K.
Carpenter
*a,
Jeremy N.
Harvey
b and
David R.
Glowacki
cdef
aSchool of Chemistry, Cardiff University, Park Place, Cardiff, CF10 3AT, UK. E-mail: carpenterb1@cardiff.ac.uk; Tel: +44 2920875844
bDepartment of Chemistry, KU Leuven, Celestijnenlaan 200F, B-3001 Heverlee, Belgium. E-mail: jeremy.harvey@chem.kuleuven.be; Tel: +32 16372 198
cSchool of Chemistry, University of Bristol, Bristol, BS8 1TS, UK
dDepartment of Computer Science, University of Bristol, BS8 1UB, UK
ePULSE Institute and Department of Chemistry, Stanford University, Stanford, CA 94305, USA
fSLAC National Accelerator Laboratory, Menlo Park, California 94025, USA. E-mail: drglowacki@gmail.com
First published on 11th December 2014
Abstract
Classical molecular dynamics simulations are reported for the deazetisation and ring opening of meso-2,3-difluoro-2,3-dimethyldiazocyclopropane in three solvents: CHCl3, CHFClBr and CH3CH(OH)CF3 (TFIPA). The achiral reactant leads to enantiomeric allene products, and the question addressed in the study is whether either of the chiral, enantiomerically pure solvents can induce significant enantiomeric excess in the products. The direct dynamics calculations use an empirical valence bond potential for the solute, with empirical parameters optimised against M06-2X/cc-pVTZ density functional results. The results reveal that the exothermic N2 loss and ring opening promote transient strong solvent–solute interactions within the first ∼100 fs of the reaction. Because of the bifurcating reaction path, these interactions occur at time when the “decision” about which enantiomer of the product to form has yet to be made (at least for many of the trajectories). Hence, it is possible in principle that the solvent could exert a larger-than-normal influence on the course of the reaction. In fact, the results reveal no such effect for CHFClBr but do predict that TFIPA should induce 15.2 ± 2.1% enantiomeric excess. This is roughly an order of magnitude larger than solvent-induced enantiomeric excesses found experimentally in reactions where the conversion of reactant(s) to enantiomeric products occur over separate transition states.
1. Introduction
The induction of optical activity (or, more precisely, enantiomeric excess) in the products of a chemical reaction has long been a topic of interest. The issue is of potential relevance to the long standing issue of primordial homochirality,1 but it also has considerable importance for the production of pharmaceutical compounds, the chiral versions of which very frequently exhibit different biological activity for the two enantiomers.In chemical synthesis, enantiomerically enriched products can be prepared by stereoselective reactions on enantiomerically enriched reactants, but such processes merely transfer chiral information from one molecule to another. Of much greater interest is induction of enantiomeric excess in products arising from the reaction of an achiral reactant with an enantiomerically pure catalyst.2–4 In these reactions it is possible to amplify the chiral information carried in the catalyst because of its ability to interact repeatedly with molecules of the reactant.
A related approach to the use of an enantiomerically pure catalyst is to employ an enantiomerically pure chiral solvent. If the reactant for a transformation in such a solvent is achiral but the products are chiral, then it is possible in principle to induce enantiomeric excess in the products. However, most of the studies investigating such effects have reported disappointing results, with enantiomeric excesses typically being ∼1%.5–8 So far, larger effects have been found only when the solvent becomes covalently bound to a reactant or reagent.9–11 This is presumably because noncovalent solvent–solute interactions are usually rather weak, and differences between the interactions of the two enantiomers of a chiral solute with a given enantiomer of the solvent are consequently even smaller.
However, one class of reactions might, in principle, show greater-than-normal sensitivity to small differences in solvent properties, and might therefore provide opportunities for more substantial induction of enantiomeric excess. These are reactions for which the product-forming step exhibits bifurcation of the intrinsic reaction coordinate (IRC).12 The large number and variety of such reactions has only recently become apparent.13–35 Of particular relevance to the present study is the conclusion from a recent classical trajectory study on a model potential showing reaction path bifurcation.30 The results showed very strong, non-monotonic dependence of the product ratio on the efficiency with which energy was dissipated from the reacting system. If transferable to real molecular systems with multidimensional underlying potential energy surfaces, such a result could imply hypersensitivity of product ratios to small changes in solvent properties. The present paper reports the results of a molecular dynamics simulation designed to investigate this possibility. As described below, the results do indeed reveal an example of an abnormally large induction of enantiomeric excess in reaction products through the use of enantiomerically pure solvent, but analysis of the results suggests a different mechanism for the effect than the one originally anticipated. In some ways, the phenomenon found in the present simulation is even more interesting than the one originally being sought, and the results suggest new avenues for study that could lead to further amplification of the effect.
2. Reaction selected for study
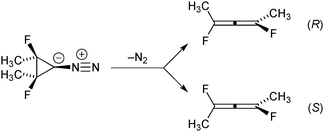
One of the earliest organic-chemistry examples of a reaction shown to have a bifurcating IRC was the ring opening of singlet cyclopropanylidene to allene, studied computationally by Ruedenberg and coworkers.12 In the present work we have built on that basic foundation, but have modified the chemical system in two ways. First, methyl and fluorine substituents have been added to each of the tetracoordinate carbons. The substituents are arranged in a meso stereochemistry. Second, we have chosen to start from a diazo precursor to the carbene rather than from the carbene itself for our simulations. As described below, DFT calculations suggest that the loss of N2 from the diazo precursor leads directly to the allene products without involving an explicit carbene intermediate. Hence, concerns about reaction of the carbene with the solvent in any experimental test of the theoretical predictions are finessed. As shown in Scheme 1, the addition of the substituents causes the allene products to become chiral, with the two branches of the IRC bifurcation leading to opposite enantiomers.M06-2X/cc-pVTZ calculations36 on the ring-opening reaction reveal a potential energy profile along the IRC shown in Fig. 1.
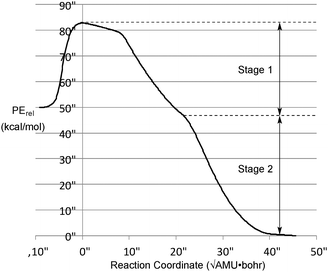 | ||
| Fig. 1 M06-2X/cc-pVTZ intrinsic reaction coordinate for the reaction in Scheme 1. During stage 1, the ring opening occurs without significant torsion of the CFCH3 groups about the bonds to the “carbenoid” carbon. Torsion occurs in stage 2, to give one or the other enantiomer of the allene products. | ||
Unsurprisingly, the reaction is predicted to be very exothermic. The shape of the IRC profile suggests three phases for the reaction: the first being loss of N2 to generate the carbene. It is not a local minimum on the potential energy surface, although it may well be classified as a “hidden intermediate,” in the terminology of Kraka and Cremer.37 The second involves cleavage of the bond between the two tetracoordinate carbons. This occurs without relative torsional motion, and brings the system close to a transition state for enantiomerization of the allene product. In the third phase, the IRC bifurcates with relative torsional motion of the carbons bearing the methyl and fluorine substituents leading to one or the other enantiomer of the product. For the purposes of the present work, the first and second phases can be combined into a single stage, as shown in Fig. 1.
Because the reactant is achiral, the products for the deazetisation in the gas phase would necessarily be racemic. However, this is not a requirement if the reaction is run in an enantiomerically pure chiral solvent. Any enantiomeric excess in the products in the latter case would arise solely from solvent–solute interactions, and so the magnitude of the excess could provide some insight into those interactions.
3. Computational methods
3.1 Empirical valence bond model
 | (1) |
 | (2) |
All molecular dynamics simulations were carried out using the Tinker program package,44,45 which includes implementations of several different standard force-fields. EVB calculations were carried out with a locally modified parallel version of Tinker 6.0, using the MPI (Message Passing Interface) approach for parallelism. Each MPI thread runs a separate Tinker process, computing the potential energy and gradient for the given set of nuclear coordinates and the MM3 force-field and parameter set on a particular diabatic state. The energies and gradients are gathered together using MPI, in order to build and diagonalize the EVB matrix. Subsequent application of eqn (2) then yields the Cartesian gradients corresponding to the lowest eigenvalue. The resulting EVB energy and gradient are then passed back to the individual Tinker processes, where each thread executes another time step and subsequent force evaluation.
In the standard MM3 force-field47 available in Tinker, there were no parameters for the diazo functional group of the reactant. Nor were there parameters for allenes. Consequently, new parameters were created for these moieties, and their values were included in the optimisation, which was carried out by nonlinear least squares, employing the Levenberg–Marquardt algorithm, with numerical evaluation of first derivatives. All final values of optimised parameters are provided in the ESI.†
After a good deal of experimentation, the best functional form for the H12 term in the EVB matrix was judged to be a simple Gaussian function of the C–C distance in the breaking bond of the ring. Efforts to include dihedral angles or the C–N distance in more complex functions did not result in improved accuracy of the fit to the DFT results. The parameters of the Gaussian function were included in the overall optimisation, and are also reported in the ESI.†
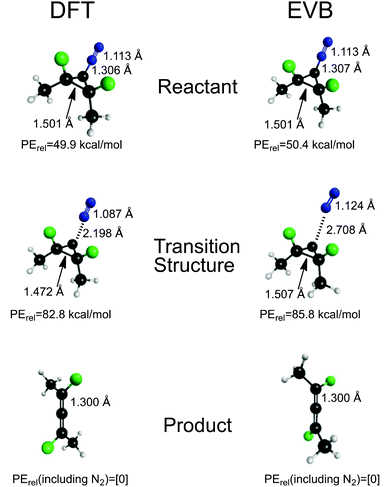
The final fit of the EVB function to the points from the DFT trajectories is shown in Fig. 2. The mean unsigned error of the fit was 4.06 kcal mol−1. When potential energies of the stationary points for the reaction were compared between the DFT and EVB models, the results were quite good (Fig. 3). Geometries of reactant and products were also well reproduced. At present, the TINKER EVB implementation does not permit geometry optimisation of saddle points, and so to obtain an approximate transition structure from which to initiate the trajectories, single-point EVB energies were calculated for each of the structures in the DFT IRC, and then the one of highest potential energy was selected as the “transition state”. The result is shown in Fig. 3. The structure found is similar to the DFT transition structure, but the C–N distance, in particular, is substantially longer. The energy is 3 kcal mol−1 higher than that for the DFT transition structure (or 2.5 kcal mol−1 if the reactants are chosen as the energy zero). Although the erroneous C–N distance obviously does represent a flaw in the EVB model, it was judged not to be sufficiently serious to invalidate at least the qualitative results from the simulations, because the interesting dynamics occurs only after the ring has opened, at which point the N2 is quite far removed in both EVB and DFT models. Similarly, the use of a gas-phase IRC to locate the transition structure used at the start of the solution-phase simulations will introduce some error, but for the reasons just elucidated we judge it not to be a serious problem.
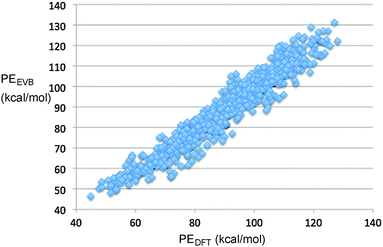 | ||
| Fig. 2 Correlation plot showing the fit of the EVB parameters to the results from M06-2X/cc-pVTZ direct-dynamics trajectories. | ||
3.2 Molecular dynamics simulations
The fitting of the parameters to the DFT results did not create any asymmetry of the force-field, which could bias the results to one enantiomer or the other. To demonstrate that this was indeed the case, it did not turn out to be useful to use gas-phase simulations, because, as illustrated later, with no means to dissipate kinetic energy from the system, the trajectories can cross from one enantiomer of the product to the other, and so the assignment of an (R) or (S) absolute configuration to the outcome of a particular trajectory cannot be accomplished in an unambiguous fashion. Given this problem, the control simulation was carried out with an achiral solvent, CHCl3, as described next.The EVB “transition structure” described above was embedded in a box of solvent molecules with periodic boundary conditions. Three solvents were examined: CHCl3, CHFClBr, and H3C–CH(OH)–CF3 (called TFIPA hereafter). Single enantiomers of the chiral solvents were used, although in each case both the (R) and (S) enantiomers were studied separately. For CHCl3 and CHFClBr, the periodic-boundary boxes each contained 508 solvent molecules. For the larger TFIPA, 255 solvent molecules were included. For the pure solvents, NPT trajectory simulations were run at 298 K and at whatever constant pressure was necessary to reproduce experimental liquid densities. These calculations set the dimensions of the cubic boxes. The solute was embedded in the centre of each box, with deletion of the minimum number of solvent molecules necessary to avoid contact with the solute. The resulting solutions were then equilibrated in NVT simulations, as described below.
The nonbonded interactions in the simulation used the MM3 H-bond potential,48,49 which reverts to a conventional Lennard-Jones function for non-hydrogen-bonded atom pairs, but allows for explicit hydrogen bonds of defined strength and geometry. Since the MM3 H-bond potential does not included fluorine as a H-bond acceptor, values for the H-bond parameters between the OH of TFIPA and the fluorines of the reactant, product, and other TFIPA molecules were determined from M06-2X/cc-pVTZ calculations. The results are included in the ESI.† Cutoffs for calculation of nonbonded interactions were set at 10 Å for all of the simulations.
The starting point for each reactive trajectory was generated by equilibrating the “transition structure” in the solvent for 10 ps at 298 K in a NVT simulation, using a Berendsen thermostat.50 The end point of a given NVT simulation was taken as the starting point for the next one. The equations of motion were integrated with the velocity Verlet algorithm, using a time step of 0.5 fs. In order to prevent reaction from occurring during the equilibration, the three carbon atoms of the ring, and the nitrogen atom previously bound to the ring were all frozen. Following the equilibration step, a reactive trajectory was initiated by releasing all constraints on the solute atoms, and then running a NVE trajectory with 0.1 fs time step, again using the velocity Verlet integrator. Snapshots from two trajectories run in the TFIPA solvent are depicted in Fig. 4.
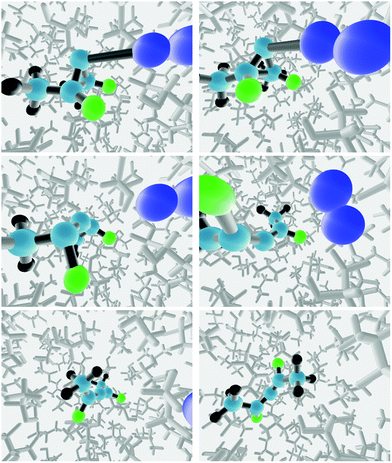 | ||
| Fig. 4 Snapshots from two trajectories run in the TFIPA solvent, showing, in columns 1 and 2 respectively, formation of the (R) and (S) enantiomers of the product allene. | ||
4. Results and discussion
4.1 Solvent induced enantiomeric excess in reaction products
The numbers of trajectories forming the (R) and (S) enantiomers of the allene product for simulations run in each of the three solvents are summarised in Table 1.| Solvent | Total trajectories | (R)-Allene | (S)-Allene |
|---|---|---|---|
| CHCl3 | 1200 | 607 | 593 |
| (R)-CHFClBr | 1200 | 618 | 582 |
| (S)-CHFClBr | 1200 | 590 | 610 |
| (R)-TFIPA | 2500 | 1044 | 1456 |
| (S)-TFIPA | 2500 | 1423 | 1077 |
For CHCl3, as one would hope, the result of 1.2 ± 4.6% enantiomeric excess is indistinguishable from zero. Quoted uncertainties in this ratio, and those cited below, come from the cumulative binomial probability distribution (eqn (3)), which was evaluated in the present work by Lentz's algorithm for the incomplete beta function.51 In eqn (3), p is the probability that any single trajectory will give, say, the R enantiomer of the allene product. The best estimate of its value is simply equal to the fraction of the trajectories in a set that gives the R product. P is the probability of k or more trajectories giving the R enantiomer of the product out of n total trajectories. The quoted uncertainties for the 95% confidence interval are found by adjusting the value of p until P equals 0.05 and then 0.95.
 | (3) |
4.2 Energy transfer between solute and solvent
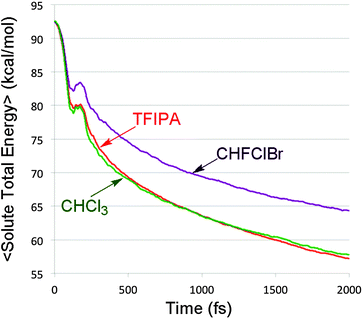
In the previously cited model study30 it was shown that changing the rate at which kinetic energy was dissipated from trajectories on a bifurcating potential energy surface resulted in dramatic variations in branching ratios to the two product wells. In order to see whether such an effect might play a role in the present simulations, the total energy of the solute (i.e. the sum of potential and kinetic energy, neglecting all solvent terms) was computed every femtosecond for each of the reactive trajectories. The results for each solvent were then averaged. The outcome is summarized in Fig. 5.It is apparent from Fig. 5 that there are differences in the rate of energy transfer from the solute to each of the three solvents, with CHFClBr being the odd one out of the three. More important for the present discussion is the oscillatory behaviour seen within the first 200 fs. This is revealed clearly by plotting the residuals of the data from the best double-exponential fits for each solvent. The result is shown in Fig. 6.
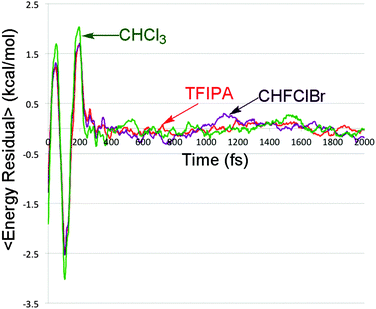 | ||
| Fig. 6 Residuals between the solute energy content data in Fig. 5 and the best double-exponential fits for each solvent. | ||
Oscillatory behaviour of this kind has been previously predicted in the energy relaxation of a nonlinear oscillator coupled to a linear bath.52
At first sight, the results depicted in Fig. 6 seem paradoxical. If there were no interaction between solute and solvent, the total energy of the solute would be constant. How, then, can a result that clearly depends on the presence of a solvent be apparently independent of the nature of that solvent? The answer is perhaps best discussed with respect to eqn (4). Because the trajectories are run at constant E, the left hand side of eqn (4) is constant. The energies plotted in Fig. 5 correspond to the first term in the right hand side of eqn (4).
| Etotal = Esolute + Esolvent + Esolute/solvent | (4) |
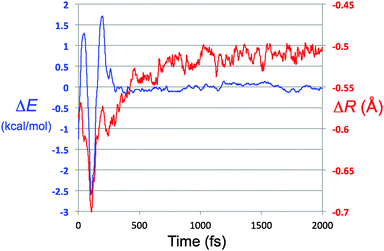 | ||
| Fig. 7 Overlay of the energy residual trace for TFIPA, from Fig. 6 (ΔE axis and blue trace on this graph) and the closest approach of solute and solvent atom pairs, with respect to the sum of their van der Waals radii (ΔR axis and red trace). | ||
4.3 Influence of solute–solvent interactions on the choice of product well
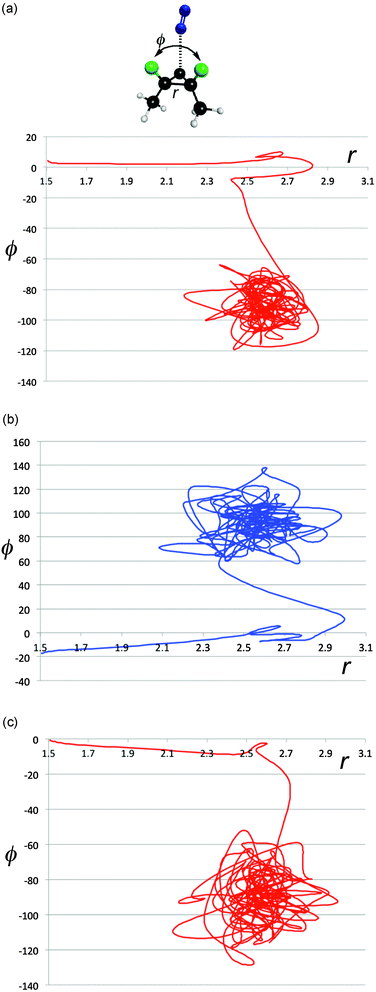
The energy exchange between solute and solvent must have some effect on the paths taken by the reactive trajectories. In particular, one could imagine that there is chiral information transferred between solvent and solute, and that this might be enhanced in magnitude when the solute–solvent contacts are particularly strong. That such phenomena do occur is revealed in Fig. 8a–e, which show representative trajectories where there are abrupt changes in direction just around the point where the distance between the carbon atoms of the breaking C–C bond first reaches its value (∼2.7 Å) at the end of stage 1 of the ring opening. Importantly, these changes in direction can include transits across the ridge separating one enantiomeric product well from the other. It is difficult to be precise about how many trajectories show such effects, because the question of what constitutes an “abrupt” change in direction requires a qualitative value judgment. However, visual inspection of 500 trajectories suggests that, very roughly, 40% of the trajectories in the TFIPA solvent show such behaviour. Similar effects are found in CHFClBr solvent, but the dependence of the final product choice on the enantiomeric identity of the solvent is much greater for TFIPA. This last comment is simply a restatement of the facts reported in Table 1, but the microscopic observations reported in Fig. 5–8 provide some insight, we believe, into the mechanism by which the solvent influences the product ratio. That said, the exact reasons for the difference in solvent effect between TFIPA and CHFClBr on the product ratio are not yet at hand. However, one clue about a potentially important factor comes from examination of the nature of the transient close solvent–solute contacts occurring during the ring opening in TFIPA. After correction for statistical factors (i.e. accounting for numbers of atoms of a given type in each solvent and solute molecule) one finds that 42% of the transient close contacts involve the solvent hydroxyl hydrogen and one of the fluorines of the solute. Hence, it appears as if a hydrogen-bonding interaction may play an important role for TFIPA. No such effect is possible for CHFClBr. Current work is exploring this possibility further.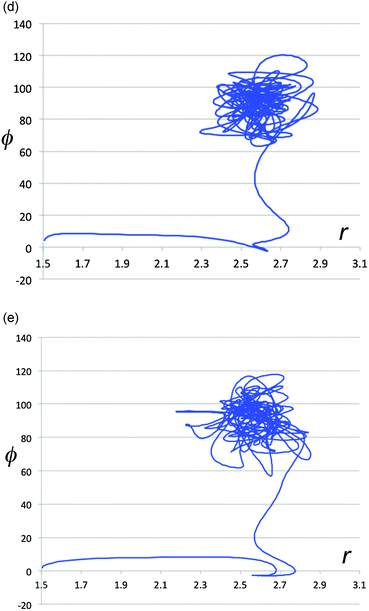 | ||
| Fig. 8 Projections of representative trajectories in (S)-TFIPA onto the space (r,ϕ). The coordinates, depicted at the top of Fig. 7a, are the length of the breaking C–C bond (r) in Å and the F–C–C–F dihedral angle (ϕ) in degrees. | ||
It is instructive to compare the (r,ϕ) projections of the TFIPA solution trajectories, depicted in Fig. 8, with similar projections for gas-phase trajectories, two examples of which are shown in Fig. 9. As described earlier, the gas-phase trajectories are able to pass from one product well to another on the PE surface. But more importantly, for none of the trajectories inspected visually is there any evidence of abrupt changes in direction when the ring first opens. Consequently it seems safe to assign such effects to solvent–solute interactions for the solution-phase simulations.
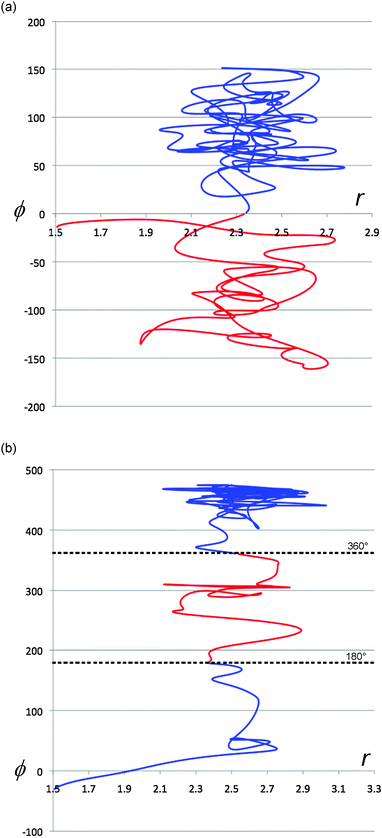 | ||
| Fig. 9 Representative projections of trajectories from gas-phase simulations. The coordinates are the same as those defined for Fig. 8. Trajectories are colour coded after the ring opening has occurred to illustrate whether they are in the PE surface well for the (R) (blue) or (S) (red) enantiomer of the product. | ||
The conversion of potential energy of the solute into kinetic energy and then into potential energy of solvent–solute interactions can be thought of as occurring in two stages. The first accompanies the ring opening, which initially occurs without significant torsion about the bonds from the “carbenoid” carbon of the reactant to the two other carbons of the ring. This motion brings the system close to a transition structure for allene isomerisation, and, according to Fig. 1 is accompanied by a drop of roughly 40 kcal mol−1 in PE. It is this step of the reaction that is responsible for the transient close contacts between solvent and solute. A slightly larger drop in PE occurs in the second stage of the reaction, as the torsions leading to one enantiomer or other of the product occur, but there is not much evidence of a second peak in the close-contacts trace of Fig. 7. There are probably two contributing factors to this outcome. The first is that the reaction of the solute causes an expansion of the solvent cavity in which it sits. This is revealed in Fig. 10, which plots the average centre-of-mass distance of the solute (excluding the N2) to the nearest ten solvent molecules, for each of the solvents studied. This expansion implies that the solvent molecules are, on average, somewhat further away by the time the second stage of the reaction occurs. It also seems likely the torsions represent less dramatic changes in geometry of the solute than did the original ring opening.
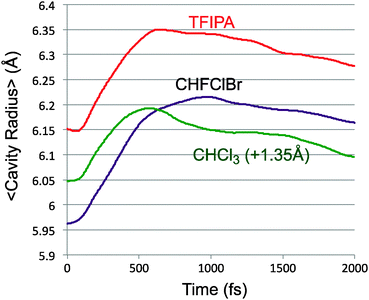 | ||
| Fig. 10 Average distance of the solute (excluding N2) from the ten nearest solvent molecules. The trace for CHCl3 is shifted vertically by 1.35 Å for clarity. | ||
5. Conclusions
The study that inspired the present work was a model trajectory calculation on a surface exhibiting reaction-path bifurcation. It predicted unusual sensitivity of the product ratio to the rate of dissipation of kinetic energy from the reactive species. That unusual, highly non-monotonic relationship30 depended on the ability of trajectories to cross from one product well to the other. In the present work, another kind of unusual interaction of the reacting molecule with the bath has been found. Here, trajectories for the solution-phase simulations do not cross from one product well to the other – dissipation of kinetic energy from the solute is too efficient for that to be possible. However, it is found that the initial stage of the exothermic ring-opening reaction fosters transient, unusually strong solvent–solute interactions. Crucially these occur at a time when, for most trajectories, the “decision” about which product to form has not been made. In that regard, the existence of the reaction-path bifurcation is vital. In a more conventional reaction, having two products formed by separate channels, each with its own transition state, similar strong solvent–solute contacts might be engendered in the regions of the product wells (especially if the reactions were exothermic and involved large geometry changes, as the present one does), but they would be too late to influence the product ratio.The results of the present study suggest that solvent effects in general, and solvent-induced enantiomeric excess in particular, might be stronger in some reactions with bifurcating IRCs than in more conventional reactions. What remains unclear, however, is why the two chiral solvents investigated in the present work show such different effects. As described above, there is some indication that hydrogen bonding may be involved in the answer, and it also seems likely that the notable differences for the solute energy loss depicted in Fig. 5 could play a role as well, but at present the complete picture is not in place. It seems worth investigating this problem further, because elucidating the exact factors that distinguish the solvent effects of CHFClBr and TFIPA could lead to a broader ability to predict and control solvent effects on reactions of the kind studied here.
It is also irresistible to comment that experimental test of the predictions in the present work would be most welcome!
Acknowledgements
We thank Prof. Stephen Wiggins (University of Bristol School of Mathematics) for bringing ref. 52 to our attention. Provision of free access to the source code for the Tinker program by Professor Jay Ponder is gratefully acknowledged. BKC and JNH acknowledge the support of the UK Engineering and Physical Sciences Research Council (Grant No. EP/K000489/1 to BKC and EP/L005913/1 to JNH). DRG acknowledges funding as a Royal Society Research Fellow.Notes and references
- S. F. Mason, Chirality, 1991, 3, 223–226 CrossRef CAS
.
- K. Brak and E. N. Jacobsen, Angew. Chem., Int. Ed., 2013, 52, 534–561 CrossRef CAS PubMed
.
- S. E. Denmark, W. E. Kuester and M. T. Burk, Angew. Chem., Int. Ed., 2012, 51, 10938–10953 CrossRef CAS PubMed
.
- Y. M. Wang, A. D. Lackner and F. D. Toste, Acc. Chem. Res., 2014, 47, 889–901 CrossRef CAS PubMed
.
- A. Faljoni, K. Zinner and R. G. Weiss, Tetrahedron Lett., 1974, 1127–1130 CrossRef CAS
.
- D. R. Boyd and D. C. Neill, J. Chem. Soc., Chem. Commun., 1977, 51–52 RSC
.
- W. H. Laarhoven and T. J. H. M. Cuppen, J. Chem. Soc., Chem. Commun., 1977, 47 RSC
.
- W. H. Laarhoven and T. J. H. M. Cuppen, J. Chem. Soc., Perkin Trans. 2, 1978, 315–318 RSC
.
- D. Seebach and W. Langer, Helv. Chim. Acta, 1979, 62, 1701–1709 CrossRef CAS
.
- M. Bucciarelli, A. Forni, I. Moretti and G. Torre, J. Chem. Soc., Perkin Trans. 1, 1980, 2152–2161 RSC
.
- M. Bucciarelli, A. Forni, I. Moretti and G. Torre, J. Org. Chem., 1983, 48, 2640–2644 CrossRef CAS
.
- P. Valtazanos, S. T. Elbert and K. Ruedenberg, J. Am. Chem. Soc., 1986, 108, 3147–3149 CrossRef CAS
.
- P. Valtazanos and K. Ruedenberg, Theor. Chim. Acta, 1986, 69, 281–307 CrossRef CAS
.
- S. Xantheas, S. T. Elbert and K. Ruedenberg, Theor. Chim. Acta, 1991, 78, 365–395 CrossRef CAS
.
- W. Quapp, M. Hirsch and D. Heidrich, Theor. Chem. Acc., 1998, 100, 285–299 CrossRef CAS
.
- S. L. Debbert, B. K. Carpenter, D. A. Hrovat and W. T. Borden, J. Am. Chem. Soc., 2002, 124, 7896–7897 CrossRef CAS PubMed
.
- W. Quapp, J. Mol. Struct., 2004, 695–696, 95–101 CrossRef CAS
.
- D. H. Ess, S. E. Wheeler, R. G. Iafe, L. Xu, N. Celebi-Olcum and K. N. Houk, Angew. Chem., Int. Ed., 2008, 47, 7592–7601 CrossRef CAS PubMed
.
- T. Katori, S. Itoh, M. Sato and H. Yamataka, J. Am. Chem. Soc., 2010, 132, 3413–3422 CrossRef CAS PubMed
.
- M. Weitman and D. T. Major, J. Am. Chem. Soc., 2010, 132, 6349–6360 CrossRef CAS PubMed
.
- H. Yamataka, M. Sato, H. Hasegawa and S. C. Ammal, Faraday Discuss., 2010, 145, 327–340 RSC
.
- S. Itoh and H. Yamataka, Chem. – Eur. J., 2011, 17, 1230–1237 CrossRef CAS PubMed
.
- S. Itoh, N. Yoshimura, M. Sato and H. Yamataka, J. Org. Chem., 2011, 76, 8294–8299 CrossRef CAS PubMed
.
- W. Quapp and B. Schmidt, Theor. Chem. Acc., 2011, 128, 47–61 CrossRef CAS
.
- J. Rehbein and B. K. Carpenter, Phys. Chem. Chem. Phys., 2011, 13, 20906–20922 RSC
.
- Y. Yamamoto, H. Hasegawa and H. Yamataka, J. Org. Chem., 2011, 76, 4652–4660 CrossRef CAS PubMed
.
- R. Akimoto, T. Tokugawa, Y. Yamamoto and H. Yamataka, J. Org. Chem., 2012, 77, 4073–4078 CrossRef CAS PubMed
.
- D. T. Major and M. Weitman, J. Am. Chem. Soc., 2012, 134, 19454–19462 CrossRef CAS PubMed
.
- W. Quapp and J. M. Bofill, J. Math. Chem., 2012, 50, 2061–2085 CrossRef CAS
.
- P. Collins, B. K. Carpenter, G. S. Ezra and S. Wiggins, J. Chem. Phys., 2013, 139, 154108 CrossRef PubMed
.
- B. K. Carpenter, Theor. Chem. Acc., 2014, 133, 1–8 CrossRef CAS
.
- Y. J. Hong and D. J. Tantillo, Nat. Chem., 2014, 6, 104–111 CrossRef CAS PubMed
.
- D. A. Singleton, C. Hang, M. J. Szymanski, M. P. Meyer, A. G. Leach, K. T. Kuwata, J. S. Chen, A. Greer, C. S. Foote and K. N. Houk, J. Am. Chem. Soc., 2003, 125, 1319–1328 CrossRef CAS PubMed
.
- K. K. Kelly, J. S. Hirschi and D. A. Singleton, J. Am. Chem. Soc., 2009, 131, 8382–8383 CrossRef CAS PubMed
.
- O. Castano, R. Palmeiro, L. M. Frutos and J. Luisandres, J. Comput. Chem., 2002, 23, 732–736 CrossRef CAS PubMed
.
- Y. Zhao and D. G. Truhlar, Theor. Chem. Acc., 2008, 120, 215–241 CrossRef CAS
.
- E. Kraka and D. Cremer, Acc. Chem. Res., 2010, 43, 591–601 CrossRef CAS PubMed
.
- A. Warshel and R. M. Weiss, J. Am. Chem. Soc., 1980, 102, 6218–6226 CrossRef CAS
.
- S. C. L. Kamerlin and A. Warshel, Faraday Discuss., 2010, 145, 71–106 RSC
.
- S. C. L. Kamerlin and A. Warshel, Wiley Interdiscip. Rev.: Comput. Mol. Sci., 2011, 1, 30–45 CrossRef CAS
.
- D. R. Glowacki, A. J. Orr-Ewing and J. N. Harvey, J. Chem. Phys., 2011, 134, 214508 CrossRef PubMed
.
- H. B. Schlegel and J. L. Sonnenberg, J. Chem. Theory Comput., 2006, 2, 905–911 CrossRef CAS
.
- Y. Kim, J. C. Corchado, J. Villa, J. Xing and D. G. Truhlar, J. Chem. Phys., 2000, 112, 2718–2735 CrossRef CAS
.
- J. W. Ponder and F. M. Richards, J. Comput. Chem., 1987, 8, 1016–1024 CrossRef CAS
.
- C. E. Kundrot, J. W. Ponder and F. M. Richards, J. Comput. Chem., 1991, 12, 402–409 CrossRef CAS
.
- J. Grafenstein, E. Kraka, M. Filatov and D. Cremer, Int. J. Mol. Sci., 2002, 3, 360–394 CrossRef
.
- N. L. Allinger, Y. H. Yuh and J. H. Lii, J. Am. Chem. Soc., 1989, 111, 8551–8566 CrossRef CAS
.
- J. H. Lii and N. L. Allinger, J. Phys. Org. Chem., 1994, 7, 591–609 CrossRef CAS
.
- J. H. Lii and N. L. Allinger, J. Comput. Chem., 1998, 19, 1001–1016 CrossRef CAS
.
- N. Goga, A. J. Rzepiela, A. H. de Vries, S. J. Marrink and H. J. C. Berendsen, J. Chem. Theory Comput., 2012, 8, 3637–3649 CrossRef CAS
.
-
W. H. Press, S. A. Teukolsky, W. T. Vetterling and B. P. Flannery, Numerical Recipes in Fortran 77, Cambridge University Press, Cambridge, UK, 1992 Search PubMed
.
- J. S. Bader, B. J. Berne, E. Pollak and P. Hanggi, J. Chem. Phys., 1996, 104, 1111–1119 CrossRef CAS
.
Footnote |
| † Electronic supplementary information (ESI) available: Supplementary MM3 parameters, solvent boundary box dimensions and densities, EVB H12 function and offsets, and M062-2X/ccpVTZ geometries and energies for TFIPA hydrogen bonded complexes, and a residuals plot of the correlation between EVB and DFT points. See DOI: 10.1039/c4cp05078a |
| This journal is © the Owner Societies 2015 |

