Layer-by-layer coating of alginate matrices with chitosan–alginate for the improved survival and targeted delivery of probiotic bacteria after oral administration†
Michael T.
Cook
ab,
George
Tzortzis
c,
Vitaliy V.
Khutoryanskiy
*b and
Dimitris
Charalampopoulos
*a
aFood and Nutritional Science, University of Reading, Reading, RG6 6AD, UK. E-mail: D.Charalampopoulos@reading.ac.uk; Tel: +44 (0) 118 378 8216
bSchool of Pharmacy, University of Reading, Reading, RG6 6AD, UK. E-mail: V.Khutoryanskiy@reading.ac.uk; Tel: +44 (0) 118 378 6119
cClasado Research Services Ltd, Science and Technology Centre, University of Reading, Earley Gate, Whiteknights Road, Reading, RG6 6BZ, UK. E-mail: George.Tzortzis@clasado.com; Tel: +44 (0) 118 378 8978
First published on 5th November 2012
Abstract
The oral administration of probiotic bacteria has shown potential in clinical trials for the alleviation of specific disorders of the gastrointestinal tract. However, cells must be alive in order to exert these benefits. The low pH of the stomach can greatly reduce the number of viable microorganisms that reach the intestine, thereby reducing the efficacy of the administration. Herein, a model probiotic, Bifidobacterium breve, has been encapsulated into an alginate matrix before coating in multilayers of alternating alginate and chitosan. The intention of this formulation was to improve the survival of B. breve during exposure to low pH and to target the delivery of the cells to the intestine. The material properties were first characterized before in vitro testing. Biacore™ experiments allowed for the polymer interactions to be confirmed; additionally, the stability of these multilayers to buffers simulating the pH of the gastrointestinal tract was demonstrated. Texture analysis was used to monitor changes in the gel strength during preparation, showing a weakening of the matrices during coating as a result of calcium ion sequestration. The build-up of multilayers was confirmed by confocal laser-scanning microscopy, which also showed the increase in the thickness of coat over time. During exposure to in vitro gastric conditions, an increase in viability from <3 log(CFU) per mL, seen in free cells, up to a maximum of 8.84 ± 0.17 log(CFU) per mL was noted in a 3-layer coated matrix. Multilayer-coated alginate matrices also showed a targeting of delivery to the intestine, with a gradual release of their loads over 240 min.
Introduction
Probiotic bacteria have been postulated to play a positive role in maintaining health1 since their inception by Metchnikov,2 and have been used to alleviate the symptoms of traveller's diarrhoea3 and irritable bowel syndrome,4 amongst other conditions.5 ‘Probiotic’ is a broad term covering many strains of microbes, the majority of which belong to Gram-positive Lactobacilli or Bifidobacterium. If these microbes are orally administered they face an acid challenge from the stomach before they act in the intestine. This acid exposure can lead to a reduction in the number of viable cells surviving passage through the stomach after oral administration.6,7 Cell death occurs in this acidic environment through a reduction in cytoplasmic pH, causing the loss of enzymatic activity and denaturing of many cell components.8 Probiotic bacteria typically have strain-dependent levels of acid tolerance,9,10 with Bifidobacterium being generally less tolerant of low pH. One potential method to reduce cell death during gastric passage is the encapsulation of probiotic microorganisms into polymer matrices.11–16 These matrices may impart protection to the bacteria from acid, enzymatic action and bile salts, as well as offering an opportunity to target release to specific sites of the gastrointestinal (GI) tract.16,17The most popular probiotic encapsulation matrix is based on calcium cross-linked alginate.14 Alginate, a naturally occurring polysaccharide, is composed of randomly 1–4 linked β-D-mannuronic acid and α-L-guluronic acid.18,19 Guluronic acid interacts very strongly with divalent cations, forming an ‘egg-box’ junction, which results in the formation of cross-links between the alginate macromolecules.18,20,21 On a macroscopic level this produces a hydrogel matrix with some highly desirable properties, resulting in its popularity in the fields of bacterial encapsulation, stem cell encapsulation22 and biomaterials.23 Additionally, alginate-based capsules have been shown to target delivery of the encapsulated material to the intestine by in vitro24,25 models and to increase the numbers of viable bacteria in the colon in vivo.26,27 Delivery of encapsulated cells from these materials is not governed by diffusion processes, as for small molecules, but by dissolution of the bulk matrix. This is a result of the large size of the bacteria (>1 μm) relative to the pores of the gel (<200 nm).28 Retention of bacteria at low pH is aided by the acid-gel character of alginate19 which allows the formation of a gel by aggregation of the polymer chains below the pKa of the acid groups in the monomers (∼3.3–3.5), whilst dissolution is governed by sequestration of calcium from within the alginate matrix by agents such as phosphates and citrates, and competition for binding sites on the alginate chain by monovalent cations, such as sodium.20,29
The coating of alginate matrices with oppositely charged polymers is an effective way of modulating the properties of the material.30–32 It has been shown that coating alginate with the cationic polysaccharide chitosan increases the survival of microorganisms entrapped in the alginate matrix when the formulation is exposed to solutions simulating gastric passage.12,24 In addition, there has also been noted a slight retardation of release with the addition of this polymer coat.24 The aim of our research is to produce a multilayer alginate–chitosan coat on alginate matrices using a layer-by-layer (LBL) approach guided by electrostatic self-assembly. The potential benefit of this coat is improved protection and controlled release of probiotic cells under gastrointestinal conditions.
Chitosan is produced by the deacetylation of chitin,33 a polysaccharide that is present in various natural materials. This modification results in a structure mostly comprised of 1 → 4 linked glucosamine (2-amino-2-deoxy-D-glucose) residues,33,34 with the minority of the macromolecules in the acetylated form (N-acetylglucosamine) due to incomplete deacetylation. The amine functionality means that chitosan is a weak base, which in this application will allow electrostatic interaction with the acidic residues on the alginate matrix. Though chitosan is a known antimicrobial agent,35 it only associates to the periphery of alginate matrices, penetrating into the bulk gel very slowly. This means that any encapsulated bacteria should be shielded from interaction with the polymer. The high recovery of cells from these materials, in multiple publications, reflects this.36–38 Chitosan is biodegraded by microbial action in the body by a variety of enzymes.39 However, hydrolysis by the enzyme chitosanase has been shown to decrease over twenty-fold when the chitosan is ionically bound to the surface of an alginate matrix.40 As a result, this is unlikely to be a concern in our application. Chitosan has been noted for its mucoadhesive properties, which are retained after the association with alginate gels.41
Layer-by-layer technology has often been utilised in research for the production of novel materials with tailorable properties dependent in part on the number of layers formed.42,43 Though fundamentally a time-consuming process, the materials produced can impart some unusual properties, different from their constituent polymers, without the need for chemical modification. These LBL assemblies may be produced by a large range of materials through a variety of different interactions such as hydrogen-bonding44,45 or, as in our case, electrostatics.46 For the most part, LBL research focuses on application to materials science,42 biosensing47 and controlled release.48–50 LBL processing may be automated, in order to ease this fundamentally laborious process.51 For our application we intend to study the effect of increasing numbers of polyelectrolyte layers on both the survival and controlled release of the probiotic bacterium, Bifidobacterium breve, after encapsulation in an alginate matrix. Additionally, the protective effect of alginate encapsulation alone has been shown to decrease with the particle size,14 so further formulation which improves the potency of these capsules in protecting acid-sensitive probiotics would be greatly advantageous to counter this effect.
The aim of this study is to evaluate the production of alginate matrices coated with multilayers of alternating alginate and chitosan as a viable oral formulation to protect probiotic bacteria from low pH, as well as to target their release to the intestine. These multilayer coated alginate matrices (MCAMs) will be studied using various physicochemical methods and the efficacy of the formulation tested in vitro. Whilst there has been the study of layer-by-layer deposition of polyelectrolytes directly upon probiotic cells,52,53 to our knowledge there has not been any investigation on the ability of these multilayers to protect and deliver encapsulated cells.
Materials
Sodium alginate (19–40 kDa), low molecular weight chitosan (103 kDa, degree of deacetylation: 85.6%) and fluorescein isothiocyanate (FITC) were purchased from Sigma-Aldrich (Gillingham, UK). Bifidobacterium breve NCIMB 8807 was purchased from the National Collection of Industrial Food and Marine Bacteria (Aberdeen, UK). Wilkins–Chalgren (WC) anaerobe agar and phosphate-buffered saline (PBS) were purchased from Oxoid (UK). The Biacore™ CM5 chip was purchased from GE Healthcare (Hatfield, UK). Alginate solutions were purified by microfiltration (0.4 μm) before use to remove impurities, most likely of plant origin.54 All other reagents were used without further purification. For the experiments involving the use of B. breve, materials were sterilized in an autoclave (121 °C, 15 min) unless otherwise specified.Methods
Biacore™ analysis of alginate–chitosan multilayers
For Biacore™ analysis, a CM5 chip was used on a Biacore™ 3000 instrument. The gold surface on the CM5 chip was provided functionalized with a layer of carboxymethylated dextran. After docking of a CM5 chip, the channel to be used was twice primed with a 50 mM phosphate buffer (pH 6.0) before leaving to stabilize at a flow of 15 μL min−1. 0.4% (w/v) Chitosan solution (in 0.1 M acetic acid adjusted to pH 6.0 with 1 M NaOH, 20 μL) was injected into the channel and the system was allowed to stabilize for 1 h. This was representative of the first layer of chitosan association to the outside of the alginate matrix. After stabilization, 0.04% (w/v) alginate solution (20 μL) was injected and the newly formed layer was allowed to stabilize for 10 min. This process was then repeated to form up to 5 alternating layers of alginate and chitosan onto the surface of the gold. The stability of these layers was then tested by repeated injection of the simulated gastric solution (0.2% (w/v) NaCl, made to pH 2.0 with 1 M HCl) or the simulated intestinal solution (0.68% (w/v) monobasic potassium phosphate, made to pH 7.2 with 1 M NaOH) over 90 minutes. These pHs were intended as reasonable estimates for the pH of the stomach and a high pH of the small intestine.55–57 As a control, 0.4% (w/v) chitosan solution (in 0.1 M acetic acid adjusted to pH 6.0 with 1 M NaOH, 20 μL) was injected into the channel and allowed to stabilize for 1 h. This was followed by the injection of another 0.4% (w/v) chitosan solution (in 0.1 M acetic acid adjusted to pH 6.0 with 1 M NaOH, 20 μL) and an hour of stabilization until a total of 5 injections had been made. As Biacore™ is very sensitive to slight changes in solutions, alginate–chitosan and chitosan only multilayers were produced using the same batch of chitosan and eluent. The response given by the repeated injection of chitosan was normalized with respect to the response given by the corresponding alginate–chitosan injections, allowing us to express the association relatively, as a ratio.Preparation of multilayer-coated alginate capsules
Alginate matrices were produced by an extrusion/external gelation method. A 2% (w/v) alginate solution (1 mL) was extruded using a syringe and pump (2 mL min−1) into a 0.05 M CaCl2 solution (50 mL). Gel matrices were formed immediately upon contact with the CaCl2 solution, and allowed to harden for 30 min. After hardening, the alginate matrices were removed from the solution via filtration and either used immediately or coated with multilayers. Coating was achieved by alternately dipping into 0.4% (w/v) chitosan solution (in 0.1 M acetic acid adjusted to pH 6.0 with 1 M NaOH, 10 mL, 10 min) and 0.04% (w/v) alginate solution (10 mL, 10 min). For future reference, 1 layer of chitosan refers to a single layer of chitosan on the surface of the alginate matrix, and 2 or more layers correspond to the application of alginate and chitosan layers upon the surface of this chitosan coat.Determination of strength and swelling of multilayer matrices during processing
The diameters of uncoated alginate matrices, and those coated with 1–5 layers of alginate and chitosan were measured using a light microscope (Leica DM2500) and image analysis software (ImageJ), as swelling was noted during the preparation of the formulation. The compressive strength of these MCAMs as the multilayer coats were built up was determined by texture analysis (Texture Analyser, Stable Microsystems). Texture analysis was conducted with a P\1K steel probe at a rate of 1 mm s−1, using a trigger force of 0.01 N. The compressive strength was taken as the point at which the gel was seen to fracture on the graph of compressive force against distance (example available in the ESI†). Rehardening of the gels, for reasons described in later discussion, was conducted by exposure of the capsules to 0.05 M CaCl2 (50 mL, adjusted to pH 6.0 with 0.1 M HCl, 30 min).Determination of coat thickness by confocal laser-scanning microscopy (CLSM)
The thickness of the coat on the outside of the alginate matrices was determined by CLSM. FITC-labeled chitosan was prepared by previously reported methods.24 In brief, to a 1% (w/v) chitosan solution (in 0.1 M acetic acid, 100 mL) was added dehydrated methanol (100 mL) followed by a 0.2% (w/v) FITC solution (methanol, 50 mL). The reaction was allowed to proceed in darkness at room temperature (3 h) before precipitation into 0.1 M NaOH (1 L). This precipitate was then dialyzed in deionized water (4 L, replaced daily) until FITC was not present in the dialysis jar, as determined by UV-spectrofluorometry (Jasco FP-6200, λexc: 488 nm, λemi: 515 nm). The sample was then lyophilized until complete dehydration. The lyophilized product was re-suspended to a concentration of 0.4% (w/v) in 0.1 M acetic acid, and adjusted to pH 6.0 with 1 M NaOH. This solution was then used to produce MCAMs as described previously. These matrices were imaged using a Leica SP2 confocal microscope (λexc: 488 nm), which allowed the visualization of chitosan on the surface of the gel. From these images, the coat thickness was measured using the image analysis software ImageJ. The thickness of the coat as a function of the number of layers could then be determined in order to confirm the association and aid the understanding of matrix structure.Encapsulation of B. breve into multilayer alginate–chitosan matrices
B. breve was streaked onto WC agar from a cell bank and allowed to grow in an anaerobic chamber (37 °C, 48 h). A single colony from this plate was inoculated into Tryptone-Phytone-Yeast (TPY) broth (10 mL) and incubated (37 °C, 22 h). After growth to an OD600 of ∼2.0, the cells were centrifuged (3200 rpm, 10 min), the supernatant was removed and the cell pellet was washed with PBS. The cell pellet was then resuspended in 2% (w/v) alginate solution (10 mL) previously sterilized by microfiltration (0.4 μm). This solution was then used to produce MCAMs as described previously. The chitosan solutions used in these experiments were sterilized by microfiltration (0.4 μm).Viability of free and encapsulated B. breve in a simulated gastric solution
For free cells, B. breve was grown as described above in TPY broth. Once grown, a 100 μL sample was taken for enumeration by the serial dilution and plate count method. Briefly, cells were diluted in a series of vials containing PBS, before spreading on solid WC agar. Colonies were counted after 48 h growth in an anaerobic cabinet (37 °C). After enumeration, the cell suspension was centrifuged (3200 rpm, 10 min) and the supernatant removed, followed by washing with PBS (1 mL). The remaining pellet was then suspended in the simulated gastric solution (10 mL) and incubated (37 °C, 2 h, with shaking at 100 rpm). Samples were taken at 1 h intervals and enumerated as described above.For encapsulated cells, 3 batches of MCAMs containing B. breve were produced from the same broth of cells, as only 1 mL was needed to prepare each batch. Two of these batches containing B. breve were placed into the simulated gastric solution and incubated (37 °C, with shaking at 100 rpm). The remaining batch of matrices was placed directly into a 100 mL PBS solution and incubated (1 h, with shaking at 100 rpm). These half dissolved MCAMs were then made homogenous using a stomacher (Seward stomach 400 circulator, 20 min) and enumerated as described previously to give a starting cell concentration. During this procedure one of the two batches of matrices in the simulated gastric solution was removed from the gastric solution at 1 and 2 h incubation. These matrices were then dissolved and enumerated using the same method as for the starting cell concentration reading.
Release of cells from multilayer alginate–chitosan matrices under in vitro gastrointestinal solutions
MCAMs containing cells were produced as above. The matrices were then placed first into the simulated gastric solution (10 mL, pH 2.0) and incubated (37 °C, 60 min, with shaking at 100 rpm). Samples were taken from this solution at 0, 30 and 60 min and the number of cells in solution determined by counting using a light microscope and a hemocytometer on a Nikon Microphot-SA microscope. After 60 min incubation, the MCAMs were removed from the gastric juice by filtration and placed into the simulated intestinal solution (pH 6.0, 50 mL) and incubated (37 °C, 60 min, with shaking at 100 rpm). This pH was chosen to better represent the proximal small intestine.55 The cells were counted at 0 and 60 min before removal by filtration and resuspension in the simulated intestinal solution (pH 7.2, 50 mL), followed by incubation (37 °C, 180 min, with shaking at 100 rpm). This pH was chosen to represent the distal portion of the small intestine. At 0, 60, 120 and 180 minutes in buffer, the cells were counted as before. For each experiment an additional batch of matrices was produced and instantly placed into PBS (100 mL) and incubated (60 min, with shaking at 100 rpm). These capsules were then placed into a stomacher (Seward stomach 400 circulator, 20 min) and the cells counted using a microscope and a hemocytometer to give the starting cell numbers for each experiment.Results and discussion
In order to interpret the data produced using the Biacore™ 3000 it is important to understand what, specifically, it is measuring. Inside the instrument is a gold chip, which has been functionalized with carboxymethylated dextran (CDX). Onto this a series of microfluidic channels are placed, over which the sample and the eluent are flowed. To the underside of this chip is a semicircular glass prism through which a light source is passed at an angle of total internal reflection; the magnitude of this angle is measured by the Biacore™. The light source excites the valence electrons present on the gold chip so that they oscillate parallel to the gold. This oscillation is called Surface Plasmon Resonance (SPR). Changes in the refractive index close to the chip result in an interference with the SPR, which manifests itself as a change in the angle of reflection through the prism, which the Biacore™ can detect. Any analytes interacting with the CDX surface change the refractive index close to the chip, and therefore the angle of reflection. This gives a response to the Biacore™, allowing us to detect associations between macromolecules and the surface of the chip by changes in response units (RUs).9,58,59Recently, Biacore™ has been shown to be an effective method for monitoring the production of polymer multilayers.7,8,60 The sensorgram produced by alternating injections of alginate and chitosan is shown in Fig. 1A. Upon injection of the chitosan solution, there was a response associated with the binding of chitosan to the CDX; this was followed by a gradual increase in RU after binding, associated with the rearrangement of the polymer chains and adaptation to the new buffer system (Fig. 1B). After allowing the newly formed layer to settle for 60 min, alginate was injected across the channel. There was a detectable response associated with this injection, showing the association of alginate to the chitosan layer on the chip (Fig. 1C). After alginate injection, there was a much quicker settling of the system, so only 10 min was required before the next injection. Though this response was much lower than that given by chitosan, this is likely to be mainly a consequence of the much lower concentration used. The reason for this lower concentration is due to processing issues, which will be highlighted later in the text. It is important to note that there are solvent effects seen in Biacore™, so the response for each layer should be taken as the difference in RU before and after injection (shown in Fig. 1C). This data allow us to confirm that there is build-up of alginate–chitosan multilayers on the CDX chip, so the association of these to the exterior of an alginate matrix should be achievable.
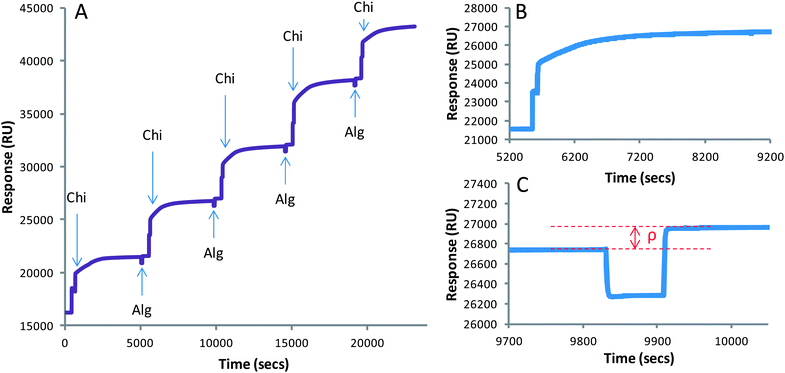 | ||
| Fig. 1 Biacore sensorgrams demonstrating the production of alginate–chitosan multilayers onto a carboxymethyldextran surface (A). Enhanced regions of the sensorgram showing the individual injections of chitosan (B) and alginate (C). The notation ‘ρ’ in (C) demonstrates that the real response for association should be taken as the difference in RU before and after the injection of an analyte, and not during the injection. | ||
It was noted that with the repeated injection of chitosan alone into the channels of the Biacore™ a similar trend to the multilayer case can be observed. It appears that chitosan was able to associate to the previous layer of chitosan, probably as a result of some nonspecific hydrophobic interactions and the high viscosity of the sample. However, the responses for the alginate–chitosan system were of a higher relative magnitude than those for chitosan alone (Fig. 2).
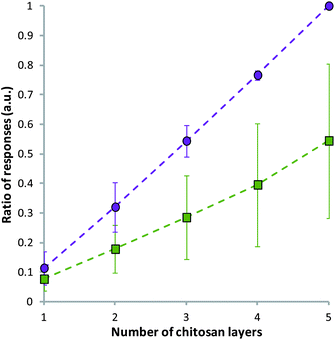 | ||
| Fig. 2 Control, showing the ratio of responses during the injection of alternating alginate–chitosan (purple circles) and repeated injection of chitosan alone (green squares) using Biacore™. The ratio was calculated as the response of an injection divided by the total response of the alginate–chitosan injections. Data given as mean (n = 3) ± standard deviation. | ||
Once the polymers had been associated to the CDX surface, the stability of their interaction could also be studied using Biacore™ (Fig. 3), and is done so for the first time in this publication. Removal of the layers would result in a loss of RU corresponding to their dissociation from the chip. Repeated injection of the simulated gastric solution (pH 2.0) over 110 min resulted in only a small loss in RU, indicating a relatively good stability of the layers. This loss corresponded to the removal of less than 1 layer of chitosan from the surface of the chip. This indicates that when associated to the surface of the alginate matrix and orally ingested, the complex should remain stable in the pH of the stomach. The multilayers also showed a similar stability after the injection of the simulated intestinal fluid at pH 7.2. Should dissolution of the MCAMs occur, they will do so with the multilayers still present on the surface.
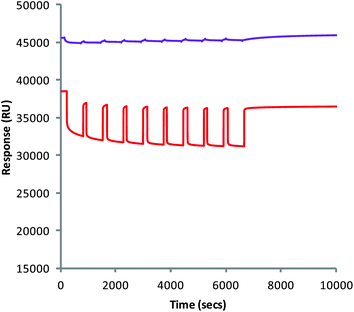 | ||
| Fig. 3 Injection of simulated gastric (purple) and intestinal (red) solutions into channels containing alginate–chitosan multilayers. | ||
It was noted that during the coating of alginate matrices with alternating layers of alginate and chitosan there was swelling and softening of the material. The swelling of the matrices was quantified using a light microscope and expressed as percentage volume change. It was seen that as the number of layers on the surface of the alginate matrix increased from 1 to 5 there was a final increase in the volume of 130.61 ± 21.16%. This swelling was met with a decrease in strength, as determined by texture analysis (Fig. 4). The strength of the uncoated alginate capsules was reduced from 5.46 ± 0.31 N to 0.97 ± 0.35 N after coating with 5 layers of the polymer. The compression testing carried out gave a force–displacement relationship, which was comparable to that previously shown, and modelled, for alginate microcapsules.61
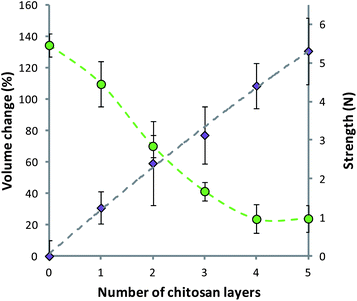 | ||
| Fig. 4 Swelling (purple diamonds) and strength (green circles) of polymer matrices during the deposition of alginate–chitosan multilayers. Data given as mean (n = 5) ± standard deviation. Fit on strength data intended as a guide to the eye. | ||
It was hypothesized that the reduction in strength of the MCAMs was a result of the removal of calcium ions from the bulk matrix by the coating polymers. Alginate has a particularly high affinity for calcium so it may be able to draw the metal ions out of the gel during exposure to the calcium cross-linked alginate matrix. It was for this reason that a 0.04% (w/v) alginate solution was used, while chitosan was kept at a 0.4% (w/v) concentration. Prior experimentation showed that using a 0.4% (w/v) solution of alginate to build-up layers resulted in very weak, deformed matrices; we hypothesize that this is a result of increased calcium ion sequestration. Suspension of the LBL-coated matrices in a 0.05 M CaCl2 solution led to a re-hardening of the MCAMs, confirming that the loss of strength was due to removal of calcium ions from the bulk alginate gel (Fig. 5).
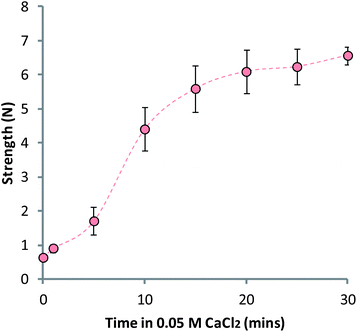 | ||
| Fig. 5 LBL-coated matrices regaining strength after exposure to a 0.05 M CaCl2 solution, adjusted to pH 6.0. Data given as mean (n = 5) ± standard deviation. | ||
The build-up of multilayers could also be confirmed by methods previously utilized for imaging chitosan association to alginate gels (Fig. 6).24 This method allowed us to view the distribution of FITC-labelled chitosan within the multilayer-coated matrices using CLSM. These images showed the appearance of fluorescence around the periphery of the gels, confirming the presence of chitosan only on the surface of the microcapsules. Bands of the polymers were not seen, indicating that the polymers interpenetrate on the surface of the matrix. The thickness of this coat can be quantified using image analysis software. It was seen that as layers were built up from 1 to 5 there was an increase in the thickness of the chitosan layer on the surface of the MCAMs from 7.2 ± 0.6 μm to 13.0 ± 3.3 μm. This increase in the coat thickness will be a result of both the increased quantity of chitosan on the surface, and swelling of the materials. The localization of chitosan on the periphery of the MCAMs is crucial to the survival of microbes within the alginate matrix, as chitosan is a known antimicrobial agent. Chitosan has a relatively high molecular weight and exists in solution as only a semi-flexible chain.62 This gives chitosan a relatively large hydrodynamic radius, and as a result its diffusion into the alginate network is very slow.
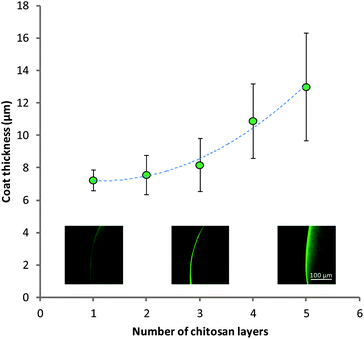 | ||
| Fig. 6 Thickness of combined chitosan layers in multilayers visualized by CLSM. Insets: example images of the chitosan coat for 1, 3 and 5 layers. Data given as mean (n = 3) ± standard deviation. | ||
In order to assess the efficacy of these MCAMs to protect probiotics from the low pH of the stomach, an in vitro method was used (Fig. 7). Exposure of the free cells to a simulated gastric solution resulted in a loss of viability from 9.23 ± 0.02 log(CFU) per mL to numbers below the limit of detection (3 log(CFU) per mL) after 1 h. Alginate matrices coated with multilayers displayed much improved survival of the cells over 2 hours exposure to the simulated gastric solution. A single coat of chitosan increased the viability up to 7.7 ± 0.40 log(CFU) per mL after two hours, which rose to 8.24 ± 0.58 log(CFU) per mL and 8.84 ± 0.17 log(CFU) per mL for 2 and 3 layers of chitosan, respectively. The increase in cell survival can be attributed to the increased buffering of acid as it penetrates into the capsules.
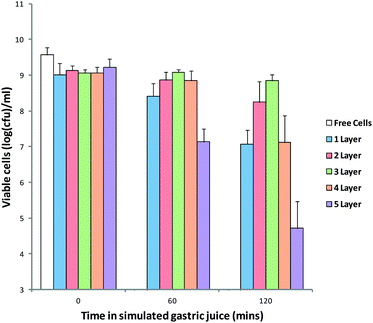 | ||
| Fig. 7 Viability of free and MCAM encapsulated B. breve during exposure to the simulated gastric solution. Limit of detection: 3.0 log(CFU) per mL. Data given as mean (n = 3) ± standard deviation. | ||
It is also possible that the alginate–chitosan complex reduces the rate of diffusion of water in and out of the alginate matrix. These experiments indicate that MCAMs have the potential to greatly improve the survival of cells during gastrointestinal transit. However, at numbers of layers above 3, there was a decrease in the survival of cells, with numbers of viable cells after 2 hours dropping to 7.12 ± 0.75 log(CFU) per mL for 4 layers and 4.72 ± 0.02 log(CFU) per mL for 5 layers of chitosan. This drop in survival can be attributed to the increased swelling and reduced cross-linking density of the capsules allowing a greater influx of gastric fluid. It is possible that this loss of viability may be avoided by the re-hardening of the capsules in CaCl2 solution, but is beyond the scope of this publication.
In order to be an effective oral delivery device, MCAMs must retain the encapsulated cells in the stomach and deliver them to the intestine. The variety of theorized modes of action of probiotics make specific targets difficult to select, but in the case of inflammatory bowel conditions the colon is often the preferred target.63 The produced MCAMs were tested for their ability to target delivery of cells in vitro (Fig. 8). MCAMs with 1, 3 and 5 layers were chosen to attempt to see any trends emerging. Exposure of these matrices to the simulated gastric solution for 60 min resulted in the loss of less than 5 log(cells) per mL from the capsules. This is important as cells released in the stomach will be swiftly killed by the pH of the gastric contents. Moving these capsules into a pH 6.0 simulated intestinal solution, to approximate the pH of the proximal small intestine, resulted in a sudden release of 6.89 ± 0.53 log(cells) per mL in the case of 5 layer matrices, but nothing was detected in the case of 1 and 3 layer coated alginate matrices. After 1 h in the pH 6.0 simulated intestinal solution all MCAMs had released a small percentage of their entrapped cells. The MCAMs were then moved into a pH 7.2 solution simulating the distal portion of the small intestine. Exposure to this solution led to a gradual release of cells over 3 hours in the case of 1 and 3 layer coated matrices, but for those coated with 1 layer of chitosan release continued only for ∼2 h. There is no significant difference in the rate of release from the 3 and 5 layer matrices. The dissolution of these materials will be a combination of effects dependent on the degree of cross-linking of the alginate matrix, particle size and stabilization of the matrices by the multilayers of alginate and chitosan on the surface. These results show that these matrices will most likely deposit the encapsulated probiotic across the length of the small intestine, with a preference to the distal regions.
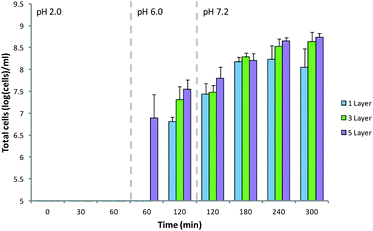 | ||
| Fig. 8 Release of B. breve from MCAMs under simulated gastrointestinal conditions. Limit of detection: 5 log(cells) per mL. Data given as mean (n = 3) ± standard deviation. | ||
Concluding remarks
The deposition of alginate–chitosan multilayers onto alginate matrices was hypothesized as an effective strategy for the encapsulation of probiotic bacteria and their protection at low pHs. Biacore™ analysis of the isolated multilayers allowed the confirmation of alginate–chitosan interaction and production of multilayers. These multilayers were then shown to be stable in both simulated gastric and intestinal solutions. Calcium cross-linked alginate matrices containing the model probiotic, B. breve, were successfully produced which were then coated with multilayers of alternating alginate and chitosan. The presence of these layers on the surface was confirmed by CLSM. The coating process resulted in a loss of strength and increase in swelling of the matrices, which was a consequence of the reduced cross-linking density of the gels. The MCAMs containing cells were exposed to the simulated gastric solution in order to evaluate their ability to protect B. breve from gastric passage. All MCAMs gave improved protection over free cells, but encapsulation in 3-layer coated matrices gave the highest recovery of viable cells. Incubation of these matrices in a sequence of solutions simulating gastrointestinal passage showed that all MCAMs had a targeting of release to the intestine, releasing their entire contents over 4 hours. These results demonstrate that MCAMs may be an effective method for improving the efficacy of orally administered probiotics by protecting them from the low pH of the stomach.Notes and references
- R. Fuller, J. Appl. Bacteriol., 1989, 66, 365–378 CrossRef CAS.
- I. Metchnikov, The Prolongation of Life, New York G.P. Putnam, 1908 Search PubMed.
- S. Guandalini, L. Pensabene, M. Abu Zikri, J. A. Dias, L. G. Casali, H. Hoekstra, S. Kolacek, K. Massar, D. Micetic-Turk, A. Papadopoulou, J. S. de Sousa, B. Sandhu, H. Szajewska and Z. Weizman, J. Pediatr. Gastroenterol. Nutr., 2000, 30, 54–60 CrossRef CAS.
- L. O'Mahony, J. McCarthy, P. Kelly, G. Hurley, F. Y. Luo, K. S. Chen, G. C. O'Sullivan, B. Kiely, J. K. Collins, F. Shanahan and E. M. M. Quigley, Gastroenterology, 2005, 128, 541–551 CrossRef.
- M. E. Sanders, J. Nutr., 2000, 130, 384S–390S CAS.
- V. Chandramouli, K. Kailasapathy, P. Peiris and M. Jones, J. Microbiol. Methods, 2004, 56, 27–35 CrossRef CAS.
- K. Kailasapathy and J. Chin, Immunol. Cell Biol., 2000, 78, 80–88 CrossRef CAS.
- P. D. Cotter and C. Hill, Microbiol. Mol. Biol. Rev., 2003, 67, 429–453 CrossRef CAS.
- C. L. Vernazza, G. R. Gibson and R. A. Rastall, J. Appl. Microbiol., 2006, 100, 846–853 CrossRef CAS.
- B. Hyronimus, C. Le Marrec, A. Hadj Sassi and A. Deschamps, Int. J. Food Microbiol., 2000, 61, 193–197 CrossRef CAS.
- K. Sultana, G. Godward, N. Reynolds, R. Arumugaswamy, P. Peiris and K. Kailasapathy, Int. J. Food Microbiol., 2000, 62, 47–55 CrossRef CAS.
- W. Krasaekoopt, B. Bhandari and H. Deeth, Int. Dairy J., 2004, 14, 737–743 CrossRef CAS.
- W. Krasaekoopt, B. Bhandari and H. C. Deeth, Food Sci. Technol., 2006, 39, 177–183 CAS.
- A. K. Anal and H. Singh, Trends Food Sci. Technol., 2007, 18, 240–251 CrossRef CAS.
- S. Rokka and P. Rantamaki, Eur. Food Res. Technol., 2010, 231, 1–12 CrossRef CAS.
- M. T. Cook, G. Tzortzis, D. Charalampopoulos and V. V. Khutoryanskiy, J. Controlled Release, 2012, 162, 56–67 CrossRef CAS.
- S. B. Doherty, M. A. Auty, C. Stanton, R. P. Ross, G. F. Fitzgerald and A. Brodkorb, Int. Dairy J., 2012, 22, 31–43 CrossRef CAS.
- O. Smidsrod and G. Skjakbraek, Trends Biotechnol., 1990, 8, 71–78 CrossRef CAS.
- K. I. Draget, G. S. Braek and O. Smidsrod, Carbohydr. Polym., 1994, 25, 31–38 CrossRef CAS.
- B. Thu, P. Bruheim, T. Espevik, O. Smidsrod, P. SoonShiong and G. SkjakBraek, Biomaterials, 1996, 17, 1031–1040 CrossRef CAS.
- K. I. Draget, M. K. Simensen, E. Onsoyen and O. Smidsrod, Hydrobiologia, 1993, 260–261, 563–565 CrossRef CAS.
- C. K. Kuo and P. X. Ma, Biomaterials, 2001, 22, 511–521 CrossRef CAS.
- A. D. Augst, H. J. Kong and D. J. Mooney, Macromol. Biosci., 2006, 6, 623–633 CrossRef CAS.
- M. T. Cook, G. Tzortzis, D. Charalampopoulos and V. V. Khutoryanskiy, Biomacromolecules, 2011, 12, 2834–2840 CrossRef CAS.
- A. M. Liserre, M. I. Re and B. Franco, Food Biotechnol., 2007, 21, 1–16 CrossRef CAS.
- J. H. Cui, Q. R. Cao and B. J. Lee, Drug Delivery, 2007, 14, 265–271 CrossRef CAS.
- M. Del Piano, S. Carmagnola, S. Andorno, M. Pagliarulo, R. Tari, L. Mogna, G. P. Strozzi, F. Sforza and L. Capurso, J. Clin. Gastroenterol., 2010, 44, S42–S46 CrossRef CAS.
- W. R. Gombotz and S. F. Wee, Adv. Drug Delivery Rev., 1998, 31, 267–285 CrossRef CAS.
- B. Thu, P. Bruheim, T. Espevik, O. Smidsrød, P. Soon-Shiong and G. Skjåk-Bræk, Biomaterials, 1996, 17, 1069–1079 CrossRef CAS.
- O. Gaserod, O. Smidsrod and G. Skjak-Braek, Biomaterials, 1998, 19, 1815–1825 CrossRef CAS.
- P. Matricardi, C. D. Meo, T. Coviello and F. Alhaique, Expert Opin. Drug Delivery, 2008, 5, 417–425 CrossRef CAS.
- J. H. Cui, J. S. Goh, P. H. Kim, S. H. Choi and B. J. Lee, Int. J. Pharm., 2000, 210, 51–59 CrossRef CAS.
- M. Rinaudo, Prog. Polym. Sci., 2006, 31, 603–632 CrossRef CAS.
- M. George and T. E. Abraham, J. Controlled Release, 2006, 114, 1–14 CrossRef CAS.
- I. M. Helander, E. L. Nurmiaho-Lassila, R. Ahvenainen, J. Rhoades and S. Roller, Int. J. Food Microbiol., 2001, 71, 235–244 CrossRef CAS.
- W. K. Ding and N. P. Shah, J. Food Sci., 2009, 74, M53–M61 CrossRef CAS.
- W. K. Ding and N. P. Shah, J. Food Sci., 2009, 74, M100–M107 CrossRef CAS.
- R. R. Mokarram, S. A. Mortazavi, M. B. H. Najafi and F. Shahidi, Food Res. Int., 2009, 42, 1040–1045 CrossRef CAS.
- T. Kean and M. Thanou, Adv. Drug Delivery Rev., 2010, 62, 3–11 CrossRef CAS.
- D. Quong, J. N. Yeo and R. J. Neufeld, J. Microencapsulation, 1999, 16, 73–82 CrossRef CAS.
- S. Chen, Y. Cao, L. R. Ferguson, Q. Shu and S. Garg, J. Microencapsulation, 2012 DOI:10.3109/02652048.2012.700959.
- Z. Tang, Y. Wang, P. Podsiadlo and N. A. Kotov, Adv. Mater., 2006, 18, 3203–3224 CrossRef CAS.
- F. Caruso, Adv. Mater., 2001, 13, 11–22 CrossRef CAS.
- S. A. Sukhishvili and S. Granick, Macromolecules, 2002, 35, 301–310 CrossRef CAS.
- W. B. Stockton and M. F. Rubner, Macromolecules, 1997, 30, 2717–2725 CrossRef CAS.
- Y. Lvov, K. Ariga, I. Ichinose and T. Kunitake, J. Am. Chem. Soc., 1995, 117, 6117–6123 CrossRef CAS.
- M. H. Yang, Y. Yang, H. F. Yang, G. L. Shen and R. Q. Yu, Biomaterials, 2006, 27, 246–255 CrossRef CAS.
- X. P. Qiu, S. Leporatti, E. Donath and H. Mohwald, Langmuir, 2001, 17, 5375–5380 CrossRef CAS.
- A. P. R. Johnston, C. Cortez, A. S. Angelatos and F. Caruso, Curr. Opin. Colloid Interface Sci., 2006, 11, 203–209 CrossRef CAS.
- M. Delcea, H. Möhwald and A. G. Skirtach, Adv. Drug Delivery Rev., 2011, 63, 730–747 CrossRef CAS.
- C. Strobel, A. Kadow-Romacker, T. Witascheck, G. Schmidmaier and B. Wildemann, Mater. Lett., 2011, 65, 3621–3624 CrossRef CAS.
- A. J. Priya, S. P. Vijayalakshmi and A. M. Raichur, J. Agric. Food Chem., 2011, 59, 11838–11845 CrossRef CAS.
- A. Diaspro, D. Silvano, S. Krol, O. Cavalleri and A. Gliozzi, Langmuir, 2002, 18, 5047–5050 CrossRef CAS.
- O. Smidsrod and A. Haug, Acta Chem. Scand., 1968, 22, 797–810 CrossRef.
- L. Kalantzi, K. Goumas, V. Kalioras, B. Abrahamsson, J. B. Dressman and C. Reppas, Pharm. Res., 2006, 23, 165–176 CrossRef CAS.
- D. F. Evans, G. Pye, R. Bramley, A. G. Clark, T. J. Dyson and J. D. Hardcastle, Gut, 1988, 29, 1035–1041 CrossRef CAS.
- J. Fallingborg, L. A. Christensen, M. Ingeman-Nielsen, B. A. Jacobsen, K. Abildgaard and H. H. Rasmussen, Aliment. Pharmacol. Ther., 1989, 3, 605–614 CrossRef CAS.
- R. L. Rich and D. G. Myszka, J. Mol. Recognit., 2001, 14, 223–228 CrossRef CAS.
- J. M. McDonnell, Curr. Opin. Chem. Biol., 2001, 5, 572–577 CrossRef CAS.
- S. C. Bizley, A. C. Williams, F. Kemp and V. V. Khutoryanskiy, Soft Matter, 2012, 8, 6782–6787 RSC.
- V. B. Nguyen, C. X. Wang, C. R. Thomas and Z. Zhang, Chem. Eng. Sci., 2009, 64, 821–829 CrossRef CAS.
- G. A. Morris, J. Castile, A. Smith, G. G. Adams and S. E. Harding, Carbohydr. Polym., 2009, 76, 616–621 CrossRef CAS.
- A. J. Greenstein, H. D. Janowitz and D. B. Sachar, Medicine, 1976, 55, 401–412 CrossRef CAS.
Footnote |
| † Electronic supplementary information (ESI) available: Strength analysis of the alginate matrix. See DOI: 10.1039/c2tb00126h |
| This journal is © The Royal Society of Chemistry 2013 |
