
 Open Access Article
 This Open Access Article is licensed under a Creative Commons Attribution-Non Commercial 3.0 Unported Licence
Decarbonizing specialty chemical manufacturing: opportunities for electrochemists†
Robert J.
Hacku
 a,
Thomas J.
Henry
a,
Michael A.
Kane
a,
Maxwell J.
Vance
a,
Zachary J.
Sebastian
a,
Glenn
Cormack
b,
Tyler J.
Petek
b,
Elisa
Seddon
b and
James R.
McKone
*ac
a,
Thomas J.
Henry
a,
Michael A.
Kane
a,
Maxwell J.
Vance
a,
Zachary J.
Sebastian
a,
Glenn
Cormack
b,
Tyler J.
Petek
b,
Elisa
Seddon
b and
James R.
McKone
*ac
aDepartment of Chemical and Petroleum Engineering, University of Pittsburgh, Pittsburgh, PA 15261, USA
bThe Lubrizol Corporation, Cleveland, Ohio, USA
cDepartment of Chemistry, University of Pittsburgh, Pittsburgh, PA 15261, USA. E-mail: jmckone@pitt.edu
First published on 10th December 2024
Abstract
To meet global decarbonization goals, the chemical industry faces the challenge of dramatically reducing greenhouse gas emissions even as demand for chemical products continues to grow. This challenge is amplified by the sector's reliance on petroleum-based hydrocarbons as both fuel and feedstock. Electrochemical synthesis is widely viewed as an attractive method to decarbonize chemical manufacturing through the use of low-carbon electricity to drive redox reactions. Presently, much of the work in this area is focused on electrochemical strategies to produce commodity chemicals. In this work, we make the case that developing electrosynthetic methods for specialty chemical manufacturing is another attractive entry point for electrochemical process design. We further outline the results of a scoping study aimed at assessing the potential to decarbonize the production of several organic compounds that are widely used in specialty chemical manufacturing by using electrochemical reactors. Our approach entails mapping the supply chain for each compound back to its petrochemical feedstock, identifying opportunities to incorporate electrochemical transformations along the supply chain, and estimating the potential for decarbonization through the adoption of electrosynthetic schemes. The results show there already exist significant opportunities to decarbonize specialty chemical transformations today, even under very conservative assumptions about process efficiency and the carbon intensity of the input electricity.
Sustainability spotlightDecarbonization of the chemical industry is crucial to reducing the impacts of climate change. Electrochemical synthesis offers alternative pathways to chemical products, reducing the need for harsh redox reagents, pressurized hydrogen, or excessive heat, the production of which contribute significantly to GHG emissions. This work develops a framework to estimate the carbon intensity of an electrosynthetic process, thereby allowing researchers to determine which transformations within a given chemical manufacturing supply chain are the most attractive for electrochemical process development. Results of this work speak to the following UN sustainable development goals: innovation and infrastructure (SDG 9), responsible consumption and production (SDG12), climate action (SDG 13), and partnerships for the goals (SDG 17). |
1 Decarbonizing chemical manufacturing
The economic and environmental impact of the chemical manufacturing industry is vast. The International Council of Chemical Associations estimated that the chemical industry directly contributed $1.1 trillion USD to the global GDP in 2017.1 The chemical industry is also a major emitter of greenhouse gases, releasing approximately 1 billion metric tons of carbon dioxide equivalents (CO2eq) into the atmosphere annually.2 Given the potentially catastrophic impact of unabated greenhouse gas (GHG) emissions, decarbonization of the chemical sector within the next several decades is rightly regarded as a human imperative.3The chemical industry faces a unique challenge in that it relies on fossil fuels as raw materials and as energy inputs for a vast array of chemical transformations. This two-fold dependence on hydrocarbons helps explain why chemical manufacturing is classified as a hard-to-decarbonize sector.4 Nonetheless, global commitments to minimize the likelihood of catastrophic climate change are driving the development of myriad strategies to reduce emissions. These strategies include efficiency improvements, fuel switching, carbon capture, process electrification, and renewable/circular feedstocks.2,5
Fig. 1 compiles data and modeling projections related to the chemical sector from the International Energy Agency (IEA) “Net Zero by 2050” Analysis.2 Analogous decarbonization roadmaps have been outlined by several other private and government-linked organizations,5–8 and while these vary considerably in the details, they share several key features in common. One shared feature is that direct CO2 emissions from the chemical sector must be reduced to near zero (with any remainder offset by carbon capture and storage) even while total chemical production increases markedly over the next several decades (Fig. 1a). Reduction of direct CO2 emissions can be accomplished through process electrification using low-carbon electricity and, where electrification is not feasible, broadened adoption of natural gas with carbon capture and green hydrogen as fuel sources.
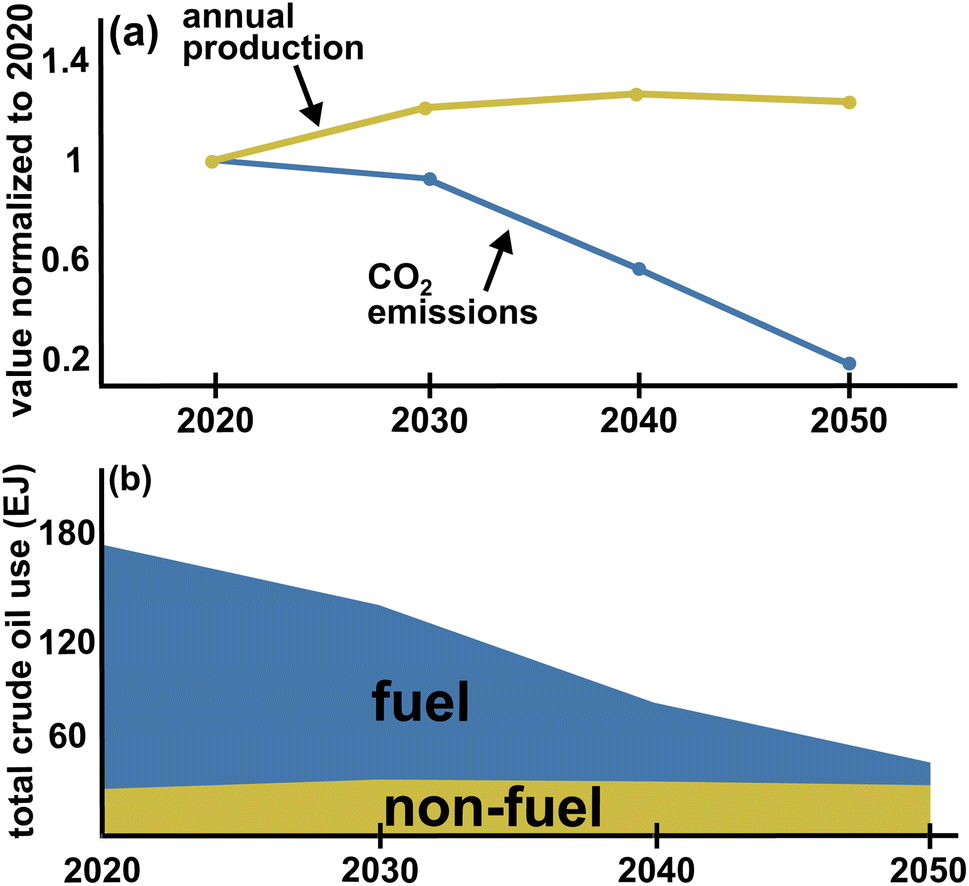 | ||
| Fig. 1 Projected changes related to chemical manufacturing, from the International Energy Agency's “Net Zero by 2050” roadmap.2 (a) CO2 emissions juxtaposed against total material production. (b) Total global crude oil demand broken down in terms of fuel (combusted) and non-fuel use. | ||
Notably, while decarbonization in the chemical sector requires minimizing the use of petroleum as an energy source, its use as a chemical feedstock may remain relatively stable even as net global CO2 emissions approach zero (Fig. 1b). This distinction between fuel- and non-fuel hydrocarbon use reflects the fact that petroleum-based inputs are difficult to replace, including in products that are key enablers for global decarbonization (e.g., urethane foam insulation for energy efficient buildings, thermosets for solar panel housings and wind turbine blades). Nonetheless, increased adoption of bio-based and recycled feedstocks is expected to mitigate the need for additional fossil resources to meet the growth in overall demand. Fig. 1b also illustrates that the proportion of global petroleum resources used for energy is expected to decrease so dramatically that, by 2050, the majority of each barrel of crude oil will not be burned but instead used to create non-fuel products.9 For the chemical industry, this requires a fundamental shift in the way petroleum is processed and used.10
The growing market for battery electric vehicles is one of several mechanisms by which the global landscape for petrochemical resources is already shifting.8 Wealthy countries with ample access to renewable resources, such as Norway, Sweden, and Iceland, are seeing sales of electric vehicles approach, and even exceed, those of combustion-based light duty cars and trucks.11 Analysis by Geels and Ayoub anticipates an evolution toward transportation electrification marked by tipping points associated with increased market share, with many global markets already approaching or exceeding those tipping points.12 Given that light duty vehicles are the primary drivers of demand for crude oil globally,13 the chemical industry needs to develop strategies for future scenarios where the availability of petrochemical feedstocks cannot be assured as byproducts of oil refining for transportation fuels.14 The potential for such a dramatic change in energy use underscores both the need and the opportunity to develop new, cleaner technologies for the chemical sector.
2 The case for specialties
The landscape of chemical manufacturing is often divided into three broad categories by classifying products as either commodity, specialty, or fine chemicals. The primary differentiating factors between these various classes involve volume, value (margin), and application, as summarized in Table 1.| Commodity | Specialty | Fine | |
|---|---|---|---|
| Composition | Pure chemical | Pure or mixture | Pure chemical |
| Production (Mt per year) | >10 | 0.1–10 | <0.01 |
| Sales margin | Low | Medium | High |
| Applications | Broad | Specific (formulated) | Specific |
| Sold based on | Composition | Performance | Composition |
Today, most research directed at decarbonizing chemical manufacturing centers on commodity chemicals, particularly the production of platform hydrocarbons through CO2 conversion. This emphasis is driven by the fact that commodity chemical production accounts for the vast majority of greenhouse gas emissions in the chemical sector.15,16 Thus, even small reductions in carbon emissions attributable to high-volume chemicals like ammonia, methanol, and ethylene translates into large impacts. Moreover, because commodity chemicals are ubiquitous in the production of other chemicals, decreasing emissions reduces impacts for all downstream products. The corresponding challenge with decarbonizing commodities is that their production is already highly capital and energy efficient, which makes it difficult for newly developed technologies to compete with traditional processes on the basis of cost or emissions.17–20
By comparison, less attention has been paid to date on decarbonizing specialty chemical production. Nonetheless, the depth and breadth of the specialty market makes it attractive for early adoption of decarbonized manufacturing strategies.
The global market for specialty chemicals includes products spread across dozens of segments, including specialty polymers, electronic chemicals, catalysts, coatings, and food additives.21 This market breadth is a potential advantage for technology development because innovations in one segment can drive adoption in others that rely on common classes of chemicals. For example, epoxy resins are a class of adhesives originally developed to make dental fixtures.22 But the durability of epoxy resins, coupled with their ability to bond an enormous variety of materials, led to widespread use as a general purpose adhesive for aerospace, auto manufacturing, food and beverage storage, and many others. Thus, decarbonizing the production of epoxy resins (e.g., by developing chemical process technologies that are broadly applicable to the production of polyepoxides) provides a mechanism for entry points into multiple market segments.23–25
Specialty chemicals are also unique in that they are developed and marketed based on performance in a target application, which provides a direct mechanism for product differentiation (and premium valuation) on the basis of environmental impact as a performance feature. Indeed, industry and end-use consumers already assign premium valuations to many types of products on the basis of reduced environmental impact.26,27 These features afford specialty chemical firms flexibility to absorb the costs of R&D and scale-up for low-carbon product offerings.
The specialty chemical sector also poses unique challenges for decarbonization. Perhaps the most significant is that most specialty chemical companies are not backward integrated—that is, they are not responsible for the production of their own chemical precursors. As a result, participation from the entire, and sometimes very long, manufacturing supply chain becomes a key bottleneck. Fig. 2 illustrates this challenge as it relates to accounting for GHG emissions—a process that is vital to validate regulatory compliance and marketing claims for low-carbon products. Life cycle assessment (LCA) methods are used to define, quantify, and interpret the environmental impacts of a product or service. Standard LCA practices classify emissions as being either scope 1 (direct emissions), scope 2 (indirect emissions associated with energy use, e.g. electricity, steam, heating, cooling, and fuel), or scope 3 (all other emissions, including those inherited from the supply chain).28 For non-integrated firms in the specialty sector, this means scope 1 and 2 emissions for company n become scope 3 emissions for company n + 1. Decarbonization therefore demands coordinated efforts across multiple commercial entities to address emissions associated with the production of platform chemicals as well as downstream chemical transformations.
 | ||
| Fig. 2 Schematic depiction of how LCA impacts are categorized along supply chains, emphasizing the fact that scope 1 and 2 emissions for a given firm become scope 3 emissions for their customers. Many chemical firms have little control over their scope 3 emissions; hence, sector-wide decarbonization only occurs with collective effort. | ||
This challenge of integration across the supply chain does not have to translate into high barriers for the development of new chemical process technologies, though. The market value of most specialty products is derived from performance properties (which often result from carefully formulated mixtures of chemicals) rather than chemical composition. This makes it easier for multiple firms to coordinate in the development of improved synthesis and purification methods because these types of activities do not compromise their competitive advantage. In fact, broad efforts to deploy modular chemical process intensification (MCPI) have already begun to transform specialty chemicals by increasing flexibility for firms to adopt advanced technologies, enabling more production with less waste and increased equipment efficiency.29
Thus, the problem is less that specialty companies are unwilling to pursue R&D related to decarbonized chemical manufacturing, and more that no single company is equipped to coordinate these R&D activities across their supply chain. Firms that are highly backward integrated are exceptions; hence, these large conglomerates are often the most deeply and visibly engaged in the development of low-carbon product offerings because they control their own manufacturing infrastructure, quite literally, from cradle to gate.30,31 But even for backward integrated firms, the ability to make well-informed decisions about where to commit resources for research, development, and deployment will be vital to transitioning away from petrochemical paradigm. Hence, there exists a tremendous need to develop roadmaps, establish research partnerships, and secure financial support for low-carbon technology development in specialties.
3 Decarbonizing specialties with electrosynthesis
Technology options to decarbonize chemical manufacturing can be broadly classified as mitigating GHG emissions that result directly from the manufacturing process or indirectly from energy inputs. The use of electrochemical reactors for chemical synthesis (also called electrosynthesis) is one of many strategies for process electrification, which abate GHG emissions from energy inputs by using low-carbon electricity sources like renewables or nuclear power. Moreover, because electrochemical reactors perform redox reactions by directly manipulating the chemical potential of electrons, electrosynthetic strategies can eliminate the need to generate and remediate harsh chemical oxidants and reductants, thereby further reducing environmental impacts.32Aside from environmental impacts, another key consideration in the implementation of any new chemical reactive process technology is the ability to produce a product profitably. In the context of electrosynthesis, downstream processing steps like product separation and pH neutralization of the electrolyte can be prohibitively expensive, as demonstrated by Nabil et al. for carboxylate production in alkaline electrolyte.33 However, these costs can accommodated if additional process efficiencies can be realized (e.g., via the elimination of a costly oxidant or reductant), or when electrosynthesis is implemented for sufficiently valuable chemical products. For example, Liu et al. recently developed a vanadium-nickel hydroxide catalyst that demonstrated excellent selectivity for the alkaline oxidation of cyclohexanone to adipate.34 A technoeconomic analysis of a membrane reactor using this catalyst paired with downstream acidification and separation steps estimated that adipic acid could be produced electrochemically at a lower cost than traditional manufacturing. These findings illustrate the particular attractiveness of specialty and fine chemical products as near-term targets for electrosynthetic processes.
Our research team recently completed a scoping study with the goal of identifying specific opportunities to decarbonize the production of specialty chemicals using electrosynthesis. This study specifically focused on electrifying the production of eight compounds (listed in Table 2), each representative of a broader class of specialty feedstocks, using electrochemical reactors. Our approach comprised three steps: (1) mapping reactive processes along each supply chain, (2) identifying and categorizing reactive process steps that can be accomplished electrochemically, and (3) estimating the potential to reduce global warming emissions through the adoption of electrochemical reactors. The following sections summarize and discuss our main findings.
| Compound | Chemical family | Carbon intensity (kg CO2eq per kg) | Production Mt (yr) | Specialty application |
|---|---|---|---|---|
| a Production volume for all linear α-olefins. | ||||
| 1,4-Butanediol | Primary alcohol | 3.76 (ref. 35) | 2.3 (ref. 36) (2019) | Urethanes, films, wire/cable coatings, solvents, epoxies |
| Diphenylamine | Aryl amine | 3.2 (ref. 37) | 1.02 (ref. 38) (2020) | Antioxidants, oil stabilizers |
| Adipic acid | Carboxylic acid | 9.4 (ref. 39) | 2.6 (ref. 40) (2020) | Polymers (amides, urethanes), gelling agents |
| Maleic anhydride | Acid anhydride | 1.33 (ref. 35) | 1.7 (ref. 41) (2017) | Lubricant dispersants, surfactants |
| Isobutylene | Branched olefin | 1.98 (ref. 39) | 27 (ref. 42) (2019) | Polymers (PiB), lubricant precursors |
| Vinyl chloride | Organohalide | 1.72 (ref. 39) | 44 (ref. 43) (2020) | Pipes, building materials, coatings |
| 1-Decene | Linear α-olefin | 1.99 (ref. 35) | 5.9 (ref. 44) (2019)a | Lubricants, polymers (olefin comonomer) |
| Methyl isobutyl ketone | Ketone | 6.5 (ref. 45) | 0.4 (ref. 46) (2017) | Lubricant production, frothing agents |
3.1 Step 1: map the chemical reaction sequence back to fossil feedstocks
The eight compounds listed in Table 2 were chosen because they are broadly representative of the types of petrochemicals used in the specialty sector—encompassing linear, branched, and aromatic hydrocarbons with a range of functional groups—and because their production generates a disproportionate amount of GHG emissions. Fig. 3 further illustrates the results of the first step in our scoping effort: mapping the reactive chemical processes used to generate each compound backward along the supply chain to the corresponding petrochemical feedstocks. Items in Fig. 3 are further annotated with GHG emissions intensities (in kg CO2eq per kg) attributable to their production, which were compiled from publicly available lifecycle inventories.35,37,39,45 | ||
| Fig. 3 Schematic depiction of manufacturing supply chains for the compounds listed in Table 2. Black arrows indicate chemical transformations involving conventional, thermally activated reactors, which dominate current industrial practice. Green arrows indicate transformations for which we identified literature precedent for the use of electrochemical reactors (note among these only chlorine production is deployed commercially at scale). Cyan arrows indicate electrochemical CO2 reduction product pathways. Numerical values listed below the chemical names correspond to estimates of cradle-to-gate GWP100 greenhouse gas emissions intensities in kg CO2eq per kg compiled from the Plastics Europe eco-profiles set (+),39 Argonne National Lab's GREET model (*),35 Winter et al. (‡),37 and Amelio et al. (GC),45 respectively. | ||
Several interesting trends emerge from this simple mapping exercise. The first is a natural classification scheme that differentiates between compounds whose aggregate global warming potential (GWP) results mostly from a single reactive process step, versus compounds for which GHG emissions are spread throughout the supply chain. Moreover, the marginal GWP associated with each step is often attributable to a single, well-defined property of the associated chemical reaction. For example, the treatment of KA oil (a mixture of cyclohexanone and cyclohexanol) with nitric acid to generate adipic acid results in a 5.2 kg CO2 per kg increase in GWP largely due to emission of N2O, a GHG that is ∼300 times more potent than CO2.47 Hence, methods to abate or even eliminate N2O emissions are a natural target for technology development—such as replacing nitric acid with dioxygen as the oxidant in adipate production.48,49
3.2 Step 2: identify reactions for which electrosynthetic methods have been demonstrated
The next step in our scoping effort involved identifying opportunities to integrate low-carbon electricity into the specialty supply chain using electrosynthesis. This entailed searching for reports in the open research literature documenting the production of each of the compounds in Table 2, as well as their precursors, using electrochemical reactors. The results are depicted in Fig. 3 as blue and green arrows and through the addition of CO2 to the diagram as an alternative carbon source. Our decision to focus on literature precedent rather than taking a more fundamental approach (e.g., by identifying all possible electrosynthetic routes to each chemical) reflects a focus on near-term opportunities to deploy renewable electricity in specialty manufacturing versus long-term opportunities to develop entirely new electrosynthetic methods.Notably, we identified literature precedent for electrochemical routes to produce 14 out of 31 compounds on our map of the supply chain for these chemicals—these are listed in Table S1 of the ESI.† The electrosynthetic processes we identified can be further organized into three categories. The first involves the electrochemical conversion of CO2 into one of several commodity chemical feedstocks such as CO, methanol, and ethylene. This type of transformation is commonly referred to as “CO2-to-X,” or direct CO2 electrolysis, and it amounts to the use of CO2 as an alternative to petrochemicals as a carbon source. A second category entails replacing an existing reactive process step with an electrochemical process. Examples from Fig. 3 include electrochemical oxidation of propylene to acrylic acid50 or electrochemical hydrogenation of nitrobenzene to aniline.51 A final category, and perhaps the greatest departure from current practice, involves electrosynthetic reactions that replace more than one reactive chemical process, effectively skipping intermediates. Examples here include electro-oxidation of cyclohexane directly to adipic acid,52 or direct conversion of CO2 into multi-carbon products like acetone.53
Among these three categories, there exists a heavy emphasis on CO2-to-X as the dominant area of research interest. As depicted in Fig. 4a, the pace of publication in the peer-reviewed research literature on the topic of CO2 conversion began to increase exponentially between 2000 and 2010, and the rate of increase has greatly outstripped that of all other types of electrosynthesis. As noted earlier, this trend is broadly consistent with the potential for intellectual and technological impact—the benefits of reducing the carbon intensity of ubiquitous commodity feedstocks flow downstream to many chemical products. But efficient and economical CO2 electro-reduction also presents major challenges. One such challenge is illustrated in Fig. 4b: the energy required to convert CO2 and H2O to hydrocarbons is enormous. Moreover, this energetically uphill process is not required to generate the same products from petrochemicals, and this difference bears strongly on the ability to reduce aggregate global warming emissions below the benchmark set by current practice, as discussed in the following section.
 | ||
| Fig. 4 Salient considerations for research and development of electrosynthetic CO2 reuse technologies for chemical manufacturing. (a) Time series depicting the results of keyword searches using the Clarivate Web of Science database capturing the divergent growth of research interest in CO2 conversion versus all other forms of electrosynthesis over the last two decades. (b) Graphical depiction of the enthalpies of combustion per mole of carbon for each of the hydrocarbons and oxygenates listed in Fig. 3, illustrating the magnitude of the energy requirement to generate these compounds from their combustion products (CO2 and H2O). Note the columns in panel (b) are populated with chemicals as they appear in Fig. 3 to illustrate the general trajectory of petrochemical manufacturing as a sequential series of mostly exothermic reactions. | ||
Alongside the very high energy demand, there remain significant practical hurdles that need to be overcome for the development of technologically viable CO2 reduction technologies. For example, major improvements need to be achieved in the total yield of multi-carbon products from CO2, which includes increasing catalyst selectivity and reducing losses of the CO2 feed to irreversible reactions with the most commonly used liquid alkaline electrolytes.54–58
3.3 Step 3: benchmark electrochemical decarbonization against incumbent technologies
The final step we took in our scoping effort involved estimating the potential for electrosynthetic processes to reduce GHG emissions below the benchmark set by current practice. Lacking process models or empirical data from which to derive full lifecycle assessments for nascent electrosynthetic transformations, we instead developed a general strategy to estimate emissions directly from electrochemical thermodynamics. First, we calculated the minimum input energy Emin (e.g., in units of kJ kg−1) required to convert reactants to products, using water as the sole source of hydrogen and oxygen equivalents. We then applied a generic emissions efficiency factor ηgwp, defined as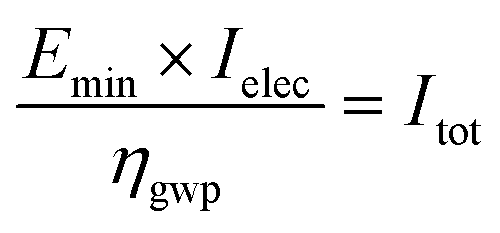 | (1) |
Our approach to estimating GHG emissions collapses all inefficiencies into a single term, producing a result that is linear in the carbon intensity of the input electricity. Thus, the value of Itot resulting from eqn (1) amounts to a first-order estimate of cradle-to-gate lifecycle GHG emissions. This simple strategy allows initial comparisons to be made between projected global warming emissions from an electrosynthetic process and the known emissions profile from the dominant industrial approach. Precision could be improved by developing additional terms to explicitly account for energy and emissions intensities of linked unit operations (reaction, separation, waste remediation, etc.), which ultimately converges on a full lifecycle assessment.
For our analysis, we chose values of η to capture what we consider to be conservative (η = 0.1) and ambitious (η = 0.5) outer bounds. These limits can be benchmarked by working backwards from full lifecycle inventories for existing industrial electrosynthetic processes. To this effect, recent LCA work for PEM water electrolysis and modern chlor-alkali manufacturing imply η values near 0.5 for each, with cradle-to-gate GHG emissions dominated by the carbon intensity of the electric energy input even for facilities fed with a high proportion of renewables.59,60 As a more direct point of comparison, the electro-hydrodimerization of acrylonitrile to adiponitrile by the Monsanto process is the organic electrosynthetic reaction currently practiced at the largest scale.61,62 Historical accounts indicate the electrical energy requirement for the Monsanto process is approximately 2.4 kWh kg−1,63 which implies a maximum value of η between 0.1 and 0.2 assuming the required hydrogen is derived from water electrolysis and overall process emissions are dominated by electric power input to the reactor.
Fig. 5 illustrates representative results for the production of adipic acid, formaldehyde, and methanol from cyclohexanone, methanol, and CO2, respectively. For visual clarity, these data are plotted on logarithmic axes; analogous linear depictions are compiled in the ESI.† Estimates were made using eqn (1) where Ielec is depicted on the horizontal axis and Itot on the vertical axis, with the shaded area depicting a range of efficiency factors η from 0.1 to 0.5. GWP values associated with current (non-electrochemical) industry practice are depicted as horizontal dashed lines in each panel. Plotting the results in this way enables us to define “carbon parity” as the carbon intensity of the input electric power supply required to decrease the GWP of the electrochemical process below that of the incumbent technology. Fig. 5c further demarcates the average carbon intensity of grid electric power in France and the USA as reference points.64 These represent electric grids with low and moderate carbon intensities, respectively, as France uses high proportions of nuclear and renewable energy while the US uses primarily natural gas with smaller contributions from coal, nuclear, and renewables.65,66
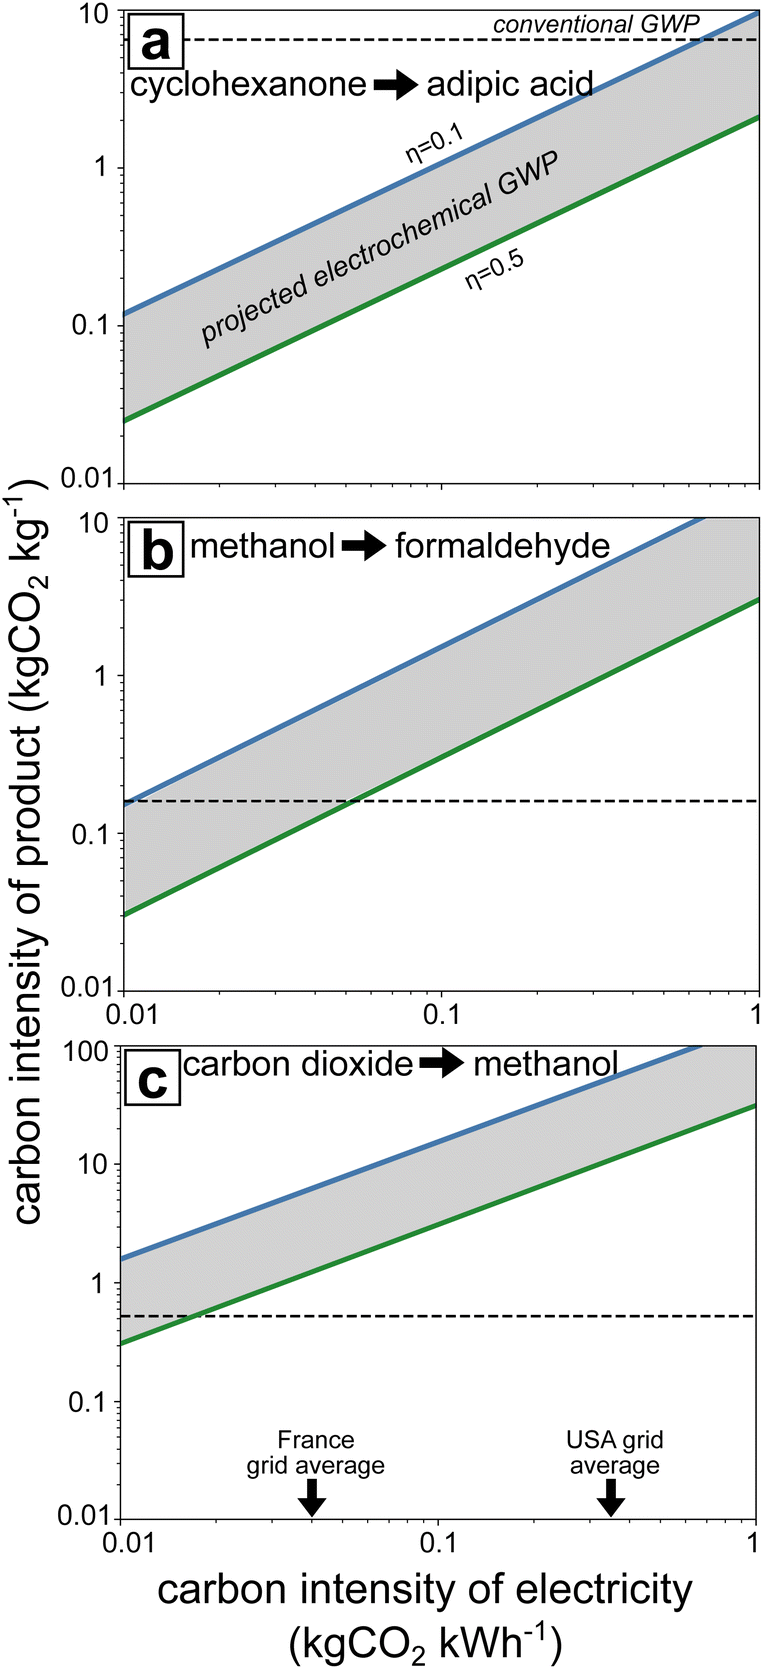 | ||
| Fig. 5 Projected lifecycle GHG emissions for (a) cyclohexanone electro-oxidation to adipic acid, (b) methanol electro-oxidation to formaldehyde, and (c) carbon dioxide reduction to methanol. Estimates are based on eqn (1) with the shaded areas corresponding to 0.1 < η < 0.5. Horizontal dashed lines denote GWP for current manufacturing practice based on industry estimates compiled in Fig. 3. Carbon intensities of the electric grid mix in France and the USA as of 2023 are annotated on the horizontal axis of panel (c). | ||
These results illustrate the wide range of impacts one might expect from broad adoption of electrosynthetic technologies in the chemical industry. The production of adipic acid from cyclohexanone (Fig. 5a) illustrates one extreme, where the energy requirements for the chemical transformation are modest, but the current industrial practice has a very high GWP owing to the aforementioned contributions from N2O emissions. Thus, even an electrosynthetic process powered by fossil-derived electricity with an efficiency factor of η = 0.1 would result in reduced GHG emissions relative to current practice. By contrast, methanol oxidation to formaldehyde (Fig. 5b) is an intermediate case in which carbon parity could be obtained with a substantially decarbonized electric power supply (comparable to that of the electric grid in France) and an efficiency factor approaching 0.5.
Finally CO2 conversion to methanol (Fig. 5c) is the most challenging case, where carbon parity can only be achieved by using highly decarbonized electricity. This outcome is substantially similar to analysis by Tackett, et al. for methanol production by thermocatalytic, electrocatalytic, and hybrid approaches; it results directly from the high thermodynamic energy requirement to convert CO2 back into hydrocarbons.17 Note the projected GWP for this type of CO2-to-X technology can be further reduced by incorporating carbon credits for the use of captured CO2, but we did not consider this in our analysis due to the ambiguity in partitioning credits for negative emissions between capture and reuse steps.
4 Diversifying electrochemical process design
The results discussed above were all constrained by an important assumption where the redox reaction of interest is paired with the corresponding half-reaction from water electrolysis for charge balance—i.e., oxidations were paired with hydrogen evolution and reductions paired with oxygen evolution. Relaxing this constraint on the overall reactive process design opens up opportunities to consider several means by which energy requirements and lifecycle GHG emissions intensities could be reduced further. To this effect, Fig. 6 schematizes thermodynamic relationships describing minimum energy requirements to carry out methanol oxidation to formaldehyde and nitrobenzene hydrogenation to aniline by several means. Each reaction is depicted schematically as a horizontal bar annotated with the oxidized and reduced forms of the carbon-containing species (omitting protons and water). This ox/red pair is generally referred to as a redox couple. Horizontal dashed lines correspond to the standard reduction potentials for hydrogen evolution/oxidation (HER/HOR) and oxygen evolution/reduction (OER/ORR).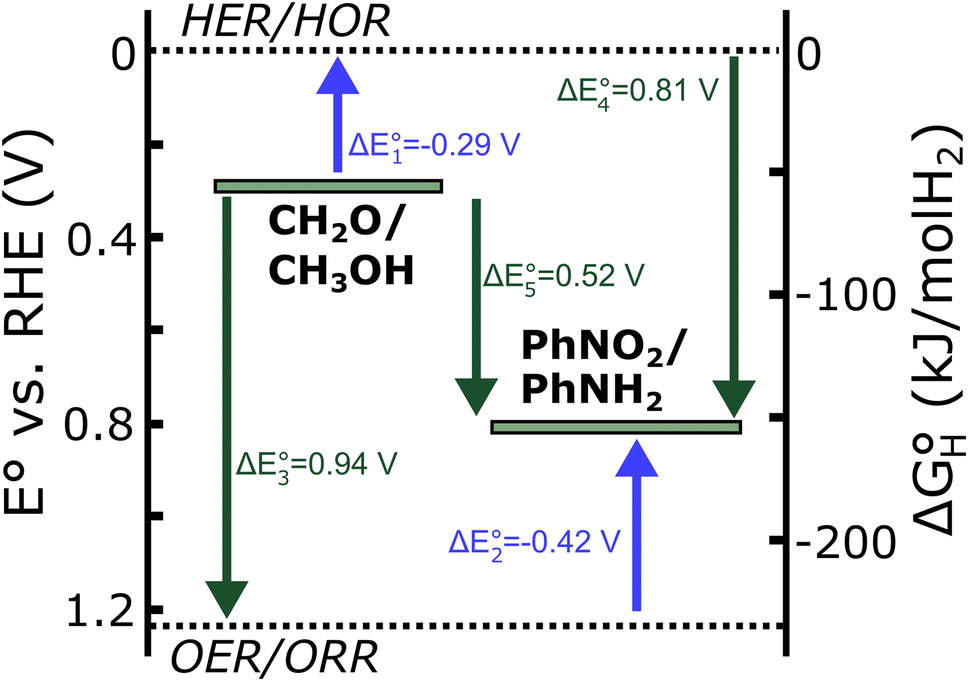 | ||
| Fig. 6 Graphical schematic compiling standard thermodynamic data for reversible methanol oxidation to formaldehyde, nitrobenzene hydrogenation to aniline, and the water electrolysis half reactions. Blue and dark green arrows illustrate standard cell potentials for full-cell redox reactions that combine the corresponding redox couples. The arrows point in the direction of electron transfer (i.e., electrons from the redox couple at the tail are transferred to the redox couple at the head). Hence, the blue upward-facing arrows correspond to thermodynamically uphill reactions, while the dark green downward-facing arrows are for thermodynamically downhill reactions. | ||
The lefthand axis of Fig. 6 locates each redox couple in terms of its standard reduction potential E° on the reversible hydrogen electrode (RHE) scale, and the corresponding standard free energies of hydrogenation  (per mole H2) are depicted on the righthand vertical axis. These thermodynamic properties are related to one another by
  as long as E° values are tabulated on the RHE scale and n = 2 when the free energy is per mole of H2. Note the sign conventions here dictate that positive values of E° correspond to exergonic standard free energies of hydrogenation, and more negative values of E° correspond to stronger reductants. Plotting the energetic relationships in this way allows us to illustrate the minimum reversible work required to accomplish the redox half-reactions of interest by coupling them with any of the other half-reactions annotated on the diagram. This minimum reversible work is proportional to a standard full cell potential ΔE°.
The five arrows depicted in Fig. 6, each annotated with an ΔE° value, describe several configurations that could be used to drive methanol oxidation and nitrobenzene hydrogenation electrochemically. The blue arrows labeled  and
and  correspond to the configurations we used for our scoping analysis in the previous section: methanol oxidation coupled with hydrogen evolution and nitrobenzene hydrogenation coupled with oxygen evolution. Both of these are thermodynamically uphill full-cell reactions (ΔE° < 0), as is the case for most high-volume electrochemical manufacturing processes carried out industrially today (hydrogen, chlor-alkali, aluminum, adiponitrile, and others). The overall cell potential must also be negative (uphill) for eqn (1) to return a valid result on projected emissions intensity.
Notably, coupling electrochemical half reactions with hydrogen and oxygen evolution in this way means that hydrocarbon oxidations will generally be less sensitive to the carbon intensity of the power input than reductions. This can be explained by noting that the redox thermochemistry of most hydrocarbons falls in the upper half of the energy scale in Fig. 6—that is, the standard half cell potentials for hydrocarbon oxidation/reduction generally lies closer to that of the hydrogen evolution/oxidation reaction than oxygen evolution/reduction. Thus, oxidation reactions coupled with hydrogen evolution generally require less input energy than reduction reactions coupled with oxygen evolution. This effect is illustrated in Fig. 6, where hydrogenating even a relatively oxidizing redox couple like nitrobenzene to aniline requires 44% more energy per mole H2 equiv. than dehydrogenating methanol to formaldehyde. The differences are much more dramatic when considering hydrogenations of C–O bonds (as in CO2 reduction or electrolytic hydrodeoxygenation reactions) where standard half-cell potentials are often very close to 0 V vs. RHE.
The dark green arrows labeled  and
and  invert the application of hydrogen and oxygen electrochemistry to produce thermodynamically downhill (ΔE° > 0) full cell reactions: methanol oxidation coupled with oxygen reduction and nitrobenzene hydrogenation coupled with hydrogen oxidation. Electrosynthetic schemes could be designed to operate in this way, in which case the reactors would function like fuel cells rather than electrolyzers—i.e., a fraction of the free energy of reaction could potentially be recovered as electrical work. Our preferred terminology for these approaches is oxygen and hydrogen depolarization, by analogy to the use of oxygen depolarized cathodes in chlor alkali manufacturing.67
Finally, the green arrow labeled  corresponds to the full-cell reaction in which the dehydrogenation of methanol has been electrochemically coupled with the hydrogenation of nitrobenzene. This is an example of what we term voltage integration, where protons and electrons liberated from the electrochemical oxidation of methanol are directly used in the hydrogenation of nitrobenzene. Notably, the overall reaction is also thermodynamically downhill
  , meaning an electrosynthetic scheme that efficiently couples these two reactions could also be run with the net production of electric power. Voltage integration is therefore attractive for its ability to reduce thermodynamic energy requirements (even to the point of negating them entirely) through judicious choice of redox couples, and to further reduce GHG emissions by distributing the impacts across two useful products. These benefits are countervailed by the need to combine two redox reactions into a single reactive process, which could impose significant constraints on process design or product yield. This approach also fixes the ratio of products generated based on the respective stoichiometric coefficients of electrons transferred, so sizing the process to meet the market demand for one product might result in under- or oversupply of the other.
5 Conclusions: challenges and opportunities
The results of this scoping analysis lead to some intriguing and potentially provocative conclusions in light of current trends in R&D directed at electrochemical manufacturing. One notable conclusion is that the specialty sector offers several examples of “low hanging fruit”—that is, chemicals for which electrosynthetic approaches could reduce GHG emissions even under very conservative assumptions about process efficiency and carbon intensity of the input power. Adipic acid is a representative example, and other transformations involving organic oxidations or nitrations that currently rely on N-oxide reagents are potential targets. Similar opportunities have been identified by researchers working on electrochemical epoxidation reactions, where the thermochemical oxidant is replaced by an electrochemically generated one.68Another notable outcome is that projected emissions intensities for electrochemical hydrogenation reactions are more sensitive to the carbon intensity of the power input than oxidation reactions. In fact, our analytical approach underestimates this asymmetry, as our calculations assumed water as the primary oxygen source. Electrochemical oxidations can also be designed to use atmospheric oxygen, and in many cases these reactions are downhill under realistic operating conditions, which makes it possible to configure electrosynthetic reactors as fuel cells and recover energy as electrical work. Further opportunities are available to diversify the scope of electrosynthetic process design using strategies like hydrogen or oxygen depolarization and voltage integration.
In summary, we offer three broad recommendations for advancing the fields of industrial decarbonization and electrosynthesis. First, we reiterate the importance of developing roadmaps for technology development that actively grapple with trade-offs between the magnitude and immediacy of technological impact. To this effect, specialty chemical manufacturing offers numerous promising opportunities for reactive process development, as illustrated by the scoping work detailed above. Moreover, electrochemical technologies like CO2-to-X that are intended to meet the demand for commodity hydrocarbons are especially challenging and not strictly necessary to address global decarbonization goals. Thus, we encourage the research community to broaden the portfolio of electrosynthetic reactions under active development.
Second, we cannot overstate the importance of developing broad collaborative networks for research, development, and deployment of electrochemical technologies to decarbonize the chemical sector. Essential work to be pursued within these networks includes:
• Discovery science directed at broadening the scope of synthetic targets, catalysts, and conditions for electrochemical transformations.
• Engineering science focused on reactor and process design, including the development and public dissemination of “design guides” for electrosynthetic reactors to lower barriers to entry for researchers who are new to the field.
• Connections to practice through the engagement of private firms and integration of lifecycle and technoeconomic analysis even within early-phase research.
Open dissemination of key research findings within these collaborative networks will be critical to drive innovation across the sector. The resulting increases in institutional knowledge, especially within the private sector, will enable these processes to be implemented as soon as they are ready.
Finally, we encourage professionals engaged in every level of the chemical manufacturing enterprise to view the global imperative of decarbonization not as an inconvenience or a threat, but as an opportunity to build advanced infrastructure that meets our basic needs in a safer, healthier, and more equitable way. And speaking from the authors' experience, we can say with certainty that there is a generation of creative young scientists and engineers who are ready to get to work.
Data availability
Original data supporting this article have been included as ESI.† All other data were collected from publicly available sources cited within the text.Author contributions
GC, TP, and JM were responsible for conceptualization, project administration, supervision, and funding acquisition; RJH, TJH, MAK, MJV, ZJS, and JRM developed methodologies; RJH, TJH, MAK, MJV, ZJS, and ES were responsible for data collection, curation, and formal analysis; RJH and JRM developed visuals; RJH, GC, TP, ES, and JRM participated in writing, reviewing, and editing the article.Conflicts of interest
Financial support for this work was provided in part by the Lubrizol Corporation, a global specialty chemical manufacturer.Acknowledgements
The authors acknowledge the Lubrizol Corporation and the University of Pittsburgh for providing financial support for this research. We are also grateful to Mike Sutton, Will Barton, Gary Walker, Michael Huston, and Samali Weliwatte for valuable discussions and feedback during the development of this work.References
- A. Gambarin and H. Galloway, The Global Chemical Industry: Catalyzing Growth and Addressing Our World's Sustainability Challenges, Oxford Economics, Oxford, 2019, https://www.oxfordeconomics.com/resource/the-global-chemical-industry-catalyzing-growth-and-addressing-our-world-sustainability-challenges/, accessed June 2024 Search PubMed.
- IEA, Net Zero by 2050 - A Roadmap for the Global Energy Sector, IEA, Paris, 2021, https://www.iea.org/reports/net-zero-by-2050, accessed June 2024, License: CC BY 4.0 Search PubMed.
- IPCC, 2023: Summary for Policymakers, in Climate Change 2023: Synthesis Report. Contribution of Working Groups I, II and III to the Sixth Assessment Report of the Intergovernmental Panel on Climate Change, ed. Core Writing Team, H. Lee and J. Romero, IPCC, Geneva, Switzerland, 2023, pp. 1–34, DOI:10.59327/IPCC/AR6-9789291691647.001.
- D. S. Mallapragada, Y. Dvorkin, M. A. Modestino, D. V. Esposito, W. A. Smith, B.-M. Hodge, M. P. Harold, V. M. Donnelly, C. B. Alice Nuz, K. Baker, L. C. Grabow, Y. Yan, N. N. Rajput, R. L. Hartman, E. J. Biddinger, E. S. Aydil and A. D. Taylor, Joule, 2023, 7, 25–41 CrossRef.
- D. Raimi, E. Campbell, R. Newell, B. Pest, S. Villanueva and J. Wingenroth, Global Energy Outlook 2022: Turning Points and Tension in the Energy Transition, Resources for the Future, Washington DC, 2019, https://media.rff.org/documents/Report_22-04_v1.pdf, accessed June 2024 Search PubMed.
- IRENA, World energy transitions outlook 2023: 1.5 °C pathway, Abu Dhabi, 2023, https://www.irena.org/Publications/2023/Jun/World-Energy-Transitions-Outlook-2023, accessed June 2024 Search PubMed.
- D. Hostert, M. Kimmel, I. Berryman, F. Aminoff, K. A. andJulia Attwood, H. Bromley, J. Chase, A. Cheung, T. Kawahara, C. Lubis, K. Pegios, R. Quntero, D. Robinson, S. Song, N. Soulopoulos, M. Tengler and A. Vasdev, New Energy Outlook 2024, BloombergNEF, New York City, 2024, https://about.bnef.com/new-energy-outlook/, accessed June 2024 Search PubMed.
- BP, New Energy Outlook 2024, BP plc, London, 2023, https://www.bp.com/content/dam/bp/business-sites/en/global/corporate/pdfs/energy-economics/energy-outlook/bp-energy-outlook-2023.pdf, accessed June 2024 Search PubMed.
- Z. Kapsalyamova and S. Paltsev, Energy Econ., 2020, 92, 104984 CrossRef.
- A. Corma, E. Corresa, Y. Mathieu, L. Sauvanaud, S. Al-Bogami, M. S. Al-Ghrami and A. Bourane, Catal. Sci. Technol., 2017, 12–46 RSC.
- IEA, Global EV Outlook 2023, IEA, Paris, 2023, https://www.iea.org/reports/global-ev-outlook-2023, accessed June 2024 Search PubMed.
- F. W. Geels and M. Ayoub, Technol. Forecast. Soc. Change, 2023, 193, 122639 CrossRef.
- IEA, World Energy Outlook 2022, IEA, Paris, 2022, https://www.iea.org/reports/world-energy-outlook-2022, accessed June 2024 Search PubMed.
- A. H. Tullo, Why the future of oil is in chemicals, not fuels, 2019, https://cen.acs.org/business/petrochemicals/future-oil-chemicals-fuels/97/i8, accessed June 2024 Search PubMed.
- IEA, Tracking Clean Energy Progress 2023, IEA, Paris, 2023, https://www.iea.org/reports/tracking-clean-energy-progress-2023, accessed June 2024 Search PubMed.
- Z. J. Schiffer and K. Manthiram, Joule, 2017, 1, 10–14 CrossRef.
- B. M. Tackett, E. Gomez and J. G. Chen, Nat. Catal., 2019, 2, 381–386 CrossRef CAS.
- P. D. Luna, C. Hahn and E. H. Sargent, Science, 2019, 364, 6438 CrossRef PubMed.
- M. A. Adnan and M. G. Kibria, Appl. Energy, 2020, 278, 115614 CrossRef CAS.
- A. Somoza-Tornos, O. J. Guerra, A. M. Crow, W. A. Smith and B.-M. Hodge, iScience, 2021, 24, 102813 CrossRef CAS.
- GVR, Specialty Chemicals Market Size, Share & Trends Analysis Report By Product (Institutional & Industrial Cleaners, Flavor & Fragrances, Food & Feed Additives), By Application, By Region, And Segment Forecasts, 2024–2030, Grand View Research, San Francisco, 2023, https://www.grandviewresearch.com/industry-analysis/specialty-chemicals-market, accessed June 2024 Search PubMed.
- C. Negoita, N. Cristache and M. Bodor, Mater. Plast., 2016, 53, 564–572 Search PubMed.
- J. Liu, L. Zhang, W. Shun, J. Dai, Y. Peng and X. Liu, Am. J. Polym. Sci., 2021, 59, 1274–1490 Search PubMed.
- D. E. Anastasiou, J. Appl. Polym. Sci., 2023, 140, 1 Search PubMed.
- E. A. Baroncini, S. K. Yadav, G. R. Palmese and J. F. Stanzione III, J. Appl. Polym. Sci., 2016, 153, 44103 CrossRef.
- A. Biswas, J. Adv. Manag. Sci., 2016, 4, 211–215 CrossRef.
- R. Drozdenko, M. Jensen and D. Coelho, IJMMDS, 2011, 4, 106 Search PubMed.
- E. G. Hertwich and R. Wood, Environ. Res. Lett., 2018, 13, 104013 CrossRef.
- C. Ramírez-Márquez, M. M. Al-Thubaiti, M. Martín, M. M. El-Halwagi and J. M. Ponce-Ortega, Ind. Eng. Chem. Res., 2023, 62, 2428–2443 CrossRef.
- BASF Creative Group, Basf turns to innovation to cut carbon footprint internally and help customers go green, The Washington Post, https://www.washingtonpost.com/creativegroup/basf/basf-turns-to-innovation-to-cut-carbon-footprint-internally-and-help-customers-go-green/, accessed June 2024 Search PubMed.
- DOW Chemical, Science and Sustainability, https://corporate.dow.com/en-us/science-and-sustainability.html, accessed March 2024 Search PubMed.
- M. J. Orella, Y. Román-Leshkov and F. R. Brushett, Curr. Opin. Chem. Eng., 2018, 20, 159–167 CrossRef.
- S. K. Nabil, M. A. Muzibur Raghuman, K. Kannimuthu, M. Rashid, H. S. Shiran, M. G. Kibria and M. A. Khan, Nat. Catal., 2024, 7, 330–337 CrossRef CAS.
- X. Liu, Y.-Q. Zhu, J. Li, Y. Wang, Q. Shi, A.-Z. Li, K. Ji, X. Wang, X. Zhao, J. Zheng and H. Duan, Nat. Commun., 2024, 15, 7685 CrossRef CAS PubMed.
- Argonne National Laboratory, Greenhouse gases, Regulated Emissions, and Energy use in Technologies (GREET) model, v.1.3.0. 13991, https://www.energy.gov/eere/greet, accessed June 2024 Search PubMed.
- IHS Markit, Chemical Economics Handbook, 2022, https://www.spglobal.com/commodityinsights/en/ci/products/butanediol-chemical-economics-handbook.html, accessed June 2024 Search PubMed.
- B. Winter, R. Meys and A. Bardow, J. Cleaner Prod., 2021, 290, 125818 CrossRef CAS.
- ChemAnalyst, Diphenylamine Market Analysis: Plant Capacity, Operating Efficiency, Demand Supply, End-User Industries, Distribution Channel, Regional Demand, 2015-2030, 2021, https://www.chemanalyst.com/industry-report/diphenylamine-market-588, accessed June 2024 Search PubMed.
- Plastics Europe, Eco-profiles for determining environmental impacts of plastics, https://plasticseurope.org/sustainability/circularity/life-cycle-thinking/eco-profiles-set/, accessed June 2024 Search PubMed.
- IHS Markit, Chemical Economics Handbook, 2023, https://www.spglobal.com/commodityinsights/en/ci/products/adipic-acid-chemical-economics-handbook.html, accessed June 2024 Search PubMed.
- IHS Markit, Chemical Economics Handbook, 2022, https://www.spglobal.com/commodityinsights/en/ci/products/maleic-anyhydride-chemical-economics-handbook.html, accessed June 2024 Search PubMed.
- IHS Markit, Chemical Economics Handbook, 2024, https://www.spglobal.com/commodityinsights/en/ci/products/butylenes-chemical-economics-handbook.html, accessed June 2024 Search PubMed.
- IHS Markit, Chemical Economics Handbook, 2023, https://www.spglobal.com/commodityinsights/en/ci/products/vinyl-chloride-monomer-chemical-economics-handbook.html, accessed June 2024 Search PubMed.
- IHS Market, Chemical Economics Handbook, 2020, https://www.spglobal.com/commodityinsights/en/ci/products/linear-alpha-olefins-chemical-economics-handbook.html, accessed June 2024 Search PubMed.
- A. Amelio, G. Genduso, S. Vreysen, P. Luis and B. V. der Bruggen, Green Chem., 2014, 16, 3045–3063 RSC.
- IHS Markit, Chemical Economics Handbook, 2021, https://www.spglobal.com/commodityinsights/en/ci/products/methyl-isobutyl-ketone-mibk-chemical-economics-handbook.html, accessed June 2024 Search PubMed.
- IPCC, Climate Change 2007: Synthesis Report, Contribution of Working Groups I, II and III to the Fourth Assessment Report of the Intergovernmental Panel on Climate Change, ed. Core Writing Team, R. K. Pachauri and A. Reisinger, IPCC, Geneva, Switzerland, 2007, p. 104, https://www.ipcc.ch/site/assets/uploads/2018/02/ar4_syr_full_report.pdf Search PubMed.
- J. Rios, J. Lebeau, T. Yang, S. Lia and M. D. Lynch, Green Chem., 2021, 23, 3172–3190 RSC.
- S. V. de Vyver and Y. Román-Leshkov, Catal. Sci. Technol., 2013, 3, 1465–1479 RSC.
- A. Winiwarter, L. Silvioli, S. B. Scott, K. Enemark-Rasmussen, M. Sariç, D. B. Trimarco, P. C. K. Vesborg, P. G. Moses, I. E. L. Stephens, B. Seger, J. Rossmeisl and I. Chorkendorff, Energy Environ. Sci., 2019, 12, 1055–1067 RSC.
- A. D. Stergiou, D. H. Broadhurst and M. D. Symes, STAR Protoc., 2022, 3, 101817 CrossRef CAS PubMed.
- Y. Zhang, H. Tian, Z. Cui, Z. Yin, H. Hui, H. Wang, L. Zhang, H. Pei, Z. Li, B. B. Mamba and J. Li, J. Catal., 2022, 410, 84–92 CrossRef CAS.
- C. Wang, Z. Lv, X. Feng, W. Yang and B. Wang, Adv. Energy Mater., 2023, 13, 2302382 CrossRef CAS.
- J. E. Huang, F. Li, A. Ozden, A. Sedighian Rasouli, F. P. García De Arquer, S. Liu, S. Zhang, M. Luo, X. Wang, Y. Lum, Y. Xu, K. Bertens, R. K. Miao, C.-T. Dinh, D. Sinton and E. H. Sargent, Science, 2021, 372, 1074–1078 CrossRef CAS PubMed.
- C. Chen, Y. Li and P. Yang, Joule, 2021, 5, 737–742 CrossRef.
- J. A. Rabinowitz and M. W. Kanan, Nat. Commun., 2020, 11, 5231 CrossRef CAS.
- H. Shin, K. U. Hansen and F. Jiao, Nat. Sustain., 2021, 4, 911–919 CrossRef.
- B. Belsa, L. Xia, V. Golovanova, B. Polesso, A. Pinilla-Sánchez, L. San Martín, J. Ye, C.-T. Dinh and F. P. García De Arquer, Nat. Rev. Mater., 2024, 9, 535–549 CrossRef CAS.
- J. Wilkinson, T. Mays and M. McManus, Clean. Environ. Syst., 2023, 9, 100116 CrossRef.
- Euro-Chlor, Ifeu-Heidelberg, gGmbHM and M. Schulz, Chlorine (The Chlor-Alkali Process), 2022, https://www.eurochlor.org/wp-content/uploads/2022/02/2022-Euro-Chlor-Eco-profile.pdf, accessed June 2024 Search PubMed.
- E. J. Biddinger and P. J. A. Kenis, Interface, 2023, 32, 41 CAS.
- D. Pletcher, Industrial Electrochemistry, Springer, Dordrecht, 1984 Search PubMed.
- D. E. Danly, J. Electrochem. Soc., 1984, 131, 435C CrossRef.
- Carbon intensity of electricity generation, Ember and Energy Institute, 2023, https://ourworldindata.org/grapher/carbon-intensity-electricity, accessed June 2024 Search PubMed.
- IEA, Energy system of France, 2022, https://www.iea.org/countries/france/electricity, accessed June 2024 Search PubMed.
- IEA, Energy system of United States, 2022, https://www.iea.org/countries/united-states/electricity, accessed June 2024 Search PubMed.
- I. Moussallem, J. Jörissen, U. Kunz, S. Pinnow and T. Turek, J. Appl. Electrochem., 2008, 38, 1177–1194 CrossRef CAS.
- P. Zhang, T. Wang and J. Gong, CCS Chem., 2023, 5, 1028–1042 CrossRef CAS.
Footnote |
| † Electronic supplementary information (ESI) available. See DOI: https://doi.org/10.1039/d4su00375f |
| This journal is © The Royal Society of Chemistry 2025 |