
 Open Access Article
 This Open Access Article is licensed under a
 Creative Commons Attribution 3.0 Unported Licence
Towards detection of molecular parity violation via chiral co-sensing: the 1H/31P model system†
Erik
Van Dyke
 abc,
James
Eills
d,
Kirill
Sheberstov
e,
John
Blanchard
f,
Manfred
Wagner
g,
Andrés Emilio
Wedenig
h,
Konstantin
Gaul
*abch,
Robert
Berger
h,
Rudolf
Pietschnig
i,
Denis
Kargin
i,
Danila A.
Barskiy
*abc and
Dmitry
Budker
*abcj
abc,
James
Eills
d,
Kirill
Sheberstov
e,
John
Blanchard
f,
Manfred
Wagner
g,
Andrés Emilio
Wedenig
h,
Konstantin
Gaul
*abch,
Robert
Berger
h,
Rudolf
Pietschnig
i,
Denis
Kargin
i,
Danila A.
Barskiy
*abc and
Dmitry
Budker
*abcj
aInstitute for Physics, Johannes Gutenberg University Mainz, 55128 Mainz, Germany. E-mail: gaulkons@uni-mainz.de; dbarskiy@uni-mainz.de; budker@uni-mainz.de
bHelmholtz Institute Mainz, 55128 Mainz, Germany
cGSI Helmholtzzentrum für Schwerionenforschung GmbH, 64291 Darmstadt, Germany
dInstitute of Biological Information Processing (IBI-7), Forschungszentrum Jülich, Jülich 52425, Germany
eLaboratoire des Biomolécules, LBM, Département de Chimie, École Normale Supérieure, PSL University, Sorbonne Université, CNRS, 75005 Paris, France
fQuantum Technology Center, University of Maryland, College Park, Maryland, MD 20724, USA
gMax Planck Institute for Polymer Research, 55128 Mainz, Germany
hFachbereich Chemie, Philipps-Universität Marburg, 35032 Marburg, Germany
iInstitut für Chemie und CINSaT, Universität Kassel, 34132 Kassel, Germany
jDepartment of Physics, University of California at Berkeley, Berkeley, CA 94720, USA
First published on 20th February 2025
Abstract
Fundamental weak interactions have been shown to violate parity in both nuclear and atomic systems. However, observation of parity violation in a molecular system has proven an elusive target. Nuclear spin dependent contributions of the weak interaction are expected to result in energetic differences between enantiomers manifesting in nuclear magnetic resonance (NMR) spectra as chemical shift differences in the order of parts-per-trillion to parts-per-billion (μHz to mHz) for high-Z nuclei. This method uses simultaneous measurements of diastereomeric splittings for a light and a heavy nucleus in solution-state NMR to resolve chemical shift differences persisting in a non-chiral environment between enantiomers of chiral compounds smaller than the typical high-field NMR linewidth. Sources of error must be identified and minimized to verify that the observed effect is, in fact, due to parity violation and not systematic effects. This paper presents a detailed analysis of a system incorporating 31P and 1H NMR to elucidate the systematic effects and to guide experiments with higher-Z nuclei where molecular parity violation may be resolved.
1 Introduction
1.1 Parity violation in atoms and molecules
Parity violation (PV) in nuclear weak interactions was first suggested by Lee and Yang1 and soon confirmed by Wu and colleagues in beta decay of spin polarized 60Co nuclei.2 A possibility of parity violation in electron–nucleus interactions in atoms was suggested by Zel’dovich3 but was estimated to be too small in simple atoms like hydrogen. The discovery of weak neutral currents in neutrino scattering4–6 rejuvenated the interest in the detecting PV in atoms and it was at that time that Bouchiat and Bouchiat7 realized that PV effects are strongly enhanced in heavy atoms. Observations of atomic PV were subsequently reported by Barkov and Zolotorev,8 Conti et al.9 and other groups.10 Atomic PV experiments have contributed to establishing what is now known as the standard model of particles and interactions and since then has become a field of precision measurement, see, for example, the review published in ref. 1.From the early days of atomic PV, it has been recognized that parity violation should also manifest in molecules;11,12 in particular, while PV does not produce first-order energy shifts in nondegenerate states,13 there are, in fact, first-order energy shifts in chiral molecules since a state with a fixed chirality is a coherent superposition of opposite-parity states. Somewhat surprisingly to the atomic, molecular, and optical physics community, detecting molecular parity violation remains as a yet unmet challenge, both for chiral and non-chiral systems.14
Among various other manifestations of parity violation in chiral molecules (see ref. 14–17 for reviews) is the appearance of differences in chemical shift between enantiomers undergoing nuclear magnetic resonance (NMR).18–20 Here the magnitude of the effect could reach into the millihertz range for favorable cases.21–32 While measurable in principle, the effect is hard to detect in practice. Indeed, performing experiments with separated enantiomers would require reliable reproducibility of experimental parameters such as the magnetic field at parts per trillion level, which is beyond current technology. On the other hand, performing measurements in a mixture of enantiomers would appear impossible because the separation of the spectral lines due to the PV effect would be deep within the NMR linewidth.
1.2 Detection of PV with diastereomerism
A possible solution may be offered by the use of the diastereomerism effect—the splitting of the NMR lines of an enantiomeric mixture of chiral molecules in the presence of a chiral, nonracemic environment.33–35 If one could trace the splitting from the case where the lines are well split in a solvent with one chirality, through the racemic (effectively achiral) solvent, to the opposite-chirality solvent, the PV effect would manifest as a nonzero intercept of the splitting.The challenge of this approach is finding the exact racemic point of the solvent. In principle, this can be done using precision optical polarimetry techniques; however, it is difficult to do this with sufficient sensitivity and with the necessary control over systematic effects.
A solution was proposed in ref. 36. The idea is that PV effects scale with the atomic number of the nucleus (Za with 2 > a > 5, see e.g. ref. 21), so measuring diastereomeric splittings for a heavy and a light nucleus on the same sensor molecule allows using the former as the probe of PV, while the latter as an independent probe of the solvent chirality. This approach is reminiscent of intramolecular comagnetometry used in molecular experiments searching for parity- and time-reversal violating permanent electric dipole moments.37,38
In ref. 36, a proof-of-principle experiment was carried out, where 13C was used as a stand-in for the heavy nucleus, while protons were used as the light nuclei. While the actual PV effect in this system was too small to be detected, that work showed that it was possible to achieve the required sensitivity to energy shifts in the millihertz range, on the order of the size of the effect that could be expected for the heaviest NMR nuclei in chiral molecules with favorable properties.
1.3 Tunable chiral environment
It is important to understand that our experiments are possible because we are operating in the regime of rapid chemical exchange. A probe molecule in a solution containing a mixture of the chiral solvating agent of opposite chiralities, in the regime of rapid chemical exchange, samples the opposite chiral environment many times with respect to the time scale that determines the effective measurement time and width of the spectral lines. This is a regime of strong motional narrowing, in which the diastereomeric complex formed by interactions between the probe molecule and chiral solvating agent is well characterized by its enantiomeric ratio. In particular, the enantiomeric ratio for a racemic mixture of chiral solvating agents (CSA) is 1
![[thin space (1/6-em)]](https://www.rsc.org/images/entities/char_2009.gif) :1 and no line splitting occurs. Note that, in the opposite limit of slow chemical exchange, even for a racemic solvent, one would observe diastereomeric line splitting: in the absence of parity violation, the spectral lines for R,R and S,S probe-solvent combinations would overlap; but split from the overlapping lines for R,S and S,R pairs.
:1 and no line splitting occurs. Note that, in the opposite limit of slow chemical exchange, even for a racemic solvent, one would observe diastereomeric line splitting: in the absence of parity violation, the spectral lines for R,R and S,S probe-solvent combinations would overlap; but split from the overlapping lines for R,S and S,R pairs.
1.4 Goals of the present work
In the context of the search for molecular parity violation, we investigate a chiral system containing a relatively heavy atom, 31P. This work builds upon previous work which demonstrated that using a chiral co-sensing system of diastereomeric complexes allows mitigation of systematic errors,36 and provides a more in-depth look at the sources of error in such a system.Here, a chiral solvating agent (CSA) is used to generate diastereomeric complexes at a lower concentration than previously explored allowing the probing of a heavier spin-1/2 nucleus, 31P, to serve as an intermediate step or alternative pathway towards measuring complexes with high-Z nuclei where PV may be on the order of mHz. Using a CSA as opposed to a chiral solvent has the advantages of allowing a wider range of solvents to be used as well as improved control over concentrations and subsequent binding and dissociation dynamics which are directly related to concentrations of diastereomer forming monomers.
While 31P is still not heavy enough to observe the PV effect, using this heavier nucleus offers an opportunity to explore systematic effects that will be all-important for the choice/synthesis of heavier molecules where detection of PV would be, finally, expected.
2 Experimental
2.1 Choice of the system
Chiral solvating agents (CSAs) are commonly used in solution state NMR to resolve mixtures of enantiomers.35 This is done by dissolving a CSA, typically with one stereogenic center (S or R), in a solution containing a target chiral molecule which in turn generates diastereomeric complexes through transient bonding interactions between the CSA and the target molecule.39 In ideal cases, the result of this interaction is one or more nuclei of a target chiral molecule displaying two distinct chemical shifts in NMR spectra corresponding to complexes containing matching (S,S/R,R) or opposing (S,R/R,S) stereogenic centers. A paper by Li and Raushel40 detailed this kind of system where diastereomeric splitting was observed in 1H and 31P NMR spectra of a chiral phosphorus compound. Following this work we decided to use a chiral phosphonamidate, [amino(methyl)phosphoryl]oxycyclohexane (P), and substituted amino acid, Fmoc-(S)-Trp(Boc)-OH or Fmoc-(R)Trp(Boc)-OH (FBTrp-S and FBTrp-R), that when combined displayed diastereomeric splitting in both 31P and 1H spectra of P, a key point that makes the sensor molecule P suitable as a comagnetometer. We chose the S and R naming convention to assign the absolute configuration of chiral centers as opposed to the L and D convention which has limitations when multiple stereogenic centers are present in a molecule.2.2 Synthesis and NMR characterization of the phosphorus probe molecule
Cyclohexyl P-methylphosphonamidate was prepared according to an adapted literature procedure.40 1.270 g (12.7 mmol) of dry cyclohexanol were dissolved in 20 mL of diethyl ether and cooled in an ethanol bath to below −80 °C. Dropwise addition of 5.1 ml (12.7 mmol, 2.5 M in hexanes) n-butyllithium yielded a suspension, which was stirred for 5 minutes. Thereafter a solution of 1.688 g (12.7 mmol) methylphosphonic dichloride in 40 mL of diethyl ether was added dropwise at −80 °C over the course of 30 minutes, the mixture was stirred for 30 minutes at −70 °C and for a further 30 minutes at room temperature. The solid precipitate was filtered off and at 0 °C gaseous ammonia was passed through the clear solution for 3 minutes leading to the formation of a suspension. Volatile compounds were removed under reduced pressure (400 mbar), the residue was resuspended with 50 mL of diethyl ether and filtered. Removal of volatile compounds at 400 mbar followed by recrystallization from diethyl ether yielded the product as a colorless solid in 20% yield (450 mg). 1H NMR (400 MHz, CDCl3) δ [ppm]: 4.41 (m, 1H), 2.74 (m, 2H, br), 2.05–1.10 (m, 13H); 13C NMR (101 MHz, CDCl3) δ [ppm]: 73.83 (d, 2JPC = 6.4 Hz, CH), 34.24 (d, 3JPC = 1.9 Hz), 34.20 (d, 3JPC = 1.5 Hz), 25.3 (CH2), 24.0 (CH2), 23.9 (CH2), 15.9 (d, 1JPC = 132.2 Hz, CH3); 31P NMR (202 MHz, CDCl3) δ [ppm]: 31.7. MS (ESI-HR) m/z: 200.0813 ([M + Na]+, 27%) calculated: 200.0816; 377.1714 ([2M + Na]+, 100%), calculated: 377.1735.Cyclohexyl N,N-diethyl-P-methylphosphonamidate was prepared in a similar manner. 1.030 g (10.3 mmol) dry cyclohexanol were dissolved in 20 mL of diethyl ether and cooled in an ethanol bath to −80 °C. Dropwise addition of 4.1 mL (10.3 mmol, 2.5 M in hexanes) n-butyllithium yielded a suspension, which was stirred for 5 minutes. Thereafter a solution of 1.360 g (10.2 mmol) methylphosphonic dichloride in 40 mL of diethyl ether was added dropwise at −80 °C, the mixture stirred for 20 minutes at −80 °C and then for another hour at room temperature. Addition of 2.1 mL (20.6 mmol, 2 eq.) of diethylamine furnished a suspension. The reaction mixture was filtered, the solid was washed with 20 mL of diethyl ether and the crude oily product was condensed to dryness. Aqueous work-up and extraction with diethyl ether (30 mL H2O and 2 × 30 mL Et2O) followed by two-fold vacuum distillation (bp = 80–82 °C at 4.5 × 10⁻² mbar) yielded an oily product (430 mg, 17%, 1.75 mmol, >95% purity). 1H NMR (500 MHz, C6D6) δ [ppm]: 4.41–4.25 (m, 1H), 2.92 (dq, 3JPH = 10.7 Hz, 3JHH = 7.1 Hz, 4H), 2.12–1.98 (m, 1H), 1.82–1.69 (m, 1H), 1.62–1.51 (m, 3H), 1.46–1.35 (m, 1H), 1.31–0.99, (m, 8H), 0.89 (t, 3JHH = 7.1 Hz); 13C NMR (101 MHz, C6D6) δ [ppm]: 72.3 (d, 2JPC = 6.5 Hz), 38.7 (d, 2JPC = 4.6 Hz, NCH2), 34.5 (d, 3JPC = 3.0 Hz, CH2), 34.1 (d, 3JPC = 5.0 Hz, CH2), 25.7 (CH2), 24.1 (CH2), 23.9 (CH2), 14.4 (d, 3JPC = 2.0 Hz, CH3), 13.7 (d, 1JPC = 133.0 Hz, CH3); 31P NMR (202 MHz, C6D6) δ [ppm]: 30.2. MS (APCI-HR) m/z: 234.1624 ([M + H]+, 10%) calculated: 234.1623; 152.0849 ([M-Cy + 2H]+, 100%), calculated: 152.0841.
2.3 Sample preparation
All stock solutions were prepared in a glove-box under an atmosphere of nitrogen (>99%). For the first enantiodiscriminatory titration, separate solutions of P and FBTrp-S and FBTrp-R (Merck, Novabiochem) were prepared by dissolving solid analyte in chloroform-d (Eurisotop), which was used without further purification. Individual samples were prepared by pipetting solutions of either FBTrp-S or FBTrp-R at a concentration of 20 mM into a 5 mm NMR tube containing 250 μL of 20 mM P. Equal volumes of FBTrp and P solutions were used in order to reach a final concentration of 10 mM for both FBTrp and P and the desired ratio of FBTrp-S:FBTrp-R. This was repeated to generate solutions of FBTrp chirality ranging from 100% FBTrp-S to 100% FBTrp-R in steps of 6.25%. Samples near the racemic point (56.25% through 43.75% FBTrp-S) were omitted due to difficulty distinguishing peaks of diastereomers at these concentrations resulting from substantial spectral overlap.
Samples used in the second enantiodiscriminatory titration (see Section 2.4) were prepared using a slightly modified procedure. Under an atmosphere of nitrogen, 18.7 mg of P were dissolved in 10.5 mL of chloroform-d to generate a 20 mM solution. Using a syringe (Hamilton, 5 mL), this solution was then split between two vials: one containing 20 mM FBTrp-S and the other containing 20 mM FBTrp-R to produce two solutions with a concentration of 10 mM FBTrp (S or R) and 10 mM P. These solutions were then combined directly in 5 mm NMR tubes using a syringe (Hamilton, 1 mL) to generate 0.5 mL samples with the desired enantiomeric ratio of S:R FBTrp.
2.4 NMR spectrometry and pulse sequences
All 1H and 31P NMR spectra were obtained using an 850 MHz (20.0 T, Bruker) spectrometer with a QXI 850 MHz S6 5 mm multi-nuclei probe with Z gradient at a temperature of 298 K. 1H spectra for the first titration were obtained using a 90° RF pulse with a pre-polarization time of 10 s (methyl 1H T1 = 2.4 s, measured by inversion recovery). 31P spectra were acquired using a 90° pulse and inverse gated proton decoupling. Each 31P spectrum is the average of 64 transients with 32k points and 0.95 s of acquisition time and a pre-polarization time of 3 s (31P T1 = 2.2 s measured by inversion recovery).For the second enantiodiscriminatory titration, 1H spectra were acquired using a BIRD (bilinear rotational decoupling)41 pulse sequence to suppress broad resonances belonging to the cyclohexane moiety of P at frequencies overlapping the methyl-proton peaks from which diastereomeric splitting values were extracted. Parameters for this pulse sequence included a pre-polarization time of 5 s, an inter pulse delay time of 30.3 ms and a final relaxation delay (τnull) of 100 ms before application of a 90° acquisition pulse (see the ESI†). Both inter pulse delay and τnull were determined empirically using the popt experiment in TopSpin. 31P spectra were acquired using a simple 90° pulse scheme without 1H decoupling, using a pre-polarization time of 10 s. To mitigate time-dependent systematic errors during spectral acquisition, a total of 64 individual scans each of 1H and 31P were taken in an alternating fashion automatically using a TopSpin script.
2.5 Estimation of diastereomeric splitting
Uncertainty from sample preparation was determined by computing the standard deviation of Δd estimates in both 1H and 31P spectra from 3 samples of identical S:R composition, measured three times over 48 h for a total of 9 measurements for each nucleus. The standard deviation was then divided by the sample mean to generate relative uncertainty. Total uncertainty was calculated by combining the standard deviation of frequencies given by fitting (σfit) and the uncertainty due to sample preparation (δs) at each point in quadrature as  , with σ1H = 1.34% and σ31P = 2.12% for all points. These values were then used to generate the final fitting estimates shown in Fig. 4.
2.6 Linear regression of diastereomeric splitting
The values for Δd were plotted and fit with a linear model, yi = axi + b where yi is the extracted 31P diastereomeric splitting and xi is the extracted 1H diastereomeric splitting. Linear regression was accomplished using the iminuit package43 in python which was set to minimize χ2 aswhere y(x) is the 31P splitting given by the model at xi and TE is the total error associated with each point,

with ρxy calculated as Pearson's r. The error associated with the y-intercept in the final plot is the standard deviation computed from the covariance matrix given by the fit multiplied by 1.96 to reflect a 95% confidence interval. A similar procedure was followed for the 3-dimensional measurement with two proton Δd values extracted from P. Weighted averages (

![[x with combining macron]](https://www.rsc.org/images/entities/i_char_0078_0304.gif) ) are computed using the formula
) are computed using the formulaand associated error δ
 2
2
2.7 Quantum chemical calculations
For an estimation of the expected PV splitting due to fundamental weak interactions in the studied phosphorous compounds we employed quasi-relativistic density functional theory (DFT) calculations. All these calculations were performed with a modified version44–50 of a two-component program51 based on Turbomole.52 We sampled the space of conformers of cyclohexyl P-methylphosphonamidate with CREST.53 The resulting 48 conformers were subsequently optimized at the level of non-relativistic restricted Kohn–Sham (RKS) calculations employing the hybrid exchange–correlation functional PBE054,55 with a triple-ζ Ahlrichs basis set (def2-TZVPP)56 using the program package Turbomole 7.8.57,58 For conformational averaging we computed vibrational frequencies and thermodynamic corrections to total energies with the module called “freeh” of the program package Turbomole for standard conditions (temperature 298.15 K and pressure 1 hPa). All 48 conformers were found to be minima on the potential energy hypersurface. By comparison of energies, vibrational frequencies and molecular structures, 23 unique conformers could be identified. The unique conformers of (R)-cyclohexyl P-methylphosphonamidate are provided in the ESI† in the form of coordinate files in xyz-format. Properties were averaged with Boltzmann weighing. In the ESI† a table is provided, which contains all individual NMR properties. A single conformer of cyclohexyl N,N-diethyl-P-methylphosphonamidate was optimized at the same level of theory. Phosphoric acid H3PO4 was used as the NMR standard to compute 31P chemical shifts. The molecular structure of H3PO4 was optimized at the same level of theory. Subsequently, quasi-relativistic densities were computed at the level of complex generalized Kohn–Sham (cGKS) within local density approximation (LDA) using the Xα exchange functional59,60 and the VWN5 correlation functional61 in a hybrid version with 50% Fock exchange by Becke (BHandH).62 We employed an augmented all-electron correlated uncontracted Gaussian-type Dyall basis set (dyall.aae3z)63 with additional sets of seven s-type and seven p-type functions with exponential factors composed as an even tempered series with ζ0 = 109a0−2 (dyall.aae3z+sp) at 31P and the 13C and the protons at the methyl group bound to 31P as well as for N,O in cyclohexyl P-methylphosphonamidate and H3PO4. For N and O (only in the case of cyclohexyl N,N-diethyl-P-methylphosphonamidate) and all other H and C atoms the IGLOIII basis set64 was used. Relativistic effects were considered at the level of two-component zeroth order regular approximation (ZORA) using the model potential approach by van Wüllen to alleviate the gauge dependence of ZORA.65 The model potential was applied with additional damping.66 Spectroscopic properties were computed with the toolbox approach of ref. 47 and response functions were computed as detailed in ref. 48 and 49. Conventional NMR shieldings were computed as described in ref. 67. Indirect nuclear spin–spin couplings were computed as detailed in ref. 49 employing magnetogyric ratios γ1H = 5.58569468 μN, γ13C = 1.4048236 μN, and γ31P = 2.2632 μN as given in ref. 68. In all calculations a common gauge origin of the homogeneous magnetic field was employed. The gauge origin was placed at the respective atom, whose NMR chemical shielding was studied. PV frequency shifts to the isotropic NMR shielding of nucleus A were computed in second order perturbation theory below for convenience, represented in a four-component sum-over-states formulation, using the following effective interaction Hamiltonians:
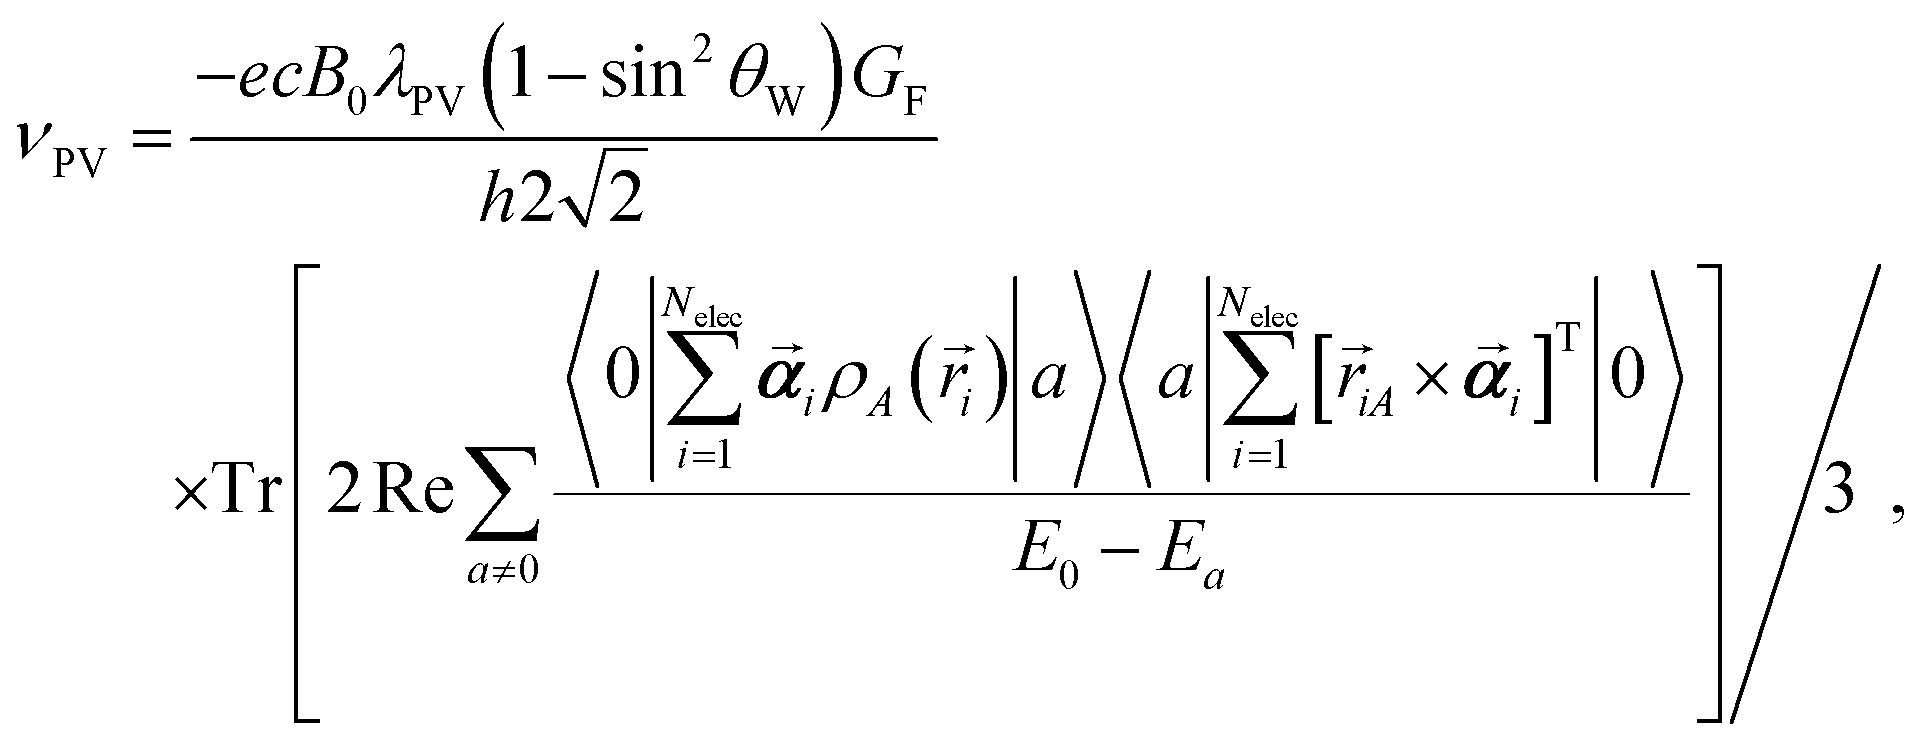 | (1) |
Here 〈a|Â|b〉 denotes matrix elements of a given operator  between two many-electron wave functions and |0〉, |a〉 denote wave functions of a ground-state reference and excited electronic states with energies E0 and Ea respectively. Tr[A] is the trace of matrix A, c is the speed of light, h is the Planck constant, B0 is the external homogeneous magnetic field of strength, ρA is the normalized nuclear density distribution, ![[r with combining right harpoon above (vector)]](https://www.rsc.org/images/entities/i_char_0072_20d1.gif) ab = a − b is the relative position of two particles and
ab = a − b is the relative position of two particles and ![[small nu, Greek, vector]](https://www.rsc.org/images/entities/i_char_e0ea.gif) T refers to the transpose of a vector . In calculations of PV NMR shieldings Fermi's weak coupling constant GF = 2.22249 × 10⁻¹⁴Eha03, sin2θW = 0.2319 with θW being the Weinberg angle and a nucleus dependent coupling strength parameter of λPV = −1 for all nuclei were employed in order to be consistent with previous studies on PV contributions to NMR shielding constants in chiral molecules. We emphasize here that our reported PV NMR parameters are effective in the sense that they have to be scaled finally by corresponding nuclear-structure dependent terms that account most importantly also for the nuclear anapole moments of the specific isotope. The Dirac matrix
T refers to the transpose of a vector . In calculations of PV NMR shieldings Fermi's weak coupling constant GF = 2.22249 × 10⁻¹⁴Eha03, sin2θW = 0.2319 with θW being the Weinberg angle and a nucleus dependent coupling strength parameter of λPV = −1 for all nuclei were employed in order to be consistent with previous studies on PV contributions to NMR shielding constants in chiral molecules. We emphasize here that our reported PV NMR parameters are effective in the sense that they have to be scaled finally by corresponding nuclear-structure dependent terms that account most importantly also for the nuclear anapole moments of the specific isotope. The Dirac matrix ![[small alpha, Greek, vector]](https://www.rsc.org/images/entities/b_i_char_e118.gif) is defined as
is defined as 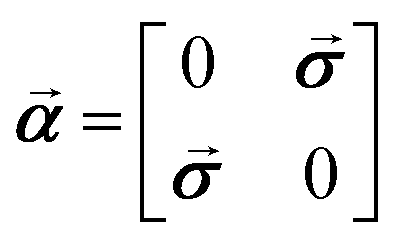 where
where ![[small sigma, Greek, vector]](https://www.rsc.org/images/entities/b_i_char_e1c9.gif) is the vector of Pauli matrices. For a detailed derivation of PV NMR shieldings within ZORA see ref. 31. The Coulomb potential of the nuclei was modeled in all calculations assuming a finite spherical Gaussian-shaped nuclear charge density distribution
is the vector of Pauli matrices. For a detailed derivation of PV NMR shieldings within ZORA see ref. 31. The Coulomb potential of the nuclei was modeled in all calculations assuming a finite spherical Gaussian-shaped nuclear charge density distribution  with
with  and the root-mean-square radius rnuc,A was chosen as suggested by Visscher and Dyall,69 where nuclear mass numbers were chosen as nearest integers to the natural mass of the element. Nuclear magnetization distributions were assumed to be point-like in all calculations. We define PV splitting as ΔPV = νPV(R) − νPV(S), where νPV(R) and νPV(S) are the PV NMR frequency shifts for the (R) and (S) enantiomers respectively.
3 Results and discussion
3.1 Estimation of expected PV splittings
PV splittings of 31P NMR signals between two enantiomers were computed as detailed in the previous section to be ΔPV = −0.7 μHz for cyclohexyl P-methylphosphonamidate (conformationally averaged) and ΔPV = 0.2 μHz for cyclohexyl N,N-diethyl-P-methylphosphonamidate (single conformer) when assuming an external homogeneous magnetic field of strength 20 T. For comparison with experiments, we computed with the same methodology the conventional 31P-NMR chemical shifts relative to H3PO4 (computed isotropic shielding constant is σ = 319.3 ppm) for those two compounds. The 31P-NMR chemical shifts were found to be 24 ppm for cyclohexyl P-methylphosphonamidate (conformationally averaged) and 33 ppm for cyclohexyl N,N-diethyl-P-methylphosphonamidate (single conformer). These computed chemical shifts deviate considerably from the experimental chemical shifts by 25% and 9%, respectively. The methyl 1H–31P 2J-coupling in cyclohexyl P-methylphosphonamidate (conformationally averaged) was computed to be −12 Hz, which deviates 28% from the experimental absolute value of 16.8 Hz shown in Fig. 5, a similar deviation as for the chemical shift. Our calculation suggests a negative sign of the 1H–31P 2J-coupling.Here, we want to emphasize that computed chemical shifts for the two compounds are small compared to the typical range of chemical shifts in 31P NMR spectroscopy, which may be one of the reasons why an opposite trend is seen in comparison to the experimental chemical shifts of the two compounds. Moreover, the use of a single conformer for cyclohexyl N,N-diethyl-P-methylphosphonamidate may be an important source of error. For cyclohexyl P-methylphosphonamidate we observed differences of up to 10 ppm (∼40%) between different conformers. Other likely error sources are the employed exchange–correlation functional BHandH, which is not explicitly designed for calculations of NMR parameters, and the molecular structures, which were computed at the DFT level as well. Moreover, errors of computed chemical shifts can be partially attributed to the basis set used in this work, which was not large enough to completely suppress the gauge origin dependence. For example, a calculation with a gauge origin shifted by 10a0 in every spatial direction increases chemical shifts by 3 ppm, i.e. a change of 10%. Here, we like to emphasize that the dependence on the gauge origin is negligible for PV NMR shifts, which was found to be below 1%, in agreement with previous PV-NMR calculations.31,32 Further uncertainties of the calculated chemical shifts and J coupling constants could be due to solvent effects, which were neglected in our calculations, wherein the molecules are in vacuum. For the present purpose, i.e. estimating the expected size of PV splittings, however, we consider our calculations to be sufficiently accurate.
The PV effects are predicted to be two to three orders of magnitude below the expected experimental resolution and therefore are not detectable in the present measurements as assumed before. In molecules composed of light or medium heavy elements only, spin–orbit coupling effects are typically small and PV NMR shielding tensors are then expected to scale with the nuclear charge number Z as about Z2.21,24,31 Therefore, PV effects on the internal comagnetometer signal from the 1H nucleus should be at least two orders of magnitude lower than PV splittings on the 31P nucleus, which is confirmed by our numerical calculations: the PV splitting for 1H located at the methyl group in cyclohexyl P-methylphosphonamidate is found to be ΔPV(1H) ≲ 5 × 10⁻⁴ μHz.
3.2 Resolution of diastereomeric phosphorus complex
Li and Raushel published a method for resolving chiral oxophosphoranes using substituted amino acids such as tryptophan.40 We adopted a pair of diastereomer-forming compounds based on their work, namely a chiral phosphonamidate, cyclohexyl P-methylphosphonamidate (P), and N-fluorenylmethyloxycarbonyl-N′-tert-butyloxycarbonyl-tryptophan (FBTrp), pictured in Fig. 1. P is referred to as the sensor molecule because it contains the high-Z nucleus (in this example, 31P) which should be sensitive to P-odd effects caused by the weak interaction. Though, for 31P, any PV effects are expected to be below the detection limit, and the target of this study is to determine systematic errors present in this approach and develop strategies to mitigate them. | ||
| Fig. 1 (a) Chemical structures of the chiral sensor molecule and chiral solvating agent used in this work. Hydrogen-bonding interactions generate transient diastereomeric complexes between a racemic mixture of the sensor and a controlled S:R ratio of the solvating agent. The sensor molecule contains two groups of spin-1/2 nuclei which display variable diastereomeric splitting with respect to the enantiomeric ratio of the chiral solvating agent (CSA), and combined measurements of the two function as a co-sensor. (b) The binding interaction between P and FBTrp is expected to occur as hydrogen-bonding at the amino and phosphoryl groups of P and the amino and carboxylic acid groups of FBTrp. (c) Depiction of NMR spectra of diastereomeric complexes at the racemic point (top) and where an excess of one CSA enantiomer is present (bottom). Diastereomeric splitting (Δd) appears in addition to splitting caused by parity violation (ΔPV) which is small relative to the typical NMR linewidth. | ||
The target resonances both originate from P, namely the 31P resonance of the chiral phosphorus center and the 1H resonances of the adjacent methyl group. Preliminary tests using chloroform-d as a solvent show that an equimolar combination of P and FBTrp produces the largest overall diastereomeric splitting (Δd) between enantiomers in both 31P and 1H spectra. Additionally, when increasing the concentration of FBTrp-S at constant P concentration, the Δd of 31P was observed to first increase (max 31P Δd = 14.5 Hz at 10 mM P, 5 mM FBTrp-S) then abruptly collapse at concentrations above 10 mM FBTrp-S, or a ratio of 1:1 P to FBTrp-S. This was in contrast to 1H Δd, which asymptotically approached a maximum of 1H Δd = 10.7 Hz, estimated by fitting with a mono-exponential curve, as the ratio of P to FBTrp-S was increased from 1:0.1 to 1:5 (ESI,† Fig. S7). The same general trend was observed when the concentrations of P and FBTrp-S were increased in tandem from 5 mM to 50 mM, with 31P Δd collapsing at concentrations above 10 mM, limiting the available concentration range. Several other solvents were tested with the aim of generating the greatest Δd in both 31P and 1H NMR signals of P. ortho-dichlorobenzene-d4 and dichloromethane-d2 also produced considerable Δd in both 1H and 31P spectra. However, samples prepared in chloroform-d showed the greatest overall Δd in both 1H (6.5 Hz) and 31P (13.3 Hz) spectra at 10 mM P, 10 mM FBTrp-S (Table 1).
| Solvent | 1H Δd (Hz) | 31P Δd (Hz) |
|---|---|---|
| 1H Δd denotes diastereomeric splitting values for the methyl-1H resonance of P. | ||
| Acetone-d6 | 2.1 | 4.9 |
| Tetrahydrofuran-d8 | 0 | 9.5 |
| ortho-Dichlorobenzene-d4 | 4.1 | 12.2 |
| Chloroform-d | 6.5 | 13.3 |
| Dichloromethane-d2 | 3.1 | 17.5 |
| Dimethyl sulfoxide-d6 | 0 | 0 |
It was also noted that at higher concentrations of FBTrp-S, with P concentrations held at 10 mM, 31P spectral lines exhibited a nonlinear shift towards higher frequencies (Fig. S7 in the ESI†). A similar shift was seen in 1H spectra of the P methyl group towards lower frequencies under the same conditions. This is expected to occur due to rapid chemical exchange between P and FBTrp.
A second, chemically similar phosphonamidate – cyclohexyl N,N-diethyl-P-methylphosphonamidate (N,N-P) – was also examined in solution with FBTrp at several ratios of FBTrp to N,N-P in chloroform-d. While modest Δd was observed in 1H spectra, none of the tested conditions resulted in reproducible Δd in 31P spectra (see the ESI†). We therefore did not include this molecule in further experiments. Diminished diastereomeric splitting indicates that the association of P and FBTrp is reduced by the presence of ethyl groups, possibly due to steric effects. It is also likely that the amino group of P participates in hydrogen-bonding with FBTrp in addition to the phosphoryl oxygen atom previously proposed as the predominant binding site.40 This additional interaction could lead to several different H-bonding conformations, one of which is depicted in Fig. 1, with other possibilities shown in the ESI.† The additional contact afforded by a second H-bonding site may be responsible for the relatively strong diastereomeric splitting observed in P as opposed to other phosphorus-containing molecules examined by Li and Raushel.
Having chosen the concentrations, we proceeded with the collection of high-field NMR spectra. The enantiomeric ratio of FBTrp was titrated from 100% FBTrp-S to 100% FBTrp-R in samples containing 10 mM P and 10 mM FBTrp (total), the result of which can be seen in spectral form in Fig. 2. Frequency estimates were extracted by fitting analytical Lorentzian functions to the Fourier transformed time domain signal originating from methyl-1H and 31P spins of P (see Fig. 5). Resultant Δd values extracted from the data, taken as the difference between the frequency of signals from each diastereomeric pair (S,S/R,R and S,R/R,S), are plotted against each other (e.g., Fig. 4). These values were then fit using linear-regression accounting for error in both the 1H and 31P axes, to obtain an estimate of the residual 31P Δd at the racemic point (Δd31P(0)).
 | ||
Fig. 2 Titration of the enantiomeric ratio of FBTrp with resultant shift in methyl-1H (top) and 31P (bottom) NMR resonances of P.  and and  highlighted peaks indicate signals arising from complimentary S,S/R,R and opposite R,S/S,R diastereomeric enantiomers, with the frequency depending on the net chirality of the chiral solvating agent. A smooth transition to higher or lower frequencies at intermediate FBTrp enantiomeric ratios occurs because the system is undergoing rapid exchange. Phosphorus spectra are shown with 1H decoupling for clarity, and values of 56% S to 44% S are omitted due to difficulty extracting peak frequency estimates from spectral overlap. highlighted peaks indicate signals arising from complimentary S,S/R,R and opposite R,S/S,R diastereomeric enantiomers, with the frequency depending on the net chirality of the chiral solvating agent. A smooth transition to higher or lower frequencies at intermediate FBTrp enantiomeric ratios occurs because the system is undergoing rapid exchange. Phosphorus spectra are shown with 1H decoupling for clarity, and values of 56% S to 44% S are omitted due to difficulty extracting peak frequency estimates from spectral overlap. | ||
In total, two such enantiodiscriminatory titrations were performed from which Δd31P(0) could be extracted: one with 1H spectra collected using a simple 90° pulse and acquire sequence and 31P spectra collected with a 90° pulse and 1H decoupling; and another titration where 1H spectra were collected using a BIRD pulse sequence and 31P spectra with no 1H decoupling.
In the first experiment, two 1H resonances and one 31P resonance were analyzed to extract Δd. From these, residual 31P splitting values of Δd31P(0) = −170 ± 100 mHz, and Δd31P(0) = −200 ± 120 mHz (weighted average, Δd31P(0) = −190 ± 80) were extracted using 2-dimensional linear regression. Comparing all three gave Δd31P(0,0) = −190 ± 120 mHz following 3-dimensional linear regression. Comparing Δd of both 1H multiplets yields Δd1H(0) = 3 ± 36 mHz which indicates the 1H measurement does not contain an obvious systematic error or other physical effects that lead to a non-zero racemic point intercept. Once the 31P measurement is factored in, however, there clearly arises a shift away from zero, which is unexpected.
The BIRD sequence in the second titration was calibrated according to the J-coupling between the methyl-1Hs and the chiral 31P to suppress broad peaks around the 1H multiplet. This had the side effect of suppressing the second proton multiplet used in the 1H–1H linear regression and 3-dimensional analysis of the first titration. Fortunately, the precision of this 2-dimensional measurement is higher than both of those in the first titration by a factor of approximately 2, yielding Δd31P(0) = −56 ± 61 mHz. Additionally, because each measurement was taken in the form of 64 individual scans for each nucleus rather than as averages, as in the first titration, it was possible to characterize the uncertainty associated with this measurement using conventional statistical considerations in addition to computing the uncertainty from the covariance matrix given by the fit. Thus, the sample mean and standard deviation of the extracted frequency estimates was used to generate the fit shown in Fig. 4 along with the error from fitting and sample preparation.
In fitting the data displayed in Fig. 4, a minimum χ2 of 4.2 is reached, accounting for error from sample preparation and from fitting spectra in both 1H and 31P measurements (see the Experimental section). Since χ2 = 4.2 is less than the degrees of freedom in our measurement (dof = 12), this indicates that either the errors are over-estimated or there are strong correlations between the measurements.70 Thus, to reach the value of Δd31P(0) = −56 ± 61 mHz the errors in both 1H and 31P are scaled by a factor ( ) such that χ2 is equal to the degrees of freedom.
3.3 Discussion of possible systematic error
:1 ratio (obvious from the ESI,† Fig. S7), our “comagnetometry” approach is still able to provide enhanced resolution compared to the NMR linewidth. Since nonlinear concentration dependence is a likely source of systematic error, it would be best to find a system free from this effect or operate in a linear range for future experiments with heavier nuclei.
Comparing proton–proton and proton–phosphorus Δd helps determine in which measurement systematic error arises. Since the proton–proton y-intercept measurement is consistent with zero (Δd1H(0) = 3 ± 36 mHz), while the proton–phosphorus measurement is not for both the methyl-1H and cyclohexyl-1H resonances (see the ESI†), this is a good indication that the systematic error lies in the measurement of the 31P nucleus. As previously mentioned, non-linear changes of Δd in one nucleus with respect to CSA enantiomeric ratio are uncompensated by Δd in the second nucleus and can contribute to systematic error in the measurement of ΔPV.
A critical assumption in our approach is that systematic errors arising from errors in sample preparation are largely removed by nuclear co-sensing, as changes in Δd due to most sources of error – sample preparation, temperature drifts, viscosity, etc. – in 31P should be compensated by 1H Δd. To test this assumption, three samples were prepared with the same stock solutions, implements, measured with the same pulse sequence, and processed to extract Δd. We observed a non-linear distribution of 31P and 1H Δd across the three similar samples (see the ESI,† Fig. S14). Strikingly, the Δd of each sample measured over the course of 48 h showed less variability compared to measurements between samples. This variability has been incorporated into the final measurement as relative uncertainty (δ1H = 1.54%, δ31P = 2.14%) for each point shown in Fig. 4. It is noted that this has the effect of exaggerating the error in points distal to the origin, creating a bias towards points nearer the origin.70
The 31P–1H J-coupling network was characterized using the ANATOLIA software package.71 For this, the 31P multiplet structure of P in chloroform-d was modeled as an AXY3 spin system model (see the ESI,† Fig. S17). This generated coupling constants of 2JPCH3 = 16.8 Hz and 3JPH = 9.1 Hz for the 31P J-coupling to the methyl protons and to the cyclohexyl proton nearest the phosphorus center, respectively (see the ESI†). This assignment is further supported by 1H spectra of both P and its N,N-diethyl analog which both show a 1H multiplet with an identical splitting pattern at similar chemical shifts. An attempt to model the spin system as an AX2Y3 system including coupling to the amino protons of 31P was made; however, the simulated spectra produced using ANATOLIA were unable to match those observed experimentally which indicates these protons are participating in rapid chemical exchange.
 | ||
| Fig. 3 1H (left) and 31P (right) NMR spectra at 850 MHz from which Δd values were extracted for the final comagnetometry plot shown in Fig. 4. 1H spectra were collecting using a BIRD pulse sequence (see the ESI†) and fit with the sum of four complex Lorentzian lines with independent phase and peak center. 31P spectra were acquired using a simple 90° pulse sequence without 1H decoupling and fit with a sum of two multiplets (doublet of quartets, AXY3 spin system) with no phase, assuming purely absorptive lineshapes. Experimentally obtained spectra are overlaid with the best fit line at each sample composition. | ||
 | ||
| Fig. 4 Comagnetometry plot showing diastereomeric splitting (Δd) of 31P spectra as a function of 1H Δd. Each point represents the average Δd ± uncertainty from 64 scans in a 20.0 T NMR spectrometer at 298 K. The region around the origin in enlarged to show the y-axis (i.e. high-Z axis) intercept of the linear fit. A reduced chi squared (χred2) value is used to calibrate the error estimates on each point such that χred2 = 1. The residual plot below indicates there is some deviation from linearity. | ||
Drifts in chemical shift caused by changes in temperature are also possible over the course of a measurement with signal averaging. Though largely mitigated by modern instrumentation, the effect of this in our experiments was assessed in the second titration by taking 64 individual scans of 1H and 31P, alternating between 1H and 31P, for each scan. This allowed the spectra of each nucleus to be processed individually, rather than as a sum as is usual in NMR experiments, allowing statistical treatment of Δd estimates. Time course frequency estimates show that in some samples there are definite drifts in the measurements of Δd over time (see the ESI†) despite using deuterium-locking and a temperature-controlled probe.
 | ||
Fig. 5 Plots illustrating the fitting procedure used to extract Δd from 1H and 31P NMR spectra, with pairs of diastereomeric enantiomers (S,S/R,R and S,R/R,S) highlighted in  or or  . (a) 1H spectrum of a racemic mixture of P and 100% FBTrp-S representing maximal diastereomeric splitting. Broad resonances from protons of the cyclohexyl group overlap with the methyl resonances used for fitting, reducing the goodness of fit and, subsequently, the precision of frequency estimates. (b) The same spectral region after utilizing a BIRD pulse sequence to remove broad peaks surrounding the methyl resonances. This sequence uses pulses to exploit methyl-1H–31P J-coupling of 16.8 Hz to keep the magnetization of coupled protons oriented along Bz while rotating all other magnetization by 180 degrees. A brief delay of 100 ms allows negative magnetization to relax to zero before application of a 90° pulse for acquisition. (c) 31P spectrum of racemic P and 100% FBTrp-S with inverse gated proton decoupling applied during acquisition. (d) 31P spectrum of the same sample without proton decoupling. The signal is a sum of multiplets shown in blue and red corresponding to pairs of epimers. . (a) 1H spectrum of a racemic mixture of P and 100% FBTrp-S representing maximal diastereomeric splitting. Broad resonances from protons of the cyclohexyl group overlap with the methyl resonances used for fitting, reducing the goodness of fit and, subsequently, the precision of frequency estimates. (b) The same spectral region after utilizing a BIRD pulse sequence to remove broad peaks surrounding the methyl resonances. This sequence uses pulses to exploit methyl-1H–31P J-coupling of 16.8 Hz to keep the magnetization of coupled protons oriented along Bz while rotating all other magnetization by 180 degrees. A brief delay of 100 ms allows negative magnetization to relax to zero before application of a 90° pulse for acquisition. (c) 31P spectrum of racemic P and 100% FBTrp-S with inverse gated proton decoupling applied during acquisition. (d) 31P spectrum of the same sample without proton decoupling. The signal is a sum of multiplets shown in blue and red corresponding to pairs of epimers. | ||
To this end, a second peak displaying diastereomeric splitting, namely the cyclohexyl proton closest to the 31P center, was analyzed using a similar fitting procedure as the other peaks reported in this study (see the ESI†). This Δd was then correlated with the two other Δd measurements to generate a 3-dimensional plot which was fit to generate an estimate of residual PV shift in 31P spectra (see the ESI,† Fig. S13), giving a z-intercept estimate (where PV effects are expected to appear in high-Z nuclei) of −190 ± 120 mHz. This shows that the precision in this measurement with this system is not capable of resolving the predicted mHz PV energy shifts in heavy nuclei of chiral molecules. Furthermore, since the splitting is expected to be several μHz in 31P, there is still a considerable systematic error present in this measurement since zero is not included.
This, alongside observations of non-linear changes in 31P Δd, indicate that our comagnetometry approach is influenced by more than contamination of the system by additional chiral molecules. This implies that concentrations must be very carefully controlled to reach the required mHz precision needed to observe PV in NMR.
3.4 Other considerations
Tautomerization is believed to involve the imine as well as the dominant amine isomers of phosphorane P. This phosphine imide is expected to be highly reactive72–75 and could lead to the creation of species seen in samples at higher concentrations of P and FBTrp (see the ESI,† Fig. S8). Another possible cause of broadened spectral lines is changes in the exchange rates between P and FBTrp as concentrations are varied.35Distributions of cyclohexyl substituent conformations could lead to broadening of proton or phosphorus signals through weak (>1 Hz) multi-bond J-couplings. This would contribute to broadening of spectral lines, though is not expected to produce an asymmetric shift away from 0 Hz at the racemic point.
Future measurements would likely benefit from using an NMR spectrometer with a higher static field strength than the 20 T used in this work, as 28 T instruments are now available. This would lead to increases in diastereomeric splitting, which varies linearly with field strength, as well as signal-to-noise which scales with the magnetic field as B07/2. Maximizing signal-to-noise (along with  ) is a primary factor for increasing the precision of frequency estimates in NMR.
Diastereomeric splitting is caused by groups in the CSA which induce changes in electronic charge distribution in the target molecule and may also be enhanced by the chiral-induced spin selectivity (CISS) effect.76,77 The CISS effect leads to preferential transfer of electrons through chiral molecules based on polarization state, which when coupled to nuclei may cause shifts in frequency. This contribution is expected to be symmetric with respect to chirality inversion and not contribute to residual splitting at the racemic point. CISS may lead to different T1 times for S and R enantiomers, however the extent of this has not been quantified.78
4 Conclusions
The goal of this study was to assess sources of error in determining frequency estimates from NMR experiments using diastereomeric complexes containing an intermediate-Z atom (31P). Minimizing sources of error is crucial to observing parity violating chemical shift differences between enantiomers in solution-state NMR, which are expected to be of the order of mHz for high-Z nuclei.We show that using a CSA with a chiral probe allows tunable diastereomeric splitting in two nuclei within the same complex, and find no “show-stoppers” for experiments with high-Z systems, although effects of concentration dependence need to be carefully considered. The next steps would depend on finding/synthesizing an appropriate high-Z system (perhaps, containing 203,205Tl, 207Pb,…).
Author contributions
DB, DAB, JE, EVD, KS, JB, and MW designed the experiments. RB proposed the initial compounds. AEW, KG and RB provided theoretical estimates of parity violating splitting. RP and DK developed a synthetic route to the phosphorus probe molecule starting from commercially available precursors and carried out initial experiments with diastereomeric splitting. EVD performed the experiments and analyzed the data presented in the main text. EVD, DB, DK, and KG wrote the manuscript. All authors edited the manuscript.Data availability
Data for this article, including nuclear magnetic resonance spectra and processing code, are available at https://doi.org/10.5281/zenodo.14802698. Additional data supporting this article have been included as part of the ESI.†Conflicts of interest
There are no conflicts to declare.Acknowledgements
We thank Tanja Weil for support and Louis Bouchard, Yossi Paltiel, Gary Centers, Román Picazo Frutos, Mohamed Sabba, Malcolm Levitt, Igor Koptyug, Andreas Trabesinger, and Mikhail Kozlov for useful discussions. We thank Robert Graf for providing a script to automate collection of the second titration data set and for general help with NMR experiments. This research was supported in part by the DFG Project ID 390831469: EXC 2118 (PRISMA+ Cluster of Excellence). We acknowledge the financial support from the Alexander von Humboldt Foundation in the framework of the Sofja Kovalevskaja Award. Financial support by the Deutsche Forschungsgemeinschaft (DFG, German Research Foundation) from the Collaborative Research Center “Extreme light for sensing and driving molecular chirality” (Projektnummer 328961117, CRC 1319 ELCH) is gratefully acknowledged. K. G. is indebted to the Fonds der Chemischen Industrie (FCI) for generous funding through a Liebig fellowship. This work is generously supported by the Carl-Zeiss-Stiftung (HYMMS project P2022-03-044). AEW, KG and RB gratefully acknowledge the computing time provided at the NHR Center NHR@SW at Goethe-University Frankfurt. This is funded by the Federal Ministry of Education and Research, and the state governments participating on the basis of the resolutions of the GWK for national high performance computing at universities (https://www.nhrverein.de/unsere-partner).Notes and references
- T. D. Lee and C. N. Yang, Phys. Rev., 1956, 104, 254–258 CrossRef CAS.
- C. S. Wu, E. Ambler, R. W. Hayward, D. D. Hoppes and R. P. Hudson, Phys. Rev., 1957, 105, 1413–1415 CrossRef CAS.
- Y. B. Zel’dovitch, Sov. Phys. JETP, 1959, 682 Search PubMed.
- F. Hasert, H. Faissner, W. Krenz, J. Von Krogh, D. Lanske, J. Morfin, K. Schultze, H. Weerts, G. Bertrand-Coremans, J. Lemonne, J. Sacton, W. Van Doninck, P. Vilain, C. Baltay, D. Cundy, D. Haidt, M. Jaffre, P. Musset, A. Pullia, S. Natali, J. Pattison, D. Perkins, A. Rousset, W. Venus, H. Wachsmuth, V. Brisson, B. Degrange, M. Haguenauer, L. Kluberg, U. Nguyen-Khac, P. Petiau, E. Bellotti, S. Bonetti, D. Cavalli, C. Conta, E. Fiorini, M. Rollier, B. Aubert, L. Chounet, P. Heusse, A. Lagarrigue, A. Lutz, J. Vialle, F. Bullock, M. Esten, T. Jones, J. McKenzie, A. Michette, G. Myatt, J. Pinfold and W. Scott, Phys. Lett. B, 1973, 46, 121–124 CrossRef CAS.
- F. Hasert, S. Kabe, W. Krenz, J. Von Krogh, D. Lanske, J. Morfin, K. Schultze, H. Weerts, G. Bertrand-Coremans, J. Sacton, W. Van Doninck, P. Vilain, U. Camerini, D. Cundy, R. Baldi, I. Danilchenko, W. Fry, D. Haidt, S. Natali, P. Musset, B. Osculati, R. Palmer, J. Pattison, D. Perkins, A. Pullia, A. Rousset, W. Venus, H. Wachsmuth, V. Brisson, B. Degrange, M. Haguenauer, L. Kluberg, U. Nguyen-Khac, P. Petiau, E. Belotti, S. Bonetti, D. Cavalli, C. Conta, E. Fiorini, M. Rollier, A. Aubert, D. Blum, L. Chounet, P. Heusse, A. Lagarrigue, A. Lutz, A. Orkin-Lecourtois, J. Vialle, F. Bullock, M. Esten, T. Jones, J. McKenzie, A. Michette, G. Myatt and W. Scott, Phys. Lett. B, 1973, 46, 138–140 Search PubMed.
- D. B. Cline, Neutral Weak Currents the Discovery of the ElectroWeak Force, Addison-Wesley, 1997, pp. 5–11–5–17 Search PubMed.
- M. A. Bouchiat and C. Bouchiat, J. Phys., 1974, 35, 899–927 CrossRef CAS.
- L. M. Barkov and M. S. Zolotorev, Sov. J. Quantum Electron., 1978, 8, 986–988 CrossRef.
- R. Conti, P. Bucksbaum, S. Chu, E. Commins and L. Hunter, Phys. Rev. Lett., 1979, 42, 343–346 Search PubMed.
- M. S. Safronova, D. Budker, D. DeMille, D. F. J. Kimball, A. Derevianko and C. W. Clark, Rev. Mod. Phys., 2018, 90, 025008 CrossRef CAS.
- Y. Yamagata, J. Theor. Biol., 1966, 11, 495–498 CrossRef CAS PubMed.
- S. F. Mason, Nature, 1984, 311, 19–23 CrossRef CAS PubMed.
- I. B. Khriplovich, Parity nonconservation in atomic phenomena, Gordon and Breach Science Publishers, Philadelphia, 1991 Search PubMed.
- R. Berger and J. Stohner, Wiley Interdiscip. Rev.:Comput. Mol. Sci., 2019, 9, e1396 Search PubMed.
- M. Quack, Angew. Chem., Int. Ed. Engl., 1989, 28, 571–586 CrossRef.
- M. Quack, J. Stohner and M. Willeke, Annu. Rev. Phys. Chem., 2008, 59, 741–769 CrossRef CAS PubMed.
- P. Schwerdtfeger, in The Search for Parity Violation in Chiral Molecules, ed. J. Grunenberg, Wiley, Netherlands, 2010, ch. 7, pp. 201–221 Search PubMed.
- A. L. Barra, J. B. Robert and L. Wiesenfeld, Phys. Lett. A, 1986, 115, 443–447 CrossRef CAS.
- A. Barra, J. Robert and L. Wiesenfeld, BioSystems, 1987, 20, 57–61 CrossRef CAS PubMed.
- A. L. Barra, J. B. Robert and L. Wiesenfeld, Europhys. Lett., 1988, 5, 217–222 CrossRef CAS.
- V. G. Gorshkov, M. G. Kozlov and L. N. Labzowsky, Sov. Phys. JETP, 1982, 55, 1042–1048 Search PubMed.
- A. L. Barra and J. B. Robert, Mol. Phys., 1996, 88, 875–886 CrossRef CAS.
- J. B. Robert and A. L. Barra, Chirality, 2001, 13, 699–702 CrossRef CAS PubMed.
- G. Laubender and R. Berger, ChemPhysChem, 2003, 4, 395–399 CrossRef CAS PubMed.
- A. Soncini, F. Faglioni and P. Lazzeretti, Phys. Rev. A:At., Mol., Opt. Phys., 2003, 68, 033402 CrossRef.
- V. Weijo, P. Manninen and J. Vaara, J. Chem. Phys., 2005, 123, 054501 CrossRef PubMed.
- G. Laubender and R. Berger, Phys. Rev. A:At., Mol., Opt. Phys., 2006, 74, 032105 CrossRef.
- R. Bast, P. Schwerdtfeger and T. Saue, J. Chem. Phys., 2006, 125, 064504 CrossRef PubMed.
- V. Weijo, R. Bast, P. Manninen, T. Saue and J. Vaara, J. Chem. Phys., 2007, 126, 074107 CrossRef PubMed.
- V. Weijo, M. B. Hansen, O. Christiansen and P. Manninen, Chem. Phys. Lett., 2009, 470, 166–171 CrossRef CAS.
- S. Nahrwold and R. Berger, J. Chem. Phys., 2009, 130, 214101 CrossRef PubMed.
- S. Nahrwold, R. Berger and P. Schwerdtfeger, J. Chem. Phys., 2014, 140, 024305 CrossRef PubMed.
- J. A. Dale and H. S. Mosher, J. Am. Chem. Soc., 1968, 90, 3732–3738 CrossRef CAS.
- S. Porto, E. Quiñoá and R. Riguera, Tetrahedron, 2014, 70, 3276–3283 CrossRef CAS.
- T. J. Wenzel, Differentiation of Chiral Compounds Using NMR Spectroscopy, 2018 Search PubMed.
- J. Eills, J. W. Blanchard, L. Bougas, M. G. Kozlov, A. Pines and D. Budker, Phys. Rev. A, 2017, 96, 042119 CrossRef.
- V. Andreev, D. G. Ang, D. DeMille, J. M. Doyle, G. Gabrielse, J. Haefner, N. R. Hutzler, Z. Lasner, C. Meisenhelder, B. R. O’Leary, C. D. Panda, A. D. West, E. P. West and X. Wu, Nature, 2018, 562, 355–360 CrossRef CAS PubMed.
- T. S. Roussy, L. Caldwell, T. Wright, W. B. Cairncross, Y. Shagam, K. B. Ng, N. Schlossberger, S. Y. Park, A. Wang, J. Ye and E. A. Cornell, Science, 2023, 381, 46–50 CrossRef CAS PubMed.
- F. Cefalì, A. Iuliano, F. Balzano, G. U. Barretta, V. Zullo and C. Baldassari, Molecules, 2024, 29, 1307 CrossRef PubMed.
- Y. Li and F. M. Raushel, Tetrahedron: Asymmetry, 2007, 18, 1391–1397 CrossRef CAS PubMed.
- J. Garbow, D. Weitekamp and A. Pines, Chem. Phys. Lett., 1982, 93, 504–509 CrossRef CAS.
- J. A. Dale and H. S. Mosher, J. Am. Chem. Soc., 1968, 90, 3732–3738 CrossRef CAS.
- H. Dembinski, P. Ongmongkolkul, C. Deil, H. Schreiner, M. Feickert, C. Burr, J. Watson, F. Rost, A. Pearce, L. Geiger, A. Abdelmotteleb, A. Desai, B. M. Wiedemann, C. Gohlke, J. Sanders, J. Drotleff, J. Eschle, L. Neste, M. E. Gorelli, M. Baak, M. Eliachevitch and O. Zapata, scikit-hep/iminuit, 2024 DOI:10.5281/zenodo.10638795.
- R. Berger, N. Langermann and C. van Wüllen, Phys. Rev. A:At., Mol., Opt. Phys., 2005, 71, 042105 CrossRef.
- R. Berger and C. van Wüllen, J. Chem. Phys., 2005, 122, 134316 CrossRef PubMed.
- T. A. Isaev and R. Berger, Phys. Rev. A:At., Mol., Opt. Phys., 2012, 86, 062515 CrossRef.
- K. Gaul and R. Berger, J. Chem. Phys., 2020, 152, 044101 CrossRef CAS PubMed.
- S. A. Brück, N. Sahu, K. Gaul and R. Berger, J. Chem. Phys., 2023, 158, 194109 CrossRef PubMed.
- M. T. Colombo Jofré, K. Kozioł, I. A. Aucar, K. Gaul, R. Berger and G. A. Aucar, J. Chem. Phys., 2022, 157, 064103 CrossRef PubMed.
- C. Zülch, K. Gaul, S. M. Giesen, R. F. G. Ruiz and R. Berger, arXiv, 2022, physics.chem-ph, preprint, arXiv:2203.10333 DOI:10.1021/ja01016a024.
- C. van Wüllen, Z. Phys. Chem., 2010, 224, 413–426 CrossRef.
- R. Ahlrichs, M. Bär, M. Häser, H. Horn and C. Kölmel, Chem. Phys. Lett., 1989, 162, 165–169 CrossRef CAS.
- P. Pracht, S. Grimme, C. Bannwarth, F. Bohle, S. Ehlert, G. Feldmann, J. Gorges, M. Müller, T. Neudecker, C. Plett, S. Spicher, P. Steinbach, P. A. Wesołowski and F. Zeller, J. Chem. Phys., 2024, 160, 114110 CrossRef CAS PubMed.
- J. P. Perdew, K. Burke and M. Ernzerhof, Phys. Rev. Lett., 1996, 77, 3865–3868 CrossRef CAS PubMed.
- C. Adamo and V. Barone, J. Chem. Phys., 1999, 110, 6158–6170 CrossRef CAS.
- F. Weigend and R. Ahlrichs, Phys. Chem. Chem. Phys., 2005, 7, 3297–3305 RSC.
- TURBOMOLE V7.8 2023, a development of University of Karlsruhe and Forschungszentrum Karlsruhe GmbH, 1989–2007, TURBOMOLE GmbH, since 2007; available from https://www.turbomole.org.
- S. G. Balasubramani, G. P. Chen, S. Coriani, M. Diedenhofen, M. S. Frank, Y. J. Franzke, F. Furche, R. Grotjahn, M. E. Harding, C. Hättig, A. Hellweg, B. Helmich-Paris, C. Holzer, U. Huniar, M. Kaupp, A. Marefat Khah, S. Karbalaei Khani, T. Müller, F. Mack, B. D. Nguyen, S. M. Parker, E. Perlt, D. Rappoport, K. Reiter, S. Roy, M. Rückert, G. Schmitz, M. Sierka, E. Tapavicza, D. P. Tew, C. van Wüllen, V. K. Voora, F. Weigend, A. Wodynski and J. M. Yu, J. Chem. Phys., 2020, 152, 184107 CrossRef CAS PubMed.
- P. A. M. Dirac, Proc. Cambridge Philos. Soc., 1930, 26, 376–385 CrossRef CAS.
- J. C. Slater, Phys. Rev., 1951, 81, 385–390 CrossRef CAS.
- S. H. Vosko, L. Wilk and M. Nuisar, Can. J. Phys., 1980, 58, 1200–1211 CrossRef CAS.
- A. D. Becke, J. Chem. Phys., 1993, 98, 1372–1377 CrossRef CAS.
- K. G. Dyall, Theor. Chem. Acc., 2006, 115, 441–447 Search PubMed.
- W. Kutzelnigg, U. Fleischer and M. Schindler, Deuterium and Shift Calculation, Springer, Berlin, Heidelberg, 1991, vol. 16, pp. 165–262 Search PubMed.
- C. van Wüllen, J. Chem. Phys., 1998, 109, 392–399 CrossRef.
- W. Liu, C. van Wüllen, F. Wang and L. Li, J. Chem. Phys., 2002, 116, 3626–3634 CrossRef CAS.
- K. Kozioł, I. A. Aucar, K. Gaul, R. Berger and G. A. Aucar, J. Chem. Phys., 2024, 161, 064307 CrossRef PubMed.
- N. Stone, At. Data Nucl. Data Tables, 2005, 90, 75–176 CrossRef CAS.
- L. Visscher and K. G. Dyall, At. Data Nucl. Data Tables, 1997, 67, 207–224 CrossRef CAS.
- M. Schmelling, Phys. Scr., 1995, 51, 676–679 CrossRef CAS.
- D. Cheshkov, K. Sheberstov, D. Sinitsyn and V. Chertkov, Magn. Reson. Chem., 2018, 56, 449–457 CrossRef CAS PubMed.
- C. Zhu, A. Bergantini, S. K. Singh, R. I. Kaiser, A. K. Eckhardt, P. R. Schreiner, Y. S. Huang, B. J. Sun and A. H. Chang, Chem. Commun., 2021, 57, 4958–4961 RSC.
- G. Schick, A. Loew, M. Nieger, K. Airola and E. Niecke, Chem. Ber., 1996, 129, 911–917 Search PubMed.
- M. Raab, A. Sundermann, G. Schick, A. Loew, M. Nieger, W. W. Schoeller and E. Niecke, Organometallics, 2001, 20, 1770–1775 CrossRef CAS.
- M. Raab, G. Schick, R. Fondermann, M. Dolg, W. Henze, U. Weynand, R. M. Gschwind, K. Fischer, M. Schmidt and E. Niecke, Angew. Chem., Int. Ed., 2006, 45, 3083–3086 Search PubMed.
- R. Naaman, Y. Paltiel and D. H. Waldeck, J. Phys. Chem. Lett., 2020, 11, 3660–3666 Search PubMed.
- Y. Kapon, Q. Zhu, S. Yochelis, R. Naaman, R. Gutierrez, G. Cuniberti, Y. Paltiel and V. Mujica, J. Chem. Phys., 2023, 159, 224702 CrossRef CAS PubMed.
- T. Georgiou, J. L. Palma, V. Mujica, S. Varela, M. Galante, V. J. Santamaría-García, L. Mboning, R. N. Schwartz, G. Cuniberti and L. S. Bouchard, Nat. Commun., 2024, 15, 7367 CrossRef CAS PubMed.
Footnote |
| † Electronic supplementary information (ESI) available. See DOI: https://doi.org/10.1039/d5cp00126a |
| This journal is © the Owner Societies 2025 |