
Nanozymatic magnetic nanomotors for enhancing photothermal therapy and targeting intracellular SERS sensing†
Shimi
Liu‡
ab,
Dandan
Xu‡
 *ab,
Junling
Chen
ab,
Na
Peng
a,
Tao
Ma
ab and
Feng
Liang
*ab
*ab,
Junling
Chen
ab,
Na
Peng
a,
Tao
Ma
ab and
Feng
Liang
*ab
aThe State Key Laboratory of Refractories and Metallurgy, School of Chemistry and Chemical Engineering, Wuhan University of Science and Technology, Wuhan 430081, China. E-mail: xudandan@wust.edu.cn; feng_liang@whu.edu.cn
bImprove-WUST Joint Laboratory of Advanced Technology for Point-of-Care Testing and Precision Medicine, Wuhan University of Science and Technology, Wuhan 430081, China
First published on 12th July 2023
Abstract
Self-propelled micro/nanomotors (MNMs) have emerged as promising tools for biomedical applications owing to their active and controllable movement, which is achieved by converting energy derived from chemical reactions or external physical fields into mechanical forces. However, it remains a challenge to develop all-in-one MNMs that integrate multiple bio-friendly engines and biomedical functions. In this study, we present a nanozymatic magnetic nanomotor capable of self-propulsion, driven by its intrinsic engines, and possessing inherent biomedical functions. The nanomotors with a core-island structure are fabricated by a general scalable chemistry synthesis approach. The core of the nanomotors is magnetic Fe3O4 nanoparticles, while the surrounding islands consist of Au nanostars. Such components naturally equip the nanomotors with the dual engine of the magnetic core and gold nanozyme. In addition, the localized surface plasmon resonance (LSPR) effect of the Au nanostar imparts the nanomotors with favourable photothermal conversion and surface-enhanced Raman scattering (SERS) properties. The nanomotors exhibit glucose concentration-dependent motion behavior of enhanced diffusion, leading to improved endocytosis for enhanced photothermal treatment. When exposed to a magnetic field, the nanomotors demonstrate both directional locomotion towards target cells and up-and-down oscillatory movement, enabling the efficient gathering of intracellular analytes for SERS sensing. To conclude, the as-prepared nanomotors represent an active and controllable nanoplatform with a simple structure and are naturally equipped with dual engines and dual biomedical functions, providing new perspectives to the development of all-in-one biomedical MNMs.
Introduction
Micro/nanomotors (MNMs) are miniature artificial devices that can perform autonomous and controllable movement to execute assigned tasks at the micro/nanoscale, by harvesting energy from chemical reactions or external physical fields.1–3 In virtue of the motorized property, MNMs can actively and rapidly deliver cargos, gather analytes, and manipulate the demand,4–6 thus are being widely explored for applications involving targeted drug delivery,7–9 biosensing,10,11 and microsurgery.12,13 However, MNMs involved in related works usually possess single function and complex structure. Therefore, developing all-in-one MNMs with versatile biomedical capabilities and simplified architectures is an inevitable choice to address complex bioengineering challenges. In addition, the biocompatibility of both MNMs and their driving mechanisms also remains a crucial consideration for biomedical applications.14 From the viewpoint of powering sources, magnetically driving MNMs allow both active movement and precise control for self-manipulation and targeted transportation of biomedical cargos by responding to external magnetic fields.15,16 Previous studies have demonstrated the feasibility of magnetic driving MNMs in various biomedical applications, including biosensing,11,17 cell transfection,18 and assisted fertilization.13,19 Such powering source is biocompatible and enables the real-time tracking and feedback control of MNMs using bio-imaging techniques.20 Besides, enzyme-driven MNMs harness the catalytic decomposition of molecules (glucose, urea, etc.) available in situ in the biological environment, holding great potential in biomedical fields.21,22 For example, Patino et al. functionalized enzyme-driven MNMs with FRET-labeled triplex DNA nanoswitches for pH sensing the surrounding microenvironment and monitoring their activity status.10 Xu et al. constructed enzyme-driven liquid metal nanomotors that exhibited not only synergetic chemo-photothermal antibacterial treatment but also traceable imaging properties in vivo.23 Yang et al. have successfully engineered an ultra-small enzyme-powered nanomotor capable of enduring powerful mobility and exhibiting high ionic tolerance for self-propulsion in real body fluids. The ultra-small nanomotor demonstrates prolonged circulation time within the blood circulation system of mice.24 However, the structural instability of natural enzymes can compromise their catalytic activity in response to external environmental factors, consequently diminishing the driving efficiency of bio-enzyme-powered MNMs.Nanozymes, nanomaterial-based artificial enzymes, have emerged as an alternative to traditional bio-enzymes by offering higher catalytic stability and lower manufacturing cost. In addition to their catalytic capabilities, nanozymes possess inherent nanomaterial properties that make them valuable for diagnostic and therapeutic applications.25 For instance, gold nanomaterials with excellent bio-compatibility, robust electrical properties, adjustable size and morphology, and tunable optical absorption,26 were found to mimic the catalytic behaviors of glucose oxidase (GOx), hydrolase, catalase, and peroxidase under certain circumstances.25 Gold nanostars (AuNS) with sharp branched structures stand out in the family of gold nanomaterials due to their outstanding plasma effect. To date, AuNS has been exploited for biological imaging, surface-enhanced Raman spectroscopy detection, and photothermal therapy, which turns out to be an ideal agent for biomedical diagnosis and treatment.27 Taking advantage of these performances, we envision that AuNS can serve as not only biocompatible nanozymatic engines for propelling MNMs, but also efficient theranostic nanoagents for biomedical applications. Herein, we demonstrate a nanozymatic magnetic nanomotor with a core-island structure as a potential diagnosis and treatment nanoplatform, named MAuNS. The MAuNS nanomotors were obtained by decorating AuNS islands onto the surface of magnetic nanoparticle (Fe3O4) cores through general chemical reduction and seed-mediated approaches. On the one hand, the magnetic cores endow the MAuNS nanomotors with magnetic response characteristics to perform the controlled movement by responding to an external magnetic field. On the other hand, the AuNS islands possess catalytic activity similar to that of GOx, which can trigger the catalytic reaction of glucose to propel the nanomotors for enhanced diffusion. Additionally, AuNS islands are efficient plasmon components that can generate SERS effect and conduct photothermal conversion, which makes the MAuNS nanomotors capable of being not only SERS probes for SERS sensing but also photothermal reagents for photothermal treatment. The current system presents an active and controllable biomedical MNM equipped with both diagnosis and treatment functions, as an example of the integration of driving mechanisms and that of biomedical functions of MNMs.
Experimental
Materials and characterization
Iron (III) chloride hexahydrate (FeCl3·6H2O), ammonium acetate, trisodium citrate dihydrate (C6H5Na3O7·2H2O), ethylene glycol (EG), chloroauric acid (HAuCl4·3H2O, 99%), L(+)-ascorbic acid (AA), silver nitrate (AgNO3), hydrochloric acid (HCl), ethanol, 3-aminopropyltriethoxysilane (APTES, 99%), crystal violet (CV), 4-mercaptobenzoic acid (4-MBA), phosphate buffered saline (PBS), fluorescein isothiocyanate isomer I (FITC), 4′,6-diamidino-2-phenylindole (DAPI), dulbecco's modified eagle's medium (DMEM), fetal bovine serum (FBS), penicillin–streptomycin, trypsin, cell counting kit-8 (CCK-8), tissue fixative (4% of paraformaldehyde) were obtained from commercial sources and used as received. UV-Vis-NIR absorption spectra were measured using a spectrometer (UV-3600, Shimadzu). Dynamic light scattering (DLS) was performed using a 90Plus PALS instrument (Brookhaven, America) to determine particle sizes. Scanning electron microscopy (SEM) images were captured using a Nova 400 NanoSEM instrument (FEI, America). Transmission electron microscopy (TEM) images and corresponding elemental mapping were recorded using an FEI-TALOS-F200X instrument (Thermo Fisher, America). The X-ray diffraction (XRD) patterns (2θ = 10–90°) were collected using a D8 diffractometer (Bruker, Germany). Fluorescence images were obtained using a Ti2 inverted fluorescence microscope (Nikon, Japan). The measurement of Raman spectra was carried out on a Renishaw/inVia Qontor (Renishaw, America) instrument equipped with a 532 nm laser. Raman spectra in HeLa intracellular were collected using an inverted microscope with a 633 nm laser. The CCK-8 measurements were performed using a Multiskan FC microplate reader (Thermo, China).Preparation of magnetic Fe3O4 nanoparticles
Fe3O4 nanoparticles were synthesized by a hydrothermal reaction according to a previous report with some modifications.28,29 Briefly, FeCl3·6H2O (0.675 g), ammonium acetate (1.925 g), trisodium citrate dihydrate (0.184 g) were dissolved in ethylene glycol (35 mL) by constant ultrasonic treatment. Then, the mixed solution was magnetically stirred for 30 min. The mixture was transferred into a 100 mL Teflon-lined autoclave, which was sealed and kept in an air oven at the temperature of 200 °C for 10 h. After the autoclave was cooled to room temperature naturally, the products were collected and washed with deionized water and ethanol three times by magnetic separation. The purified Fe3O4 nanoparticles were dried at 60 °C for 6 h in a vacuum environment for further use.Preparation of AuNS
10 mL of HAuCl4 (0.25 mM) was added in a 25 mL glass vial, into which 50 μL of AA (100 mM) was added at room temperature under magnetic stirring at the rotation speed of 1000 rpm. The resulting red solution indicated the formation of gold nanoparticles (AuNP). Next, 10 mL of HAuCl4 (0.25 mM), 10 μL of HCl (1 M), and 100 μL of the obtained AuNP were added into a 25 mL glass vial under the same conditions. After that, 50 μL of AA (100 mM) and 100 μL of AgNO3 (5 mM) were quickly and simultaneously added into the above mixture to obtain gold nanostars (AuNS).30Preparation of Fe3O4@AuNP (MAuNP)
9.75 mL of Fe3O4 suspension with a concentration of 0.1 mg mL−1 was added into a 25 mL beaker and stirred by mechanical agitation at the rotation speed of 500 rpm, during which 250 μL of HAuCl4 (10 mM) and 50 μL of AA (100 mM) were successively added into the suspension. Finally, the product was washed and purified with deionized water by magnetic separation.Preparation of Fe3O4@AuNS (MAuNS)
The obtained MAuNP was re-dispersed in 9.75 mL of deionized water, and then 250 μL of HAuCl4 (10 mM) and 10 μL of HCl (1 M) were added under constant mechanical agitation. Next, 50 μL of AA (100 mM) and 100 μL of AgNO3 (5 mM) were added simultaneously into the mixture. After reacting for 30 s, the product was washed and purified with deionized water by magnetic separation.Preparation of Fe3O4@AuNS-FITC (MAuNS-FITC)
In the dark, the mixture, including 5 mg of FITC, 10 μL of APTES, and 1 mL of ethyl alcohol was stirred at room temperature for 30 min to obtain the APTES–FITC conjugate. 30 μL of the conjugate was added to 0.5% of the MAuNS suspension. After oscillating for 1 h, the MAuNS-FITC was obtained and stored at 4 °C for further use.31SERS signal detection of crystal violet (CV) and 4-mercaptobenzoic acid (4-MBA)
First, 20 μL of MAuNS (0.1 mg mL−1) was dropped onto a cover glass (18 × 18 mm) that was treated by plasma. A MAuNS monolayer was obtained after drying at room temperature. Then, CV and 4-MBA with different concentrations were dropped on the MAuNS monolayer for SERS detection. The Raman spectra were collected using a confocal Raman spectrometer (Renishaw/inVia Qontor) with a 532 nm laser (2.5 mW) and an integration time of 10 s.Photothermal property evaluation
First, 1 mL of Fe3O4 suspension and MAuNS suspension at the concentration of 0.1 mg mL−1 in a 1.5 mL glass bottle were illuminated for 10 min with an 808 nm laser source at the power density of 1.5 W cm−2. Next, 1 mL of MAuNS suspensions with concentrations of 0, 0.05, 0.1, and 0.5 mg mL−1 were illuminated under the same laser condition. After that, the concentration of MAuNS suspension was fixed at 0.1 mg mL−1, while the power density was adjusted to 0.3, 0.75, 1.25, and 1.5 W cm−2, respectively, during which other conditions remained unchanged. 1 mL of MAuNS (0.1 mg mL−1) was then subjected to three on–off cycles of NIR light irradiation (808 nm, 1.5 W cm−2, 10 min). Throughout the photothermal test, the thermal imager was turned on to record and photograph the temperature and corresponding image at every min, whose camera was horizontally aligned with the sample containers.Optical video recording
The movement of MAuNS nanomotors was observed using an inverted optical microscope equipped with a 60× air objective. A moderate nanomotor solution was mixed with a glucose solution with a series of concentrations. 20 μL of the mixture was placed in a circular groove, which was covered with a cover glass to reduce the drifting effect. The concentrations of glucose in the mixture were 0, 10, 25, 50, and 100 mM. The movement videos were recorded by a CCD camera at a frame rate of about 20 fps.Mean-square-displacement analysis
The motion trajectory of the nanomotor was analyzed by Particle Tracking-master software, during which MSD was obtained according to MSD(Δt) = <(Xi(t + Δt) − Xi(t))2> (i = 2, for two-dimensional analysis). Subsequently, MSD = 4DeffΔt was applied to calculate the effective diffusion coefficient (Deff) of the nanomotors in glucose solution with different concentrations.32 Statistical results were obtained from the analysis of 15 nanomotors under each condition.Cell culture
HeLa cells were cultured with DMEM supplemented with 10% FBS and 1% (v/v) penicillin–streptomycin in a T-75 culture flask in a 5% CO2 incubator at 37 °C.Cellular uptake
First, 1 mL of cell solution was seeded onto a cover slide within a 35 mm cell culture dish and incubated in a 5% CO2 incubator at 37 °C for 36 h. Then, 10 μL of MAuNS-FITC (5 mg mL−1) was added to the dish and incubated for another 8 h.Cell nucleus staining and fluorescence microscopy observation
The HeLa cells were washed with PBS 3 times (pH = 7.4, 37 °C). Subsequently, the cells were fixed with 4% paraformaldehyde at 37 °C for 15 min and then washed with PBS 3 times. After that, the cells were stained with DAPI (0.035 μg mL−1) for 3 minutes, and then washed with PBS 3 times. The cells were sealed on a glass slide for fluorescence observation using a Ti2 inverted fluorescence microscope.Flow cytometry assay
1 mL of cell solution with appropriate concentration was seeded into three 35 mm cell culture dishes and incubated in a 5% CO2 incubator at 37 °C for 24 h. 10 μL of PBS, 10 μL of MAuNS-FITC (5 mg mL−1), and 10 μL of MAuNS-FITC (5 mg mL−1) plus glucose with the resulting concentration of 50 mM were added into the three dishes, respectively. The dishes were placed in the CO2 incubator at 37 °C for another 10 h of incubation before conducting a flow cytometry assay.Cell viability assay
The cell viability of MAuNS towards the HeLa cell line was evaluated using a standard CCK-8 cell assay. 0.1 mL of cell suspension with a cell density of 10![[thin space (1/6-em)]](https://www.rsc.org/images/entities/char_2009.gif) 000 cells per well was seeded in 96-well plates, which were cultured for 24 h at 37 °C in a 5% CO2 atmosphere. Then, the MAuNS PBS solution with different concentrations was added to relevant wells. After incubation for another 24 h, the solution in 96-well plates was removed and the mixture of CCK-8 and cell culture medium in a ratio of 1:10 was added. After another 4 h of incubation, the absorbance of each well at 450 nm was obtained using a microplate reader. A parallel experiment was conducted to assess the cell viability of the MAuNS to MCF 10A cell line. Moreover, the CCK-8 assay was carried out to determine the cytotoxicity of the MAuNS under the irradiation of an 808 nm laser. After incubation with different concentrations of MAuNS for 4 h, the cells were irradiated for 10 min by the laser at a power density of 1.5 W cm−2. Then, the cells were further incubated for 24 h before conducting the CCK-8 assays. Besides, the cell viability of 50 mM glucose and 50 mM glucose plus PTT were also analysed by similar procedures.
000 cells per well was seeded in 96-well plates, which were cultured for 24 h at 37 °C in a 5% CO2 atmosphere. Then, the MAuNS PBS solution with different concentrations was added to relevant wells. After incubation for another 24 h, the solution in 96-well plates was removed and the mixture of CCK-8 and cell culture medium in a ratio of 1:10 was added. After another 4 h of incubation, the absorbance of each well at 450 nm was obtained using a microplate reader. A parallel experiment was conducted to assess the cell viability of the MAuNS to MCF 10A cell line. Moreover, the CCK-8 assay was carried out to determine the cytotoxicity of the MAuNS under the irradiation of an 808 nm laser. After incubation with different concentrations of MAuNS for 4 h, the cells were irradiated for 10 min by the laser at a power density of 1.5 W cm−2. Then, the cells were further incubated for 24 h before conducting the CCK-8 assays. Besides, the cell viability of 50 mM glucose and 50 mM glucose plus PTT were also analysed by similar procedures.
Magnetically controlled motion observation
A self-developed 3D magnetic control platform was utilized to manipulate the nanomotors to perform the directional and oscillatory motion. The motion behaviors were observed and recorded by an inverted optical microscope equipped with a 40× air objective, and related videos were obtained using the CCD camera at a frame rate of about 20 fps. The nanomotor solution was placed in a circular groove, which was covered with a cover glass to reduce the drifting effect. For the directional motion behavior, the current and voltage were set to 2.0 A and 23.2 V, and the strength of the generated magnetic field was about 22 mT. For oscillatory motion behavior, the frequency was set to 4 Hz. In addition, the magnetically controlled motion behaviors of the nanomotor in the cellular microenvironment, including targeted cell movement and intracellular oscillatory movement, were performed in PBS (pH = 7.4) by similar approaches. Particle Tracking-master software was used to obtain the motion trajectories of the nanomotors under each condition.Intracellular SERS sensing by a single MAuNS
HeLa cells were seeded into four 35 mm Petri dishes and incubated at 37 °C in the 5% CO2 incubator for 24 h. Then, 10 μL of MAuNS (1 mg mL−1) was added into the Petri dish and incubated with HeLa cells for another 8 h. Thereafter, the cell culture medium was removed and cells were cleaned with PBS 3 times. MAuNS taken up by HeLa cells was manipulated under the oscillating magnetic field for 0 min, 30 min, 60 min, and 90 min. Raman spectra of the biomolecules adsorbed on the endocytosed MAuNS were acquired using an inverted optical microscope equipped with a 633 nm laser and a 5 OD aperture. Similarly, the Raman spectrum of the blank group (HeLa cell without the treatment of the nanomotors) was used as a control. The exposure time is 1000 ms.Results and discussion
Synthesis and characterization of the MAuNS nanomotor
The preparation process of MAuNS nanomotors is schematically illustrated in Fig. 1a. The magnetic core of Fe3O4 was first synthesized by the hydrothermal method.28,29 The scanning electron microscope (SEM) image of Fe3O4 nanoparticles with a relatively uniform diameter of 484 ± 69 nm is provided in Fig. S1 in the ESI.† Subsequently, magnetic Au nanoparticles (MAuNP) were obtained by the direct reduction of HAuCl4 on the surface of Fe3O4 cores. As indicated by the SEM and transmission electron microscopy (TEM) images in Fig. S2 and Fig. S3a, c in the ESI,† the MAuNP presents a core-island structure with spherical Au nanoparticles spreading over the Fe3O4. Afterwards, through a seed-mediated growth approach, Au nanostars were in situ formed on Au nanoparticles of the MAuNP, resulting in MAuNS nanomotors with core-island structure. Fig. 1b, c and Fig. S3b, d in the ESI† show SEM and TEM images of MAuNS, which evidences the presence of multi-branched Au nanostars anchored on the surface of Fe3O4. In these data, Fig. 1c shows the TEM image of one typical MAuNS and corresponding elemental analysis by energy dispersive spectrometer (EDS), further confirming the formation of MAuNS by the coexistence of Fe, O, and Au elements. Different imaging contrasts found in both SEM and TEM images of MAuNP and MAuNS are due to the higher electrical conductivity of gold nanomaterials compared with Fe3O4 nanoparticles. The hydrodynamic diameters of Fe3O4, MAuNP, and MAuNS measured using dynamic light scattering (DLS) were 525 nm, 538 nm, and 580 nm, respectively (Fig. 1d). The increasing hydrodynamic diameter also demonstrates the successful preparation of MAuNP and MAuNS, where the star-like islands further enlarge the diameter of the core-island structure than the spherical islands. The X-ray diffraction (XRD) patterns of Fe3O4, MAuNP, and MAuNS are provided in Fig. 1e. The XRD peaks of the Fe3O4 completely point to the (220), (311), (400), (511), and (440) planes of magnetite (JCPDS: 46-1543) at 2θ = 30.16°, 35.46°, 43.16°, 57.16°, and 62.63°, respectively, suggesting that the as-prepared Fe3O4 possess the favourable character of magnetic response. In addition, the diffraction peaks of both MAuNP and MAuNS at 2θ = 38.1°, 44.3°, 64.5°, and 77.5° correspond to coherent diffractions from (111), (200), (220), and (311) planes of the gold face-centered cubic structure (JCPDS: 99-0056). Compared with MAuNP, MAuNS exhibited an apparent diffraction peak at 81°, which would be attributed to the formation of star-shaped nanostructures. Besides, all the intensity and half-width of diffraction peaks of the Au phase from MAuNS are greater than those of MAuNP. It is suggested that the enhanced crystallization of Au nanostar is due to the regrowth of Au atoms on the crystal face of Au nanoparticles. Meanwhile, the diffraction peaks at 2θ = 30.16° and 35.46° of MAuNP and that at 2θ = 35.46° of MAuNS are, respectively, attributed to the (220) and (311) planes of the Fe3O4 core. The results of XRD indicate the successful formation of MAuNP and MAuNS composites with crystal structures.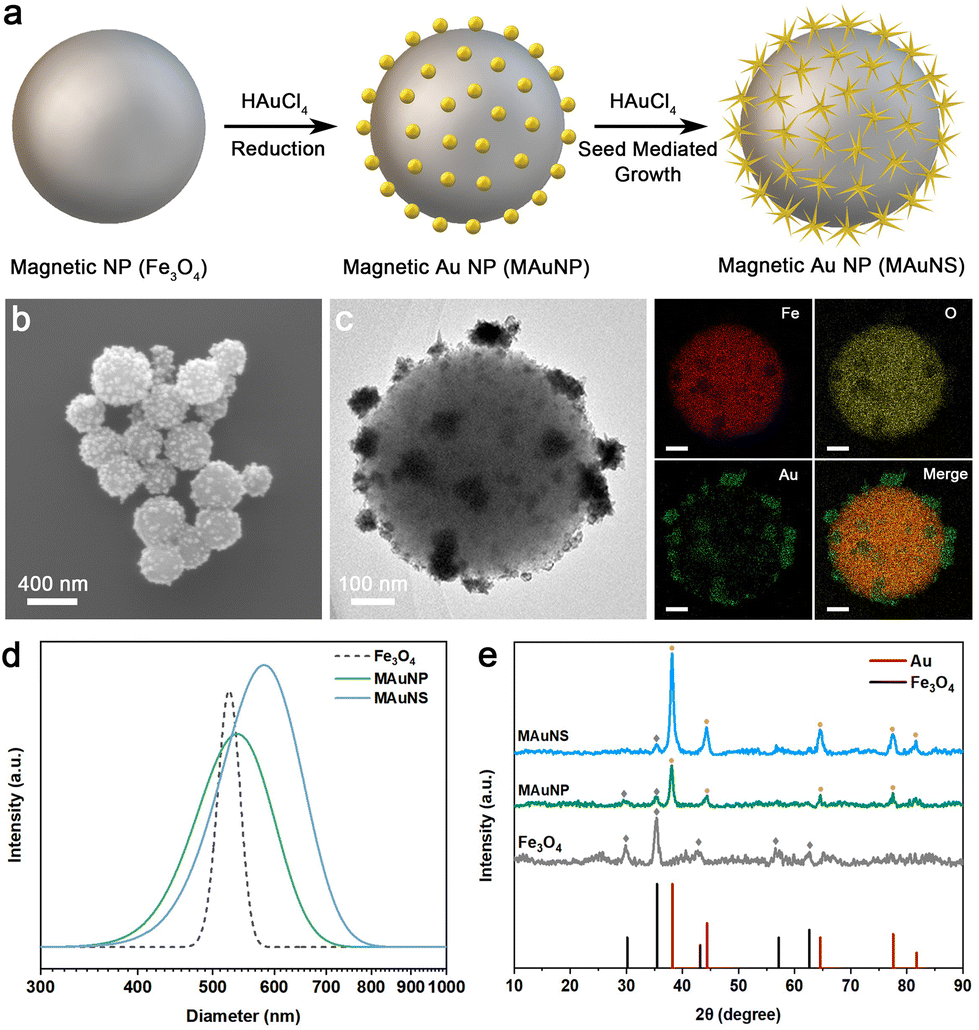 | ||
| Fig. 1 (a) Schematic illustration of the fabrication of a MAuNS. (b) SEM image and (c) TEM image of MAuNS with corresponding elemental mapping by EDS. (d) Size distributions and (e) XRD patterns of Fe3O4, MAuNP and MAuNS. | ||
Nanozyme-powered motion behavior of the MAuNS nanomotor
Taking advantage of the GOx-like catalytic activity of AuNS, the MAuNS nanomotor can actively perform the movement of enhanced diffusion by the oxidative decomposition of glucose into gluconic acid and H2O2 (Fig. 2a). To study the motion behavior of MAuNS nanomotors, the videos of swimming MAuNS nanomotors in glucose solution were observed by dark-field microscopy and taken by a charge-coupled device (CCD) camera. After that, the videos were analyzed to extract the corresponding trajectories of the swimming nanomotors, and their mean-square-displacement (MSD) was obtained through a self-developed software based on Python (Videos S1–S5 in the ESI†). Fig. 2a provides representative video snapshots of MAuNS nanomotors swimming in a glucose solution of 50 mM (Video S4 in the ESI†), showing motion behavior of active and random motion. The plots of average MSD versus time interval (Δt), and typical trajectories of the MAuNS nanomotors swimming in glucose solution with the concentration of 0, 10, 25, 50, and 100 mM during 30 s are present in Fig. 2b and Fig. S4 in the ESI.† It was found that the slope value of the linear MSD curve was positively correlated with the glucose concentration in the range from 0 mM to 50 mM while descending at the concentration of 100 mM, suggesting the motion behavior varying from Brownian movement to self-propulsion. We calculated the average diffusion coefficient (Deff) of self-propelled MAuNS nanomotors in glucose solution with different concentrations (Fig. 2c).32 It was found that the Deff initially increased from 0.444 ± 0.022 (Deff ± SD, N = 15) to 0.815 ± 0.127 μm2 s−1 with the increasing glucose concentration, then, it slightly dropped to 0.761 ± 0.087 μm2 s−1. The reason is that with other parameters kept constant, a higher concentration of glucose solution brings about higher viscosity.33 When the concentration of glucose solution increases from 0 mM to 50 mM, the driving force to the MAuNS nanomotors generated by the decomposition of glucose is greater than the resistance generated by the viscosity of glucose solution, resulting in the increasing MSD and diffusion coefficient. When the concentration further increased to 100 mM, the driving force to the nanomotors is less than the resistance, leading to the reduction in the MSD and diffusion coefficient.32 Instead of constructing an asymmetric structure on purpose, the non-homogeneous distribution of the AuNS islands of the MAuNS nanomotor induces the unsymmetrical decomposition reaction of glucose occurring on its surface, further resulting in enhanced diffusion behaviour of the nanomotors.34 We also verified the behavior of enhanced diffusion by DLS (Fig. 2d and e). With the glucose concentration changing, the diffusion coefficient distribution of the MAuNS nanomotors first right-shifts and then slightly left-shifts, when the average diffusion coefficient of MAuNS increases from 0.406 μm2 s−1 (PDI = 0.216) at 0 mM glucose to 0.728 μm2 s−1 (PDI = 0.243) at 50 mM glucose and then declines to 0.653 μm2 s−1 (PDI = 0.219) at 100 mM glucose. The diffusion coefficient of the nanozymatic nanomotors was increased by about 84% and 79% analyzed using MSD and DLS, respectively, at the glucose concentration of 50 mM. The variation trend of the DLS results is in good consistency with that of the MSD results, which suggests the fuel concentration-dependent enhanced diffusion behaviour of the MAuNS nanomotor.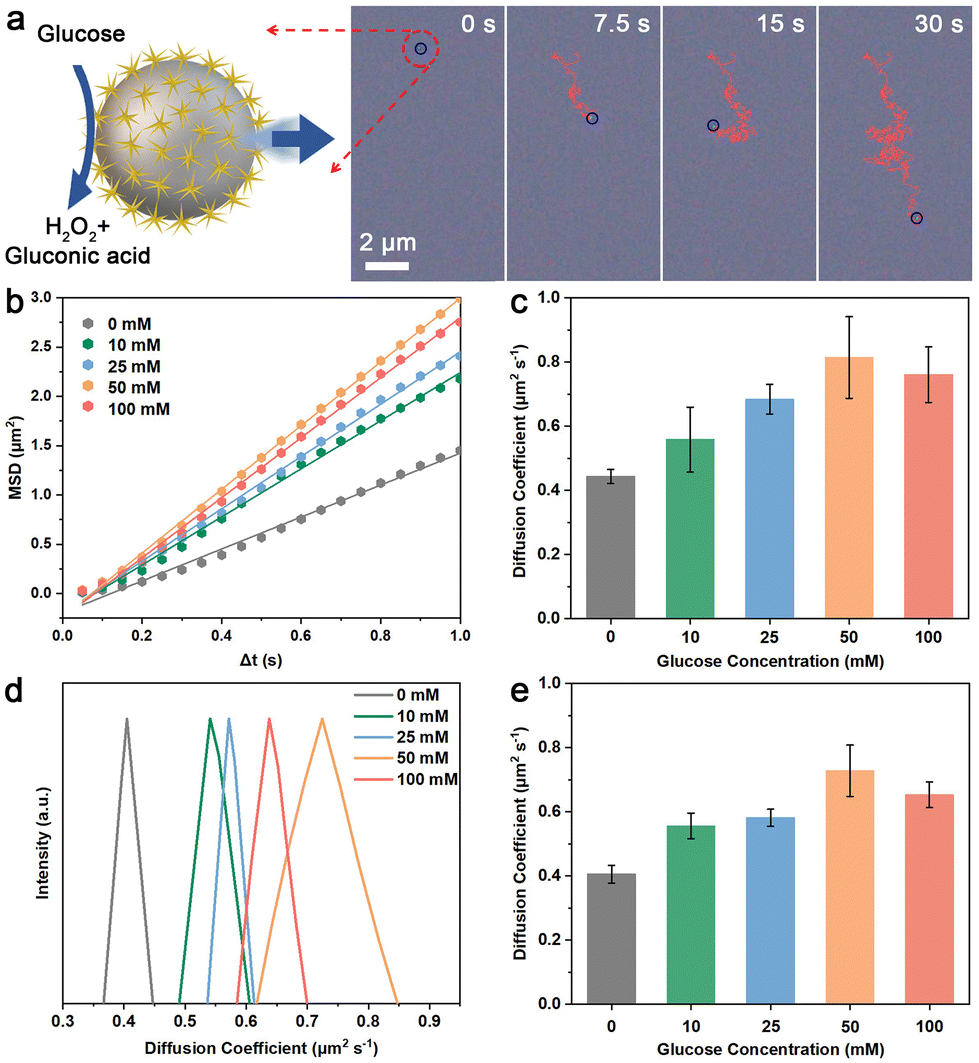 | ||
| Fig. 2 (a) Scheme illustration of a MAuNS nanomotor fueled by glucose and video snapshots of a MAuNS nanomotor swimming in glucose solution with the concentration of 50 mM during 30 s. (b) Plots of average MSD versus Δt obtained from tracking trajectories of MAuNS nanomotors swimming in glucose solution with different concentrations. N = 15. (c) Diffusion coefficient values of MAuNS nanomotors in glucose solution with different concentrations obtained from the MSD plots. N = 15. (d) Diffusion coefficient distributions and (e) values of MAuNS nanomotors in glucose solution with different concentrations measured by DLS. | ||
Nanozymatic MAuNS nanomotors for enhanced photothermal therapy
We characterized the optical properties of MAuNS in DI water. As is shown in Fig. S5 in the ESI,† Fe3O4 and AuNS show strong characteristic absorption peaks at about 742 and 783 nm, respectively. Compared with the absorption peak of AuNS, that of MAuNS generates red shift and exhibits an extra broad absorption from 710 to 1200 nm. The reason is that the dielectric constant of MAuNS is greater than that of the AuNS, suggesting a good coupling between the Fe3O4 cores and AuNS islands.35,36 Such absorption characteristics of MAuNS in the near-infrared region indicate that MAuNS can achieve efficient photothermal conversion and thus serve as a photothermal agent for tumor ablation (Fig. 3a). The inset of Fig. S5 in the ESI† presents the pictures of brown Fe3O4, blue-grey MAuNS, and dark blue AuNS solutions. The photothermal conversion performance of MAuNS was evaluated using an infrared thermal imager. With water as the blank control, MAuNS possesses an excellent photothermal effect 30 percent higher than that of Fe3O4 (Fig. S6 in the ESI†), which presents positive correlations with its concentration and the intensity of infrared laser power (Fig. 3b, c, and Fig. S7a, b in the ESI†). In addition, the photostability of the MAuNS was detected by monitoring the temperature variations of MAuNS subjected to three heating–cooling cycles under NIR light irradiation (808 nm and 1.5 W cm−2, 10 min). After three cycles, the maximum temperature difference decreased from 49.6 °C to 47 °C (Fig. S7c in the ESI†). The negligible change indicates that MAuNS is capable of being applied for repeatable photothermal therapy. | ||
| Fig. 3 (a) Scheme illustration of MAuNS nanomotors for photothermal therapy in vitro. Photothermal responding images of MAuNS solution with various (b) concentrations and (c) power intensities under NIR laser irradiation (808 nm, 10 min). (d) Average fluorescence intensity of FITC (green) within blank cells (control) and cells after incubation with MAuNS + glucose (0 mM) and MAuNS + glucose (50 mM). The cell nucleus stained with DAPI (blue). Data presented as mean ± SD, N = 30. Inset: representative fluorescence images. (e) Fluorescence histograms and (f) corresponding intensities determined by flow cytometry. (g) Cell viability of HeLa cells after incubation with MAuNS and MAuNS + 808 nm laser illumination (PTT). (h) Cell viability of blank HeLa cells (control) and cells after incubation with glucose, MAuNS, MAuNS + 808 nm laser illumination (PTT), and MAuNS + glucose + 808 nm laser illumination (PTT + glucose). | ||
Studies have shown that the active movement of MNMs plays a pivotal role in facilitating their interaction with cell membranes to enhance the cellular uptake of MNMs, which holds significant potential to fulfill the biomedical functions of MNMs.37,38 Before using MAuNS for tumor ablation, we first investigated the cellular uptake of nanozymatic MAuNS nanomotors. The cell nucleus was labeled with 4′,6-diamidino-2-phenylindole (DAPI) with blue fluorescence emission, and the nanomotors with fluorescein isothiocyanate (FITC) with green fluorescence emission to allow their cellular location. Combined with the findings of the study of motion behavior of nanozymatic MAuNS nanomotors, fluorescence images of blank HeLa cells and HeLa cells treated with MAuNS + glucose (0 mM) and MAuNS + glucose (50 mM) were captured to semi-quantitatively evaluate the influence of the enhanced diffusion of MAuNS on cellular uptake. The average FITC fluorescence emission intensities in the red-circle regions in the inset of Fig. 3d were calculated using ImageJ. Subtracting the fluorescence intensity of blank HeLa cells, that of cells treated with MAuNS + glucose (50 mM) was about 46.20, which is about triple that with MAuNS + glucose (0 mM) of 14.99. Upon the addition of glucose, the concentration of glucose in the cell culture medium was elevated, facilitating the nanozyme-triggered enhanced diffusion of MAuNS and consequently leading to an augmented effect on cellular uptake.39,40 In addition, quantitative analysis was conducted under the same condition using flow cytometry to further certify the enhanced cellular uptake effect. After subtracting the fluorescence intensity of blank HeLa cells, the fluorescence intensity of cells treated with MAuNS increases from 11107.26 to 15519.27 by about 39.72% due to the addition of glucose (Fig. 3e). Fig. 3f displays the gradually right-shifted fluorescence intensity distribution from blank HeLa cells to cells treated with MAuNS + glucose (0 mM), then to MAuNS + glucose (50 mM). Relevant scatter plots are provided in Fig. S8 in the ESI.† The results of flow cytometry analysis were well consistent with those obtained using ImageJ. The improved cellular uptake is rather beneficial for the biomedical application of MAuNS.
Subsequently, we utilized MAuNS with excellent photothermal conversion capability for photothermal therapy (PTT) towards HeLa cells chosen as model cells. For the purpose of serving as biomedical nanodevices, the cytotoxicity of MAuNS was first investigated in vitro by CCK-8 assay. A normal cell line (MCF 10A cell line) was used to evaluate the safety of these nanomotors for biomedical applications. The viability of MCF 10A cells treated with nanomotors at the concentration of 100 μg mL−1 was maintained up to 80%, indicating that the nanomotors had little cytotoxicity to normal cells and are safe for biomedical applications within the proper concentration range (Fig. S9†). For HeLa cells, the cell viability incubated with MAuNS of 100 μg mL−1 under dark conditions was as high as that of blank cells, indicating that the MAuNS itself possesses negligible cytotoxicity towards HeLa cells (Fig. 3g). However, the cell viability only remained 47.60% after being treated with MAuNS at the same concentration upon NIR laser irradiation (the PTT group). The decreased survival rate of cells is attributed to the photothermal toxicity of MAuNS, which is positively correlated with its concentration. It is worth noting that the photothermal toxicity of MAuNS at low concentrations (12.5 and 25 μg mL−1) towards HeLa cells is negligible upon NIR laser irradiation. In the meantime, cell proliferation could benefit from the slight photothermal effect generated during the process of photothermal treatment, resulting in a higher cell survival rate after photothermal treatment than that after co-incubation only. To study the influence of improved cellular uptake of MAuNS on its photothermal toxicity, the cell viability of blank cells (control), cells after incubation with glucose (50 mM), MAuNS (100 μg mL−1), after PTT, and after PTT with the addition of glucose were analyzed and were found to be 100%, 104.57%, 107.42%, 47.60% and 25.29% (Fig. 3h), respectively. The light irradiation of 10 min was performed with an 808 nm NIR laser at a power density of 1.5 W cm−2 during the PTT process. The results suggest the addition of the biological fuel of glucose promotes the effect of photothermal therapy by improving the cellular uptake of MAuNS.
Magnetic MAuNS nanomotor for intracellular SERS sensing
The localized surface plasmon resonance (LSPR) effect on the surface of Au nanostructures can be excited for enhancing the Raman scattered signal by several orders of magnitude.41 Besides, the sharp branches and branching angles of AuNS are capable of offering extra SERS hotspots to improve SERS sensing capability.42,43 Based on the above property of AuNS, the SERS activity of MAuNS was investigated by using crystal violet (CV) and 4-mercaptobenzoic acid (4-MBA) as typical SERS analytes. First, Fe3O4, MAuNP, and MAuNS served as SERS probes to obtain the Raman spectra of CV with a Raman shift range of 400–2000 cm−1. The characteristic peaks of CV located at 520, 728, 804, 910, 1173, 1372, 1531, 1585, and 1617 cm−1 and that of 4-MBA located at 1080 cm−1 and 1580 cm−1 (Fig. 4a and Fig. S10a in the ESI†) are present only when MAuNS as the SERS probe.43,44 The results provide evidence of the outstanding SERS sensing activity of MAuNS, which is ascribed to the presence of the AuNS islands. Taking the Raman peak at 1372 cm−1 as the typical peak, it was found that the SERS signal intensity of CV detected by MAuNS was concentration-dependent and the limit of detection was 10−8 M (Fig. 4b). A similar pattern was also observed in 4-MBA when using taking the Raman peak at 1080 cm−1 as the typical peak (Fig. S10b in the ESI†). The results indicate that the SERS sensing capability of the MAuNS probe is comparable to that of other AuNS composite SERS probes, which ensures its potential for further SERS sensing application.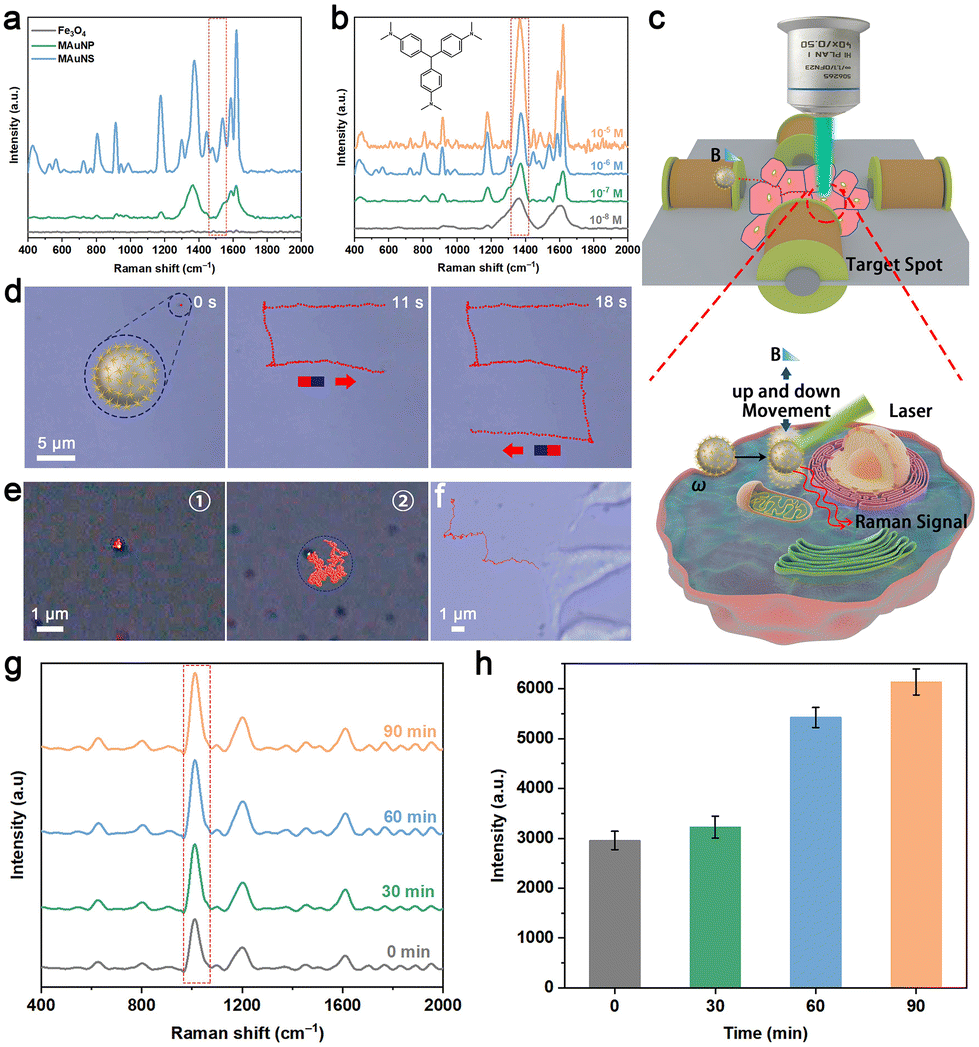 | ||
| Fig. 4 (a) Raman spectra of CV with the concentration of 10−6 M using Fe3O4, MAuNP and MAuNS as SERS probes. (b) Raman spectra of CV with different concentrations from 10−8 M to 10−5 M using MAuNS as SERS probe. (c) Schematic illustration of a MAuNS nanomotor for targeted cellular SERS sensing. (d) Video snapshots of a MAuNS nanomotor navigating along a predesignated route under the actuation of the gradient magnetic field. (e) Motion trajectories of MAuNS nanomotors with (①) and without (②) the application of oscillating magnetic field within 20 s. (f) Motion trajectory of one MAuNS nanomotor targeting HeLa cell under the actuation of gradient magnetic field. (g) Raman spectra of the intracellular sites on the surface of MAuNS from four different cells that were treated with the oscillating magnetic field for 0, 30, 60, and 90 min. (h) Histogram showing the intracellular SERS signal intensities at 1007 cm−1 from several cells that were subjected to the oscillating magnetic field for varying durations. N = 30. | ||
Moreover, the MAuNS nanomotor is endowed with magnetic responsiveness derived from its magnetic core; thus it can conduct magnetic-controlled motion under an external magnetic field. Hereby, we demonstrate the directional and oscillatory motion of MAuNS to approach a designated site for SERS sensing of a single cell (Fig. 4c). A 3D magnetic control platform was self-built to manipulate the MAuNS. A gradient magnetic field with a strength of about 22 mT was generated by setting the current to 2.0 A and the voltage to 23.2 V to drive MAuNS for directional movement. Related video and video snapshots are provided in Video S6 in the ESI† and Fig. 4d. The results show that the MAuNS was “pulled” to move along a predesignated S-shaped route, during which the nanomotor changed its direction of movement according to the changing of the direction of the gradient magnetic field. In such a manner, the delivery of MAuNS targeting one single cell is expected to be accomplished by magnetic manipulation. Besides, the frequency was set to 4 Hz to generate an oscillating magnetic field for the actuation of up and down oscillatory movement. To certify the oscillatory motion behavior of MAuNS nanomotors, the videos of MAuNS under/without the oscillating magnetic field were horizontally taken and corresponding video snapshots are provided in Videos S7, S8 and Fig. S11 in the ESI† and Fig. 4e, respectively, lacking techniques for recording 3D video. The results indicate that the application of the oscillating magnetic field generated a magnetic force in the vertical direction to drive the nanomotor to execute upward and downward movements. This constrained motion along the vertical axis is depicted by the circumscribed blue dotted lines in Fig. S11 of the ESI.† With sharp branches of AuNS adorning its surface, the nanomotor exhibits the capacity to gather substances within individual cells, thereby enhancing intracellular SERS sensing capabilities.45
The magnetically controlled motion behaviour of the nanomotor was also investigated in the cellular microenvironment. Fig. 4f and Video S9 in the ESI† display that a MAuNS locomote under the guidance of the gradient magnetic field and eventually reach the cell membrane of a designated cell. Then, the MAuNS would be swallowed by the cell into its interior, during which the magnetic force generated by the gradient magnetic field could help by facilitating the contact between the nanomotor and cell membrane. After that, the MAuNS were used as SERS probes for intracellular sensing. As shown in Fig. S12 in the ESI,† the Raman spectrum of biomolecules surrounding the internalized MAuNS by the HeLa cell notably exhibits several characteristic peaks that are absent in the spectrum of the blank cell without the addition of the nanomotors. Characteristic Raman peaks and related assignments are provided in Table 1,46,47 among which the intracellular-specific molecules are identified by the presence of characteristic peaks at 804 cm−1 (attributed to O–P–O stretching in RNA) and 1096 cm−1 (attributed to symmetric PO2 stretching of the DNA backbone). It is suggested that the nanomotors can effectively function as SERS probes for the detection of intracellular molecules. Because of the viscous resistance in the intracellular environment, the endocytosed probes can only passively sense a few biomolecules around, leading to weak signal strength. Hereby, the oscillating magnetic field was applied to hopefully actuate the probes to move vertically and gather analytes inside the cell. Raman spectra of biomolecules around the intracellular MAuNS were measured after the treatment with an oscillating magnetic field for different durations (Fig. 4g). The Raman signal at 1007 cm−1 was selected as a reference, which was significantly improved with the prolonged time of applying the oscillating magnetic field (Fig. 4h). This is because, with the prolonging time, the intracellular mechanical motion of MAuNS contributes to the increasing number of biomolecules adsorbed on the SERS hotspots on its surface, which in return supports our hypothesis. The result showed that the signal intensity increased by 83.48% after 60 min of treatment. It is regarded as the most efficient time parameter in our case, taking both treatment time and signal strength into consideration.
| Raman shift [cm−1] | Raman shift [cm−1] | Assignment | Ref. |
|---|---|---|---|
| 624 | 621 | C–C twisting mode of Phe (proteins) | 46 |
| 804 | 811 | O–P–O stretching RNA | 47 |
| 1007 | 1003 | C–C aromatic ring stretching in Phe | 46 |
| 1096 | 1093 | Symmetric PO2 stretching of the DNA backbone; lipids | 46 |
| 1200 | 1208 | C–C6H5 stretching mode in Trp, Phe | 46 |
| 1455 | 1453 | Proteins | 47 |
| 1608 | 1618 | C![[double bond, length as m-dash]](https://www.rsc.org/images/entities/char_e001.gif) C Phe, Tyr and Trp C Phe, Tyr and Trp |
46 |
Conclusions
In summary, we proposed a biomedical MAuNS nanomotor integrating both nanozymatic and magnetic engines. The nanomotor with a core (Fe3O4)-island (AuNS) structure possesses the capabilities of both photothermal conversion and SERS sensing. The Fe3O4 core is the primary component with the function of magnetic driving, and the AuNS island is the all-in-one component that served as the nanozymatic engine, photothermal agent, and SERS probe. By nanozyme-catalyzed decomposition of glucose, the MAuNS conducts concentration-dependent enhanced diffusion, which improved the cellular uptake of MAuNS, achieving an increased effect of photothermal therapy in vitro. Besides, the nanomotor can be driven by the gradient magnetic field for directional movement toward the target cell. After being endocytosed by the cell, the nanomotor performs up-and-down locomotion controlled by the oscillating magnetic field. Such motion behaviour can assist in the enrichment of the intracellular biomolecules on the SERS hotspots of the nanomotor, resulting in an enhanced SERS signal. In virtue of the intrinsic properties of the MAuNS nanocomposite, the nanomotor is capable of nanozymatic enhanced diffusion for enhanced photothermal therapy and magnetically controlled motion for targeting intracellular SERS sensing. Additionally, the combination of the magnetic resonance imaging property of Fe3O4 and the photoacoustic imaging property of AuNS enables the nanomotors to be tracked and visualized in real-time during their motion within biological systems, which facilitates the driving control of the nanomotors in vivo. Thus, this platform holds great potential for conducting image-mediated therapies and sensing for in vivo scenarios. Overall, we not only propose a preparation approach for MNMs of simple construction but also promote the development of the integration of various driving mechanisms and multiple biomedical functions on one nanomotor.Author contributions
Conceptualization: D. Xu. Experiment: S. Liu. Resource: J. Chen, N. Peng, T. Ma, and F. Liang. Supervision: D. Xu and F. Liang. Original draft: S. Liu. Review and editing: D. Xu. All authors have approved the final version of the manuscript.Conflicts of interest
There are no conflicts to declare.Acknowledgements
D. Xu thanks the support from the Natural Science Foundation of Hubei Province (No. 2022CFB588), and F. Liang thanks the support from the Program for Outstanding Young and Middle-aged Scientific Innovation Team of Colleges and Universities of Hubei Province (No. T201702).References
- S. Sánchez, L. Soler and J. Katuri, Angew. Chem., Int. Ed., 2015, 54, 1414–1444 CrossRef PubMed.
- T. Liu, L. Xie, C.-A. H. Price, J. Liu, Q. He and B. Kong, Chem. Soc. Rev., 2022, 51, 10083–10119 RSC.
- Y. Hou, H. Wang, R. Fu, X. Wang, J. Yu, S. Zhang, Q. Huang, Y. Sun and T. Fukuda, Lab Chip, 2023, 23, 848–868 RSC.
- J. Li, B. Esteban-Fernández de Ávila, W. Gao, L. Zhang and J. Wang, Sci. Robot, 2017, 2, eaam6431 CrossRef PubMed.
- M. Luo, Y. Feng, T. Wang and J. Guan, Adv. Funct. Mater., 2018, 28, 1706100 CrossRef.
- M. Cianchetti, C. Laschi, A. Menciassi and P. Dario, Nat. Rev. Mater., 2018, 3, 143–153 CrossRef.
- X. Wei, M. Beltran-Gastelum, E. Karshalev, B. Esteban-Fernández de Ávila, J. Zhou, D. Ran, P. Angsantikul, R. H. Fang, J. Wang and L. Zhang, Nano Lett., 2019, 19, 1914–1921 CrossRef CAS PubMed.
- F. Qiu, S. Fujita, R. Mhanna, L. Zhang, B. R. Simona and B. J. Nelson, Adv. Funct. Mater., 2015, 25, 1666–1671 CrossRef CAS.
- A. Llopis-Lorente, A. García-Fernández, N. Murillo-Cremaes, A. C. Hortelão, T. Patiño, R. Villalonga, F. Sancenón, R. Martínez-Máñez and S. Sánchez, ACS Nano, 2019, 13, 12171–12183 CrossRef CAS PubMed.
- T. Patino, A. Porchetta, A. Jannasch, A. Lladó, T. Stumpp, E. Schäffer, F. Ricci and S. Sánchez, Nano Lett., 2019, 19, 3440–3447 CrossRef CAS PubMed.
- Y. Wang, Y. Liu, Y. Li, D. Xu, X. Pan, Y. Chen, D. Zhou, B. Wang, H. Feng and X. Ma, Research, 2020, 2020, 7962024 CAS.
- S. K. Srivastava, M. Medina-Sánchez, B. Koch and O. G. Schmidt, Adv. Mater., 2016, 28, 832–837 CrossRef CAS PubMed.
- H. Xu, M. Medina-Sánchez and O. G. Schmidt, Angew. Chem., Int. Ed., 2020, 59, 15029–15037 CrossRef CAS PubMed.
- J. Wang, Nat. Commun., 2021, 12, 7125 CrossRef CAS PubMed.
- H. Zhou, C. C. Mayorga-Martinez, S. Pané, L. Zhang and M. Pumera, Chem. Rev., 2021, 121, 4999–5041 CrossRef CAS PubMed.
- X.-Z. Chen, M. Hoop, F. Mushtaq, E. Siringil, C. Hu, B. J. Nelson and S. Pané, Appl. Mater. Today, 2017, 9, 37–48 CrossRef.
- Y. Chen, R. Pan, Y. Wang, P. Guo, X. Liu, F. Ji, J. Hu, X. Yan, G. P. Wang, L. Zhang, Y. Sun and X. Ma, Adv. Funct. Mater., 2022, 32, 2200600 CrossRef CAS.
- V. M. Kadiri, C. Bussi, A. W. Holle, K. Son, H. Kwon, G. Schütz, M. G. Gutierrez and P. Fischer, Adv. Mater., 2020, 32, 2001114 CrossRef CAS PubMed.
- M. Medina-Sánchez, L. Schwarz, A. K. Meyer, F. Hebenstreit and O. G. Schmidt, Nano Lett., 2016, 16, 555–561 CrossRef PubMed.
- X. Yan, Q. Zhou, M. Vincent, Y. Deng, J. Yu, J. Xu, T. Xu, T. Tang, L. Bian, Y.-X. J. Wang, K. Kostarelos and L. Zhang, Sci. Robot, 2017, 2, eaaq1155 CrossRef PubMed.
- K. K. Dey, X. Zhao, B. M. Tansi, W. J. Méndez-Ortiz, U. M. Córdova-Figueroa, R. Golestanian and A. Sen, Nano Lett., 2015, 15, 8311–8315 CrossRef CAS PubMed.
- X. Zhao, K. Gentile, F. Mohajerani and A. Sen, Acc. Chem. Res., 2018, 51, 2373–2381 CrossRef CAS PubMed.
- D. Xu, J. Hu, X. Pan, S. Sánchez, X. Yan and X. Ma, ACS Nano, 2021, 15, 11543–11554 CrossRef CAS PubMed.
- Z. Yang, L. Wang, Z. Gao, X. Hao, M. Luo, Z. Yu and J. Guan, ACS Nano, 2023, 17, 6023–6035 CrossRef CAS PubMed.
- D. Jiang, D. Ni, Z. T. Rosenkrans, P. Huang, X. Yan and W. Cai, Chem. Soc. Rev., 2019, 48, 3683–3704 RSC.
- X. Yang, M. Yang, B. Pang, M. Vara and Y. Xia, Chem. Rev., 2015, 115, 10410–10488 CrossRef CAS PubMed.
- S. M. Mousavi, M. Zarei, S. A. Hashemi, S. Ramakrishna, W.-H. Chiang, C. W. Lai and A. Gholami, Drug Metab. Rev., 2020, 52, 299–318 CrossRef CAS PubMed.
- D. Xu, R. Xie, T. Xu, X. Guo, Q. Liu, J. Liu, W. Lv, X. Jing, H. Zhang and J. Wang, RSC Adv., 2016, 6, 88248–88254 RSC.
- X. Yang, W. Jiang, L. Liu, B. Chen, S. Wu, D. Sun and F. Li, J. Magn. Magn. Mater., 2012, 324, 2249–2257 CrossRef CAS.
- H. Yuan, C. G. Khoury, H. Hwang, C. M. Wilson, G. A. Grant and T. Vo-Dinh, Nanotechnology, 2012, 23, 075102 CrossRef PubMed.
- X. Pan, D. Xu, X. Tang, N. Liu, Y. You, X. Wang, X. Yan, X. Ma and X. Chen, Adv. Funct. Mater., 2020, 30, 2002761 CrossRef CAS.
- G. Dunderdale, S. Ebbens, P. Fairclough and J. Howse, Langmuir, 2012, 28, 10997–11006 CrossRef CAS PubMed.
- A. V. Bui and M. H. Nguyen, J. Food Eng., 2004, 62, 345–349 CrossRef.
- T. Patiño, N. Feiner-Gracia, X. Arqué, A. Miguel-López, A. Jannasch, T. Stumpp, E. Schäffer, L. Albertazzi and S. Sánchez, J. Am. Chem. Soc., 2018, 140, 7896–7903 CrossRef PubMed.
- T. E. P. Alves, H. V. S. Pessoni, A. Franco, C. Burda and A. C. S. Samia, J. Phys. Chem. Solids, 2022, 164, 110630 CrossRef CAS.
- G. B. Oliveira-Filho, J. J. Atoche-Medrano, F. F. H. Aragón, J. C. Mantilla Ochoa, D. G. Pacheco-Salazar, S. W. da Silva and J. A. H. Coaquira, Appl. Surf. Sci., 2021, 563, 150290 CrossRef CAS.
- Y. You, D. Xu, X. Pan and X. Ma, Appl. Mater. Today, 2019, 16, 508–517 CrossRef.
- L. Wang, P. Guo, D. Jin, Y. Peng, X. Sun, Y. Chen, X. Liu, W. Chen, W. Wang, X. Yan and X. Ma, ACS Nano, 2023, 17, 5095–5107 CrossRef CAS PubMed.
- C. Gao, Y. Wang, Z. Ye, Z. Lin, X. Ma and Q. He, Adv. Mater., 2021, 33, 2000512 CrossRef CAS PubMed.
- A. C. Hortelão, R. Carrascosa, N. Murillo-Cremaes, T. Patiño and S. Sánchez, ACS Nano, 2019, 13, 429–439 CrossRef PubMed.
- P. L. Stiles, J. A. Dieringer, N. C. Shah and R. P. Van Duyne, Annu. Rev. Anal. Chem., 2008, 1, 601–626 CrossRef CAS PubMed.
- Y. I. Park, H. Im, R. Weissleder and H. Lee, Bioconjugate Chem., 2015, 26, 1470–1474 CrossRef CAS PubMed.
- C. G. Khoury and T. Vo-Dinh, J. Phys. Chem. C, 2008, 112, 18849–18859 CrossRef CAS PubMed.
- R. M. Liu, Y. P. Kang, X. F. Zi, M. J. Feng, M. Cheng and M. Z. Si, Chin. Chem. Lett., 2009, 20, 711–715 CrossRef CAS.
- H. Yu, W. Tang, G. Mu, H. Wang, X. Chang, H. Dong, L. Qi, G. Zhang and T. Li, Micromachines, 2018, 9, 450 CrossRef PubMed.
- K. M. Ostrowska, A. Malkin, A. Meade, J. O'Leary, C. Martin, C. Spillane, H. J. Byrne and F. M. Lyng, Analyst, 2010, 135, 3087–3093 RSC.
- A. K. M. R. H. Chowdhury, B. Tan and K. Venkatakrishnan, ACS Appl. Mater. Interfaces, 2018, 10, 35715–35733 CrossRef CAS PubMed.
Footnotes |
| † Electronic supplementary information (ESI) available: SEM images, size distributions, TEM images, tracking trajectories, UV-vis spectra, photothermal responding image and curves, scatter plots, SERS spectra, videos snapshots and so on are shown in Fig. S1–S12 (PDF). Videos S1–S5: MAuNS swimming in glucose solution with the concentration of 0, 10, 25, 50 and 100 mM respectively. Video S6: Magnetic guidance of a MAuNS nanomotor under gradient magnetic field. Videos S7 and S8: Magnetically controlled movement of MAuNS with/without the application of oscillating magnetic field. Video S9: Magnetically controlled movement targeting specific HeLa cell of a MAuNS nanomotor with the application of gradient magnetic field. See DOI: https://doi.org/10.1039/d3nr02739b |
| ‡ These authors contributed equally to this work. |
| This journal is © The Royal Society of Chemistry 2023 |