
 Open Access Article
 This Open Access Article is licensed under a Creative Commons Attribution-Non Commercial 3.0 Unported Licence
A Co and Fe bimetallic MOF with enhanced electrocatalytic oxygen evolution performance: exploring the electronic environment modifications upon Fe incorporation†
Varsha
Singh
a,
Devesh Kumar
Singh
b,
Mamta
Yadav
a,
Smita
Singh
a,
Vikram
Rathour
a,
Ananya
Tiwari
a and
Vellaichamy
Ganesan
 *a
*a
aDepartment of Chemistry, Institute of Science, Banaras Hindu University, Varanasi, UP 221005, India. E-mail: velganesh@yahoo.com; velgan@bhu.ac.in
bKutir Post Graduate College, Chakkey, Jaunpur, UP 222146, India
First published on 6th February 2024
Abstract
The incorporation of iron into the cobalt-based metal–organic framework (Co-MOF) modifies the electronic environment and the resulting bimetallic MOF exhibits enhanced oxygen evolution reaction (OER) performance. The Co-MOF, Fe-MOF, and different ratios of bimetallic Co–Fe-MOFs are prepared using 2,2′-bipyridine 4,4′-dicarboxylic acid (H2bpdc) by a single-step hydrothermal process. The MOFs are evaluated by necessary spectroscopy and microscopy techniques like Fourier transform infrared spectroscopy, inductively coupled plasma emission spectroscopy, powder X-ray diffraction, transmission electron microscopy, energy-dispersive X-ray analysis, and X-ray photoelectron spectroscopy. The incorporation of Fe3+ into the Co-MOF significantly increases the electrocatalytic activity of the resulting bimetallic Co–Fe-MOF towards the OER. An optimized bimetallic MOF having a Co![[thin space (1/6-em)]](https://www.rsc.org/images/entities/char_2009.gif) :Fe ratio of 2:1 shows the lowest overpotential (310 mV) to realize the 10 mA cm−2 current density and the lowest Tafel slope of 53 mV dec−1 with excellent durability in comparison to the Co-MOF, the Fe-MOF, and the state-of-the-art catalyst, RuO2. Furthermore, this manuscript addresses the inherent electrocatalytic properties of MOF-based electrocatalysts and demonstrates their possible exploitation in water electrolysis.
:Fe ratio of 2:1 shows the lowest overpotential (310 mV) to realize the 10 mA cm−2 current density and the lowest Tafel slope of 53 mV dec−1 with excellent durability in comparison to the Co-MOF, the Fe-MOF, and the state-of-the-art catalyst, RuO2. Furthermore, this manuscript addresses the inherent electrocatalytic properties of MOF-based electrocatalysts and demonstrates their possible exploitation in water electrolysis.
1. Introduction
The increasing energy crisis and rapid depletion of conventional energy sources around the globe urge human beings to switch to non-conventional energy sources like wind, solar, etc. However, these non-conventional energy sources have their own limitations due to their geographical confinement and uneven distribution/accessibility all year round.1,2 Among energy carriers, hydrogen is the most preferred one due to its clean and non-toxic nature, high calorific value, and relatively easy storage.3 Electro/photocatalytic water splitting produces H2 in a clean way. The oxygen evolution reaction (OER) plays a critical part in the production of hydrogen through water splitting.4 However, the slow kinetics of oxygen restricts the extensive utility of the process. Benchmark catalysts (RuO2 and IrO2) have shown superior catalytic properties for the OER; however, their use in large-scale devices is impeded because of their limited availability, high cost, and certain durability issues.5,6 Therefore, researchers focus on developing less expensive catalysts with high activity and enhanced durability. Transition metal (mainly Co, Ni, and Fe)-based catalysts (in the form of nitrides,7 oxides,8 carbides,9 phosphides,10 and sulphides11) and transition metals integrated on carbon-based materials (like carbon nanotubes,12 mesoporous carbon nitride,1 graphene oxides13 and materials derived from metal–organic frameworks14) have been investigated over the past few decades to achieve efficient and economic water splitting.Metal–organic frameworks (MOFs) are being explored in several fields because of their porous nature and unique electrical, optical, and electronic properties.14–16 In the beginning, MOFs were mainly studied for gas adsorption and storage applications; however, recently owing to their unique structural framework and porosity, they have also been used in the areas of gas sensing,17,18 drug delivery,19 carbon dioxide reduction,20 dye adsorption,21 supercapacitor applications22 and electrochemical water splitting.23,24 The major drawbacks of MOFs are low mass permeability and weak conductivity-induced obstruction of the active sites.25 Post-synthetic modifications are employed to overcome the problems associated with the MOFs. The post-synthetic modification includes annealing of MOFs at elevated temperatures. For example, Li et al. synthesized defect-rich cobalt oxide scales on Ni foam by heating the Co(OH)2 arrays derived from annealing the Co-MOF at 300 °C. The as-synthesized cobalt oxide arrays on nickel foam needed an overpotential of only 205 mV to achieve 10 mA cm−2 current density.26 Zhou et al.27 synthesized a cobalt diphosphate nanocarbon hybrid by a solvothermal method and pyrolyzed it at 800 °C to produce an electroactive catalyst. Integration of the pyrolyzed sample on a nickel foam substrate established an overpotential of 215 mV to achieve 10 mA cm−2 current density.27 Gao's group developed an OER catalyst by annealing the nanoflower-shaped bimetallic NiFe-MOF at 800 °C. The obtained electrocatalyst showed an overpotential of 356 mV to achieve 10 mA cm−2.28 Although annealing treatments (post-synthetic modifications) of MOFs produce efficient electrocatalysts, they are obtained by the introduction of additional steps and loss of materials occurs, which raise the cost of electrode fabrication. These treatments can collapse the ordered pores and channels of the MOFs leading to a decrease in the electrocatalytically active centers.23 Therefore, to enhance the electrocatalytic activity of MOFs, mild strategies are to be developed. In this respect, nanostructured materials derived from MOFs without heat treatment could be effective.23 Furthermore, bimetallic MOFs show improved activity and durability in comparison to monometallic counterparts mainly due to the synergistic effect of the metal active centers and the change in the environment around the active centers.14,29 It is well-recognized that the chief active catalysts for the OER are transition metal oxyhydroxides and upon the application of a positive bias, the MOFs completely transform into metal oxyhydroxide sheets and exhibit better OER performance.23 According to the reports of Subbaram et al., the OER performance of first-row transition metals in the divalent oxidation state follows the order Ni > Co > Fe > Mn.30 It is also stated that the integration of Fe into nickel oxyhydroxides dramatically amplifies the OER performance. However, with cobalt oxyhydroxides, the results vary; for instance, Kishi et al. reported that Fe incorporation in FexCo3−xO4 (0 ≤ x ≤ 2) diminishes the OER activity,31 while Boettcher and co-workers reported an increase in the OER activity of cobalt oxyhydroxide after Fe incorporation.32 Despite the diverse reports on the OER performances of MOFs, Fe- and Co-based bimetallic MOFs have been comparatively less reported than the Ni–Fe-MOFs or Ni–Co-MOFs. Therefore, the impact of Fe on the OER performance of the Co-MOF is explored in this work. For this purpose, the Co-MOF, Fe-MOF, and varying Co:Fe ratios of bimetallic Co–Fe-MOFs are prepared. The role of Fe3+ is analyzed based on the studies conducted by the Stahl group, who evaluated the OER performance of the Ni–Fe-layered double hydroxide (LDH) and found that the Fe4+ generated during the OER is accountable for the boosted OER performance of the Ni–Fe-LDH.32 Additionally, it is reported that the high oxidation state of metal enhances the OER activity of the material.33 Although Fe3+ incorporation into different materials has been reported earlier, the role of Fe3+ in the water oxidation process and its impact on the original active centers have not been explored adequately.34–37 This study specifically explores the role of Fe3+ in enhancing the OER activity of the Co-MOF, highlighting the generation of Co3+. The ratio of Co:Fe is varied as 2:1, 1:1, and 1:2 in view of the work reported by Ge et al., who synthesized Co–Fe-1,4-benzene dicarboxylic acid-based two-dimensional MOFs and found that the Co:Fe ratio of 2:1 shows the best OER performance.38 In this work, the Co-MOF, Fe-MOF, and Co–Fe-MOFs (bimetallic MOFs containing an equal and higher composition of Fe) were synthesized to explore how the Fe3+ content alters the electrocatalytic OER activity of the Co–Fe-MOF. The addition of Fe3+ during Co-MOF synthesis can generate Co3+ along with Co2+ species due to the possible charge transfer between the metal centers. This charge transfer/interaction between Fe3+ and Co2+/Co3+ may result in better OER activity and stability.39 The synthesized 2:1 Co–Fe-MOF exhibits the lowest overpotential and Tafel slope in comparison to the Co-MOF, the Fe-MOF, and the state-of-the-art catalyst, RuO2.
2. Experimental section
2.1 Reagents and chemicals
Co(NO3)2·6H2O (97%), Fe(NO3)3·9H2O (98%), K4[Fe(CN)6] (99%), K3[Fe(CN)6] (99%), KCl, (99.5%) and KOH (85%) were acquired from Qualigens, India. 2,2′-Bipyridine 4,4′-dicarboxylic acid (H2bpdc) (>96%) was obtained from TCI, India. Polyvinylpyrrolidone (PVP) (K-30) (99%) was obtained from SRL, India. Dimethyl formamide (DMF) (99%) was procured from Merck, and ruthenium oxide (RuO2) (99.9%) was acquired from Sigma-Aldrich. Freshly distilled ethanol and triply distilled water were utilized in this study.2.2 Instrumentation
Powder X-ray diffraction (XRD) patterns were obtained using a Bruker D8 Advance X-ray diffractometer (λ = 0.15406 nm). For the post-catalysis XRD analysis, the material is cast on an indium tin oxide (ITO) coated glass plate and subjected to catalysis. After catalysis, the sample-coated ITO plate was subjected to XRD analysis. To compare the XRD data, an ITO plate with no sample loading (bare ITO plate) was also subjected to the XRD analysis. Fourier-transform infrared (FT-IR) spectra of MOFs were collected in the region of 400–4000 cm−1 using a PerkinElmer spectrophotometer. The nitrogen adsorption–desorption data were recorded using a Quantachrome Autosorb iQ2 setup. Scanning electron microscopy (SEM) images were recorded using a QUANTA-200 Thermo Fisher instrument with an Ametech energy-dispersive X-ray analysis (EDX) system for elemental analysis. Transmission electron microscopy (TEM), high resolution-TEM (HR-TEM), and EDX images were recorded with a TECNAI G2 20 TWIN microscope working at a voltage of 200 kV. X-ray photoelectron spectroscopy (XPS) data were measured using a PHI 5000 Versa Probe III. Inductively coupled plasma emission spectroscopy (ICPES) analyses were done with a PerkinElmer ICP spectrometer. The electrochemical experiments were carried out with a CHI660C (CH Instruments, electrochemical workstation, USA) using a three-electrode setup in a one-compartment electrochemical cell. A glassy carbon (GC) electrode of area 0.071 cm2 or a GC rotating disc (GCRDE) electrode of area 0.196 cm2 is used as the working electrode (bare or modified with the MOF). The Pt wire was employed as the counter electrode and Hg/HgO was employed as the reference electrode. The rotation speed of the GCRDE was regulated using a modulated speed rotator manufactured by Pine, USA. The observed potentials were changed to the reversible hydrogen electrode (RHE) potential employing eqn (1). | (1) |
 and pH = 13.6.
2.3 Synthesis of MOFs
A facile hydrothermal method was used for the synthesis of MOFs. Co(NO3)2·6H2O and Fe(NO3)3·9H2O were mixed in the molar ratio of 2:1 and dissolved in 20 mL of DMF by stirring. Subsequently, 110 mg of the H2bpdc ligand and 5 mg of PVP were added. The obtained solution was then transferred into a 50 mL Teflon-lined stainless-steel autoclave and kept at 150 °C for a period of 24 h. After cooling the autoclave, the obtained orange-brown precipitate was filtered, cleaned with DMF and ethanol three times, and dried at 80 °C for 12 h. A similar procedure was used for the synthesis of the 1:1 Co–Fe-MOF, 1:2 Co–Fe-MOF, Co-MOF, and Fe-MOF with an appropriate amount of Co/Fe precursors. The Co-MOF shows a light pink color, while the color gradually changes to brown for the bimetallic MOFs with increasing Fe content and the Fe-MOF is black-brown (ESI,† Fig. S1).
2.4 Preparation of electrodes
The GC and GCRDE electrodes were polished on a Buehler-felt pad with 0.05 μm alumina powder and water. The electrodes were then sonicated, washed with distilled water, and air-dried. The dispersions of 0.5% (weight/volume percentage) respective MOFs were prepared in DMF and ultrasonicated for 30 min. The 0.5% dispersion was drop cast on the GC electrode (10 μL) or GCRDE (14 μL). After drying, the electrodes were employed in the electrochemical studies. Such modified electrodes are represented as GC/respective MOF or GCRDE/respective MOF. The mass loadings were calculated as 704 and 357 μg cm2 for the GC electrode and GCRDE, respectively.3. Results and discussion
The FT-IR spectra (Fig. 1(A)) show prominent peaks at 3370, 1600, 1380, 1233, 1026, 771, and 702 cm−1. The broad peak at 3370 cm−1 can be attributed to the carboxylic –OH stretching.40 The peaks at 1600 and 1380 cm−1 are ascribed to –COO asymmetric and symmetric stretchings.14 The peaks at 1233 and 1026 cm−1 are attributed to the vibrations of the H2bpdc ligand41 and the peaks at 771 and 702 cm−1 are attributed to the out of plane –CH bending vibrations of the ring.42 Furthermore, the peaks in the region 400 to 585 cm−1 (shown in the ESI,† Fig. S2) can be ascribed to M–O or M–N bonds (where M = Co/Fe).23,43–45 The ICPES results show that the metal ratio (Co:Fe) is in accordance with the feed ratios of the metal ions (ESI,† Table S1).
 | ||
| Fig. 1 FT-IR spectra (A) of the 2:1 Co–Fe-MOF (a), 1:1 Co–Fe-MOF (b), 1:1 Co–Fe-MOF (c), Co-MOF (d), and Fe-MOF (e) and the powder XRD pattern (B) and post-catalysis XRD pattern of the 2:1 Co–Fe-MOF (C). | ||
The powder XRD patterns of the MOFs are presented in Fig. 1(B) along with the simulated XRD pattern of the reported single crystal (CCDC 225925).46 Furthermore, the powder XRD patterns of the Co-MOF and Fe-MOF are shown in the ESI,† Fig. S3. The XRD patterns of the Co-MOF and Fe-MOF show the poor crystalline nature of these materials.47,48 It is obvious from Fig. 1(B) that the change in the metal ratio does not change the XRD peak positions, suggesting an intact structure irrespective of the metal ratio. The obtained powder XRD patterns of the bimetallic MOFs do not exactly match the simulated pattern (CCDC 225925);46 however, most of the peaks overlap with the simulated XRD pattern. The partial mismatch of peaks could be due to the different metal centers and different anion counterparts. However, the coordination of the metal center to the ligand (H2bpdc) remains unchanged.49 Based on the simulated XRD pattern and FT-IR analysis, the MOFs may have a distorted octahedral structure at the metal center establishing coordination with two nitrogens of one H2bpdc and four oxygens of the carboxylate groups from different H2bpdc ligands (the possible structure is given in the ESI,† Fig. S4).46 In order to analyze the changes that occurred during the OER, a post-catalysis XRD pattern was recorded after 1 h of amperometry at 1.60 V vs. RHE. The post-catalysis XRD pattern shows peaks at the 2θ values of 23.3, 26.6, 33.2, and 42.9°, which can be ascribed to the (006) lattice plane of the Co–Fe-LDH,34 (220) lattice plane of Co–OH,34 (130) lattice plane of α-FeOOH,50 and (015) plane of the Co/Fe LDH51 (Fig. 1(C)), respectively. The changes in the XRD peaks between the pre- and post-OER catalyses suggest that the synthesized MOFs act as pre-catalysts and transform into active catalysts, that is, Co–Fe oxyhydroxides. The MOFs acting as the pre-catalysts and their transformation into metal oxyhydroxides have been stated in the literature. For example, Sahoo et al. reported a Co-based MOF as a pre-catalyst for the OER with an overpotential of 276 (±3) mV vs. RHE.23 A similar observation is also reported for FeCoNi coordinated with benzene-1,3,5-tricarboxylic acid (FeCoNi–BTC), in which FeCoNi-BTC is transformed electrochemically into FeCoNiOx(OH)y to show enhanced OER in basic medium with an overpotential of 230 mV vs. RHE.52 In the present work, the post-catalysis XRD pattern confirms the generation of Fe–(O)OH during catalysis along with the generation of Co–(O)OH, which enhance the OER performance of Co–Fe-MOFs in comparison to that of the Co-MOF (vide infra). The surface area and pore width of MOFs were analyzed using BET. The MOFs showed type IV isotherms (Fig. S5, ESI†) with surface areas of 54.6, 40.5, 36.2, 20.9, and 60.2 m2 g−1 for 2:1 Co–Fe-MOF, 1:1 Co–Fe-MOF, 1:2 Co–Fe-MOF, Co-MOF, and Fe-MOF respectively.53,54 The pore diameters between 3 and 10 nm reveal the mesoporous nature of MOFs.54,55
To further decipher the composition, oxidation states of metals, and type of bonding present in the MOFs, XPS studies were performed for the Co-MOF, Fe-MOF, and 2:1 Co–Fe-MOF. The survey spectrum of the Co-MOF, Fe-MOF, and 2:1 Co–Fe-MOF depicts the existence of Co, Fe, C, O, and N (ESI,† Fig. S6(A)–(C)). The XPS data were standardized based on the adventitious carbon value of 284.6 eV. The deconvoluted peaks of carbon spectra show six peaks (Fig. 2(A)) for adventitious carbon, C–C, C–N, C![[double bond, length as m-dash]](https://www.rsc.org/images/entities/char_e001.gif) N–C, C–O, and O–CO for the Co-MOF, Fe-MOF, and 2:1 Co–Fe-MOF (peak positions are mentioned in ESI,† Table S2).38,56 The O 1s XPS data show the presence of metal–oxygen (M–O), O–CO, and adsorbed H2O and N 1s spectra show the peaks corresponding to M–N (metal–nitrogen), pyridinic-N, nitrate-N (refer to ESI,† Table S2 for the peak positions and Fig. S8(A) and (B)) for monometallic MOFs and the 2:1 Co–Fe-MOF.34,57,58 The Co 2p spectra show Co 2p3/2 and Co 2p1/2 peaks for the Co-MOF and 2:1 Co–Fe-MOF (Fig. 2(B)). The peaks are further deconvoluted into four peaks for the Co-MOF (assigned to Co2+ (783.1 and 798.7 eV) and satellite peaks (786.6 and 804.8 eV)) and six peaks for the 2:1 Co–Fe-MOF (ascribed to Co2+ (782.4 and 797.7 eV), Co3+ (780.7 and 796.3 eV), and satellite peaks (786.6 and 803.3 eV)).59,60 The high-resolution Fe spectrum (Fig. 2(C)) shows two regions, Fe 2p3/2 and Fe 2p1/2, for both the Fe-MOF and the 2:1 Co–Fe-MOF and is deconvoluted into three peaks for the Fe-MOF (corresponding to Fe3+ (713.7 and 727.1 eV) and the satellite peak (719.2 eV)) and five peaks for the 2:1 Co–Fe-MOF (ascribed to Fe3+ (713.4 and 726.1 eV), Fe2+ (711.0 and 724.1 eV), and the satellite peak of Fe 2p (718.4 eV)).47,48 It can be observed that the incorporation of iron into the Co-MOF results in a 0.7 eV negative shift of Co2+ species for the 2:1 Co–Fe-MOF along with the formation of Co3+ species. Similarly, a 0.3 eV negative shift of Fe3+ peaks along with the formation of Fe2+ is observed for the 2:1 Co–Fe-MOF. The formation of Co3+ and Fe2+ occurs owing to the charge transfer between Fe and Co metal centers in the 2:1 Co–Fe-MOF.36 It is well known that the metal centers in a high oxidation state favor the OER33,61 and accordingly, the incorporation of Fe3+ promotes the generation of OER-active Co3+ accelerating the OER activity of bimetallic MOFs (vide infra). To analyze the changes during OER catalysis, the XPS spectrum of the 2:1 Co–Fe-MOF after the OER catalysis was recorded. The survey spectrum (ESI,† Fig. S6D) shows the existence of Co, Fe, C, N, and O. The presence of carbon, oxygen, and nitrogen suggests that a small amount of the ligand (H2bpdc) is present after the OER catalysis also. The C 1s spectrum shows the existence of adventitious, C–C, C–NC, and O–CO carbons at 284.6, 285.2, 285.9, and 289.1 eV, respectively (Fig. 2(D)). An increase in the intensity at 289.1 eV suggests a slight oxidation of carbon.62 The Co 2p spectrum shows Co 2p3/2 and Co 2p1/2 peaks, which exhibit negative shifts in the XPS peak positions, with the peak separation value decreasing to 15.2 eV (post-catalysis) from 15.6 eV (pre-catalysis). These results suggest the formation of Co–(O)OH during the OER.59 Following the OER catalysis, the high-resolution deconvoluted peaks of Co 2p are observed at 779.9 and 795.0 eV for Co3+ and at 781.9 and 796.5 eV for Co2+. It can be seen that the intensity of Co3+ increases noticeably for the post-OER 2:1 Co–Fe-MOF (Fig. 2(E)). The satellite peaks are situated at 786.6 and 802.8 eV. The decrease in the peak separation value (0.4 eV) along with the substantial decrease in the intensities of the satellite peaks of the post-OER 2:1 Co–Fe-MOF suggests the conversion of Co2+ to Co3+ during the OER, which is also justified by the intense peaks of Co3+ in the post-OER Co 2p XPS spectrum. The Fe 2p spectrum (Fig. 2(F)) also shows a negative shift for the post-OER sample. The deconvoluted Fe 2p spectrum (Fig. 2(F)) shows peaks at 710.2 and 723.7 eV for Fe3+, at 712.3 and 725.7 eV for Fe2+, and a satellite peak at 717.6 eV. The negative shifts in the post-OER XPS of Co and Fe can be ascribed to the changes in the electronic environment owing to the degradation of the ligand (vide infra).38 The O 1s deconvoluted peaks (ESI,† Fig. S7C) appear at 529.0, 529.8, 530.7, and 531.6 eV, which correspond to metal–oxygen (Co–O or Fe–O), O–CO, –OOH,63 and adsorbed H2O, respectively. Following the OER catalysis, the emergence of an OOH peak attests to the conversion of metals into their respective oxyhydroxides, which is also confirmed by powder XRD (vide supra). The post-OER N 1s XPS spectrum (ESI,† Fig. S7D) shows only one peak at 399.8 eV, which resembles the pyridinic nitrogen. Although the oxygen and nitrogen spectra show the presence of the H2bpdc ligand after catalysis, the decreased intensity indicates the structural changes of the MOF during the OER process.
N–C, C–O, and O–CO for the Co-MOF, Fe-MOF, and 2:1 Co–Fe-MOF (peak positions are mentioned in ESI,† Table S2).38,56 The O 1s XPS data show the presence of metal–oxygen (M–O), O–CO, and adsorbed H2O and N 1s spectra show the peaks corresponding to M–N (metal–nitrogen), pyridinic-N, nitrate-N (refer to ESI,† Table S2 for the peak positions and Fig. S8(A) and (B)) for monometallic MOFs and the 2:1 Co–Fe-MOF.34,57,58 The Co 2p spectra show Co 2p3/2 and Co 2p1/2 peaks for the Co-MOF and 2:1 Co–Fe-MOF (Fig. 2(B)). The peaks are further deconvoluted into four peaks for the Co-MOF (assigned to Co2+ (783.1 and 798.7 eV) and satellite peaks (786.6 and 804.8 eV)) and six peaks for the 2:1 Co–Fe-MOF (ascribed to Co2+ (782.4 and 797.7 eV), Co3+ (780.7 and 796.3 eV), and satellite peaks (786.6 and 803.3 eV)).59,60 The high-resolution Fe spectrum (Fig. 2(C)) shows two regions, Fe 2p3/2 and Fe 2p1/2, for both the Fe-MOF and the 2:1 Co–Fe-MOF and is deconvoluted into three peaks for the Fe-MOF (corresponding to Fe3+ (713.7 and 727.1 eV) and the satellite peak (719.2 eV)) and five peaks for the 2:1 Co–Fe-MOF (ascribed to Fe3+ (713.4 and 726.1 eV), Fe2+ (711.0 and 724.1 eV), and the satellite peak of Fe 2p (718.4 eV)).47,48 It can be observed that the incorporation of iron into the Co-MOF results in a 0.7 eV negative shift of Co2+ species for the 2:1 Co–Fe-MOF along with the formation of Co3+ species. Similarly, a 0.3 eV negative shift of Fe3+ peaks along with the formation of Fe2+ is observed for the 2:1 Co–Fe-MOF. The formation of Co3+ and Fe2+ occurs owing to the charge transfer between Fe and Co metal centers in the 2:1 Co–Fe-MOF.36 It is well known that the metal centers in a high oxidation state favor the OER33,61 and accordingly, the incorporation of Fe3+ promotes the generation of OER-active Co3+ accelerating the OER activity of bimetallic MOFs (vide infra). To analyze the changes during OER catalysis, the XPS spectrum of the 2:1 Co–Fe-MOF after the OER catalysis was recorded. The survey spectrum (ESI,† Fig. S6D) shows the existence of Co, Fe, C, N, and O. The presence of carbon, oxygen, and nitrogen suggests that a small amount of the ligand (H2bpdc) is present after the OER catalysis also. The C 1s spectrum shows the existence of adventitious, C–C, C–NC, and O–CO carbons at 284.6, 285.2, 285.9, and 289.1 eV, respectively (Fig. 2(D)). An increase in the intensity at 289.1 eV suggests a slight oxidation of carbon.62 The Co 2p spectrum shows Co 2p3/2 and Co 2p1/2 peaks, which exhibit negative shifts in the XPS peak positions, with the peak separation value decreasing to 15.2 eV (post-catalysis) from 15.6 eV (pre-catalysis). These results suggest the formation of Co–(O)OH during the OER.59 Following the OER catalysis, the high-resolution deconvoluted peaks of Co 2p are observed at 779.9 and 795.0 eV for Co3+ and at 781.9 and 796.5 eV for Co2+. It can be seen that the intensity of Co3+ increases noticeably for the post-OER 2:1 Co–Fe-MOF (Fig. 2(E)). The satellite peaks are situated at 786.6 and 802.8 eV. The decrease in the peak separation value (0.4 eV) along with the substantial decrease in the intensities of the satellite peaks of the post-OER 2:1 Co–Fe-MOF suggests the conversion of Co2+ to Co3+ during the OER, which is also justified by the intense peaks of Co3+ in the post-OER Co 2p XPS spectrum. The Fe 2p spectrum (Fig. 2(F)) also shows a negative shift for the post-OER sample. The deconvoluted Fe 2p spectrum (Fig. 2(F)) shows peaks at 710.2 and 723.7 eV for Fe3+, at 712.3 and 725.7 eV for Fe2+, and a satellite peak at 717.6 eV. The negative shifts in the post-OER XPS of Co and Fe can be ascribed to the changes in the electronic environment owing to the degradation of the ligand (vide infra).38 The O 1s deconvoluted peaks (ESI,† Fig. S7C) appear at 529.0, 529.8, 530.7, and 531.6 eV, which correspond to metal–oxygen (Co–O or Fe–O), O–CO, –OOH,63 and adsorbed H2O, respectively. Following the OER catalysis, the emergence of an OOH peak attests to the conversion of metals into their respective oxyhydroxides, which is also confirmed by powder XRD (vide supra). The post-OER N 1s XPS spectrum (ESI,† Fig. S7D) shows only one peak at 399.8 eV, which resembles the pyridinic nitrogen. Although the oxygen and nitrogen spectra show the presence of the H2bpdc ligand after catalysis, the decreased intensity indicates the structural changes of the MOF during the OER process.
 | ||
| Fig. 2 High-resolution deconvoluted XPS spectra of C 1s, Co 2p, and Fe 2p of the Co-MOF, Fe-MOF, and 2:1 Co–Fe-MOF (A)–(C) and after the OER catalysis of the 2:1 Co–Fe-MOF (D)–(F). | ||
SEM images were captured to investigate the morphology of the synthesized monometallic and bimetallic MOFs. In Fig. 3(A) and (B), the SEM images of the Co-MOF are shown, which display spherical bead-like structures. Fig. 3(C) and (D) shows SEM images of the Fe-MOF, which exhibits no distinct shape and morphology. The bimetallic 2:1 Co–Fe-MOF exhibits spindle-shaped and cuboidal-shaped morphologies (Fig. 3(E) and (F)). This suggests that incorporation of Fe not only alters the electronic state of the Co-MOF but also imparts a unique morphology. To further explore changes in the 2:1 Co–Fe-MOF after catalysis, after catalysis SEM images were recorded. Fig. 3(G) and (H) reveals that the MOFs undergo transformation into LDHs after catalysis (vide supra). The inset figure demonstrates the conversion of the cuboidal-shaped 2:1 Co–Fe-MOF into the corresponding Co–Fe-LDH. The EDX spectra provide insights into the elemental composition of Co, Fe, C, O, and N in the Co-MOF, Fe-MOF, 2:1 Co–Fe-MOF, and post-catalysis 2:1 Co–Fe MOF. Notably, the elemental composition of Co and Fe in the 2:1 Co–Fe-MOF and post-catalysis 2:1 Co–Fe-MOF demonstrates an approximate ratio of 2:1 (ESI,† Fig. S8(A)–(D)).
 | ||
| Fig. 3 SEM images of the Co-MOF showing the spherical bead type morphology (A) and (B), the Fe-MOF with no distinct morphology (C) and (D), the 2:1 Co–Fe-MOF with spindle and cuboidal shaped morphologies (E) and (F), and the post catalysis 2:1 Co–Fe MOF (G) and (H). The dotted area in (G) shows the transformed image of a cuboidal-shaped 2:1 Co–Fe MOF into its corresponding LDH. | ||
TEM was further employed to unveil the surface morphology of the 2:1 Co–Fe-MOF. It shows cuboidal-type morphology (Fig. 4(A)), which is rapidly disintegrated upon interacting with the electron beams during the TEM analysis (Fig. 4(B) and (C)). (A video of the disintegration of the MOF is given in the ESI.†) The destruction of MOF morphology upon interaction with electron beams has been reported by Ghosh et al., in which they studied ZIF-8 (zinc with the 2-methylimidazole framework) destruction by electron beams. They attributed such disintegration of MOFs mainly to the knock-on damage at most beam voltages, while radiolysis damage at 300 kV.64 Such destruction of MOFs by electron beams is also described by Liu et al.65 and Chen et al.66 EDX shows the existence of Co, Fe, C, O, and N, with the elemental composition of the metals (Co and Fe) being 2:1 (ESI,† Fig. S9(A)). To study the changes in morphology after the catalysis, post-OER TEM images were recorded. They indicate the transformation of MOF cuboids into nanosheets (Fig. 4(D) and (E)). Fig. 4(F) shows the HR-TEM image of the 2:1 Co–Fe-MOF after catalysis. Two different fringe widths, 0.66 and 0.46 nm, are observed, which can be attributed to the (220) plane of the Co–Fe LDH and β-CoOOH, respectively.67 Therefore, the change in morphology after the OER catalysis chiefly owes to the formation of stable metal oxyhydroxide sheets. The generation of metal oxyhydroxide sheets has been reported by several groups; for instance, Singh et al. reported the electrochemical conversion of cubic Co–Fe-Prussian blue analogous particles (Co–Fe-PBA) into iron-doped cobalt oxyhydroxide nanosheets.63 Similarly Zhou et al. derived extremely thin Co–(O)OH nanosheets from Co–Fe-PBA.68 The post-OER EDX shows the existence of Co, Fe, O, C, and N and the observed elemental composition indicates that the 2:1 ratio of Co:Fe is maintained after the OER catalysis (ESI,† Fig. S9B).
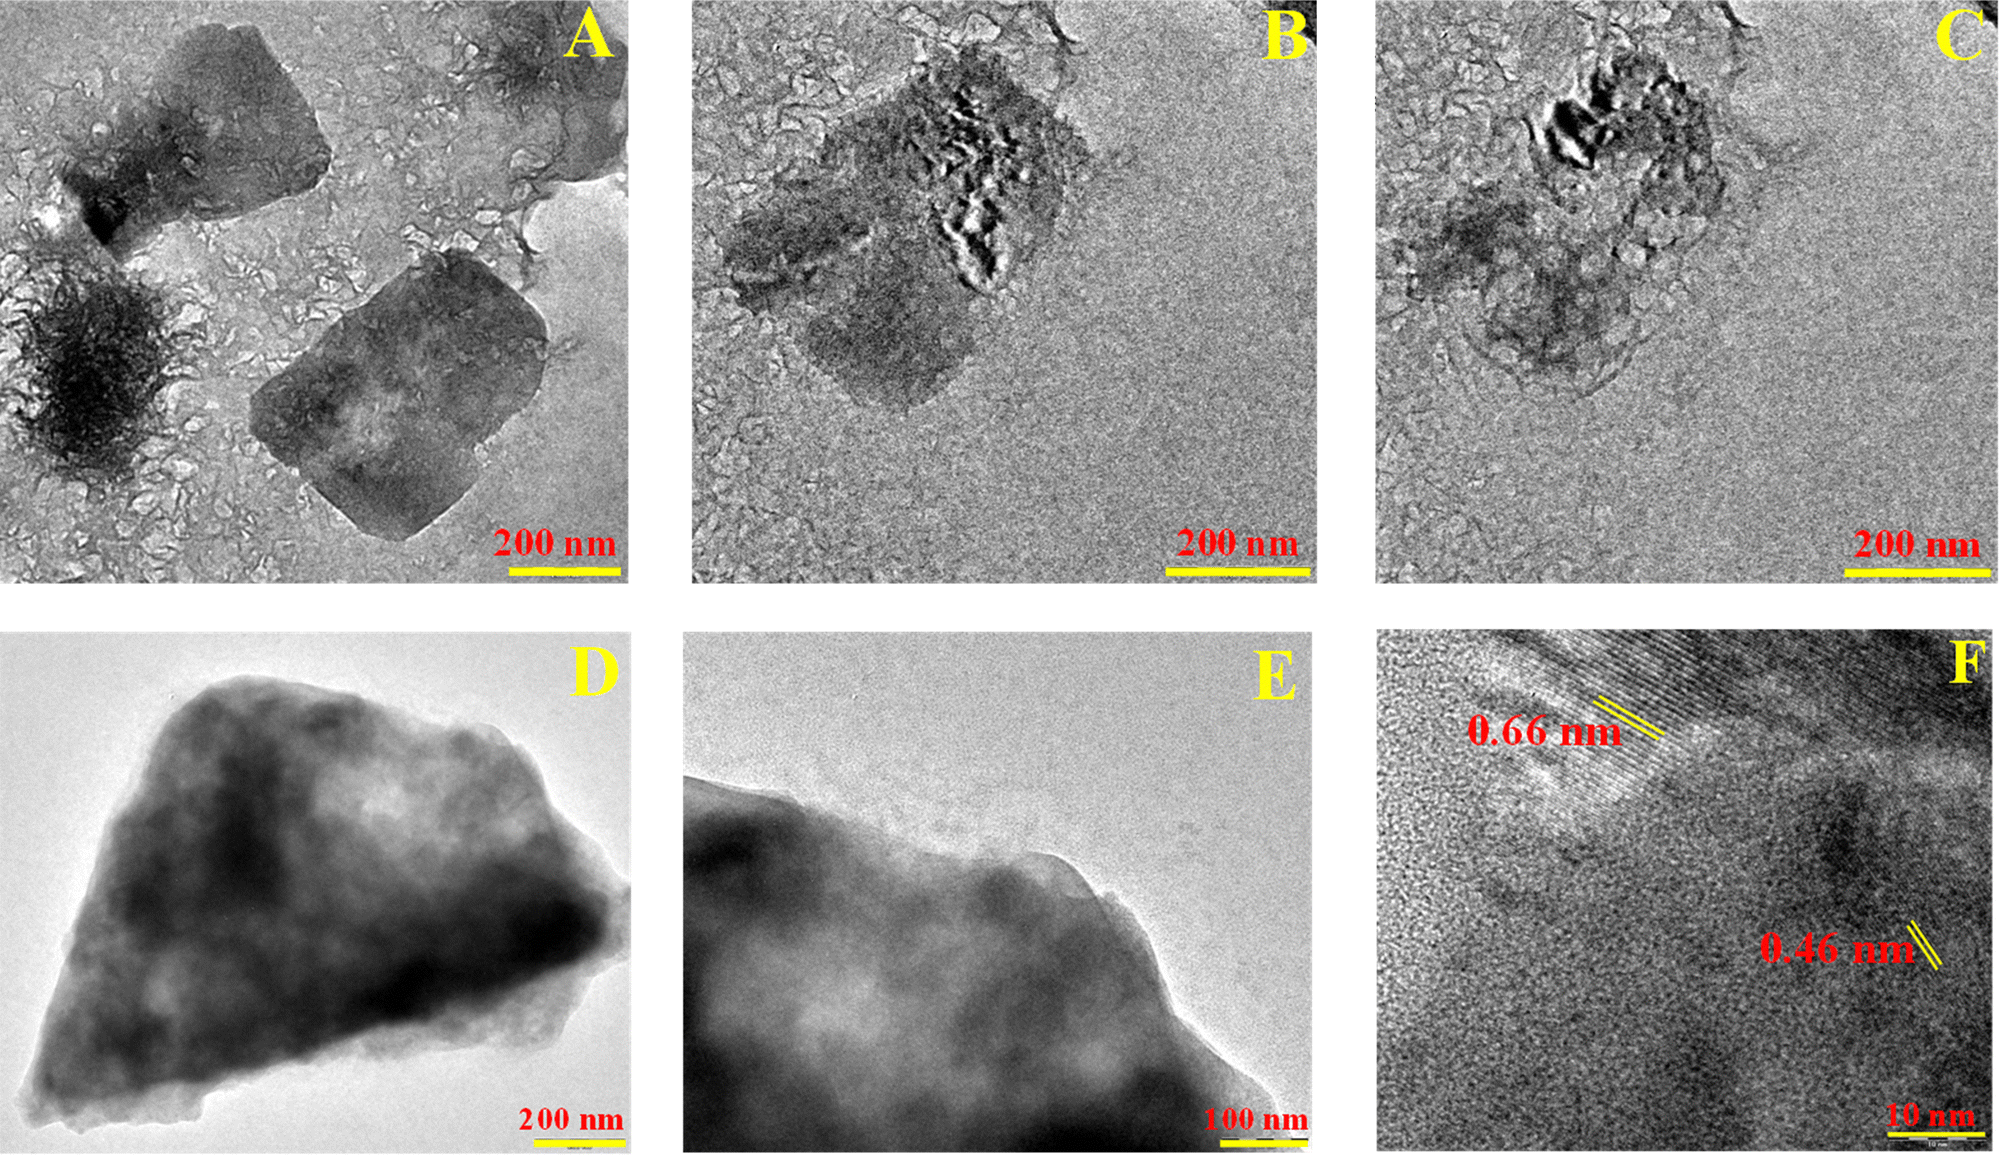 | ||
| Fig. 4 TEM images of the 2:1 Co–Fe-MOF showing the cuboidal type morphology (A) and subsequent disintegrations (B) and (C). TEM (D) and (E) and HR-TEM (F) images after the OER catalysis of the 2:1 Co–Fe-MOF. | ||
Cyclic voltammetry (CV) responses of MOFs are recorded in the non-OER potential region (0.9 to 1.4 V vs. RHE) to assess the redox nature of the MOFs. The anodic peak potentials of the 2:1 Co–Fe-MOF, 1:1 Co–Fe-MOF, 1:2 Co–Fe-MOF, and Co-MOF are observed at 1.17, 1.18, 1.16, and 1.22 V (vs. RHE) respectively, and the Fe-MOF shows no distinct redox peaks in this region. The redox peaks observed for the MOFs are attributed to the Co2+/Co3+ redox couple.23 The shift of the oxidation peaks to the slightly lower potentials in comparison to the Co-MOF is due to the interaction of Fe with Co in the MOF structure. When the MOFs are subjected to 30 continuous CV cycles, the oxidation peaks are negatively shifted to 1.14, 1.17, 1.15, and 1.14 V (vs. RHE) for the 2:1 Co–Fe-MOF, 1:1 Co–Fe-MOF, 1:2 Co–Fe-MOF, and Co-MOF, respectively. The CV response recorded after 30 CV cycles shows peaks for all the MOFs with the highest shift for the Co-MOF (80 mV) followed by the 2:1 Co–Fe-MOF (30 mV), 1:1 Co–Fe-MOF (10 mV), and 1:2 Co/Fe-MOF (10 mV) (ESI,† Fig. S10). The negative shifts in the peak potentials of MOFs after 30 CV cycles indicate the formation of metal oxyhydroxides, which change the electronic structure of nearby metal centers (probably due to the loss of the ligands).38,59 Furthermore, a decreased shift in the peak potentials (after 30 CV cycles) with increasing Fe content is observed, which may be attributed to the strong interaction between Co and Fe, making the oxidation of Co2+ difficult.32,69 In addition, the current decreases substantially after 30 CV cycles for all the compositions (2:1 Co–Fe-MOF, 1:1 Co–Fe-MOF, 1:2 Co–Fe-MOF) compared to the Co-MOF; however, the OER performance remains unaffected owing to the formation of non-conducting Fe–(O)OH.70 This type of observation was mentioned by the Boettcher group, where the incorporation of Fe in Ni–(O)OH showed a decreased conductivity and increased OER activity with increasing CV cycles irrespective of the Fe content.71 The OER activity of the MOFs is assessed employing the hydrodynamic linear sweep voltammetry (LSV) technique (at 1600 rpm) at a scan rate of 5 mV s−1. Before recording the LSV, the electrode is stabilized/stimulated in the region of 0.9 to 1.4 V (vs. RHE) potential by running 20 continuous CV cycles (Fig. 5(A)). The OER overpotentials exhibited by the MOFs at 10 mA cm−2 are 310, 350, 370, and 450 mV for the 2:1 Co–Fe-MOF, 1:1 Co–Fe-MOF, 1:2 Co–Fe-MOF, and Co-MOF respectively (Fig. 5(B)). The Fe-MOF did not achieve the required 10 mA cm−2 in the employed potential window, probably due to the insulating nature of Fe–(O)OH,70 and therefore, in the further plots the Fe-MOF is omitted. The benchmark catalyst, RuO2, showed an overpotential of 390 mV, which is higher than the best material, the 2:1 Co–Fe-MOF, in this study. The Tafel slope values are calculated (eqn (2))72 from the respective Tafel plot to understand the relative rate of the OER occurring on the electrodes.
| η = a + blog|j| | (2) |
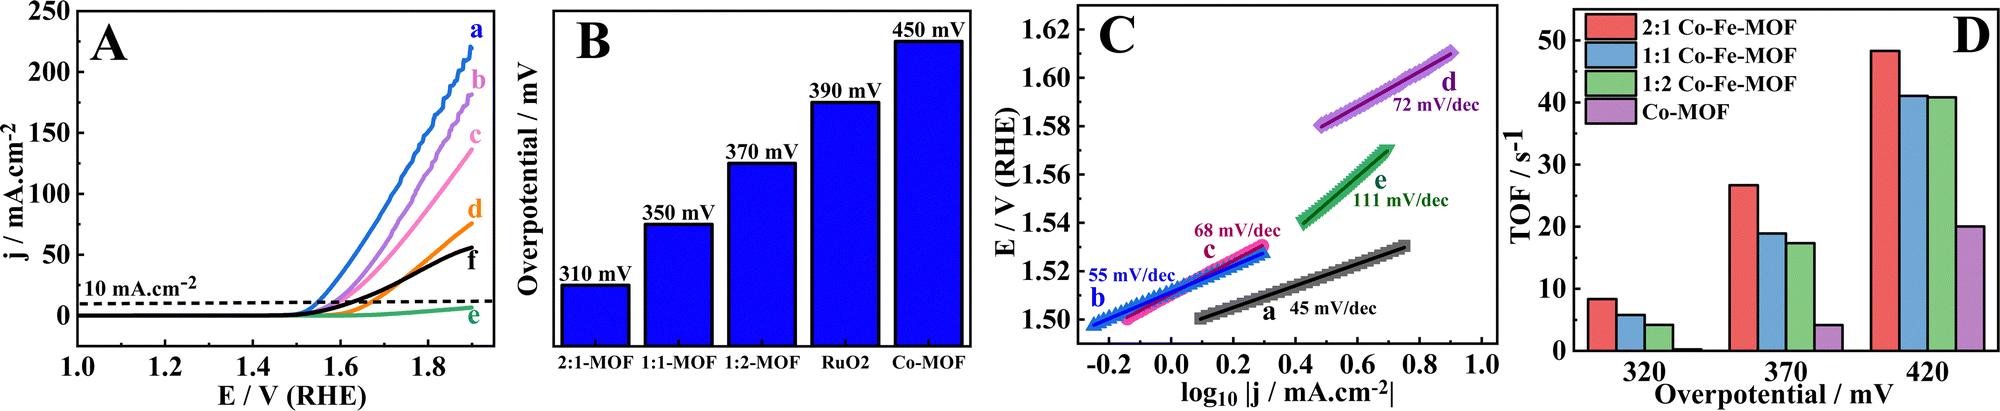 | ||
| Fig. 5 LSV polarization curves (A) of MOFs measured at a scan rate of 5 mV s−1 in 1.0 M KOH at a rotation rate of 1600 rpm for (a) GCRDE/2:1 Co–Fe-MOF, (b) GCRDE/1:1 Co–Fe-MOF, (c) GCRDE/1:2 Co–Fe-MOF, (d) GCRDE–Co-MOF, (e) GCRDE/Fe-MOF, and (f) GCRDE/RuO2; the corresponding bar diagrams (B) depicting the overpotentials at 10 mA cm−2; (C) Tafel slopes of (a) GCRDE/2:1 Co–Fe-MOF, (b) GCRDE/1:1 Co–Fe-MOF, (c) GCRDE/1:2 Co–Fe-MOF, (d) GCRDE/Co-MOF, and (e) GCRDE/RuO2; and (D) TOF plots of MOFs at different overpotentials. | ||
The Tafel plots of the 2:1 Co–Fe-MOF, the 1:1 Co–Fe-MOF, the 1:2 Co–Fe-MOF, the Co-MOF, and RuO2 are shown in Fig. 5(C). The Tafel slope values are 45, 55, 68, 72, and 111 mV dec−1 for the 2:1 Co–Fe-MOF, the 1:1 Co–Fe-MOF, the 1:2 Co–Fe-MOF, the Co-MOF, and RuO2 respectively. The low Tafel slope value indicates a fast kinetics and accordingly, the 2:1 Co–Fe-MOF shows the highest OER rate when compared to other MOFs and RuO2.
Furthermore, the mass activities of MOFs are compared at different potentials and shown in the form of bar diagrams in the ESI,† Fig. S11. As can be seen (ESI,† Table S3), the 2:1 Co–Fe-MOF shows the largest mass activity compared to the other MOFs (for instance, at 1.59 V (vs. RHE); the 2:1 Co/Fe-MOF, 1:1 Co/Fe-MOF, 1:2 Co/Fe-MOF, and GCRDE/Co-MOF show the mass activities of 481, 249, 207, and 28 A g−1 cm−2, respectively). To unveil the intrinsic activity of the active centers, turnover frequency (TOF) values are analyzed (calculation is briefed in the ESI†). The TOF values at three overpotentials (320, 370, and 420 mV) are calculated (Fig. 5(D) and Table S4, ESI†). The 2:1 Co–Fe-MOF shows the highest TOF at all three overpotentials when compared to the other materials. The high OER activity of the 2:1 Co–Fe-MOF is also attributed to the high electrochemical surface area (ECSA, calculated using the CV responses obtained in the non-redox or non-faradaic region (0.9 to 1.0 V vs. RHE)) determined using eqn (3).1,14
| ECSA = Cdl(fromexperiment)/Cdl(bareGC) | (3) |
GC) = 0.02 mF cm−2.
The ECSAs of the 2:1 Co–Fe-MOF, 1:1 Co–Fe-MOF, 1:2 Co–Fe-MOF, Co–MOF, and Fe–MOF are 16.6, 9.7, 11.9, 15.3, and 9.6 cm2, respectively (Fig. 6).
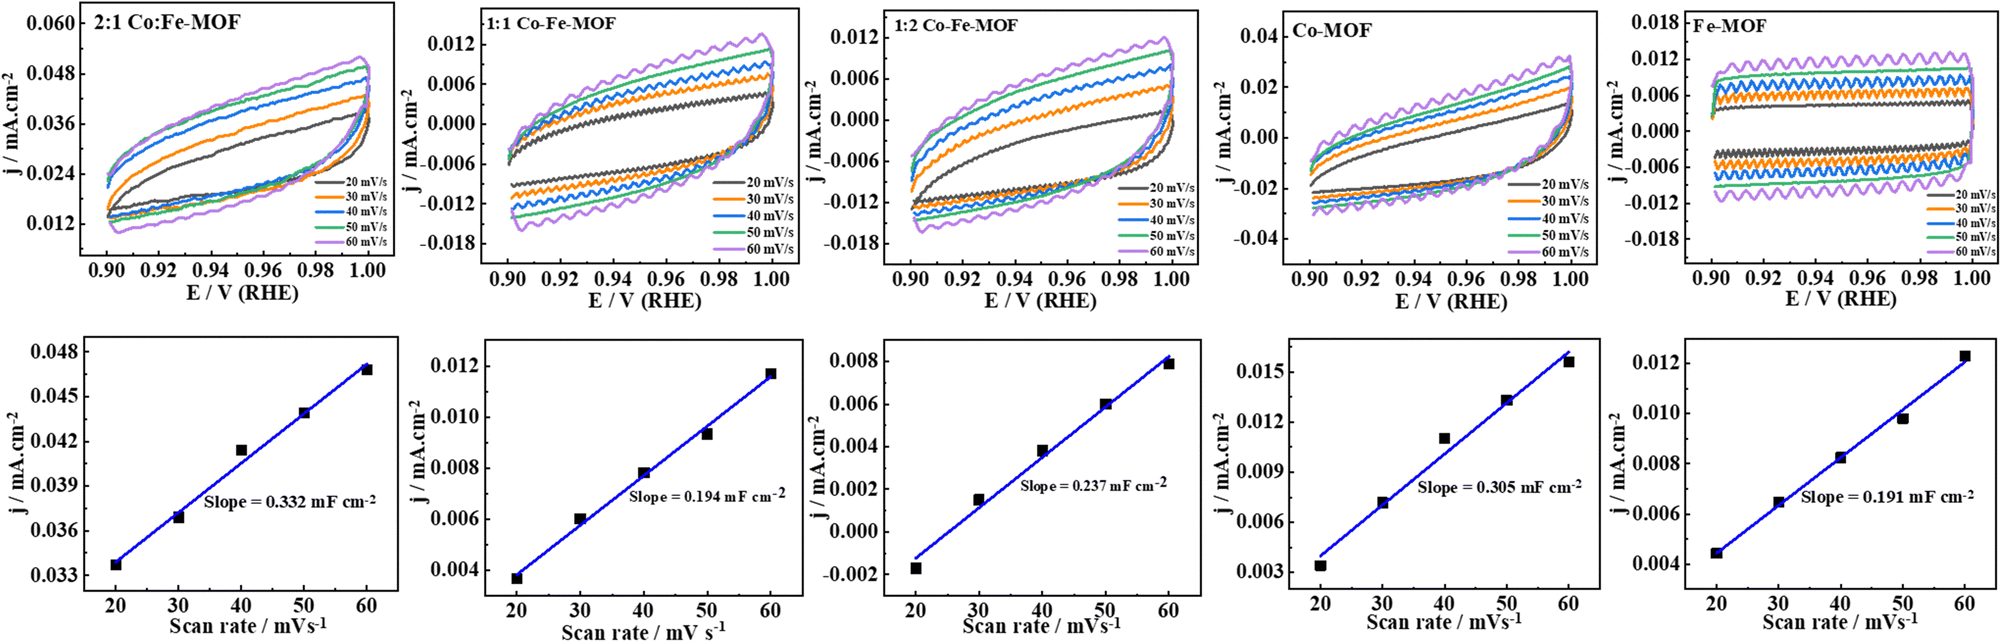 | ||
| Fig. 6 CV responses in the non-faradaic region of MOFs and the corresponding current density (j) vs. scan rate plot. | ||
These OER results signify that the inclusion of Fe into the Co-MOF significantly increases the OER performance, with the best OER activity obtained for the 2:1 Co–Fe-MOF. This can be attributed to the formation of the Co–Fe-LDH phase (comprehended from post-XRD patterns (vide supra)), which serves as an active catalyst during the OER, and also to the transmission of electrons from Co to Fe forming OER-active Co3+, which is due to the synergistic effect among Co and Fe sites, resulting in the enhanced OER performance.38 This electron transfer could be understood based on the crystal field theory.73 The introduction of Fe3+ into the Co-MOF structures results in a robust electronic interaction between Fe3+ and Co2+/Co3+. This interaction is attributed to the three unpaired electrons within the t2g orbitals of Fe3+. Consequently, the transfer of electron density from the t2g orbitals of Co2+ and Co3+ to the t2g orbitals of Fe3+ is observed, facilitated by the bridging O2− species. This electron transfer mechanism contributes to the stabilization of the Co center and hence better activity is observed when compared to the Co-MOF.39,70 Furthermore, the strong Lewis acid nature of Fe3+ makes the Con+ centres more electropositive by withdrawing electrons resulting in an increased electrophilicity of Con+ centres facilitating better OH− adsorption on the active cobalt sites and subsequently boosting the water oxidation.39 Table S5 (ESI†) presents the comparison of the OER activity of the 2:1 Co–Fe-MOF with those of other bimetallic MOFs reported in 1.0 M KOH.
To gain insights into the stability of the electrodes modified with the materials, the 2:1 Co–Fe-MOF, the Co-MOF, and RuO2, three different techniques are used (Fig. 7(A)–(C)). The first stability test is performed using the amperometry technique. In the amperometry technique, the electrodes GCRDE/2:1 Co–Fe-MOF and GCRDE/Co-MOF are maintained at 1.60 V vs. RHE for 3 h in the beginning, then at 1.65 V vs. RHE for the next 3 h, and again at 1.60 V vs. RHE for the next 4 h and the current responses are measured over a total period of 10 h (Fig. 7(A)). The 2:1 Co–Fe-MOF maintained stability over a period of 10 h. To compare the stability of the 2:1 Co–Fe-MOF with that of the Co-MOF, the amperometry stability test at 1.60 V and 1.65 V vs. RHE was performed for a period of 3 h each (ESI,† Fig. S12). Both the materials maintained the current for the first 3 h at an applied potential of 1.60 V; however, during the next 3 h at a potential of 1.65 V, they showed a large decrease in current density. The 2:1 Co–Fe-MOF shows less than a 9% decrease in current density, while the Co-MOF shows a 55% decrease in current density. This indicates the robustness of the 2:1 Co–Fe-MOF in maintaining the current for a long duration of the OER.
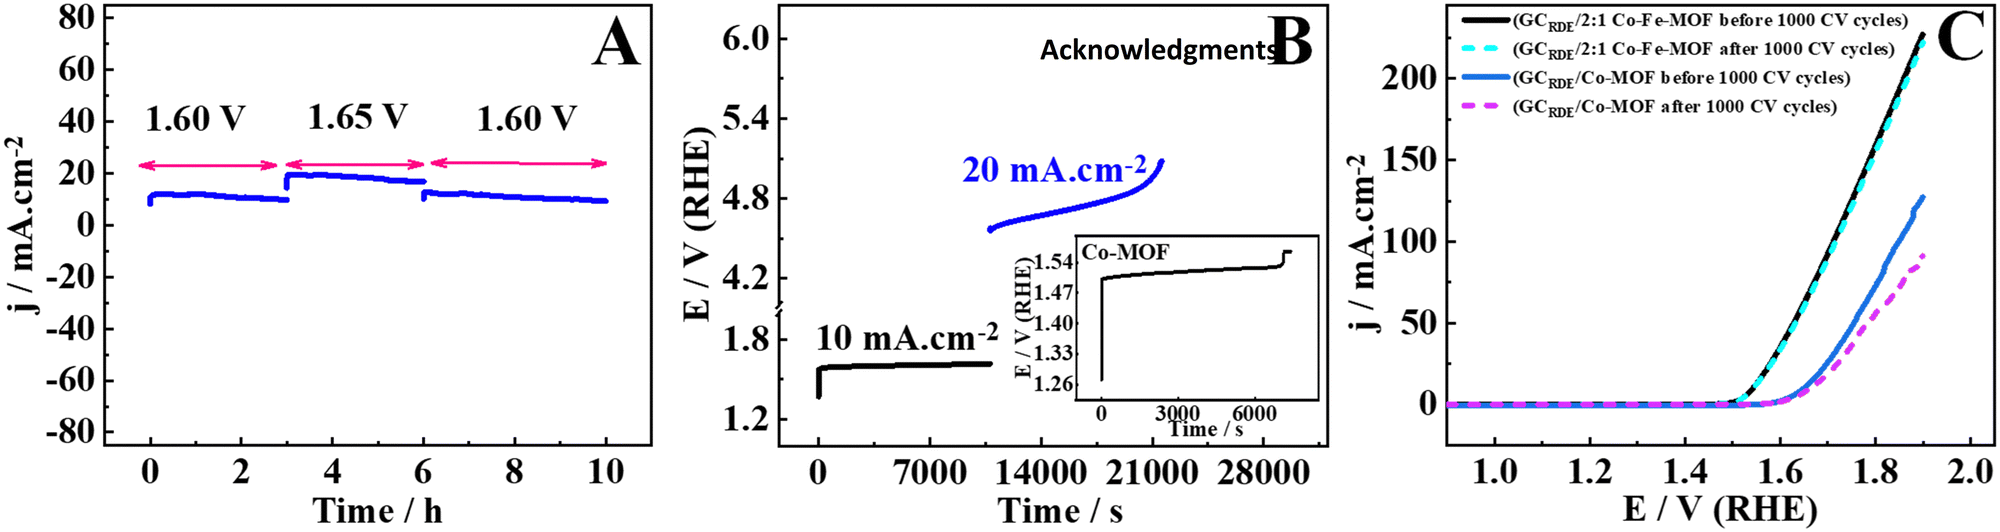 | ||
| Fig. 7 Stability tests for the 2:1 Co–Fe-MOF and Co-MOF via amperometry (A), chronopotentiometry (B), and LSV response before and after 1000 CV cycles (C). | ||
Furthermore, when 1.60 V was applied for 2 h on the RuO2-modified electrode, it showed 1.25 mA cm−2, only signifying the inefficiency of RuO2 in the OER catalysis (ESI,† Fig. S13A). The second stability test is done using the chronopotentiometry technique. When the current density of 10 mA cm−2 is applied to the 2:1 Co–Fe-MOF modified electrode for 3 h (Fig. 7(B)), no change in the potential is observed, which suggests the extreme stability of the 2:1 Co–Fe-MOF during the long-term OER process. However, when a current density of 0.02 A cm−2 is applied for 3 h, a slight change in the potential is observed. The durability of the 2:1 Co–Fe-MOF is compared with those of the Co-MOF and RuO2. When the current density of 10 mA cm−2 is applied to the electrode modified with the Co-MOF, an increase in the potential is seen after 2 h, suggesting that the Co-MOF requires an increased potential to sustain 10 mA cm−2 (inset of Fig. 7(B)), while RuO2 shows a sudden increase in the potential after 1200 s, indicating that RuO2 can sustain the applied current density (10 mA cm−2) only for 1200 s (ESI,† Fig. S13(B)). The LSV response measured before and after 1000 CV cycles is employed as the third technique to study the durability of the modified electrodes. The 2:1 Co–Fe-MOF showed no change in the LSV response before and after 1000 CV cycles, while the Co-MOF showed an increased overpotential and decreased current density after 1000 CV cycles (Fig. 7(C)). All three stability studies suggest that the electrode modified with the 2:1 Co–Fe-MOF is durable and efficient for long-term OER catalysis.
4. Conclusion
To conclude, the Co-MOF, Fe-MOF, and bimetallic Co–Fe-MOFs were prepared employing a facile one-step hydrothermal synthesis to explore alkaline water splitting. The electronic structure modifications upon the incorporation of iron into the Co-MOF are studied. The 2:1 Co–Fe-MOF showed the lowest overpotential of 310 mV to deliver 10 mA cm−2 and the smallest Tafel slope of 53 mV dec−1. The chemical and electrochemical changes before and after OER catalysis were studied employing XRD, XPS, and TEM and the findings indicated that the as-synthesized MOFs act as pre-catalysts for the OER. The bimetallic 2:1 Co–Fe-MOF showed enhanced OER activity compared to the 1:1 Co–Fe-MOF, the 1:2 Co–Fe-MOF, monometallic MOFs (Co and Fe), and the standard RuO2 catalyst. The active catalyst for the OER is the metal oxyhydroxide. The enhanced OER activity and stability of bimetallic MOFs over the monometallic MOFs are due to the inclusion of Fe3+ in the Co-MOF structure, which leads to a robust electronic interaction with both Co2+ and Co3+ and results in the transfer of electron density from the t2g orbitals of Co2+ and Co3+ to the t2g orbitals of Fe3+via O2− species. Furthermore, the introduction of Fe3+ generates OER active Co3+ and makes cobalt centers more electropositive, which aids in OH− adsorption on active sites, boosting the OER and lowering the overpotential. The 2:1 Co–Fe-MOF shows superior stability compared to the Co-MOF and RuO2 during the OER catalysis and thus the electrocatalyst shows substantial potential for facilitating the alkaline OER process and could be possibly utilized in commercial electrolyzers to produce green hydrogen.
Conflicts of interest
The authors declare no conflicts of interest.Acknowledgements
Financial support from the IoE incentive grant, BHU (scheme number 6031) and SERB (CRG/2022/003370) are gratefully acknowledged. V. S. acknowledges CSIR, New Delhi, India for providing CSIR Junior and Senior Research fellowships. We thank the Department of Physics, Institute of Science, BHU for the SEM and TEM and Central Discovery Centre (CDC), BHU for the XPS facilities. The authors also acknowledge funding provided by BHU.References
- D. K. Singh, V. Ganesan, D. K. Yadav and M. Yadav, Facile Synthesis of Sulfur-Doped Mesoporous Carbon Nitride Supported Defect-Rich Cobalt Sulfide for Electrocatalytic Water Oxidation, Cryst. Growth Des., 2020, 20, 6321–6328 CrossRef CAS.
- Y. Zhang, Y. Li, H. Guo, Y. Guo and R. Song, Recent advances in polyoxometalate-based materials and their derivatives for electrocatalysis and energy storage, Mater. Chem. Front., 2024, 8, 732–768 RSC.
- H. Ishaq, I. Dincer and C. Crawford, A review on hydrogen production and utilization: Challenges and opportunities, Int. J. Hydrogen Energy, 2022, 47, 26238–26264 CrossRef CAS.
- J. Song, C. Wei, Z. F. Huang, C. Liu, L. Zeng, X. Wang and Z. J. Xu, A review on fundamentals for designing oxygen evolution electrocatalysts, Chem. Soc. Rev., 2020, 49, 2196–2214 RSC.
- X. Xie, L. Du, L. Yan, S. Park, Y. Qiu, J. Sokolowski, W. Wang and Y. Shao, Oxygen Evolution Reaction in Alkaline Environment: Material Challenges and Solutions, Adv. Funct. Mater., 2022, 32(21) DOI:10.1002/adfm.202110036.
- S. Gong, T. Zhang, J. Meng, W. Sun and Y. Tian, Advances in the mechanism investigation for the oxygen evolution reaction: fundamental theory and monitoring techniques, Mater. Chem. Front., 2004, 8, 603–626 RSC.
- J. Wang, F. Cao, C. Shen, G. Li, X. Li, X. Yang, S. Li and G. Qin, Nanoscale nickel-iron nitride-derived efficient electrochemical oxygen evolution catalysts, Catal.: Sci. Technol., 2020, 10, 4458–4466 RSC.
- F. Song, L. Bai, A. Moysiadou, S. Lee, C. Hu, L. Liardet and X. Hu, Transition Metal Oxides as Electrocatalysts for the Oxygen Evolution Reaction in Alkaline Solutions: An Application-Inspired Renaissance, J. Am. Chem. Soc., 2018, 140, 7748–7759 CrossRef CAS PubMed.
- X. Bao, T. Wang and Y. Yang, Recent progress in bimetallic carbide-based electrocatalysts for water splitting, Mater. Chem. Front., 2024, 8, 627–651 RSC.
- A. Dutta and N. Pradhan, Developments of Metal Phosphides as Efficient OER Precatalysts, J. Phys. Chem. Lett., 2017, 8, 144–152 CrossRef CAS PubMed.
- Y. Gao, W. He, D. Cao, F. Wang, Y. Li, Q. Hao, C. Liu and H. Liu, Mo-Doped Ni3S2 Nanosheet Arrays for Overall Water Splitting, ACS Appl. Nano Mater., 2023, 6, 6066–6075 CrossRef CAS.
- T. Li, C. Wang, Y. Li, Y. Wu, C. Li, X. Zhang and F. Yang, Orientated carbon nanotubes boosting faster charge transfer for bifunctional HER and OER, Int. J. Hydrogen Energy, 2021, 46, 1904–1912 CrossRef CAS.
- J. Li, Z. Zhao, Y. Ma and Y. Qu, Graphene and Their Hybrid Electrocatalysts for Water Splitting, ChemCatChem, 2017, 9, 1554–1568 CrossRef CAS.
- S. Singh, M. Yadav, D. K. Singh, D. K. Yadav, P. K. Sonkar and V. Ganesan, One step synthesis of a bimetallic (Ni and Co) metal-organic framework for the efficient electrocatalytic oxidation of water and hydrazine, New J. Chem., 2022, 46, 13422–13430 RSC.
- U. Khan, A. Nairan, J. Gao and Q. Zhang, Current Progress in 2D Metal–Organic Frameworks for Electrocatalysis, Small Struct., 2023, 4(6) DOI:10.1002/sstr.202200109.
- Y. Wu, Y. Li, J. Gao and Q. Zhang, Recent advances in vacancy engineering of metal-organic frameworks and their derivatives for electrocatalysis, SusMat, 2021, 1, 66–87 CrossRef CAS.
- S. Chowdhury, N. L. Torad, M. Godara, A. A. M. El-Amir, G. Gumilar, A. Ashok, M. Rezaul Karim, I. Abdullah Alnaser, W. Chaikittisilp, N. Ray, Y. Yamauchi and Y. Valentino Kaneti, Hierarchical bimetallic metal-organic frameworks with controllable assembling sub-units and interior architectures for enhanced ammonia detection, Chem. Eng. J., 2024, 480, 147990 CrossRef CAS.
- S. Wang, W. Xie, P. Wu, G. Lin, Y. Cui, J. Tao, G. Zeng, Y. Deng and H. Qiu, Soft nanobrush-directed multifunctional MOF nanoarrays, Nat. Commun., 2022, 13, 1–8 Search PubMed.
- Y. Sun, L. Zheng, Y. Yang, X. Qian, T. Fu, X. Li, Z. Yang, H. Yan, C. Cui and W. Tan, Metal–Organic Framework Nanocarriers for Drug Delivery in Biomedical Applications, Nano-Micro Lett., 2020, 12, 1–29 CrossRef CAS PubMed.
- K. Sathiyan, A. Dutta, V. Marks, O. Fleker, T. Zidki, R. D. Webster and A. Borenstein, Nano-encapsulation: overcoming conductivity limitations by growing MOF nanoparticles in meso-porous carbon enables high electrocatalytic performance, NPG Asia Mater., 2023, 15, 18 CrossRef CAS.
- P. Cheng, X. Wang, J. Markus, M. Abdul Wahab, S. Chowdhury, R. Xin, S. M. Alshehri, Y. Bando, Y. Yamauchi and Y. V. Kaneti, Carbon nanotube-decorated hierarchical porous nickel/carbon hybrid derived from nickel-based metal-organic framework for enhanced methyl blue adsorption, J. Colloid Interface Sci., 2023, 638, 220–230 CrossRef CAS PubMed.
- Z. S. Fan, Y. Valentino Kaneti, S. Chowdhury, X. Wang, M. R. Karim, I. A. Alnaser and F. B. Zhang, Weak base-modulated synthesis of bundle-like carbon superstructures from metal-organic framework for high-performance supercapacitors, Chem. Eng. J., 2023, 462, 142094 CrossRef CAS.
- M. K. Sahoo, A. K. Samantara and J. N. Behera, In Situ Transformed Cobalt Metal-Organic Framework Electrocatalysts for the Electrochemical Oxygen Evolution Reaction, Inorg. Chem., 2020, 59, 12252–12262 CrossRef CAS PubMed.
- Y. Pan, J. Gao, E. Lv, T. Li, H. Xu, L. Sun, A. Nairan and Q. Zhang, Integration of Alloy Segregation and Surface CoO Hybridization in Carbon-Encapsulated CoNiPt Alloy Catalyst for Superior Alkaline Hydrogen Evolution, Adv. Funct. Mater., 2023, 33, 1–11 Search PubMed.
- R. Fan, N. Kang, Y. Li and L. Gao, A template-directed synthesis of metal-organic framework (MOF-74) ultrathin nanosheets for oxygen reduction electrocatalysis, RSC Adv., 2021, 11, 9353–9360 RSC.
- Y. Li, H. Wang, Y. Li, Q. Wang, D. Li, R. Wang, B. He and Y. Gong, 2D metal–organic-framework array-derived hierarchical network architecture of cobalt oxide flakes with tunable oxygen vacancies towards efficient oxygen evolution reaction, J. Catal., 2018, 364, 48–56 CrossRef CAS.
- T. Zhou, Y. Du, D. Wang, S. Yin, W. Tu, Z. Chen, A. Borgna and R. Xu, Phosphonate-Based Metal-Organic Framework Derived Co-P-C Hybrid as an Efficient Electrocatalyst for Oxygen Evolution Reaction, ACS Catal., 2017, 7, 6000–6007 CrossRef CAS.
- Y. Li, M. Lu, P. He, Y. Wu, J. Wang, D. Chen, H. Xu, J. Gao and J. Yao, Bimetallic Metal-Organic Framework-Derived Nanosheet-Assembled Nanoflower Electrocatalysts for Efficient Oxygen Evolution Reaction, Chem. – Asian J., 2019, 14, 1590–1594 CrossRef CAS PubMed.
- Y. Li, Y. Wu, T. Li, M. Lu, Y. Chen, Y. Cui, J. Gao and G. Qian, Tuning the electronic structure of a metal–organic framework for an efficient oxygen evolution reaction by introducing minor atomically dispersed ruthenium, Carbon Energy, 2023, 5(2), 265 CrossRef.
- R. Subbaraman, D. Tripkovic, K. C. Chang, D. Strmcnik, A. P. Paulikas, P. Hirunsit, M. Chan, J. Greeley, V. Stamenkovic and N. M. Markovic, Trends in activity for the water electrolyser reactions on 3d M(Ni,Co,Fe,Mn) hydr(oxy)oxide catalysts, Nat. Mater., 2012, 11, 550–557 CrossRef CAS PubMed.
- T. Kishi, S. Takahashi and T. Nagai, Electrode behaviour of spinel-type Co–Fe cobaltites, Surf. Coat. Technol., 1986, 27, 351–357 CrossRef CAS.
- M. S. Burke, M. G. Kast, L. Trotochaud, A. M. Smith and S. W. Boettcher, Cobalt-Iron (Oxy)hydroxide Oxygen Evolution Electrocatalysts: The Role of Structure and Composition on Activity, Stability, and Mechanism, J. Am. Chem. Soc., 2015, 137, 3638–3648 CrossRef CAS PubMed.
- N. Zhang, X. Feng, D. Rao, X. Deng, L. Cai, B. Qiu, R. Long, Y. Xiong, Y. Lu and Y. Chai, Lattice oxygen activation enabled by high-valence metal sites for enhanced water oxidation, Nat. Commun., 2020, 11, 1–11 CrossRef PubMed.
- P. Yang, X. Ge, L. Fan, M. Li, L. Zhang, X. Li, Z. Kang, H. Guo, F. Dai and D. Sun, Activity boosting of a metal-organic framework by Fe-Doping for electrocatalytic hydrogen evolution and oxygen evolution, J. Solid State Chem., 2020, 292, 121696 CrossRef CAS.
- T. Zhang, M. R. Nellist, L. J. Enman, J. Xiang and S. W. Boettcher, Modes of Fe Incorporation in Co–Fe (Oxy)hydroxide Oxygen Evolution Electrocatalysts, ChemSusChem, 2019, 12, 2015–2021 CrossRef CAS PubMed.
- F. Li, J. Li, L. Zhou and S. Dai, Enhanced OER performance of composite Co–Fe-based MOF catalystsviaa one-pot ultrasonic-assisted synthetic approach, Sustainable Energy Fuels, 2021, 5, 1095–1102 RSC.
- Z. Zou, T. Wang, X. Zhao, W. J. Jiang, H. Pan, D. Gao and C. Xu, Expediting in-Situ Electrochemical Activation of Two-Dimensional Metal-Organic Frameworks for Enhanced OER Intrinsic Activity by Iron Incorporation, ACS Catal., 2019, 9, 7356–7364 CrossRef CAS.
- K. Ge, S. Sun, Y. Zhao, K. Yang, S. Wang, Z. Zhang, J. Cao, Y. Yang, Y. Zhang, M. Pan and L. Zhu, Facile Synthesis of Two-Dimensional Iron/Cobalt Metal–Organic Framework for Efficient Oxygen Evolution Electrocatalysis, Angew. Chem., Int. Ed., 2021, 60, 12097–12102 CrossRef CAS PubMed.
- P. Maurya, V. Vyas, A. N. Singh and A. Indra, Iron(iii) ion-assisted transformation of ZIF-67 to a self-supported FexCo-layered double hydroxide for improved water oxidation, Chem. Commun., 2023, 59, 7200–7203 RSC.
- G. Sargazi, D. Afzali, N. Daldosso, H. Kazemian, N. P. S. Chauhan, Z. Sadeghian, T. Tajerian, A. Ghafarinazari and M. Mozafari, A systematic study on the use of ultrasound energy for the synthesis of nickel-metal organic framework compounds, Ultrason. Sonochem., 2015, 27, 395–402 CrossRef CAS PubMed.
- H. Yang, X. Y. Duan, J. J. Lai and M. L. Wei, Proton-Conductive Keggin-Type Clusters Decorated by the Complex Moieties of Cu(II) 2,2′-Bipyridine-4,4′-dicarboxylate/Diethyl Analogues, Inorg. Chem., 2019, 58, 1020–1029 CrossRef CAS PubMed.
- D. K. Singh, V. Ganesan, D. K. Yadav and M. Yadav, Metal (Mn, Fe, Co, Ni, Cu, and Zn) Phthalocyanine-Immobilized Mesoporous Carbon Nitride Materials as Durable Electrode Modifiers for the Oxygen Reduction Reaction, Langmuir, 2020, 36, 12202–12212 CrossRef CAS PubMed.
- R. Kaur, M. Chhibber, P. Mahata and S. K. Mittal, Induction of Catalytic Activity in ZnO Loaded Cobalt Based MOF for the Reduction of Nitroarenes, ChemistrySelect, 2018, 3, 3417–3425 CrossRef CAS.
- Y. P. Wei, S. Yang, P. Wang, J. H. Guo, J. Huang and W. Y. Sun, Iron(iii)-bipyridine incorporated metal-organic frameworks for photocatalytic reduction of CO2with improved performance, Dalton Trans., 2021, 50, 384–390 RSC.
- A. Yuan, Y. Lu, X. Zhang, Q. Chen and Y. Huang, Two-dimensional iron MOF nanosheet as a highly efficient nanozyme for glucose biosensing, J. Mater. Chem. B, 2020, 8, 9295–9303 RSC.
- E. Tynan, P. Jensen, P. E. Kruger and A. C. Lees, Solvent templated synthesis of metal–organic frameworks: Structural characterisation and properties of the 3D network isomers ([Mn(dcbp)]·½DMF)n and ([Mn(dcbp)]·2H2O)n, Chem. Commun., 2004, 776–777 RSC.
- J. Fonseca, T. Gong, L. Jiao and H. L. Jiang, Metal-organic frameworks (MOFs) beyond crystallinity: amorphous MOFs, MOF liquids and MOF glasses, J. Mater. Chem. A, 2021, 9, 10562–10611 RSC.
- J. Ma, X. Bai, W. He, S. Wang, L. Li, H. Chen, T. Wang, X. Zhang, Y. Li, L. Zhang, J. Chen, F. Meng and Y. Fu, Amorphous FeNi-bimetallic infinite coordination polymers as advanced electrocatalysts for the oxygen evolution reaction, Chem. Commun., 2019, 55, 12567–12570 RSC.
- L. Xu, S. Yan, E. Y. Choi, J. Y. Lee and Y. U. Kwon, Product control by halide ions of ionic liquids in the ionothermal syntheses of Ni-(H)BTC metal-organic frameworks, Chem. Commun., 2009, 3431–3433 RSC.
- W. Huang, J. Li, X. Liao, R. Lu, C. Ling, X. Liu, J. Meng, L. Qu, M. Lin, X. Hong, X. Zhou, S. Liu, Y. Zhao, L. Zhou and L. Mai, Ligand Modulation of Active Sites to Promote Electrocatalytic Oxygen Evolution, Adv. Mater., 2022, 34, 1–8 Search PubMed.
- S. Said, M. Elhossieny, M. Riad and S. Mikhail, Pristine Cu (Co)/Fe layered double hydroxides (Co(Cu)/Fe-LDH) as active catalysts for the transalkylation of toluene to trimethylbenzenes, Mol. Catal., 2018, 445, 213–222 CrossRef CAS.
- K. Zhang, Y. Zhu, K. Yue, K. Zhan, P. Wang, Y. Kong, Y. Yan and X. Wang, In-situ transformed trimetallic metal-organic frameworks as an efficient pre-catalyst for electrocatalytic oxygen evolution, Nano Res., 2022, 1–8 Search PubMed.
- E. Elanthamilan, A. Sathiyan, S. Rajkumar, E. J. Sheryl and J. P. Merlin, Polyaniline based charcoal/Ni nanocomposite material for high performance supercapacitors, Sustainable Energy Fuels, 2018, 2, 811–819 RSC.
- J. Velez, R. Arce, D. Alburquenque, J. L. Gautier, C. Zuñiga and F. Herrera, Simple steps for synthesis of silicon oxide Mesoporous materials used as template, J. Chilean Chem. Soc., 2013, 58, 1998–2000 CrossRef CAS.
- E. P. Barrett, L. G. Joyner and P. P. Halenda, The Determination of Pore Volume and Area Distributions in Porous Substances. I. Computations from Nitrogen Isotherms, J. Am. Chem. Soc., 1951, 73, 373–380 CrossRef CAS.
- Y. Jing, Y. Cheng, L. Wang, Y. Liu, B. Yu and C. Yang, MOF-derived Co, Fe, and Ni co-doped N-enriched hollow carbon as efficient electrocatalyst for oxygen reduction reaction, Chem. Eng. J., 2020, 397, 125539 CrossRef CAS.
- V. Srinivasan and R. A. Walton, X-ray photoelectron spectra of inorganic molecules. XX. Observations concerning the sulfur 2p binding energies in metal complexes of thiourea, Inorg. Chim. Acta, 1977, 25, 85–86 CrossRef.
- P. Li, Z. Jin, Y. Qian, Z. Fang, D. Xiao and G. Yu, Probing Enhanced Site Activity of Co–Fe Bimetallic Subnanoclusters Derived from Dual Cross-Linked Hydrogels for Oxygen Electrocatalysis, ACS Energy Lett., 2019, 4, 1793–1802 CrossRef CAS.
- B. Singh, A. Yadav and A. Indra, Realizing electrochemical transformation of a metal-organic framework precatalyst into a metal hydroxide-oxy(hydroxide) active catalyst during alkaline water oxidation, J. Mater. Chem. A, 2022, 10, 3843–3868 RSC.
- J. Zhang, Q. Mei, Y. Ding, K. Guo, X. Yang and J. Zhao, Ordered Mesoporous NiCo2O4 Nanospheres as a Novel Electrocatalyst Platform for 1-Naphthol and 2-Naphthol Individual Sensing Application, ACS Appl. Mater. Interfaces, 2017, 9, 29771–29781 CrossRef CAS PubMed.
- B. Zhang, L. Wang, Z. Cao, S. M. Kozlov, F. P. García de Arquer, C. T. Dinh, J. Li, Z. Wang, X. Zheng, L. Zhang, Y. Wen, O. Voznyy, R. Comin, P. De Luna, T. Regier, W. Bi, E. E. Alp, C. W. Pao, L. Zheng, Y. Hu, Y. Ji, Y. Li, Y. Zhang, L. Cavallo, H. Peng and E. H. Sargent, High-valence metals improve oxygen evolution reaction performance by modulating 3d metal oxidation cycle energetics, Nat. Catal., 2020, 3, 985–992 CrossRef CAS.
- D. K. Singh, M. Yadav, V. Ganesan and P. A. Bhobe, Cox(VO)yOz Nanocrystal-Integrated Covalent Organic Polymers as a Highly Active and Durable Catalyst for Electrochemical Water Oxidation: An Untold Role of the VO2 +/VO2 + Redox Couple, ACS Appl. Energy Mater., 2022, 5, 2805–2816 CrossRef CAS.
- B. Singh, O. Prakash, P. Maiti, P. W. Menezes and A. Indra, Electrochemical transformation of Prussian blue analogues into ultrathin layered double hydroxide nanosheets for water splitting, Chem. Commun., 2020, 56, 15036–15039 RSC.
- S. Ghosh, P. Kumar, S. Conrad, M. Tsapatsis and K. A. Mkhoyan, Electron-Beam-Damage in Metal Organic Frameworks in the TEM, Microsc. Microanal., 2019, 25, 1704–1705 CrossRef.
- L. Liu, D. Zhang, Y. Zhu and Y. Han, Bulk and local structures of metal–organic frameworks unravelled by high-resolution electron microscopy, Commun. Chem., 2020, 3, 1–14 CrossRef PubMed.
- Q. Chen, C. Dwyer, G. Sheng, C. Zhu, X. Li, C. Zheng and Y. Zhu, Imaging Beam-Sensitive Materials by Electron Microscopy, Adv. Mater., 2020, 32, 1–42 Search PubMed.
- J. Yang, H. Liu, W. N. Martens and R. L. Frost, Synthesis and characterization of Cobalt hydroxide, cobalt oxyhydroxide, and cobalt oxide nanodiscs, J. Phys. Chem. C, 2010, 114, 111–119 CrossRef CAS.
- J. Zhou, Y. Wang, X. Su, S. Gu, R. Liu, Y. Huang, S. Yan, J. Li and S. Zhang, Electrochemically accessing ultrathin Co (oxy)-hydroxide nanosheets and: Operando identifying their active phase for the oxygen evolution reaction, Energy Environ. Sci., 2019, 12, 739–746 RSC.
- K. Srinivas, X. Chen, D. Liu, F. Ma, X. Zhang, W. Zhang, H. Lin and Y. Chen, Surface modification of metal-organic frameworks under sublimated iron-atmosphere by controlled carbonization for boosted oxygen evolution reaction, Nano Res., 2022, 15, 5884–5894 CrossRef CAS.
- S. Anantharaj, S. Kundu and S. Noda, “The Fe Effect”: A review unveiling the critical roles of Fe in enhancing OER activity of Ni and Co based catalysts, Nano Energy, 2021, 80, 105514 CrossRef CAS.
- M. B. Stevens, C. D. M. Trang, L. J. Enman, J. Deng and S. W. Boettcher, Reactive Fe-Sites in Ni/Fe (Oxy)hydroxide Are Responsible for Exceptional Oxygen Electrocatalysis Activity, J. Am. Chem. Soc., 2017, 139, 11361–11364 CrossRef CAS.
- M. Yadav, P. K. Sonkar, K. Prakash, V. Ganesan, M. Sankar, D. K. Yadav and R. Gupta, Insight into efficient bifunctional catalysis: Oxygen reduction and oxygen evolution reactions using MWCNTs based composites with 5,10,15,20-tetrakis(3′,5′-dimethoxyphenyl)porphyrinato cobalt(II) and 5,10,15,20-tetrakis(3′,5′-dihydroxyphenyl)porphyrinato, Int. J. Hydrogen Energy, 2020, 45, 9710–9722 CrossRef CAS.
- J. D. Lee, Concise Inorganic Chemsitry, 1996 Search PubMed.
Footnote |
| † Electronic supplementary information (ESI) available: Calculation of turnover frequency (TOF), comparison tables, XPS peak positions, digital photographs of MOFs, possible structures of MOFs, FTIR, powder XRD, BET plots, XPS spectra, EDX spectra, CV responses of MOFs, mass activity, stability test responses, and a video showing the degradation of the MOF during TEM analysis and bubble formation at the GCE showing efficient OER. See DOI: https://doi.org/10.1039/d3ya00572k |
| This journal is © The Royal Society of Chemistry 2024 |