
 Open Access Article
 This Open Access Article is licensed under a Creative Commons Attribution-Non Commercial 3.0 Unported Licence
The role of the degree of polymerization in the chiroptical properties of dynamic asymmetric poly(diphenylacetylene)s†
Juan José
Tarrío
a,
Berta
Fernández
 b,
Emilio
Quiñoá
a and
Félix
Freire
*a
b,
Emilio
Quiñoá
a and
Félix
Freire
*a
aCentro Singular de Investigación en Química Biolóxica e Materiais Moleculares (CiQUS) and Departamento de Química Orgánica, Universidade de Santiago de Compostela, E-15782 Santiago de Compostela, Spain. E-mail: felix.freire@usc.es
bDepartamento de Química Física, Universidade de Santiago de Compostela, E-15782 Santiago de Compostela, Spain
First published on 24th May 2023
Abstract
Non-symmetric poly(diphenylacetylene)s (PDPAs) show a strong relationship between the size of the macromolecules and their electronic circular dichroism (ECD) spectra. Thus, polymers and oligomers of PDPAs with the same screw sense excess show opposite ECD spectra. This is due to the complex nature of the ECD spectra, where the main electronic transitions depend on the degree of polymerization (DP).
Over the past decades, the synthesis of chiral materials, such as helical polymers,1–9 has attracted worldwide attention due to their applications in different fields such as chiral recognition,10 catalysis,11–16 chromatographic separation17–20 or circularly polarized luminescence (CPL) active materials.21–25 In these systems, the helical structure adopted by the polymer is responsible for its function. Therefore, to improve the features of actual materials, or even to prepare novel materials with better or new properties, it is necessary to have tools that enable us to elucidate the secondary structure of the polymer and/or to predict a possible scaffold from a certain monomeric structure. Thus, the scientific community has devoted great efforts recently to study the three-dimensional structure of different families of helical polymers, such as poly(phenylacetylene)s (PPAs), polyacetylenes (PAs), poly(diphenylacetylene)s (PDPAs) (symmetric and non-symmetric), poly(isocyanides) and poly(isocyanate)s, among others.26–36 Among these macromolecules, PPAs are a very interesting family of dynamic helical polymers where the helical sense and/or the elongation can be tuned selectively using external stimuli.37–43
The helical scaffold of PPAs or PDPAs can be described using four dihedral angles, ω1, ω2, ω3 and ω4 (Fig. 1a), whose values can be extracted using a combination of structural techniques such as ECD, XRD, AFM, computational calculations, UV-vis spectroscopy, light-irradiation studies, etc.
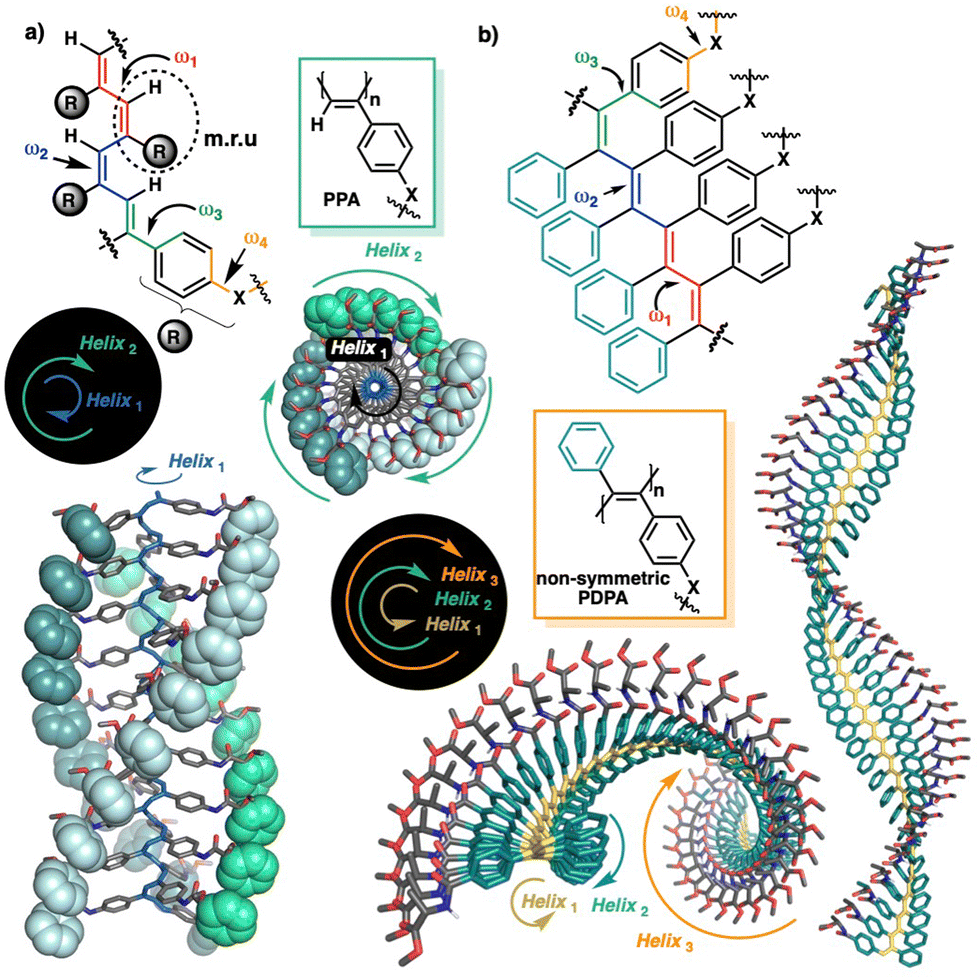 | ||
| Fig. 1 Schematic illustration of the main dihedral angles needed to build a 3D model of (a) PPAs and (b) PDPAs. The coaxial helices found in PPAs and PDPAs are highlighted. | ||
Interestingly, while PPAs generate a helical scaffold that consists of two coaxial helices: an internal helix (helix 1) set up by the polyene backbone and an external helix (helix 2) formed by the pendants (Fig. 1a), the scaffold of a non-symmetric PDPA comprises three different helices: helix 1, set up by the polyene backbone; helix 2, formed by the substituents of the double bonds, i.e., the two phenyl groups; and helix 3, generated when the polymer grows (Fig. 1b).
Moreover, due to the presence of a more substituted backbone, the dynamic behavior of PDPAs is reduced compared with that of PPAs that are less substituted. This fact results in the greater chemical, thermal and photochemical stability of PDPAs.32–36 In addition, the two aryl rings present in the monomeric repetition unit (m.r.u.), which is attached to the conjugated double bonds, provide the polymers with new properties such as fluorescence and CPL, which open up new applications for these materials.43,44
This complete replacement of the polyene backbone hydrogens with aryl rings in PDPAs provides the models that are used to determine the helical sense of a PPA, based on electronic circular dichroism (ECD) data, which is useless for PDPAs. In PPAs, the first Cotton band of the ECD spectrum is usually attributed to ω1,45 and corresponds to the orientation of the internal helix, whereas in PDPAs the first Cotton band provides information about the orientation of the aryl rings within the helical scaffold (helix 2),33 which is opposite to the helix described by the polyene backbone. Therefore, to elucidate the helical sense of a PPA or a PDPA, different models must be applied.
In the literature, there are few examples where the helical sense of a dynamical helical polymer is inverted through changes to its degree of polymerization.46,47 However, herein we will demonstrate – through a combination of experimental and theoretical studies – that the first Cotton band in the ECD spectrum of a PDPA is produced by the contribution of helix 1 and helix 2, which rotate in opposite directions and whose relative strengths will depend on the size of the polymer. Thus, while in short oligomers the first Cotton band in the ECD spectrum will be governed by helix 1, in larger polymers this Cotton band will be greatly affected by the orientation of helix 2.
To perform these studies, the PDPAs poly-(1–3), which bear the D-alanine methyl ester benzamide moiety (poly-1), the D-valine methyl ester benzamide (poly-2) and the D-leucine methyl ester benzamide (poly-3) at the para position of one of the aryl rings, were used as model compounds (Fig. 2a).
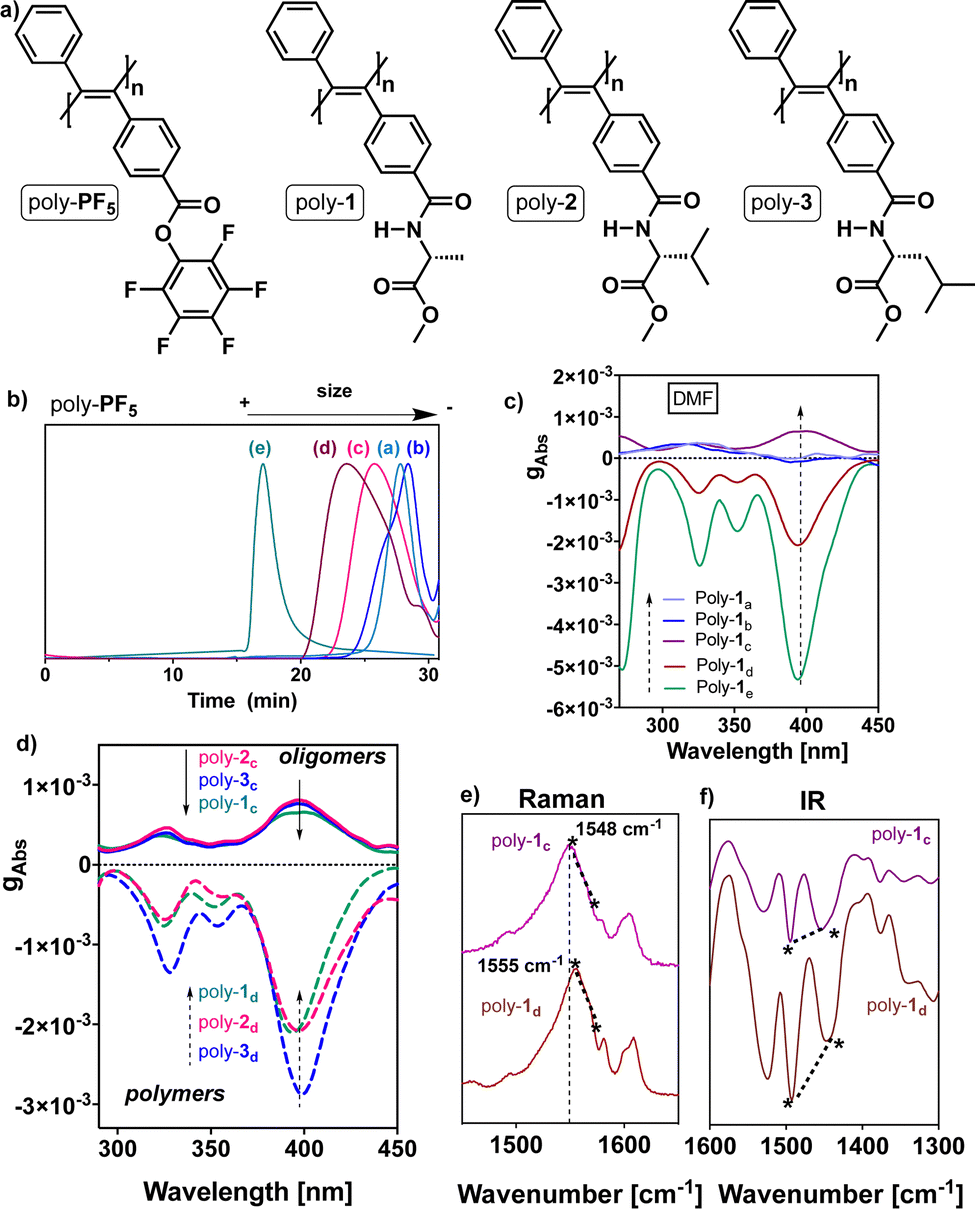 | ||
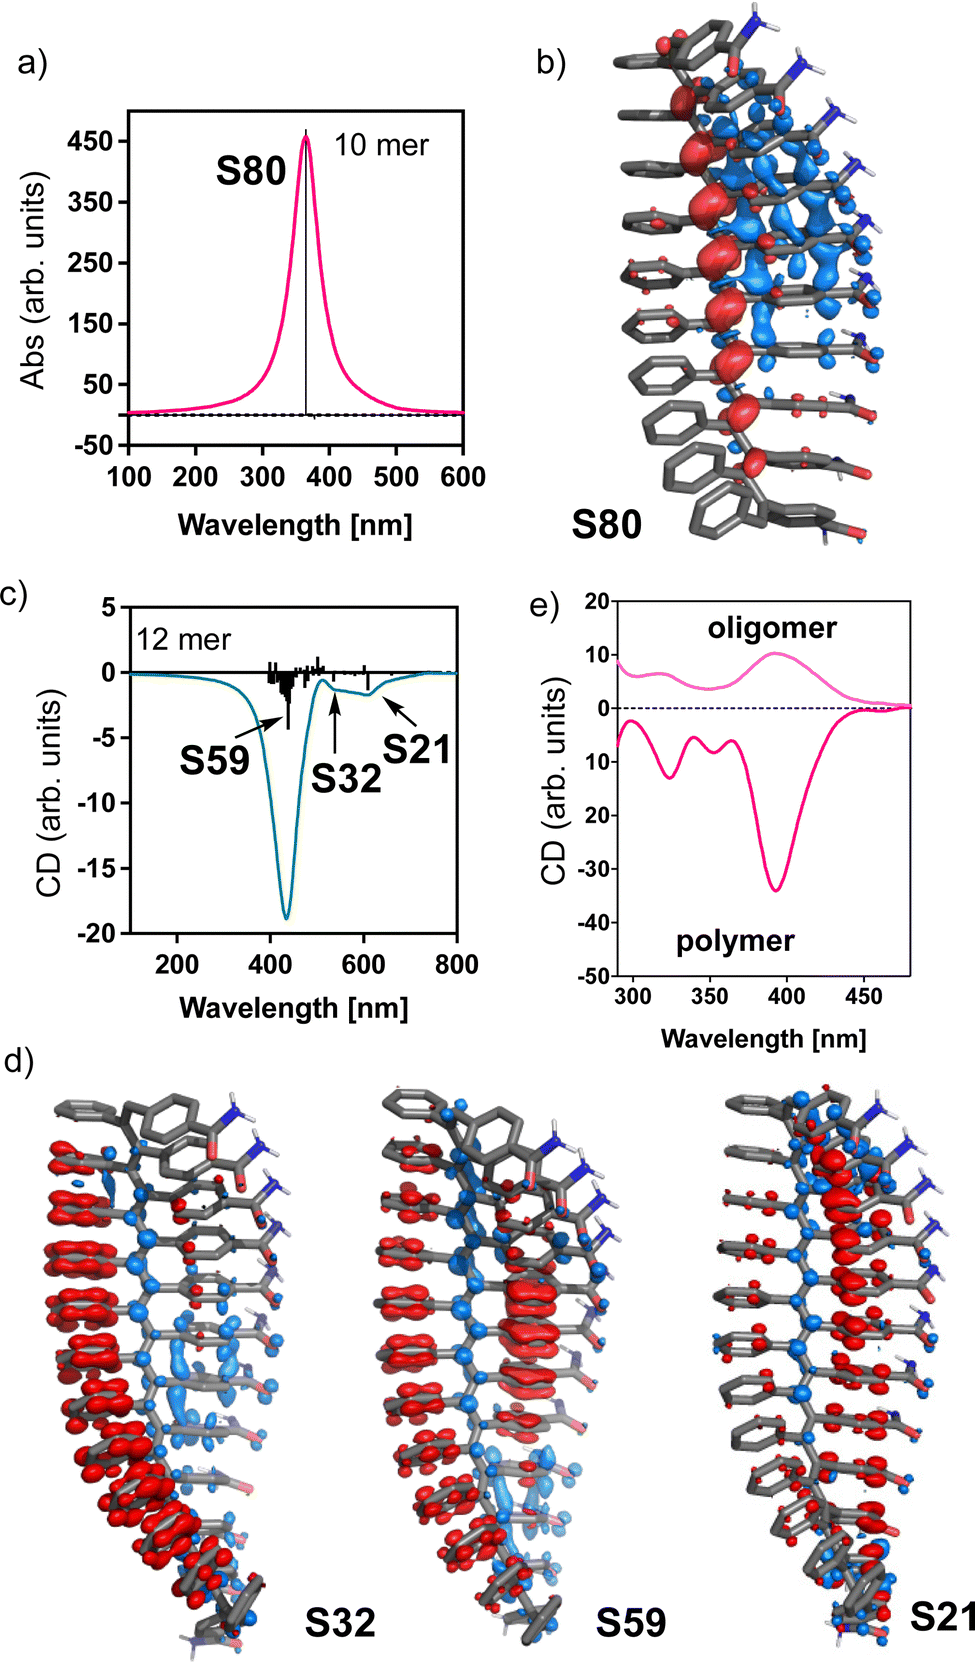
| Fig. 2 (a) Structure of poly-PF5 and poly-(1–3). (b) GPC measurements for poly-PF5(a–e). (c) ECD spectra of poly-1(a–e) after thermal annealing at 80 °C for 24 h. (d) ECD spectra of poly-(1–3)(c,d) after thermal annealing at 80 °C for 24 h. Portions of the (e) Raman and (f) IR spectra of poly-1(c,d). [poly-(1–3)] = 0.5 mg mL−1 DMF. | ||
First, different batches of poly-PF5 were prepared via the polymerization of perfluorophenyl 4-(phenylethynyl)benzoate with a mixture of WCl6 and Ph4Sn used as catalysts (Fig. 2a).33 By using different polymerization conditions it was possible to generate poly-PF5 with different degrees of polymerization that vary from 19 (oligomer size) to 460 (polymer form) (Table 1), as inferred from GPC studies (Table 1 and Fig. 2b).48,49 Next, achiral poly-PF5 was completely transformed into poly-1, poly-2 and poly-3via a post-functionalization method.50 The full derivatization of poly-PF5 was confirmed by comparing the integrals of the pendant proton peaks and the poly(diphenylacetylene) backbone at the 1H-NMR spectra. Moreover, the complete post-functionalization was corroborated by 19F-NMR, where no F signals appeared in the 19F-NMR spectra of poly-1, poly-2 and poly-3 (see ESI†).
| No. | Temp. (°C) | Time (h) | Yield (%) | M w | M w/Mnb | DP |
|---|---|---|---|---|---|---|
| a Carried out under nitrogen in toluene with WCl6–Ph4Sn as the catalytic system; [M]0 = 0.2 M, [cat] = 10 mM, [Ph4Sn] = 20 mM. b Estimated via GPC in THF based on calibration using polystyrene. | ||||||
| a | 70 | 20 | 11 | 7500 | 1.2 | 19 |
| b | 70 | 24 | 26 | 9500 | 1.4 | 24 |
| c | 80 | 24 | 54 | 17![[thin space (1/6-em)]](https://www.rsc.org/images/entities/char_2009.gif) 100 100 |
1.8 | 44 |
| d | 90 | 24 | 61 | 39100 |
2.3 | 100 |
| e | 100 | 24 | 80 | 178700 |
1.3 | 460 |
Interestingly, ECD studies carried out on dilute solutions of poly-1 with a DP ranging from 19 to 460, prepared in DMF and measured after thermal annealing at 80 °C for 24 h, show a strong relationship between the ECD signature and polymerization degree (Fig. 2c). Thus, while oligomers with DP<30 (Table 1, entries a and b) (i.e., poly-(1a and 1b)) do not exhibit ECD spectra in all the tested solvents, poly-1c with DP = 44 (oligomer) shows an ECD (+) signal in DMF, while poly-(1d and 1e) with, respectively, DP = 100 and 460 (polymers) show an ECD (−) signal in the same solvent (Fig. 2c).
These ECD spectral results indicate that there is a minimum polymer length necessary to be folded with a certain screw sense excess. Moreover, by varying the polymer length, ECD spectra of opposite sign are obtained. The same ECD sign/DP relationships were obtained for poly-2 and poly-3 (Fig. 2d).
To determine which structural parameters are related to this ECD spectrum/DP pattern, different structural studies were carried out. Thus, IR and Raman studies for poly-(1–3)c,d show the same stereoregularity (E configuration) in the double bonds at low and high DP (i.e., the Raman band ratio at ca. 1585 cm−1/1550 cm−1 is <1, and the IR band ratio at ca. 1500 cm−1/1450 cm−1 is >1), indicating that the stereoregularity is not altered by the different polymerization conditions (Fig. 2e and f).25,33 Interestingly, in the Raman spectra of the polymers poly-(1–3)(c,d), a blueshift of the conjugated double-bond band is observed when the DP of the polymer is increased (Fig. 2e and f).51 This is due to the polymer folding into a helical structure, where the conjugation between double bonds is reduced. In general, within helical polymers, large ones are better folded than short oligomers, producing a large screw sense excess in the ECD spectra. This effect is observed for poly-(1–3)(c,d) (Fig. 2c, d and ESI†), where changes in the folding of the PDPAs are accompanied by changes in the ECD and Raman spectra.
To study the secondary structure of the PDPAs, i.e., poly-(1–3)(c,d), Raman optical activity (ROA) was the technique of choice due to the information that can be extracted from it. However, the large fluorescence of the PDPAs interferes with the ROA measurements and no data could be obtained using this technique. Thus, to better understand the contribution of the different functional groups present in the PDPAs with different DPs to the ECD spectra, computational studies [TD-DFT(CAM-B3LYP)/3-21G]52–54 were carried out for different PDPA oligomers (n = 8, 10, 12, 14, 16 m.r.u.) with a trans-transoidal skeleton describing an internal P (right-handed) helix (ω1 = 165°, ω2 = 180°, ω3 = 110°; Fig. 3a).51 The values of the dihedral angles employed to build the 3D models were obtained from previous studies.33
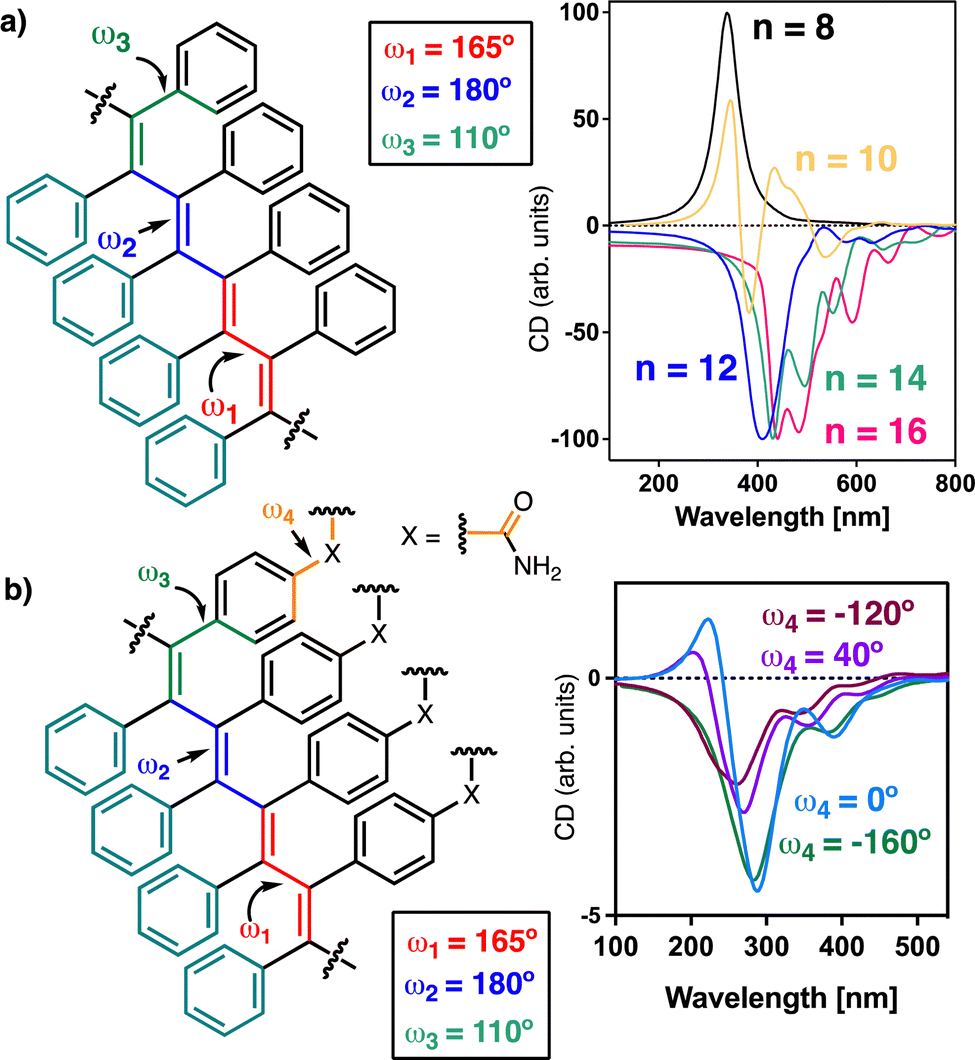 | ||
| Fig. 3 TD-DFT (CAM-B3LYP)/3-21G ECD spectra of (a) oligomers of different sizes, and (b) a 16-mer with different ω4 values. The half width at half height equals (a) 28 nm and (b) 33 nm. For the oligomer structures: ω1 = 165°, ω2 = 180° and ω3 = 110°. | ||
In these models, the chiral substituents were removed to reduce the computational demands. In agreement with the experimental results, it was found that the theoretical ECD spectrum of a PDPA varies with n. Thus, while the theoretical ECD spectrum of an oligomer with n = 8 shows a positive Cotton band at 300 nm, the theoretical ECD spectrum of an n = 10 oligomer shows four alternating Cotton bands between 300 and 600 nm, showing a negative band at ca. 500 nm. Interestingly, for the oligomers with n > 12, the ECD spectra become negative in the same wavelength range (Fig. 3a).
In our theoretical models, the oligomers are correctly folded into a helical structure. However, experimentally it was found that the asymmetric PDPAs [poly(1–3)] fold in solution into a P (right-handed) or M (left-handed) helix when the DP of the polymer is larger than 30.
To determine whether or not the pendant group interferes in the ECD spectrum of a PDPA, an amide group was introduced at the para position of one of the aryl rings oriented with different dihedral angles (ω4 = 0°, 40°, −120° and −160°). TD-DFT(CAM-B3LYP)/3-21G calculations were performed on oligomers with sizes n = 8, 10, 12, 14, 16 m.r.u. The theoretical ECD spectra show that the ECD traces are not affected by the orientation of this group (Fig. 3b). For instance, in the case of the oligomer with n = 8, a positive ECD spectrum was obtained independently of the value introduced for ω4 (see ESI†), whereas in the case of the oligomer with n = 16, a negative ECD trace was obtained in all cases (Fig. 3b).
Thus, experimentally and theoretically, it is found that there is a direct relationship between the ECD spectra and the DP of a PDPA, an effect that was neither observed experimentally nor predicted by theoretical calculations in previous reports on PPAs.45,55
To obtain the ECD spectra using computational chemistry, the scalar rotational strength must be evaluated. For a transition from the ground state of the molecule (0) to an excited state (n), the scalar rotational strength can be calculated from the residue of the linear response function corresponding to the electric dipole–magnetic dipole polarizability tensor  . In the length-gauge (LG) formalism the residue is given by eqn (1),
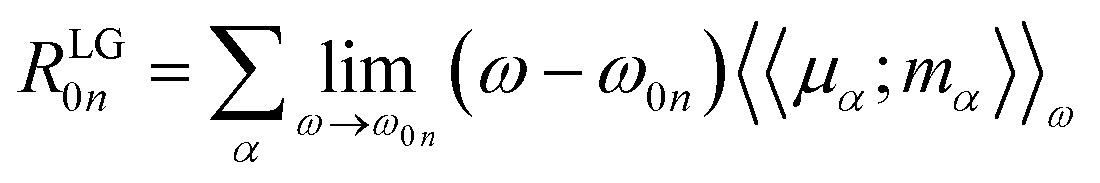 | (1) |
 | ||
| Fig. 4 TD-DFT (CAM-B3LYP)/3-21G ECD spectra and the calculated electron density differences for the main transitions for a 10-mer (a and b) and a 12-mer (c and d). (e) Experimental ECD spectra obtained for a short oligomer and a polymer like those already explained. The half width at half height equals 25 nm. | ||
Hence, the ECD spectrum of a PDPA is governed by helix 1 (short oligomers) or helix 2 (polymers), depending on the DP of the PDPA, which produces opposite ECD signals for the same helical scaffold. For instance, a P/M/M (helix 1/helix 2/helix 3) helical scaffold will produce a positive ECD spectrum for short oligomers, while negative ECD spectra will be obtained for larger polymeric structures.
In conclusion, it has been demonstrated experimentally and theoretically that the sign of the ECD spectra of PDPAs depends on their length. Thus, while short oligomers of poly-(1–3) produce positive ECD spectra in DMF, larger polymers generate negative ECD spectra. These opposite ECD traces are not related to the opposite helical senses induced in the PDPA by the polymer size, but rather are caused by the different contributions of the functional groups in the polymers of different sizes. Thus, whereas in short oligomers, the ECD trace is dominated by the polyene backbone (helix 1), in larger polymers, the ECD trace is dominated by the helix described by the phenyl rings of the PDPA (helix 2). As known from previous studies, helix 1 and helix 2 rotate in opposite directions, and therefore the ECD traces generated by these two helices have opposite signs.33
As a result, a single scaffold will present two opposite ECD traces for different DPs of the PDPA. Thus, on the one hand, a P/M/M (helix 1/helix 2/helix 3) scaffold will produce positive ECD spectra for short oligomers, and negative spectra for larger polymeric structures. On the other hand, an M/P/P (helix 1/helix 2/helix 3) scaffold will give negative ECD spectra for short oligomers, and they will be positive for larger polymers.
Author contributions
F. F. designed the study. J. J. T. synthesized and characterised the polymers. B. F. performed the theoretical calculations. All authors contributed to discussion of results and wrote the manuscript. F. F. and E. Q. supervised the project.Conflicts of interest
There are no conflicts to declare.Acknowledgements
We are thankful for financial support from AEI (PID2019-109733GB-I00), Ministerio de Ciencia e Innovación (PID2019-107307RB-100 and PID2020-117605GB-100). Xunta de Galicia (ED431C 2022/21, Centro Singular de Investigación de Galicia acreditación 2019-2022, ED431G 2019/03), and the European Regional Development Fund (ERDF) and is gratefully acknowledged. We are also thankful for the financial support of the EU Doctoral Network PHYMOL 101073474 (project call reference no. HORIZON-MSCA-2021-DN-01) and of the COST Action No. CA21101 COSY supported by COST (European Cooperation in Science and Technology). J. J. T. thanks MICINN for a FPU contract. We acknowledge CESGA for computational time.Notes and references
- E. Yashima, K. Maeda, H. Iida, Y. Furusho and K. Nagai, Chem. Rev., 2009, 109, 6102–62111 CrossRef CAS PubMed.
- M. Milton, R. Deng, A. Mann, C. Wang, D. Tang and M. Weck, Acc. Chem. Res., 2021, 54, 2397–2408 CrossRef CAS PubMed.
- E. Yashima, N. Ousaka, D. Taura, K. Shimomura, T. Ijai and K. Maeda, Chem. Rev., 2016, 116, 13752–13990 CrossRef CAS PubMed.
- J. G. Rudick and V. Perce, Acc. Chem. Res., 2008, 41, 1641–1652 CrossRef CAS PubMed.
- E. Yashima, K. Maeda and Y. Furusho, Acc. Chem. Res., 2008, 41, 1166–1180 CrossRef CAS PubMed.
- N. Liu, L. Zhou and Z. Q. Wu, Acc. Chem. Res., 2021, 54, 3953–3967 CrossRef CAS PubMed.
- L. Zhou, X. H. Xu, Z. Q. Jiang, L. Xu, B. F. Chu, N. Liu and Z. Q. Wu, Angew. Chem., Int. Ed., 2021, 60, 806–812 CrossRef CAS PubMed.
- G. Zhang, X. Cheng, Y. Wang and W. Zhang, Aggregate, 2023, 4, e262 CAS.
- X.-X. Cheng, T.-F. Miao, L. Yin, W. Zhang and X.-L. Zhu, Chin. J. Polym. Sci., 2021, 39, 1357–1375 CrossRef CAS.
- E. Anger, H. Iida, T. Yamaguchi, K. Hayashi, D. Kumano, J. Crassous, N. Vanthuyne, C. Roussel and E. Yashima, Polym. Chem., 2014, 5, 4909–4914 RSC.
- M. Ando, R. Ishidate, T. Ikai, K. Maeda and E. Yashima, J. Polym. Sci., Part A: Polym. Chem., 2019, 57, 2481–2490 CrossRef CAS.
- C. Zhang, Y. Qiu, S. Bo, F. Wang, Y. Wang, L. Liu, Y. Zhou, H. Niu, H. Dong and T. Satoh, J. Polym. Sci., Part A: Polym. Chem., 2019, 57, 1024–1031 CrossRef CAS.
- R. P. Megens and G. Roelfes, Chem. – Eur. J., 2011, 17, 8514–8523 CrossRef CAS PubMed.
- S. Ikeda, R. Takeda, T. Fujie, N. Ariki, Y. Nagata and M. Suginome, Chem. Sci., 2021, 12, 8811–8816 RSC.
- Y. Nagata, R. Takeda and M. Suginome, ACS Cent. Sci., 2019, 5, 1235–1240 CrossRef CAS PubMed.
- T. Ikai, M. Ando, M. Ito, R. Ishidate, N. Suzuki, K. Maeda and E. Yashima, J. Am. Chem. Soc., 2021, 143, 12725–12735 CrossRef CAS PubMed.
- R. Ishidate, T. Sato, T. Ikai, S. Kanoh, E. Yashima and K. Maeda, Polym. Chem., 2019, 10, 6260–6268 RSC.
- D. Hirose, A. Isobe, E. Quiñoá, F. Freire and K. Maeda, J. Am. Chem. Soc., 2019, 141, 8592–8598 CrossRef CAS PubMed.
- J. Shen and Y. Okamoto, Chem. Rev., 2016, 116, 1094–1138 CrossRef CAS PubMed.
- K. Shimomura, T. Ikai, S. Kanoh, E. Yashima and K. Maeda, Nat. Chem., 2014, 6, 429–434 CrossRef CAS PubMed.
- Y. Deng, M. Wang, Y. Zhuang, S. Liu, W. Huang and Q. Zhao, Light: Sci. Appl., 2021, 10, 1–18 CrossRef PubMed.
- H. Tanaka, Y. Inoue and T. Mori, ChemPhotoChem, 2018, 2, 386–402 CrossRef CAS.
- S. Wang, D. Hu, X. Guan, S. Cai, G. Shi, Z. Shuai, J. Zhang, Q. Peng and X. Wan, Angew. Chem., Int. Ed., 2021, 60, 21918–21926 CrossRef CAS PubMed.
- G. Zhang, Y. Bao, M. Pan, N. Wang, X. Cheng and W. Zhang, Sci. China: Chem., 2023, 66, 1169–1178 CrossRef CAS.
- Y. Bao, G. Zhang, N. Wang, M. Pan and W. Zhang, J. Mater. Chem. C, 2023, 11, 2475–2479 RSC.
- F. Rey-Tarrío, R. Rodríguez, E. Quiñoá, R. Riguera and F. Freire, Angew. Chem., Int. Ed., 2021, 60, 8095–8103 CrossRef PubMed.
- C. I. Simionescu and V. Percec, Prog. Polym. Sci., 1982, 8, 133–214 CrossRef CAS.
- A. Motoshige, Y. Mawatari, Y. Yoshida, R. Motoshige and M. Tabata, Polym. Chem., 2014, 5, 971–978 RSC.
- Y. Yoshida, Y. Mawatari, A. Motoshige, R. Motoshige, T. Hiraoki, M. Wagner, K. Müllen and M. Tabata, J. Am. Chem. Soc., 2013, 135, 4110–4116 CrossRef CAS PubMed.
- A. Motoshige, Y. Mawatari, R. Motoshige, Y. Yoshida and M. Tabata, J. Polym. Sci., Part A: Polym. Chem., 2013, 51, 5177–5183 CrossRef CAS.
- R. Rodríguez, E. Quiñoá, R. Riguera and F. Freire, J. Am. Chem. Soc., 2016, 138, 9620–9628 CrossRef PubMed.
- K. Maeda, M. Nozaki, K. Hashimoto, K. Shimomura, D. Hirose, T. Nishimura, G. Watanabe and E. Yashima, J. Am. Chem. Soc., 2020, 142, 7668–7682 CrossRef CAS PubMed.
- J. J. Tarrío, R. Rodríguez, B. Fernández, E. Quiñoá and F. Freire, Angew. Chem., Int. Ed., 2022, 61, e202115070 Search PubMed.
- S. Sueyoshi, T. Taniguchi, S. Tanaka, H. Asakawa, T. Nishimura and K. Maeda, J. Am. Chem. Soc., 2021, 143, 16136–16146 CrossRef CAS PubMed.
- A. Yurtsever, S. Das, T. Nishimura, R. Rodríguez, D. Hirose, K. Miyata, A. Sumino, T. Fukuma and K. Maeda, Chem. Commun., 2021, 57, 12266–12269 RSC.
- K. Maeda, D. Hirose, M. Nozaki, Y. Shimizu, T. Mori, K. Yamanaka, K. Ogino, T. Nishimura, T. Taniguchi, M. Moro and E. Yashima, Sci. Adv., 2021, 7, eabg5381 CrossRef PubMed.
- M. Núñez-Martínez, S. Arias, E. Quiñoá, R. Riguera and F. Freire, Chem. Mater., 2021, 33, 4805–4812 CrossRef.
- C. Zhao, S. Sun, W. L. Tong and M. C. W. Chan, Macromolecules, 2017, 50, 6896–6902 CrossRef CAS.
- R. Rodríguez, E. Suarez-Picado, E. Quiñoá, R. Riguera and F. Freire, Angew. Chem., Int. Ed., 2020, 59, 8616–8622 CrossRef PubMed.
- M. Alzubi, S. Arias, R. Rodríguez, E. Quiñoá, R. Riguera and F. Freire, Angew. Chem., Int. Ed., 2020, 59, 13365–13369 Search PubMed.
- E. Suarez-Picado, E. Quiñoá, R. Riguera and F. Freire, Angew. Chem., Int. Ed., 2020, 59, 4537–4543 CrossRef CAS PubMed.
- M. Núñez-Martínez, S. Arias, J. Bergueiro, E. Quiñoá, R. Riguera and F. Freire, Macromol. Rapid Commun., 2021, 43, 2100616 CrossRef PubMed.
- L. E. MacKenzie and R. Pal, Nat. Rev. Chem., 2021, 5, 109–124 CrossRef CAS PubMed.
- K. Dhbaibi, L. Abella, S. Meunier-Della-Gatta, T. Roisnel, N. Vanthuyne, B. Jamoussi, G. Pieters, B. Racine, E. Quesnel, J. Autschbach, J. Crassous and L. Favereau, Chem. Sci., 2021, 12, 5522–5533 RSC.
- B. Fernández, R. Rodríguez, A. Rizzo, E. Quiñoá, R. Riguera and F. Freire, Angew. Chem., Int. Ed., 2018, 57, 3666–3670 CrossRef PubMed.
- Y. Nagata, T. Nishikawa, K. Terao, H. Hasegawa and M. Suginome, J. Polym. Sci., Part A: Polym. Chem., 2019, 57, 260–263 CrossRef CAS.
- H. Onouchi, K. Okoshi, T. Kajitani, S. I. Sakurai, K. Nagai, J. Kumaki, K. Onitsuka and E. Yashima, J. Am. Chem. Soc., 2008, 130, 229–236 CrossRef CAS PubMed.
- X. A. Zhang, A. Qin, L. Tong, H. Zhao, Q. Zhao, J. Z. Sun and B. Z. Tang, ACS Macro Lett., 2012, 1, 75–79 CrossRef CAS PubMed.
- W. Z. Yuan, A. Qin, J. W. Lam, J. Z. Sun, Y. Dong, M. Häussler, J. Liu, H. P. Xu, Q. Zheng and B. Z. Tang, Macromolecules, 2007, 40, 3159–3166 CrossRef CAS.
- S. Wang, S. Xie, H. Zeng, H. Du, J. Zhang and X. Wan, Angew. Chem., Int. Ed., 2022, 61, e202202268 CAS.
- H. E. Schaffer, R. R. Chance, R. J. Silbey, K. Knoll and R. R. Schrock, J. Chem. Phys., 1991, 94, 4161–4170 CrossRef CAS.
- E. Runge and E. K. U. Gross, Phys. Rev. Lett., 1984, 52, 997–1000 CrossRef CAS.
- Y. Yanai, D. P. Tew and N. C. Handy, Chem. Phys. Lett., 2004, 393, 51–57 CrossRef.
- J. S. Binkley, J. A. Pople and W. J. Hehre, J. Am. Chem. Soc., 1980, 102, 939–947 CrossRef CAS.
- B. Fernández, R. Rodríguez, E. Quiñoá, R. Riguera and F. Freire, ACS Omega, 2019, 4, 5233–5240 CrossRef PubMed.
- A. Rizzo, S. Coriani and K. Ruud, Computational Strategies for Spectroscopy. From Small Molecules to Nano Systems, ed. V. Barone, John Wiley & Sons, New Jersey, 2012, pp. 77–136 Search PubMed.
Footnote |
| † Electronic supplementary information (ESI) available. See DOI: https://doi.org/10.1039/d3tc01419c |
| This journal is © The Royal Society of Chemistry 2023 |