DOI:
10.1039/D1YA00059D
(Paper)
Energy Adv., 2022,
1, 87-98
A sulfonated polyethylene–styrene cation exchange membrane: a potential separator material in vanadium redox flow battery applications
Received
23rd November 2021
, Accepted 13th January 2022
First published on 15th January 2022
Abstract
We report on the synthesis and characterization of a polyethylene–styrene–divinylbenzene-based interpolymer cation exchange membrane (ICEM) and its applicability as a separator in a vanadium redox flow battery (VRFB). The ICEM preparation involved radical co-polymerization of styrene–divinylbenzene in molten polyethylene and then blow film extrusion and sulfonation using chlorosulfonic acid. The crossover of vanadium ions across ICEM was studied in a charge balanced two-compartment cell and its efficacy was comparable to that of Nafion®117. Further study evaluated the chemical, dimensional, and mechanical stability in a highly oxidative environment of 2.1 M H2SO4 and 1.6 M VO2+ ions over 30 days at 50 °C. The VRFB performance exhibited 95% Coulombic, 63% energy, and 67% voltage efficiencies at 140 mA cm−2 over 100 charge/discharge cycles. The polarization curve indicated an operational power density of 310 W cm−2 at a limiting current density of 350 mA cm−2, revealing a low membrane resistivity. An asymmetric flow battery was set up to overcome VRFB capacity fading and operated at 100 mA cm−2. The study demonstrated the superiority of ICEM over Nafion®117 in terms of self-discharge and capacity retention under identical operational conditions. The findings of this study indicated long-term operational stability of ICEM and suitability in VRFB applications.
1. Introduction
The concept of a redox flow battery or cell was first floated in the science fraternity in the middle of the 20th century. The earliest experimental work reports the redox chemistry of iron and chromium, first demonstrated by Thaller in NSA's Lawrence laboratory.1,2 The poor electrochemical behaviour of chromium was enhanced by using a gold/lead combination electrocatalyst.3 The use of titanium as a substitute for chromium was also experimentally demonstrated.4 As the electroactive species were different in both the compartments, the major hurdle faced was the crossover of electroactive species, which led to the cross-contamination of electrolytes and hence reduced the life of the battery. In the decade of 1970–1980, vanadium and its compounds in various oxidation states were discovered to be useful as electroactive species for redox flow batteries.5 Vanadium ions of lower oxidation state V2+/V3+ formed the negative compartment whereas V4+/V5+ were employed in the positive compartment of the battery. As the system comprises a single element with variable oxidation states, cross mixing of vanadium species can be resolved by simply remixing the electrolytes or converting them to a desirable oxidation state by electrolysis.6
Maria Skyllas-Kazacos and co-workers pioneered the first commercial development of a vanadium redox flow battery in the University of New South Wales (UNSW, Australia) in the mid-1980's.7–10 The battery consists of three major components; electrodes, soluble redox couples, and an ion-selective separator (ion exchange membranes (IEMs)).11 The role of the separator is to depreciate the mixing of electrolytes, avoid electrode short-circuiting, and maintain charge neutrality in the system.12 Cation exchange membranes (CEMs) are the most preferred separator for VRFBs due to their high ionic conductivity. They allow the passage of vanadium ions and protons through them. But in the battery operation, the passage of vanadium ions cross-contaminates the electrolyte and hence reduces the specific capacity of the battery. The anion exchange membranes (AEMs),13–15 which carry positive charge, were also reported to reduce the cross-contamination by the hypothesis of Donnan exclusion of the positive ions. Though, practically, AEMs could not block the passage of vanadium ions; there will always be leakage of vanadium ions because of poor membrane charge density, low ionic conductivity,16 and questionable chemical stability.
Perfluoroalkyl sulfonic acid membranes like Nafion® are the most preferred separator for VRFBs because of their excellent chemical stability, ion selectivity, and conductivity exerted by locally aligned well-defined ion-conducting channels.17,18 But they also suffer from the disadvantages of high vanadium ion crossover and electroosmotic flux. However, these issues were tried to be addressed by surface modification19–21 and use of inorganic/organic fillers.22–26 Some fruitful results were reported by these strategies; the cost of pristine Nafion® membranes is a serious concern in large-scale commercialization. Hence, the need for a low cost, high ion-selective, and high conducting ion exchange membrane with thermal, dimensional, and chemical stability has ignited a spark in the membrane research community to develop novel polymer materials that reach the standard of a VRFB separator.
Tremendous research has been carried out seeking an ideal separator for VRFBs. Chemically stable thermoplastic engineering polymers have attracted much attention. Engineered polymers such as poly(arylene ether), poly(fluorenyl ether), poly(ether ether ketone), poly(ether sulfone), poly-sulfone, poly(phthalazinone ether ketone), poly-imide, poly(phenylene oxide), poly(phthalazinone ether ketone ketone), poly(tetramethydiphenyl ether ether ketone), cardo-poly(ether ketone) etc.27–30 are used as polymer backbones for VRFB applications. The functionalization of these polymers can be tuned accordingly to synthesize CEMs or AEMs. In the case of CEMs, controlled sulfonation of polymers is a challenging task, as excess sulfonation negatively affects the dimensional stability of the polymers, whereas inadequate sulfonation fails to provide the significant electrochemical properties of the membranes.31 Sulfonated polyimides (SPI), which are considered to have better proton selectivity as compared to commercial Nafion® membranes, suffer from poor chemical stability,32 though the introduction of trifluoromethyl groups into sulfonated polyimide was found to significantly improve their chemical stability and VRFB performance.33 Sulfonated poly-sulfone34 undergoes chemical and mechanical degradation during long-term operation in a VRFB. A new class of aromatic heterocyclic polymer containing imidazole and benzimidazole groups was recently reported.35,36 Ding et al.37 synthesized a series of sulfonated polybenzimidazole (SPBI) membranes with different sulfonation degrees to enhance the proton transport; their VRFB performance was compared with that of the commercial Nafion® membrane. It should be noted that all the above-mentioned membranes are obtained via the solvent evaporation/solution casting method. This method involves the use of a very high quantity of carcinogenic organic solvents that directly affect the living and non-living components of ecosystems. The membranes also suffer from the formation of micro voids generated by slow evaporation of the solvent. These micro voids will destructively impact the electrochemical performance and permeability of ions.38 Also, it is very difficult to obtain an ideal dense membrane by the solvent casting method. IEMs produced via melt-processing or extrusion have been observed to have reduced in-plane swelling, and commendable dimensional and mechanical properties, and are thought to be perfectly dense membranes. It has been experimentally supported that the melt-processing method reinforces the polymers by chain orientation at the molecular level and provides sufficient mechanical and chemical durability without compromising the electrochemical properties by locally aligned ion-conducting channels or functional groups.39 Souad Mbarek et al.40 illustrated an enhancement of the conductivity and mechanical properties for the extruded Nafion and Aquivion membranes. There are also other reports claiming better chemical and mechanical properties of the extruded membranes than those of the solution-cast membranes.41–43 The method has the advantage of precise control over the thickness and width of the membranes by using a die associated with an extruder. It is the best technology available for mass production of homogeneous thin polymer films at low cost, dodging the safety and environmental concerns related to the bulk production of membranes by solution casting.
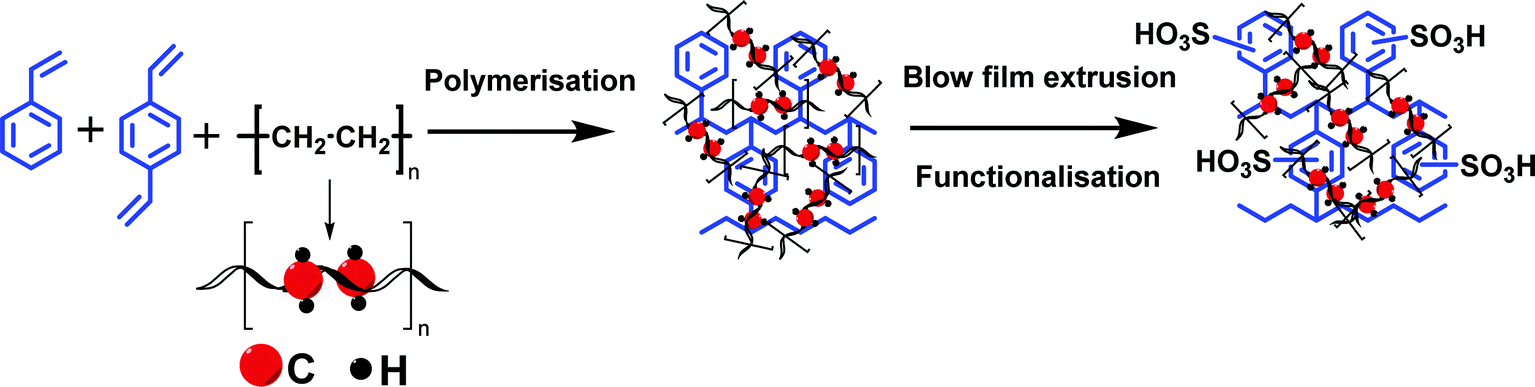
Herein we are report a blown film-extruded dense cation exchange membrane from polyethlene–styrene–divinylbenzene and its best suitable application in a VRFB. Polyethylene (PE) is one of the cheapest polymer commodities available in the market. It has demonstrated excellent chemical stability and mechanical strength due to its carbon–carbon covalent bond.44 With very limited reports45 on its use in the preparation of ion-exchange membranes and their applications, we have hybridized herein the ease of chemical modification of polystyrene and chemical and mechanical stability of polyethylene to synthesize an interpolymer cation exchange membrane. It was prepared by co-polymerizing styrene–divinylbenzene in polyethylene melt followed by sulfonation. The detailed chemical stability has been evaluated to check its applicability under the highly oxidizing environment of a VRFB. The electrochemical and physicochemical properties, along with the VRFB performance, are reported and compared with those of Nafion® 117.
2. Experimental
2.1 Materials
Polyethylene (HDPE and LDPE) granules were purchased from Reliance Industries Ltd, India. Styrene, divinylbenzene, and benzoyl peroxide were obtained from Tokyo Chemical Industry (India) Pvt. Ltd. Chlorosulfonic acid, toluene, xylene, and 1,2-dichloroethane were supplied by Finar limited. Vanadium(III) chloride, vanadium(III) sulfate, vanadium(IV) sulfate oxide hydrate, and vanadium oxychloride were procured from Alfa Aesar.
2.2 Synthesis of the interpolymer cation exchange membrane (ICEM)
A mixture of HDPE and LDPE in the ratio of 80![[thin space (1/6-em)]](https://www.rsc.org/images/entities/char_2009.gif) :20 was melted at 150 °C in xylene, followed by the addition of toluene to maintain the temperature of the solution. Separately, a mixture of styrene, divinylbenzene, and 4% benzoyl peroxide in toluene was prepared, and the ratio of styrene to divinylbenzene was 1:0.00075. The resulting mixture was added dropwise to molten polyethylene with continuous stirring and by maintaining the required temperature. The reaction was carried out for 6 h. The solution was cooled to obtain the polymer. The membrane was made by blown film extrusion and sulfonated with 10% chlorosulfonic acid in dichloroethane for 4 h. After thorough washing with water, the membrane was stored in saline water.
:20 was melted at 150 °C in xylene, followed by the addition of toluene to maintain the temperature of the solution. Separately, a mixture of styrene, divinylbenzene, and 4% benzoyl peroxide in toluene was prepared, and the ratio of styrene to divinylbenzene was 1:0.00075. The resulting mixture was added dropwise to molten polyethylene with continuous stirring and by maintaining the required temperature. The reaction was carried out for 6 h. The solution was cooled to obtain the polymer. The membrane was made by blown film extrusion and sulfonated with 10% chlorosulfonic acid in dichloroethane for 4 h. After thorough washing with water, the membrane was stored in saline water.
2.3 Characterization
Water uptake of the membranes was measured by a gravimetric method. A 2 × 2 cm piece of membrane was dipped in de-ionized (DI) water for 24 h. Thereafter, the membrane piece was taken out from the DI water and gently wiped with tissue paper to remove the excess surface adhered water and its wet weight was measured. The same membrane piece was then dried in an oven at 60 °C for 24 h and the dry weight was measured. By knowing the dry and wet weights, water uptake was calculated using eqn (1).| | 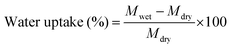 | (1) |
Ion exchange capacity (IEC) was calculated by classical acid–base titration. A 2 × 2 cm piece of membrane was dipped in 1 M HCl solution for 24 h to convert the membrane to the protonated form. The membrane was thoroughly washed with DI water to remove excess acid from the membrane surface. Then, it was immersed in 100 mL of 1 M NaCl for 24 h at room temperature to convert the membrane to sodium form. In the process, the released protons were titrated against 0.001 M NaOH solution using phenolphthalein as an indicator. The amount of base consumed was used to calculate IEC using eqn (2). Here, CNaOH is the concentration and VNaOH is the volume of NaOH consumed. Mdry is the dry weight of the membrane employed for IEC evaluation.
| |  | (2) |
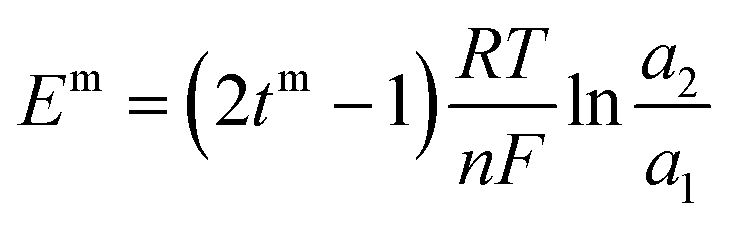
Transport number was calculated by the membrane potential method. In a two-compartment cell, electrolyte solutions of different concentrations were separated by the membrane. The solutions in both the compartments were continuously stirred to compensate the concentration polarization effect. Potential developed across the membrane was measured using a multimeter and used to calculate the transport number using eqn (3). Em is the membrane potential; tm is the transport number of the counter ion in the membrane phase; R, gas constant; T, temperature; F, Faraday constant; n, charge of the counter ion; and a1 and a2 are the activities of the electrolyte solutions.
| |  | (3) |
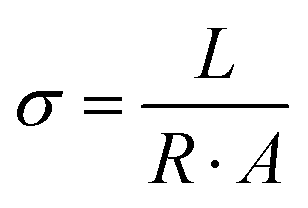
Conductivity of the membranes was recorded on a BT-112 conductivity cell (Scribner Associated, Inc.), by recording the impedance with the help of a CHI 700E potentiostat. To record the impedance, the membrane was incorporated into a conductivity cell and the cell was dipped in DI water. Frequency range from 1 Hz to 0.1 MHz was set with amplitude 5 mV in the potentiostat. The thickness of the membrane was measured using a screw gauge. Using eqn (4) the conductivity of the membrane was measured. In eqn (4), σ is the conductivity (S cm−1), L denotes the distance between the electrodes used (cm), R (Ω) is the measured impedance of the membrane and A (cm2) is the surface area of the membrane.
| |  | (4) |
The attenuated total reflectance Fourier-transform infrared (ATR-FTIR) spectra of the membrane were recorded on a spectrophotometer (Agilent Technologies, Cary 600 series). The spectra were recorded in the range of 4000–400 cm−1. The surface morphology was visualized using a field emission scanning electron microscope (JSM-7100F, Japan). A NETZSCH TG 209F1 Libra instrument was used to obtain TGA spectra of the membrane at a scan rate of 5 °C min−1 and a temperature range from 30 °C to 800 °C. Tensile strength and elongation at break for the membrane were measured using a universal testing machine (UTM) (Zwick Roell BT-FR 2.5TH 40).
Vanadium permeability across the membrane was obtained using a two-compartment permeability cell. The charge neutrality in the system was maintained by following the procedure reported in the literature.46 The solutions in both compartments were subjected to constant stirring throughout the experiment to minimize the concentration polarization effect. The permeability experiments were performed for 24 h for all the vanadium ions. A new piece of the membrane was incorporated for every vanadium ion permeability study. The samples were withdrawn from both the compartments at regular intervals and analyzed using inductively coupled plasma (ICP). The permeability (k/L) was calculated by using eqn (5).46
| |  | (5) |
where
CD0 is the initial concentration of vanadium ions in the depletion compartment (mol L
−1),
CE is the concentration of vanadium ions contained in the enrichment compartment (mol L
−1),
A is the exposed area of the membrane (dm
2),
V is the volume of the compartment (dm
3),
L is the thickness of the membrane (dm),
k/
L is termed as the permeability (dm s
−1), and
t is the time duration of the experiment (s). A plot ln(
CD0 −
CE)
vs. t should give a straight line with a slope equal to

. The permeability rate

(dm s
−1) was calculated from the slope of the line.
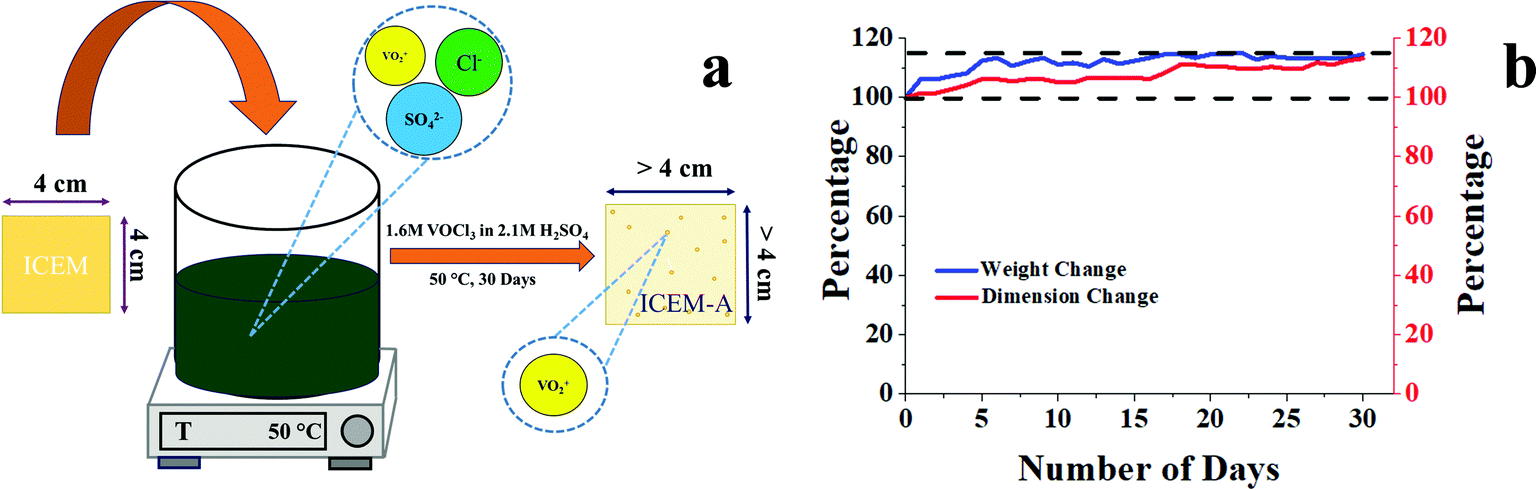
To study the chemical stability of ICEM, a 4 × 4 cm piece of ICEM was weighed and immersed in a highly oxidative solution consisting of 1.6 M VOCl3 in 2.1 M H2SO4 at 50 °C. The immersed piece of the membrane was labelled as ICEM-A. The weight and dimensions of ICEM-A were recorded every 24 h, after a gentle wipe-off, to remove excess surface solution. The data were collected over 30 days. The stability of the membrane was determined by a change in weight and dimension of the membrane as a function of time.
Battery analysis of ICEM and Nafion® 117 were performed on a commercial redox flow battery provided by Research Supporters India (RSI) with an effective cell area of 25 cm2. The battery performance was analyzed using a battery tester provided by Batsol Neware. A symmetric flow battery was set up with the concentrations of the vanadium ions in both compartments being 0.5 M in 2 M H2SO4, i.e., posolyte (0.5 M VO2+ in 50 mL of 2 M H2SO4) and negolyte (0.5 M V3+ in 50 mL of 2 M H2SO4). The experiments were performed at different current densities i.e. 20, 40, 60, 80, 100, 120, and 140 mA cm−2. The cycling stability of the membrane was evaluated by operating the symmetric VRFB at 140 mA cm−2 for 100 cycles with the concentrations of vanadium species in both the compartments being 1 M V3+/V4+ in 50 mL of 2 M H2SO4. An asymmetric flow battery with differential volumes of negolyte (1 M V3+ in 65 mL of 2 M H2SO4) and posolyte (1 M VO2+ in 50 mL of 2 M H2SO4) was operated at 100 mA cm−2 to overcome capacity fading. The open circuit potentials (OCVs) of the membranes were obtained straight after the asymmetric flow battery study by charging the battery until 1.6 V at 20 mA cm−2 and recording its self-discharge until the voltage reached 1.0 V. The polarization curve experiments were performed in 1 M vanadium electrolyte containing 2 M H2SO4. The cell was fully charged at 50 mA cm−2 current density and discharged at 25 mA cm−2 to 475 mA cm−2 current densities for a fixed time and the corresponding constant voltage recorded. Coloumbic efficiencies (CEs), voltage efficiencies (VEs) and energy efficiencies (EEs) were calculated as reported using eqn (6)–(8).29
| |  | (6) |
| |  | (7) |
| | | Energy efficiency (EE) = (CE × VE) × 100 | (8) |
3. Results and discussion
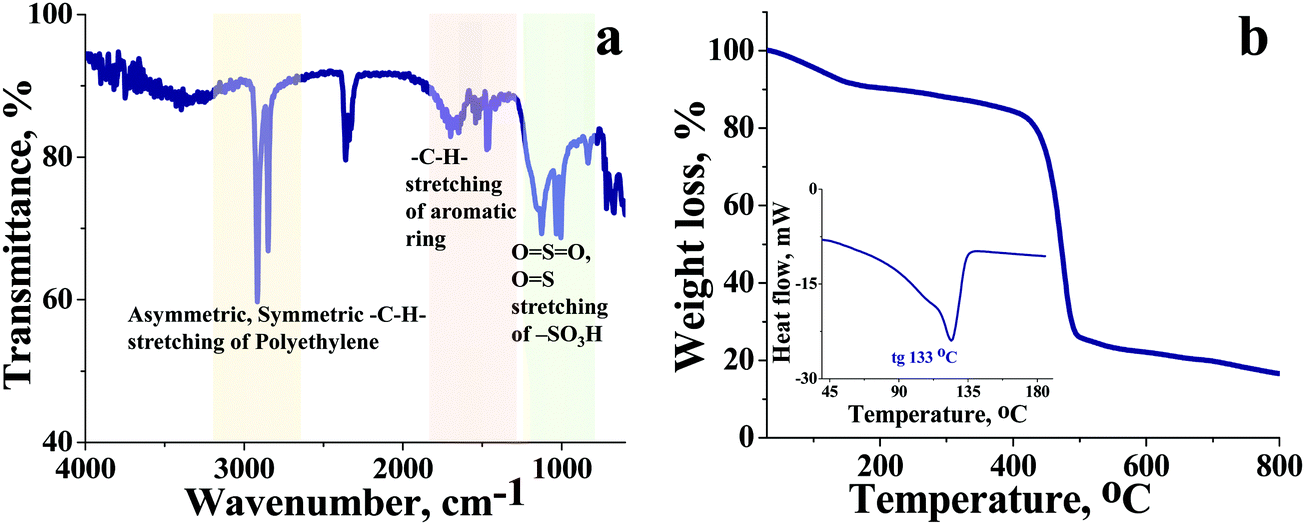
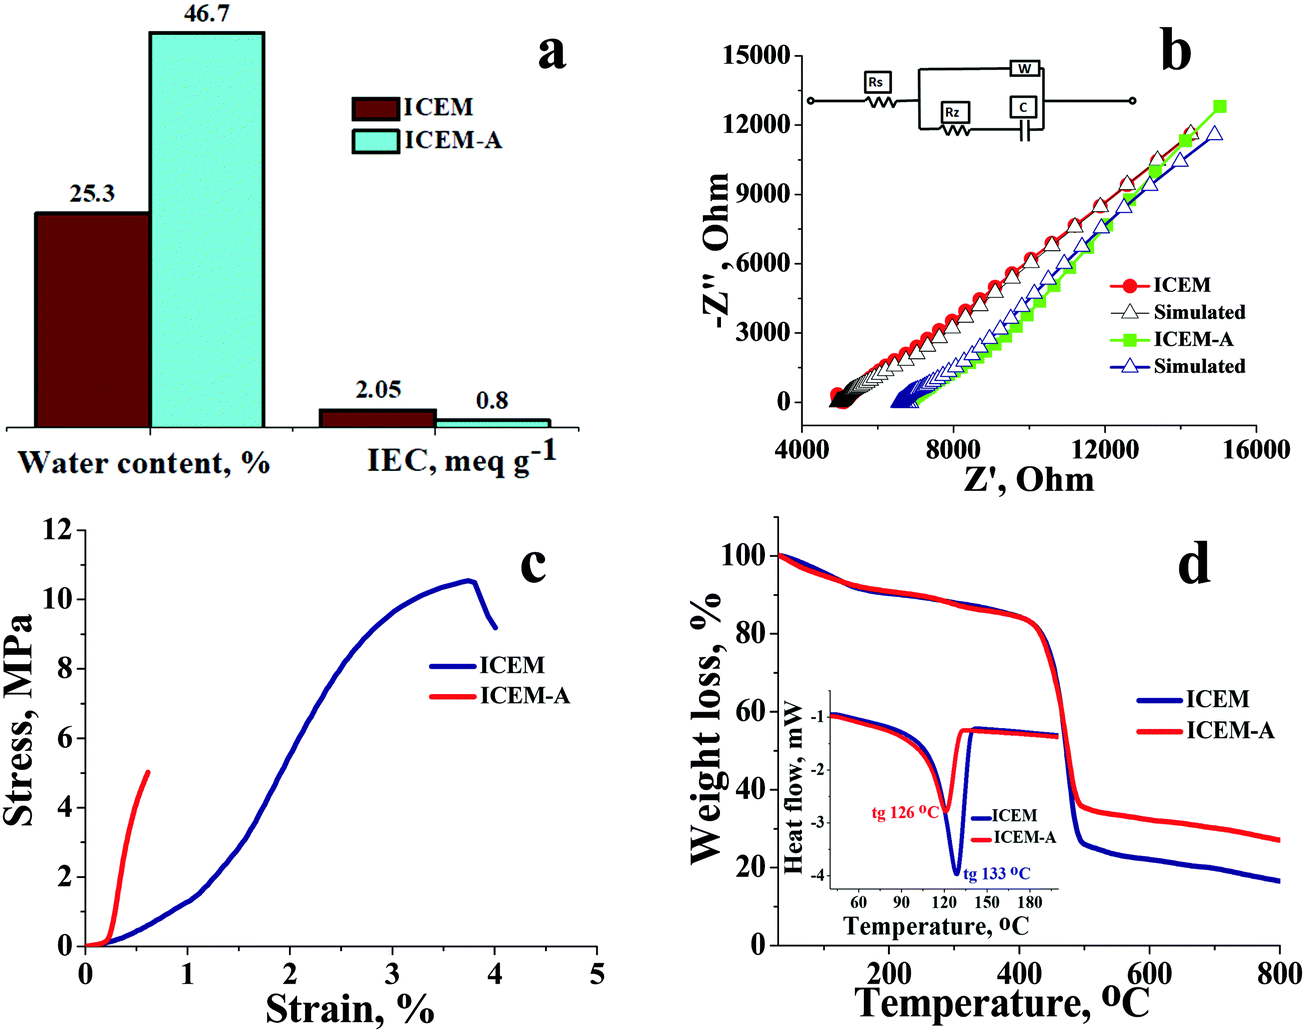
The high charge density, low ionic resistance, and chemical, and dimensional stability are basic factors that determine the usability of the ion exchange membrane in VRFB. We have synthesized a cation exchange membrane by hybridizing the meritorious chemical stability of polyethylene and ease of functionalization of styrene for the said applications. The blown film extrusion ensured the formation of a dense membrane, whereas sulfonation with chlorosulfonic acid ensured the selectivity and high charge density of the membrane (see Scheme 1). The ATR-FTIR spectrum (Fig. 1a) shows vibrational bands at 1702–1530 cm−1 and 1468 cm−1, which correspond to the C–H stretching of the aromatic styrene ring. The presence of intense bands in the wavelength region from 950 to 1100 cm−1 was attributed to O![[double bond, length as m-dash]](https://www.rsc.org/images/entities/char_e001.gif) SO symmetric stretching and OS stretching of the cationic functional group. Sharp absorption bands at 2920 cm−1 and 2854 cm−1 can be assigned to the asymmetric and symmetric C–H stretching of polyethylene. The presence of polyethylene in the membrane matrix raises the alarm of thermal stability. But it should be noted that the polystyrene and divinylbenzene components of the membrane can positively affect the melting and glass transition temperatures,47,48 which was evident from the recorded DSC (inset Fig. 1) of the membrane. The observed DSC temperature of the membrane was 133 °C, which is higher than the glass transition temperature of neat polyethylene. The recorded TGA (Fig. 1b) shows loss of chemically bound water molecules at 150 °C. The weight loss by functional group degradation was observed in the temperature range of 200–450 °C, whereas the significant weight loss above 450 °C can be ascribed to polymer backbone degradation. The developed membrane had excellent chemical stability necessary for VRFB applications. It was evaluated by immersing a 4 × 4 cm, known-weight piece of ICEM in a 2.1 M H2SO4 solution containing 1.6 M vanadium oxychloride at 50 °C over 30 days. The membrane piece under the chemical stability study was labelled as ICEM-A. Weight and dimensions of ICEM-A were recorded after every 24 h after gentle wipe-off, to remove the surface solution and plotted for several days (Fig. 2b). After 30 days, the water content, IEC, transport number, conductivity, and mechanical strength of ICEM-A were recorded and compared with those of ICEM. The graphical representation of the chemical stability study of ICEM is shown in Fig. 2a. As it can be observed from Fig. 2b, in the case of ICEM-A, there was a ∼12% increase in weight and dimensions over 30 days. This was caused by the adsorption or exchange of VO2+ ions with sulfonic acid of the membrane. Compared to a proton, the molecular weight of VO2+ is higher, certainly, and this is reflected in the increase in weight of the membrane immediately after its immersion or when we recorded it in the initial few days. A close look at Fig. 2b clearly shows a drastic increase in the weight for the initial few days and thereafter it remains constant. The observed change in dimensions was ∼12% after 30 days. It progressively increased over the 30 days by slow penetration of water molecules into the membrane matrix because of adsorbed or exchanged VO2+ ions. The adsorbed or exchanged VO2+ ions were so firm that sulfonic acid of the membrane did not participate in the measured IEC, which was measured by acid–base titration. The obtained IEC was 0.80 meq g−1 for ICEM-A, whereas the IEC of ICEM was 2.05 meq g−1. (Fig. 3a). But adsorption of VO2+ ions instigated an increase in the water content of the membrane. ICEM-A had 46.7% water content, whereas ICEM had 25.3% water content. The increase in water content and low dimensional stability resulted in reduced mechanical strength of the membrane, which was observed by subjecting the membranes to universal testing machine (UTM) analysis. The wet membranes were subjected to UTM analysis to obtain graphs of stress vs strain. As it can be observed from the graphs in Fig. 3c, the stress value of ICEM was ∼11 MPa, whereas the stress value of ICEM-A was ∼5 MPa. There was about a 50% reduction in the mechanical strength by adsorption of VO2+ ions in the membrane matrix. But compared to the literature28 known values, the strength of the membrane is good enough even after 30 days of rigorous chemical treatment for practical applications.
SO symmetric stretching and OS stretching of the cationic functional group. Sharp absorption bands at 2920 cm−1 and 2854 cm−1 can be assigned to the asymmetric and symmetric C–H stretching of polyethylene. The presence of polyethylene in the membrane matrix raises the alarm of thermal stability. But it should be noted that the polystyrene and divinylbenzene components of the membrane can positively affect the melting and glass transition temperatures,47,48 which was evident from the recorded DSC (inset Fig. 1) of the membrane. The observed DSC temperature of the membrane was 133 °C, which is higher than the glass transition temperature of neat polyethylene. The recorded TGA (Fig. 1b) shows loss of chemically bound water molecules at 150 °C. The weight loss by functional group degradation was observed in the temperature range of 200–450 °C, whereas the significant weight loss above 450 °C can be ascribed to polymer backbone degradation. The developed membrane had excellent chemical stability necessary for VRFB applications. It was evaluated by immersing a 4 × 4 cm, known-weight piece of ICEM in a 2.1 M H2SO4 solution containing 1.6 M vanadium oxychloride at 50 °C over 30 days. The membrane piece under the chemical stability study was labelled as ICEM-A. Weight and dimensions of ICEM-A were recorded after every 24 h after gentle wipe-off, to remove the surface solution and plotted for several days (Fig. 2b). After 30 days, the water content, IEC, transport number, conductivity, and mechanical strength of ICEM-A were recorded and compared with those of ICEM. The graphical representation of the chemical stability study of ICEM is shown in Fig. 2a. As it can be observed from Fig. 2b, in the case of ICEM-A, there was a ∼12% increase in weight and dimensions over 30 days. This was caused by the adsorption or exchange of VO2+ ions with sulfonic acid of the membrane. Compared to a proton, the molecular weight of VO2+ is higher, certainly, and this is reflected in the increase in weight of the membrane immediately after its immersion or when we recorded it in the initial few days. A close look at Fig. 2b clearly shows a drastic increase in the weight for the initial few days and thereafter it remains constant. The observed change in dimensions was ∼12% after 30 days. It progressively increased over the 30 days by slow penetration of water molecules into the membrane matrix because of adsorbed or exchanged VO2+ ions. The adsorbed or exchanged VO2+ ions were so firm that sulfonic acid of the membrane did not participate in the measured IEC, which was measured by acid–base titration. The obtained IEC was 0.80 meq g−1 for ICEM-A, whereas the IEC of ICEM was 2.05 meq g−1. (Fig. 3a). But adsorption of VO2+ ions instigated an increase in the water content of the membrane. ICEM-A had 46.7% water content, whereas ICEM had 25.3% water content. The increase in water content and low dimensional stability resulted in reduced mechanical strength of the membrane, which was observed by subjecting the membranes to universal testing machine (UTM) analysis. The wet membranes were subjected to UTM analysis to obtain graphs of stress vs strain. As it can be observed from the graphs in Fig. 3c, the stress value of ICEM was ∼11 MPa, whereas the stress value of ICEM-A was ∼5 MPa. There was about a 50% reduction in the mechanical strength by adsorption of VO2+ ions in the membrane matrix. But compared to the literature28 known values, the strength of the membrane is good enough even after 30 days of rigorous chemical treatment for practical applications.
 |
| | Scheme 1 Schematic for the synthesis of the interpolymer cation exchange membrane (ICEM). | |
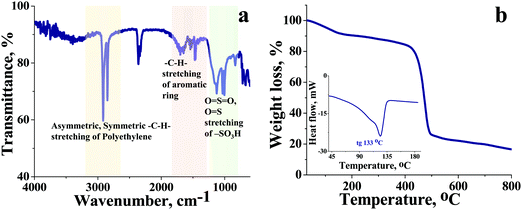 |
| | Fig. 1 (a) ATR-FTIR spectrum of ICEM, (b) TGA spectrum of ICEM (inset image: DSC spectrum of ICEM). | |
 |
| | Fig. 2 (a) Graphical illustration of the chemical stability study of ICEM; (b) weight and dimension change of ICEM-A with respect to time. | |
 |
| | Fig. 3 Comparative physicochemical and mechanical analysis of ICEM and ICEM-A. (a) Water content and IEC. (b) Impedance spectra with simulation with the circuit diagram as the inset figure. (c) Mechanical strength analysis and (d) TGA spectra with the inset image showing the DSC spectra. | |
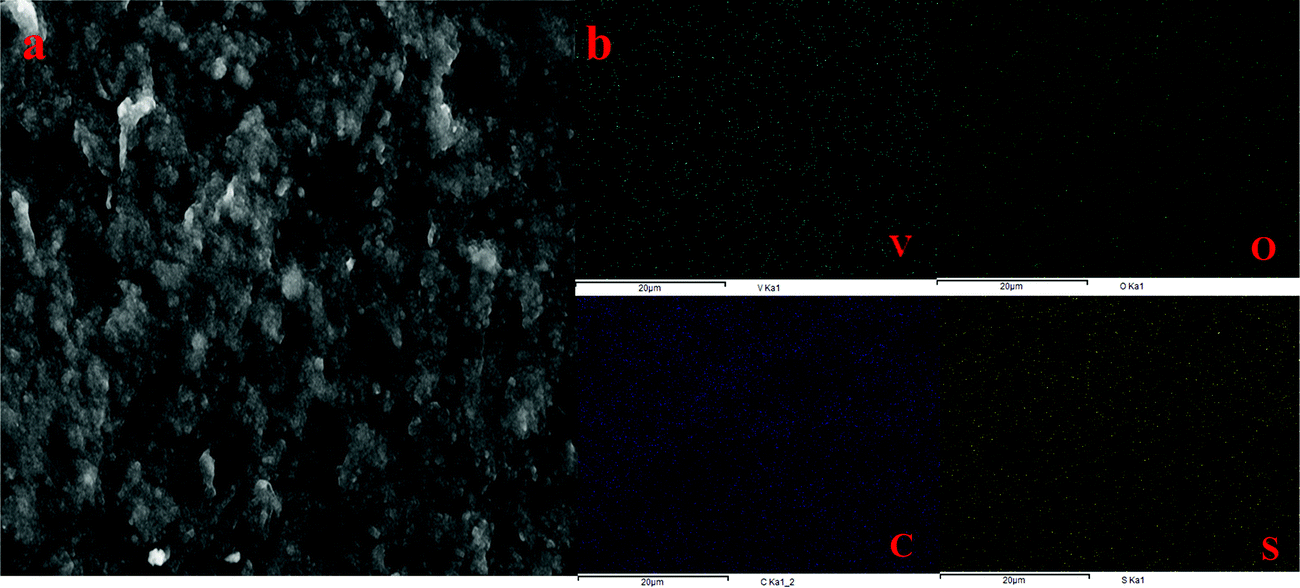
The presence of adsorbed VO2+ ions in the membrane matrix was observed by recording the SEM image (Fig. 4a) and its elemental mapping (Fig. 4b). The presence of a uniform distribution of vanadium confirms its adsorption. It was also supported by an increase in char yield of the membrane after TGA analysis. Fig. 3d shows the recorded TGA and DSC of the membrane before and after chemical treatment. From the figures, it was clear that the adsorbed vanadium ions resulted in the lesser compositional loss of ICEM-A as compared to ICEM with a marginal change in the glass transition temperature (inset Fig. 3d). Vanadium ion adsorption also affected other electrochemical properties, like the transport number and ionic conductivity of the membrane. The transport number of the membranes was calculated by the membrane potential method in a two-compartment cell using NaCl solution with the mean concentration of the system being 0.055 M. The obtained transport number of ICEM was 0.92 and that of ICEM-A was 0.80, indicating firm adsorption of VO2+ ions in the membrane matrix, but still, the ICEM-A membrane can transport 80% target ions in the presence of co-ions suggesting its best utility in VRFB applications. The calculated conductivity values suggest that ICEM-A had lower conductivity than ICEM (see Fig. 3b) but still the values are acceptable and the membrane can be used in VRFB applications. The calculated values of conductivity were 4.32 and 7.12 mS cm−1 for ICEM-A and ICEM, respectively. Under identical experimental conditions, the conductivity of Nafion® 117 was found to be 19.61 mS cm−1.
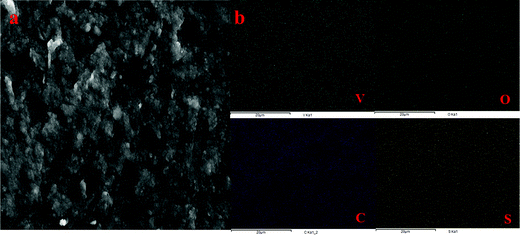 |
| | Fig. 4 (a) SEM image of ICEM-A and (b) corresponding elemental mapping of vanadium, oxygen, carbon and sulphur of ICEM-A. | |
3.1 Vanadium ion permeability study
The low permeability of vanadium ions across the membrane is one of the crucial parameters for the selection of ion exchange membrane. During long-term operation, vanadium ions diffuse through the membrane resulting in capacity fading. It is impossible to stop the crossover of vanadium species across the ion exchange membrane due to its smaller size and high mobility, but its diffusivity rate can be slowed down by compact and dense membranes. The ion permeability of VO2+, VO2+, and V3+ ions across ICEM was measured in a two-compartment cell. The compartment containing vanadium solution was labelled as the depletion compartment, while the compartment filled with blank solution was termed as the enrichment compartment. To maintain the charge neutrality, to prevent diffusion through the concentration gradient, and to minimize the solvent transfer and osmotic pressure effect, an appropriate concentration of the salt solution was added into the enrichment compartment as reported.46 The details of the salt concentration and corresponding vanadium ion oxidation state are presented below.
| V3+: 0.5 M V2(SO4)3 + 1.1 M H2SO4‖0.5 M Fe2(SO4)3 + 1.1 M H2SO4; |
| VO2+: 1 M VOSO4 + 1.6 M H2SO4‖1 M MgSO4 + 1.6 M H2SO4; |
| VO2+: 0.5 M (VO2)2SO4 + 2.1 M H2SO4‖0.5 M K2SO4 + 2.1 M H2SO4 |
Equalizing of the ionic strength in the system provided a fair assessment of the diffusivity rates of vanadium ions across the membrane. For comparison purposes under identical experimental conditions, a vanadium ion diffusion study of Nafion® 117 was also performed. The calculated permeability rate of different vanadium ions for ICEM and Nafion® 117 are presented in Table 1. The permeability rate of VO2+ was found to be the lowest, followed by those of VO2+ and V3+ for both ICEM and Nafion® 117. These results are in accordance with the valence states of the vanadium ions, as a higher valence state will have a larger attraction for the negatively charged polymer and hence lower permeability.49 The diffusion of VO2+ across ICEM can be explained based on the formation of the [VO(H2O)]2+ complex;50 the hydration shell of VO2+ may facilitate its diffusion across the ICEM. A similar explanation is valid for the diffusion of V3+ ions across the membrane by the formation of a [V(H2O)6]3+ hydrated complex in an acidic solution.51 Also, the neutral ion pair VOSO4 may experience negligible repulsion from the negatively charged matrix of ICEM and hence will diffuse across the membrane.52 From Table 1 it is clear that the permeability rates for all the vanadium ions are lower for ICEM as compared to Nafion® 117 under identical experimental conditions. These permeability results accompanied by excellent chemical stability as discussed in the previous section encourage the use of ICEM as a separator in VRFB applications.
Table 1 Vanadium ion permeability rates for ICEM and Nafion® 117
| Membranes |
V3+ permeability (dm s−1) |
VO2+ permeability (dm s−1) |
VO2+ permeability (dm s−1) |
| ICEM |
2.51 × 10⁻⁷ |
3.90 × 10⁻⁷ |
1.86 × 10⁻⁸ |
| Nafion®117 |
3.40 × 10⁻⁷ |
5.37 × 10⁻⁷ |
2.68 × 10⁻⁷ |
3.2 Vanadium redox flow battery performance
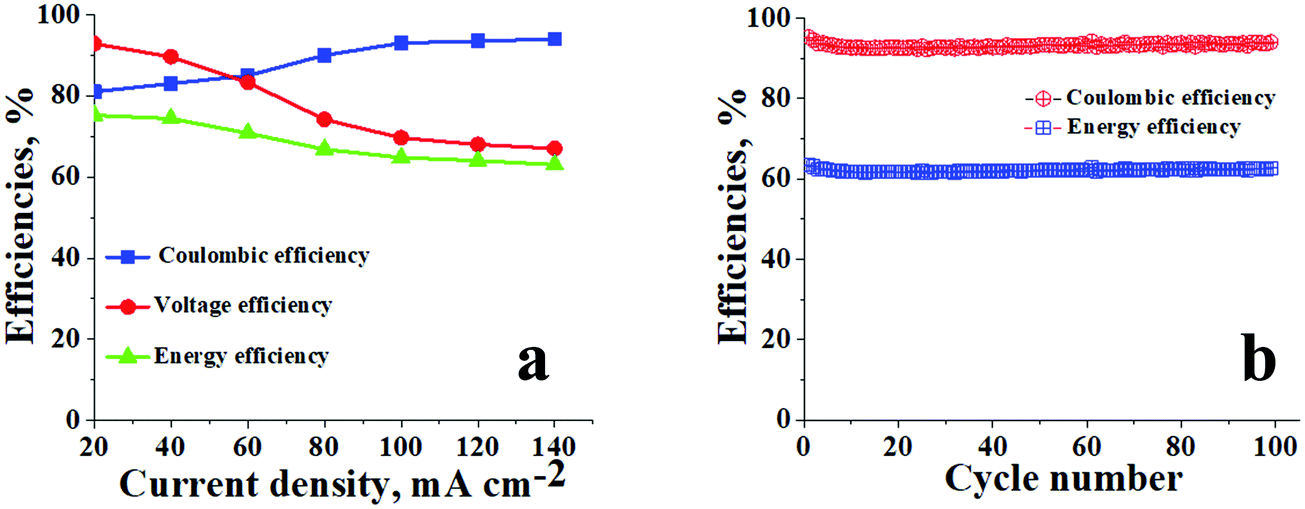
The blue blocks in Fig. 5a represent the average Coulombic efficiencies under different current densities. From eqn (6) it can be observed that CE is calculated by dividing battery discharge capacity (Qdischarge) by its charge capacity (Qcharge). Capacity Q is the product of constant current (mA cm−2) provided to the system and time which is required for the reduction or oxidation of redox-active species. The Coulombic efficiencies at 20, 40, 60, 80, 100, 120, and 140 mA cm−2 were 81, 83, 85, 90, 93, 93.5, and 95%, respectively. In an ideal scenario at constant current density, the time required for charging, i.e. conversion of V3+ → V2+ and VO2+ → VO2+, should be equal to the time required for discharging, i.e. conversion of V2+ → V3+ and VO2+ → VO2+. However, the ideal condition never happens due to irreversible cross-contamination of vanadium ions. This leads to side reactions mentioned in eqn (9)–(11),29 resulting in loss of redox-active species, which inherently affects the overall capacity and hence the Coulombic efficiency of the battery.
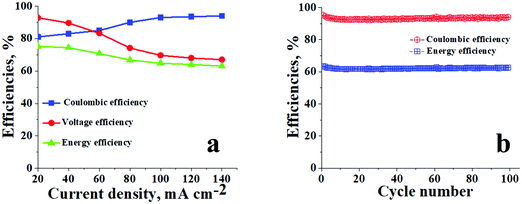 |
| | Fig. 5 Battery performance of ICEM. (a) CEs, VEs and EEs of ICEM at different current densities; (b) CEs and EEs of ICEM at 140 mA cm−2 over 100 cycles. | |
The red-coloured circles in Fig. 5a are representative of VEs at different current densities for ICEM. The calculated voltage efficiencies at 20, 40, 60, 80, 100, 120, and 140 mA cm−2 were 93, 90, 83, 74, 69, 68, and 67%, respectively. As eqn (7) shows VE can be obtained by dividing the mean discharge voltage (Vdischarge) of the battery by its mean charge voltage (Vcharge). The mean charge or discharge voltage of the system is the minimum potential required to bring out redox electrochemical reactions of vanadium ions in both the compartments, i.e. the average potentials required to convert V3+ → V2+ and VO2+ → VO2+ in charging and V2+ → V3+ and VO2+ → VO2+ in discharging. These are usually obtained from the linear parts of the charging/discharging curves. The VEs were found to be decreasing with increasing current densities (Fig. 5a). This was explained based on ohmic loss and evolution of oxygen and hydrogen on the corresponding electrodes.53 The ohmic loss is the product of the current density and internal resistance of the system. Thus, high VE can be obtained by reducing the resistance of the cell, including the membrane, electrolyte, electrodes, current collectors and interfacial resistance of the solid and liquid interface.
EEs for ICEM at different current densities are indicated by green triangles in Fig. 5a. EE is the product of VE and CE, and the energy loss associated with a charge–discharge system in a battery is monitored using EE. It is a crucial parameter to study an electrical energy storage system. The calculated energy efficiencies at 20, 40, 60, 80, 100, 120, and 140 mA cm−2 were 76, 74, 70, 67, 65, 64, and 63%, respectively. The decrease in EE with increasing current densities can be attributed to a decrease in VE. Hence to improve the EE of a VRFB, it is necessary to avoid undesirable side reactions caused by cross-contamination of vanadium ions and water transport through the membranes and ohmic loss.
The efficiencies of ICEM were compared (Table 2) to those of the literature known sulfonated polymers employed in VRFBs. The table shows that the Coulombic efficiency of ICEM is comparable to those of the literature; the lower values for energy and voltage efficiency of ICEM can be attributed to the high operating current density of 140 mA cm−2 as at higher current density, the ohmic loss of the system is significant, which directly affects the voltage and energy efficiencies of the battery.
Table 2 The comparison of VRFB performance of sulfonated polymers with that of ICEM
| Membrane code |
CD (mA cm−2) |
CE (%) |
VE (%) |
EE (%) |
Remarks |
Ref. |
| Abbreviations: CD, current density (mA cm−2); CE, Coulombic efficiency (percentage); VE, voltage efficiency (percentage) and EE, energy efficiency (percentage); S-radel, sulfonated radel; SPEEK, poly(tetramethydiphenyl ether ether ketone); HSPAEK, highly branched sulfonated poly(fluorenyl ether ketone sulfone); SD, sulfonated poly(diallyl-bisphenol ether ether ketone); SPSF, sulfonated polysulfone; SP, sulfonated poly(phthalazinone ether sulfone); SPFEK, sulfonated poly(fluorenyl ether ketone); S67-DMF, sulfonated poly(ether ether ketone) N,N′-dimethylformamide; SPI-ODA,; sulfonated polyimide 4,4′-diaminodiphenyl ether; SPI-HFBAPP, sulfonated polyimide 2-bis(4-(4-aminophenoxy)phenyl)hexafluropropane; SPPEK, sulfonated poly(phthalazinone ether ketone); sPPO, sulfonated poly(phenylene oxide; SPEEK, sulfonated poly (ether ether ketone); ICEM, interpolymer cation exchange membrane (present work). |
| S-Radel |
50 |
97.8 |
77.0 |
83.7 |
Sulfonated poly(sulfone) membrane |
54
|
| SPEEK 40 |
50 |
98.5 |
88.8 |
87.5 |
40, 50 and 60 indicate degrees of sulfonation (DSs) in percentage (%) |
55
|
| SPEEK 50 |
97.3 |
86.3 |
84 |
| SPEEK 60 |
96.1 |
87.6 |
84.2 |
| HSPAEK |
80 |
98.0 |
85.0 |
83.0 |
|
56
|
| SD3-7-100 |
50 |
96.7 |
88.9 |
86.0 |
100 and 50 denote the thicknesses (μm) of the membrane; 7, 6 and 5 correspond to theoretical DSs, 60, 80 and 100% |
57
|
| SD4-6-100 |
97.8 |
89.9 |
87.9 |
| SD5-5-100 |
94.5 |
89.4 |
84.0 |
| SD5-5-50 |
91.5 |
94.0 |
86.0 |
| C-SD5-5-50 |
97.0 |
93.1 |
90.0 |
| SPSF-62 |
100 |
98.8 |
87.2 |
86.2 |
62, 67, 76 and 91 represent DSs (%) |
58
|
| SPSF-67 |
97.3 |
88.0 |
85.6 |
| SPSF-76 |
96.7 |
88.3 |
85.4 |
| SPSF-91 |
95.3 |
88.9 |
84.7 |
| SP-02 |
40 |
92.8 |
72.8 |
67.6 |
|
59
|
| SPFEK |
40 |
80.3 |
64.6 |
51.9 |
|
60
|
| S67-DMF |
120 |
97.0 |
83.0 |
81.0 |
67 and 87 indicate DSs (%) |
61
|
| S87-DMF |
94.0 |
83.0 |
77.0 |
| SPI-ODA |
100 |
94.2 |
86.7 |
81.7 |
|
62
|
| SPI-HFBAPP |
99.7 |
85.3 |
85.0 |
| SPPEK-P-70 |
40 |
99.0 |
86.3 |
85.4 |
70, 80, 90 and 100 are the DSs (%) |
63
|
| SPPEK-P-80 |
98.9 |
87.7 |
86.7 |
| SPPEK-P-90 |
98.2 |
88.8 |
87.2 |
| SPPEK-P-100 |
98.0 |
91.2 |
89.4 |
| sPPO |
80 |
94.2 |
85.8 |
83.4 |
|
64
|
| SPEEK 48 |
40 |
92.0 |
83.0 |
77.0 |
48 is the sulfonation reaction time (h) |
65
|
|
ICEM
|
140
|
95
|
67
|
63
|
Present study
|
|
The cycling stability of ICEM was evaluated over 100 charge/discharge cycles in a symmetric VRFB at 140 mA cm−2. From Fig. 5b it can be observed that the efficiencies of the battery were constant throughout the 100 cycles, as we were able to achieve CE of ∼95%, VE of ∼67%, and EE of ∼63%. The relatively high CE is due to the operation of the battery at such a high current density. At high current density the charging time and discharging time of the system are comparatively lower than the diffusivity rate of vanadium ions; hence, the crossover of the vanadium ions across the membrane is minimum and there is no significant change in the concentration of the active vanadium species in both compartments resulting in an achievable ∼100% CE. The EE of ∼63% can be explained by the low VE of the system at 140 mA cm−2, low VE is due to high ohmic loss, which is directly proportional to the current density applied and resistance of the membrane. The stable performance of ICEM at 140 mA cm−2 provides valid proof of its sustainability at high current density for a long duration of time. The post-analysis of ICEM after battery performance confirmed that there were no significant changes observed in the electrochemical, physicochemical, and mechanical properties of the membrane, which meant that the membrane is highly stable for long-term utility at higher current density in a VRFB.
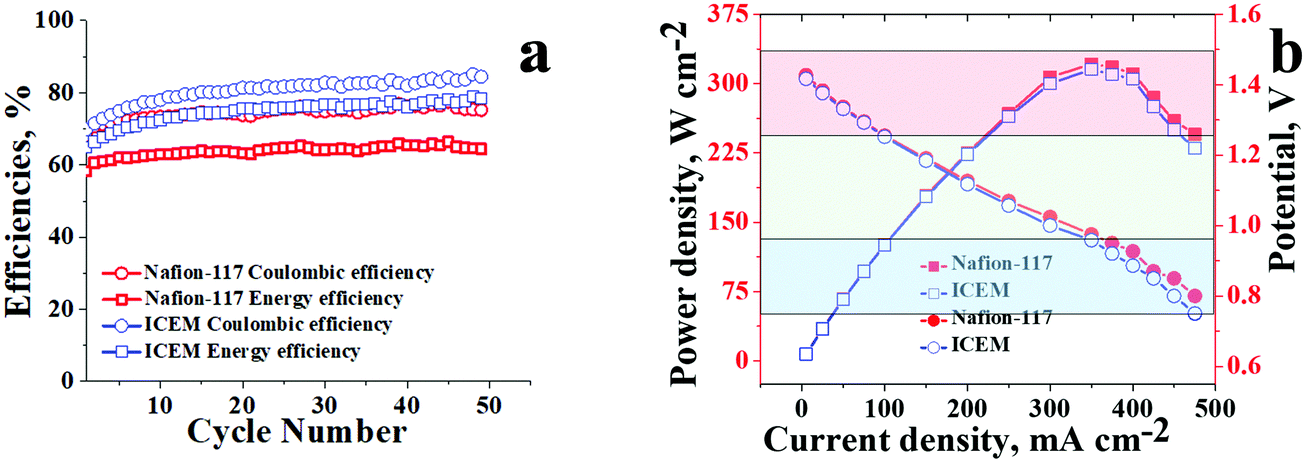
Comparative performance of ICEM and Nafion® 117 at 20 mA cm−2 for 50 charge/discharge cycles is presented in Fig. 6a. The obtained CE and EE were as high as 80% and 75%, respectively, at 20 mA cm−2 for ICEM compared to Nafion® 117, which had CE and EE of 75% and 60%, respectively. The high CE and EE for ICEM were due to its relatively low permeability for vanadium ions and good electrochemical properties. Furthermore, we have observed that under identical experimental conditions Nafion® 117 showed considerable electroosmosis of water; evident from an increase in the volume of electrolyte in the positive compartment and a subsequent decrease in the negative compartment. However, ICEM did not show electroosmosis indicating its best suitability in VRFB applications. The electroosmosis in the case of Nafion® 117 is due to its perfluorinated backbone that can form a continuous sheet of water molecules due to the high electronegativity of fluorine ions. In the presence of an electric gradient, this sheet of water can drag the bulk of water molecules, which results in a high amount of electroosmosis. This is absent in ICEM due to no fluorine atoms in the polymer backbone.
 |
| | Fig. 6 Comparative battery performance of ICEM and Nafion® 117 under an identical experimental set-up. (a) Efficiencies at 20 mA cm−2 and (b) polarization curves. | |
Polarisation curves for ICEM and Nafion® 117 were recorded at 100% state of the charge and are presented in Fig. 6b. Both the membranes showed an identical drop in discharge voltage with increasing current densities. The drops at lower current densities, i.e. the initial parts of the graphs (Fig. 6b red shaded portion) can be attributed to kinetic activation polarization66 that occurs due to slow electrochemical redox reactions at the interface of the electrolyte and electrode surface. The voltage drops at the middle parts of the graphs (Fig. 6b green shaded portion) are due to ohmic loss and mass transport across the membrane. The concentration depletion of the electroactive species results in the sudden drops in voltage at high current density, the third parts of the graphs (Fig. 6b blue shaded portion). The calculated power densities for ICEM and Nafion® 117 were similar; with Nafion®117 having a minute edge over ICEM. The maximum power density for ICEM was 310 W cm−2, whereas for Nafion® 117 it was 320 W cm−2 indicating the best suitability of ICEM to replace Nafion® 117 in VRFB applications.
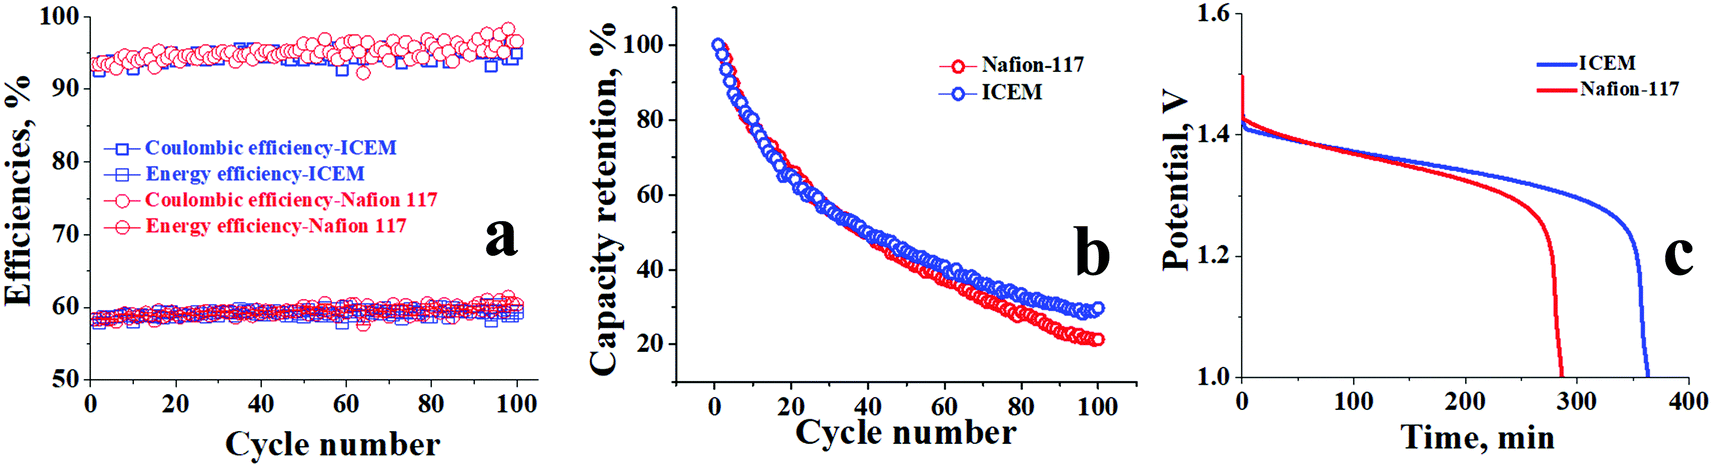
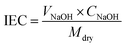
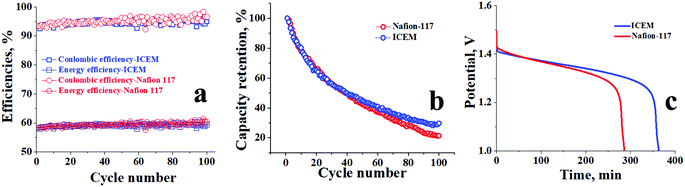
The differential diffusion rate of vanadium ions across the membrane results in the capacity fading of the VRFB.46 However, the capacity of the battery can be restored by remixing the electrolytes of two half cells, but it results in lower efficiencies. Herein, we performed experiments on asymmetric VRFB to study the capacity retention of the membranes followed by recording the OCV to best assess the membrane suitability. The permeability values of V2+ and V3+ are higher across the cation exchange membrane due to its high valence state and mobility, and the diffusion of these ions is associated with the drag of water molecules along with a significant increase in the volume of the positive side due to electroosmosis and the corresponding decrease of volume on the negative side. The concentration of the redox-active species also gets adversely affected at the negative side due to crossover. Hence to compensate for the decrease of the redox-active species and volume of electrolyte on the negative side, an asymmetric battery67 with a 30% increase of negolyte was set up and the capacity retention and efficiencies of ICEM and Nafion® 117 were evaluated. Fig. 7a shows the calculated CEs and EEs for both ICEM and Nafion® 117 at 100 mA cm−2 current density over 100 charge/discharge cycles. The CE and EE of ICEM were found to be 94.7% and 59.8%, respectively, whereas CE and EE for Nafion® 117 were 95% and 60%, respectively. The higher CEs for both membranes are again due to lower crossover at higher current density as highlighted in the previous section. Similarly, the EEs of ∼60% for both the membranes are due to lower VEs, (high ohmic losses). The capacity retention of ICEM was comparatively better than that of Nafion® 117, as presented in Fig. 7b. It is capable of retaining 30% of its initial capacity at the end of its 100 cycles; however, Nafion® 117 was able to retain only 20%. The suppressed permeability of vanadium ions across the dense ICEM and in the absence of the fluorinated backbone can be considered as a prime reason for its better capacity retention. Asymmetric battery experiments were followed by open circuit potential (OCV) measurements of the systems for both membranes. OCV can be considered as an alternative method to understand the diffusion of vanadium ions across the membrane in the absence of an electrical gradient. Fig. 7c represents the OCVs for ICEM and Nafion® 117. The OCV of ICEM was found to be a little more than 6 h, whereas for Nafion® 117 it was close to 5 h. This reveals a slower rate of vanadium ions crossing through ICEM than through Nafion® 117. The sudden voltage drop after 1.3 V for both membranes is due to the considerable self-discharge of vanadium ions. These data further intensify the proof regarding the lower diffusivity of vanadium ions across the ICEM as compared to across Nafion® 117.
 |
| | Fig. 7 Comparative asymmetric flow battery data of ICEM and Nafion®117. (a) Asymmetric flow battery performance at 100 mA cm−2, (b) capacity retention in an asymmetric flow battery and (c) open circuit potential after the asymmetric flow battery study. | |
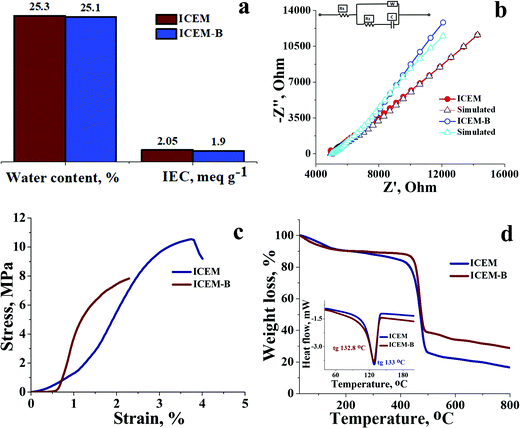
To ensure that there were no significant changes to ICEM after a detailed VRFB study and to understand its reusability, the membrane used for the battery study was subjected to an autopsy study. The membrane after battery testing was represented as ICEM-B. Water content, IEC, ionic conductivity, transport number, thermal stability, and UTM analysis of ICEM-B were compared with those of ICEM. Fig. 8 compares the physicochemical and electrochemical properties of ICEM-B and ICEM. Fig. 8a shows that there was very little to distinguish in water content and IEC between ICEM and ICEM-B. The conductivity values calculated from impedance spectra (see Fig. 8b) for ICEM and ICEM-B were 7.12 and 7.09 mS cm−1, respectively. The calculated transport number of ICEM-B was found to be 0.91, and the value suggests it will still allow 91% target ions to pass through it in the presence of co-ions. UTM analysis (see Fig. 8c) justified the mechanical strength of ICEM-B as its stress value was found to be ∼8 MPa and it was comparable with that of ICEM. Identical TGA and DSC spectra of ICEM and ICEM-B (see Fig. 8d) assured negligible changes in thermal stability of the membrane. In short, we synthesized a cost-effective interpolymer cation exchange membrane by the blown film extrusion technique, it was thoroughly characterized and its VRFB performance was benchmarked with that of commercial Nafion® 117. The results indicate that ICEM came out with flying colors to be considered as an eligible potential candidate for separators in VRFBs.
 |
| | Fig. 8 Post battery analysis study of ICEM-B and its comparison with ICEM. (a) Water content and IEC, (b) impedance spectra with simulation, (c) mechanical strength analysis and (d) TGA spectra (inset image: DSC spectra). | |
4. Conclusion
To conclude, we synthesized a new polyethylene–styrene–divinylbenzene-based interpolymer cation exchange membrane (ICEM) for a vanadium redox flow battery (VRFB) that matches the performance of commercial Nafion® 117. The synthesized membrane was characterized for chemical stability under highly oxidative acidic conditions comprising VO2+ ions, and the membrane was able to retain most of its important parameters necessary for a stable cation exchange membrane. The diffusivity rates of vanadium ions across ICEM were obtained using a two-compartment cell by maintaining ionic neutrality in the system and the values were found to be better than those of Nafion® 117 under identical experimental conditions. A detailed VRFB study was performed for ICEM and the results were benchmarked with those of Nafion® 117. The stable efficiency data for 100 charge/discharge cycles at 140 mA cm−2 proved the stability of the membrane under high current density as there were no signs of membrane burnout. To tackle the issue of capacity fading, an asymmetric battery was set up with an increase in electrolyte volume by 30% on the negative side. The results indicated that ICEM was capable of retaining 30% of the capacity, whereas Nafion® 117 only 20%. The self-discharge of ICEM was comparatively lower than that of Nafion® 117. The post battery analysis of ICEM confirmed there were no significant changes in physicochemical and electrochemical properties of the membrane suggesting its long-term applicability in VRFB.
Author contributions
Rajaram K Nagarale: conceptualization, funding acquisition, and writing–reviewing and editing. Sooraj Sreenath: visualization, supervision, and original draft preparation. Chetan M. Pawar: methodology, data curation. Priyanka Bavdane: data curation, investigation. Devendra Y. Nikumbe: formal analysis.
Conflicts of interest
There are no conflicts to declare.
Acknowledgements
RKN is thankful for the financial support of grant no. DST/TMD/MES/2K18/194(G) from Technology Mission Division, Energy and Water, DST India and Council of Scientific and Industrial Research, India (MLP-0061). The director CSIR-CSMCRI is acknowledged for continuous support and encouragement. RKN is also grateful for the instrumentation facilities provided by Analytical Discipline and Centralized Instrument Facility, CSIR-CSMCRI, Bhavnagar, CSIR-CSMCRI manuscript number 114/2021.
References
- Redox flow cell development and demonstration project, NASA TM-79067, National Aeronautics and Space Administration, U.S. Dept. of Energy, 1979, p. 49.
-
L. H. Thaller, Fourteenth Intersociety Energy Conversion Engineering Conference Boston, Massachusetts, 1979 Search PubMed.
-
V. Jalon, H. Stork and J. Giner, National Aeronautics and Space Administration Lewis Research Center, 1981 Search PubMed.
-
M. A. Reid and R. F. Gahn, Symposium on Electrode Materials and Processes for Energy Conversion and Storage, 1977 Search PubMed.
- X. Wu, J. Hu, J. Liu, Q. Zhou, W. Zhou, H. Li and Y. Wu, Pure Appl. Chem., 2014, 86(5), 633–649, DOI:10.1515/pac-2014-0101.
- M. Skyllas-Kazacos, M. Rychcik, R. G. Robins, A. G. Fane and M. A. Green, J. Electrochem. Soc., 1986, 133, 1057, DOI:10.1149/1.2108706.
- M. Skyllas-Kazacos, D. Kasherman, D. R. Hong and M. Kazacos, J. Power Sources, 1991, 35, 399–404, DOI:10.1016/0378-7753(91)80058-6.
- E. Sum and M. Skyllas-Kazacos, J. Power Sources, 1985, 15, 179–190, DOI:10.1016/0378-7753(85)80071-9.
-
M. Skyllas-Kazacos and R. G. Robins, US Pat., 4786567, 1986 Search PubMed.
- E. Sum, M. Rychcik and M. Skyllas-Kazacos, J. Power Sources, 1985, 16, 85–95, DOI:10.1016/0378-7753(85)80082-3.
- W. Wang, Q. Luo, B. Li, X. Wei, L. Li and Z. Yang, Adv. Funct. Mater., 2013, 23, 970–986, DOI:10.1002/adfm.201200694.
- S. Sreenath, N. K. Sharma and R. K. Nagarale, RSC Adv., 2020, 10, 44824–44833, 10.1039/d0ra08316j.
- D. Chen, M. A. Hickner, E. Agar and E. C. Kumbur, ACS Appl. Mater. Interfaces, 2013, 5, 7559–7566, DOI:10.1021/am401858r.
- S. Yun, J. Parrondo and V. Ramani, J. Mater. Chem. A, 2014, 2, 6605–6615, 10.1039/c4ta00166d.
- M. J. Jung, J. Parrondo, C. G. Arges and V. Ramani, J. Mater. Chem. A, 2013, 1, 10458–10464, 10.1039/c3ta11459g.
- Z. Yuan, X. Li, Y. Zhao and H. Zhang, ACS Appl. Mater. Interfaces, 2015, 7, 19446–19454, DOI:10.1021/acsami.5b05840.
- W. Y. Hsu and T. D. Gierke, J. Membr. Sci., 1983, 13, 307–326 CrossRef CAS.
- K. Schmidt-Rohr and Q. Chen, Nat. Mater., 2007, 7, 75–83, DOI:10.1038/nmat2074.
- Q. Luo, H. Zhang, J. Chen, P. Qian and Y. Zhai, J. Membr. Sci., 2008, 311, 98–103, DOI:10.1016/j.memsci.2007.11.055.
- J. Zeng, C. P. Jiang, Y. H. Wang, J. W. Chen, S. F. Zhu, B. J. Zhao and R. Wang, Electrochem. Commun., 2008, 10, 372–375, DOI:10.1016/j.elecom.2007.12.025.
- J. Xi, Z. Wu, X. Teng, Y. Zhao, L. Chen and X. Qiu, J. Mater. Chem., 2008, 18, 1232–1238, 10.1039/b718526j.
- J. Xi, Z. Wu, X. Qiu and L. Chen, J. Power Sources, 2007, 166, 531–536, DOI:10.1016/j.jpowsour.2007.01.069.
- S. Sang, Q. Wu and K. Huang, J. Membr. Sci., 2007, 305, 118–124, DOI:10.1016/j.memsci.2007.07.041.
- S. Lu, C. Wu, D. Liang, Q. Tan and Y. Xiang, RSC Adv., 2014, 4, 24831–24837, 10.1039/c4ra01775g.
- Z. S. Mai, H. M. Zhang, X. F. Li, S. H. Xiao and H. Z. Zhang, J. Power Sources, 2011, 196, 5737–5741, DOI:10.1016/j.jpowsour.2011.02.048.
- X. Teng, J. Dai, J. Su, Y. Zhu, H. Liu and Z. Song, J. Power Sources, 2013, 240, 131–139, DOI:10.1016/j.jpowsour.2013.03.177.
- Y. Shi, C. Eze, B. Xiong, W. He, H. Zhang, T. M. Lim, A. Ukil and J. Zhao, Appl. Energy, 2019, 238, 202–224, DOI:10.1016/j.apenergy.2018.12.087.
- D. Duerkop, H. Widdecke, C. Schilde, U. Kunz and A. Schmiemann, Membranes, 2021, 11(214), 1–54, DOI:10.3390/membranes11030214.
- X. Li, H. Zhang, Z. Mai, H. Zhang and I. Vankelecom, Energy Environ. Sci., 2011, 4, 1147–1160, 10.1039/C0EE00770F.
- H. Prifti, A. Parasuraman, S. Winardi, T. M. Lim and M. Skyllas-Kazacos, Membranes, 2012, 2, 275–306, DOI:10.3390/membranes2020275.
- A. Saal, T. Hagemann and U. S. Schubert, Adv. Energy Mater., 2020, 2001984 Search PubMed.
- J. Li, S. Liu, Z. He and Z. Zhou, Electrochim. Acta, 2016, 216, 320–331, DOI:10.1016/j.electacta.2016.09.039.
- J. Li, X. Yuan, S. Liu, Z. He, Z. Zhou and A. Li, ACS Appl. Mater. Interfaces, 2017, 9, 32643–32651, DOI:10.1021/acsami.7b07437.
- S. Kim, T. B. Tighe, B. Schwenzer, J. Yan, J. Zhang, J. Liu, Z. Yang and M. A. Hickner, J. Appl. Electrochem., 2011, 41, 1201–1213, DOI:10.1007/s10800-011-0313-0.
- X. L. Zhou, T. S. Zhao, L. An, L. Wei and C. Zhang, Electrochim. Acta, 2015, 153, 492–498, DOI:10.1016/j.electacta.2014.11.185.
- J. Jang, T. Kim, S. J. Yoon, J. Y. Lee, J. Lee and Y. Taik Hong, J. Mater. Chem. A, 2016, 4, 14342–14355, 10.1039/c6ta05080h.
- L. Ding, X. Song, L. Wang and Z. Zhao, J. Membr. Sci., 2019, 578, 126–135, DOI:10.1016/j.memsci.2019.02.050.
- Y. Molmeret, F. Chabert, N. E. Kissi, C. Iojoiu, R. Mercier and J. Sanchez, Polymers, 2011, 3, 1126–1150, DOI:10.3390/polym3031126.
-
A. Mokrini, US. Provisional Pat., US 9543607 B2, 2017 Search PubMed.
- S. Mbarek, N. E. Kissi, Z. Baccouch and C. Iojoiu, Polym. Bull., 2019, 76, 151–1166, DOI:10.1007/s00289-018-2427-6.
-
J. Sanchez, et al., US Pat., US 2009-1315444, 2009 Search PubMed.
- A. Mokrini, N. Raymond, K. Theberge, L. Robitaille, C. D. Rio, M. C. Ojeda, P. G. Escribano and J. L. Acosta, ECS Trans., 2010, 33(1), 855–865, DOI:10.1149/1.3484579.
- Y. Lai,
et al.
, J.
Fuel Cell Sci. Tech., 2009, 6(2), 1–13 CrossRef.
-
H. F. Enderle, Encyclopedia of Materials: Science and Technology, 2nd edn, 2001, pp. 7172–7180 Search PubMed.
- H. Jung, G. Moon, T. Sadhasivam, C. Jin, W. Park, H. Kim and S. Roh, Solid State Ionics, 2018, 327, 110–116, DOI:10.1016/j.ssi.2018.10.019.
- L. Cao, A. Kronander, A. Tang, D. Wang and M. Skyllas-Kazacos, Energies, 2016, 9(1058), 1–15, DOI:10.3390/en9121058.
- M. Faraj, M. Boccia, H. Miller, F. Martini, S. Borsacchi, M. Geppi and A. Pucci, Int. J. Hydrogen Energy, 2012, 37, 14992–15002, DOI:10.1016/j.ijhydene.2012.08.012.
- T. A. Sherazi, J. Y. Sohn, Y. M. Lee and M. D. Guiver, J. Membr. Sci., 2013, 441, 148–157, DOI:10.1016/j.memsci.2013.03.053.
- H. Yamamoto, Bull. Soc. Sea Water Sci. Jpn., 1968, 22, 323–326 CAS.
- M. Vijayakumar, M. S. Bhuvaneswari, P. Nachimuthu, B. Schwenzer, S. Kim, Z. Yang, J. Liu, G. L. Graff, S. Thevuthasan and J. Hu, J. Membr. Sci., 2011, 366, 325–334, DOI:10.1016/j.memsci.2010.10.018.
- F. Sepehr and S. J. Paddison, J. Phys. Chem. A, 2015, 119, 5749–5761, DOI:10.1021/acs.jpca.5b01794.
- H. Strehlow and H. Wendt, Inorg. Chem., 1963, 2, 6–10, DOI:10.1021/ic50005a002.
- K. J. Kim, M. Park, Y. Kim, J. H. Kim, S. X. Doub and M. Skyllas-Kazacos, J. Mater. Chem. A, 2015, 3, 16913–16933, 10.1039/c5ta02613j.
- S. Kim, J. Yan, B. Schwenzer, J. Zhanga and L. Li, Electrochem. Commun., 2010, 12, 1650–1653, DOI:10.1016/j.elecom.2010.09.018.
- J. Liu, Z. Yang, M. A. Hickner, Z. Mai, H. Zhang, X. Li, C. Bi and H. Dai, J. Power Sources, 2011, 196, 482–487, DOI:10.1016/j.jpowsour.2010.07.028.
- B. Yin, Z. Li, W. Dai, L. Wang, L. Yu and J. Xi, J. Power Sources, 2015, 285, 109–118, DOI:10.1016/j.jpowsour.2015.03.102.
- H. Zhang, H. Zhang, X. Li, Z. Mai, W. Wei and Y. Li, J. Power Sources, 2012, 217, 309–315, DOI:10.1016/j.jpowsour.2012.06.030.
- Y. Zhang, L. Zheng, B. Liu, H. Wang and H. Shi, J. Membr. Sci., 2019, 584, 173–180, DOI:10.1016/j.memsci.2019.04.073.
- N. Wang, S. Peng, Y. Li, H. Wang, S. Liu and Y. Liu, J. Solid State Electrochem., 2012, 16, 2169–2177, DOI:10.1007/s10008-012-1641-7.
- D. Chen, S. Wang, M. Xiao and Y. Meng, J. Power Sources, 2010, 195, 2089–2095, DOI:10.1016/j.jpowsour.2009.11.010.
- J. Xi, Z. Li, L. Yu, B. Yin, L. Wang, L. Liu, X. Qiu and L. Chen, J. Power Sources, 2015, 285, 195–204, DOI:10.1016/j.jpowsour.2015.03.104.
- Q. Chen, L. Ding, L. Wang, H. Yang and X. Yu, Polymers, 2018, 10(1315), 1–15, DOI:10.3390/polym10121315.
- L. Chen, S. Zhang, Y. Chen and X. Jian, J. Power Sources, 2017, 355, 23–30, DOI:10.1016/j.jpowsour.2017.04.045.
- S. H. Roh, D. S. Shin and H. Jung, J. Nanosci. Nanotechnol., 2017, 17(8), 5726–5729, DOI:10.1166/jnn.2017.14173.
- S. Winardi, S. C. Raghu, M. O. Oo, Q. Yan, N. Wai, T. M. Lim and M. Skyllas-Kazacos, J. Membr. Sci., 2014, 450, 313–322, DOI:10.1016/j.memsci.2013.09.024.
- D. Aaron, Z. Tang, A. B. Papandrew and T. A. Zawodzinski, J. Appl. Electrochem., 2011, 41, 1175–1182, DOI:10.1007/s10800-011-0335-7.
- A. Khataee, D. Pan, J. S. Olsson, P. Jannasch and R. W. Lindstrom, J. Power Sources, 2021, 483, 229202, DOI:10.1016/j.jpowsour.2020.229202.
|
| This journal is © The Royal Society of Chemistry 2022 |

 Open Access Article
 This Open Access Article is licensed under a Creative Commons Attribution-Non Commercial 3.0 Unported Licence
 *ab
*ab


 . The permeability rate
  (dm s−1) was calculated from the slope of the line.