
 Open Access Article
 This Open Access Article is licensed under a Creative Commons Attribution-Non Commercial 3.0 Unported Licence
Molecular trace detection in liquids using refocusing optical feedback by a silver-coated capillary
Chen
Kang
 ,
Zhoutao
Sun
,
Xiaohui
Fang
*,
Lei
Zha
,
Yu
Han
,
Hongmei
Liu
,
Jinxin
Guo
and
Xinping
Zhang
*
,
Zhoutao
Sun
,
Xiaohui
Fang
*,
Lei
Zha
,
Yu
Han
,
Hongmei
Liu
,
Jinxin
Guo
and
Xinping
Zhang
*
Institute of Information Photonics Technology, Faculty of Science, Beijing University of Technology, Beijing 100124, China. E-mail: fangxh@bjut.edu.cn; zhangxinping@bjut.edu.cn
First published on 5th October 2021
Abstract
Surface-enhanced Raman scattering (SERS) has been widely used owing to its high sensitivity and rapid response. In particular, 3D SERS-active platforms greatly extend the interaction area and ensure the ability to directly detect trace amounts of molecules in liquids. A silver-coated capillary, with the ability of liquid sampling and light guiding, provides a new platform for high-performance SERS substrates. In this paper, the silver mirror reaction was used for coating silver on the outer wall of the capillary. PDMS was used as a coating material to protect the silver film. Because of the silver coating, Mie scattering and Raman scattering in the liquid channel can be refocused and reflected back which greatly reduces the propagation loss and extends the interaction length. An enhancement factor as high as 108 and a detection limit of 10−10 M of rhodamine 6G in aqueous solution have been achieved. Moreover, the SERS intensity is homogeneous across the end face of the liquid channel, with the relative standard deviation (RSD) value changing within 7%. The large area and high homogeneity greatly reduce the requirement of light coupling precision and liquid injection pressure. Using a common flange optical fiber connector, the capillary can be simply connected and aligned with a multimode fiber with a detection limit of 10−8 M. The experiment results show great potential for the development of an optofluidic integrated system in the future.
Introduction
Direct molecule detection in liquids is important for in situ environmental monitoring, biomedical diagnostics, and medical research.1,2 SERS has attracted wide attention due to its excellent advantages such as non-destructive nature, high sensitivity, and rich information.3–5 Due to the small interaction volume between the laser light and analyte, the traditional 2D SERS-active substrate is not sensitive enough to directly detect liquids at a low concentration.6–8 Preconcentration of analyte molecules through drying9 or chemical affinity10 is necessary for trace molecule detection. 3D SERS-active platforms, such as capillaries and photonic crystal fibers (PCFs), greatly extend the interaction area and ensure the ability to directly detect trace amounts of molecules in liquids.11–14 Through specially designed structures of PCFs, the detection of molecules with concentrations on the order of fM has been achieved.15,16 The disadvantage of PCF-based SERS platforms is that the diameters of the fiber core and air holes are only several micrometers. High pressure or vacuum equipment is required for metallic nanoparticle (NP) and liquid-analyte incorporation into the air holes. High-precision adjustment stage and microscopic imaging systems are also necessary for laser light coupling which is bulky and not friendly for practical use. Therefore, a high sensitivity 3D SERS platform with a large area and high uniformity is demanded. Compared to PCFs, capillaries have a larger air channel which is beneficial to light coupling and liquid injection. However, the capillaries only support leaky modes; high SERS sensitivity can be achieved only when the laser light is grazing incident near the inner wall of the air channel.17In this paper, we report a simple and high sensitivity SERS platform based on a silver-coated capillary. The silver coating on the outer wall of the capillary with high smoothness can focus the light scattered by the AuNPs back into the liquid channel, which greatly increases the propagation length of laser light and the collection efficiency of the Raman scattering. To characterize the practicality of this method, rhodamine 6G (R6G) in an aqueous solution was used as a model analyte. The SERS intensity is homogeneous across the end face of the liquid channel, with the RSD value changing within 7%. The detection limit is 10−10 M, and the enhancement factor (EF) is as high as 108. The silver coating is protected by PDMS and the SERS sensing performance is stable for more than one month. The liquid channel with a large area and homogeneous SERS intensity greatly simplify the light coupling and liquid injection, laying the foundation for the development of an integrated system in the future.
Experimental
Chemical and materials
Chloroauric acid (HAuCl4) was purchased from Sinopharm Chemical Reagent Co., Ltd. Sodium citrate (SC), R6G and NH3·H2O were purchased from Aladdin. Glucose, AgNO3, and KOH were purchased from Beijing Yili Fine Chemicals Co., Ltd. PDMS was purchased from Beijing China Ocean Co., LTD. The quartz capillary tube (inner diameter (ID) of 74 μm, outer diameter (OD) of 150 μm) was purchased from INNOSEP. The multimode fiber (core diameter = 105 μm, NA = 0.2) was purchased from Tianjin Junfeng Technology Co., Ltd. Milli-Q deionized water was used in all the experiments.Synthesis and characterization of gold nanoparticles
AuNPs were synthesized by the citrate reduction method as described in previous reports.17,18 Briefly, 1 mL of HAuCl4 (25 mM) was added to 150 mL of SC aqueous solution (2.2 mM) under boiling conditions. The solution initially developed a yellow color, which changed to light pink and finally to wine red, which indicated that the preparation of the seed solution was completed. Based on the seed solution, the size of AuNPs increased generation by generation. TEM images of AuNPs were obtained by high resolution transmission electron microscopy (HRTEM).Method and characterization of the silver coating on the outer wall of the capillary
A liquid-phase deposition method was employed to coat the silver layer on the inner and outer surfaces of the capillary.19,20 The silver–ammonia solution was formed by mixing equal volumes of 4% KOH solution and 5% AgNO3, and then gradually dripping the mixture into 25% NH3·H2O solution. The reducer was 5% glucose solution. As shown in Fig. 1(a), the flow rate of the solutions was carefully controlled by the pressure of nitrogen gas. The whole device had two liquid outlets, which were used for silver coating of the capillary on the outer surface and inner surface, respectively. For outer surface coating, the capillary was inserted into a rubber tube and the solutions were pumped into the gap between the rubber tube and the capillary through a needle. Silver film mainly deposited on the outer surface of the capillary rather than on the inner surface of the rubber tube as the reduced silver prefers to deposit on a smooth surface. For the inner surface coating, the solution was pumped directly into the air channel of the capillary. After 10 minutes, the capillary was rinsed repeatedly with water and blown dry with nitrogen gas. SEM images of the silver film were obtained using an ultra-high resolution scanning transmission electron microscope (STEM).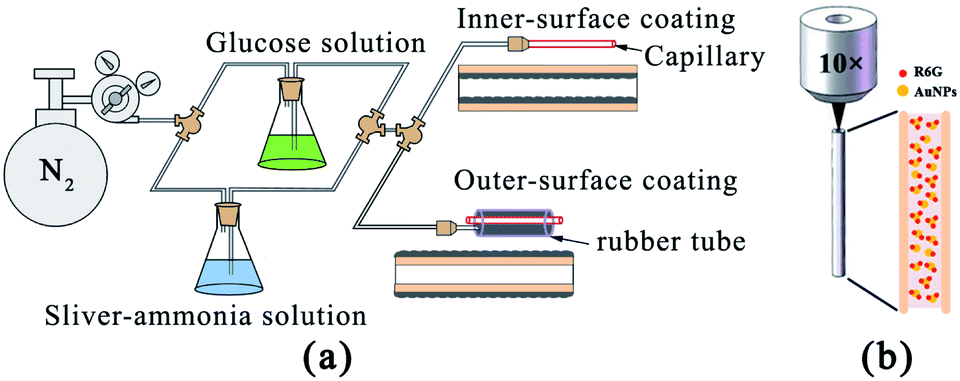 | ||
| Fig. 1 (a) Schematic image of the silver coating process on the inner surface and outer surface of the capillary. (b) Simplified image of the measurement process. | ||
SERS measurement
Aqueous solutions of R6G with concentration from 10−3 M to 10−10 M were prepared by mixing the R6G solutions of 10−2 M to 10−9 M with a AuNP aqueous solution at a 1![[thin space (1/6-em)]](https://www.rsc.org/images/entities/char_2009.gif) :9 ratio by volume. The tip of the quartz capillary was immersed into the mixed SERS-active solution for 2 min. Then, the SERS spectra were measured using a confocal Raman spectroscopy system (WITec), using lasers with emission wavelengths of 633 nm. A 10× objective lens (NA = 0.25) coupled the laser light into the capillary core and collected the Raman signal in backscattering configuration. A simplified schematic of this configuration is presented in Fig. 1(b). The liquid-filled capillary was vertically placed under the objective lens. The laser injection position was visible through the CCD and precisely controlled by two-dimensional micro-displacement which was integrated in the WITec system. The integration time of each spectrum was set to 5 seconds, and the number of integrations was 1.
:9 ratio by volume. The tip of the quartz capillary was immersed into the mixed SERS-active solution for 2 min. Then, the SERS spectra were measured using a confocal Raman spectroscopy system (WITec), using lasers with emission wavelengths of 633 nm. A 10× objective lens (NA = 0.25) coupled the laser light into the capillary core and collected the Raman signal in backscattering configuration. A simplified schematic of this configuration is presented in Fig. 1(b). The liquid-filled capillary was vertically placed under the objective lens. The laser injection position was visible through the CCD and precisely controlled by two-dimensional micro-displacement which was integrated in the WITec system. The integration time of each spectrum was set to 5 seconds, and the number of integrations was 1.
Results and discussion
The TEM image of AuNPs is shown in Fig. 2(a). The shape and size of the AuNPs are uniform and the average size is 54 nm. The SEM images of the end face of the silver-coated capillary with different magnifications are shown in Fig. 2(b) and (c). The thickness of the silver film is about 200 nm. To compare the roughness of the coated silver film, the SEM images of the top view of the inner surface of the inner-wall-coated silver film (surface A), the inner surface of the outer-wall-coated silver film (surface B), and the outer surface of the outer-wall-coated silver film (surface C) are shown in Fig. 2(d)–(f), respectively. We need to mention that surface B is obtained by peeling off the outer-wall-coated silver film using tape. As the silver film adsorbs on the surface of the capillary by physical deposition, not chemical bonding or electrostatic adsorption, the adhesive force of the tape is enough to completely peel off the silver film. The big crack in Fig. 2(e) is artificially added for better focused imaging. The roughness of the three surfaces is quite different. Surfaces A and C are discontinuous and full of granule-like Ag NPs while surface B has high smoothness. This is because the silver mirror reaction first precipitates silver particles, and then the particles connect to form a film. As the reaction proceeds, the subsequent silver particles will grow on the silver film. Therefore, the surface of the silver film attached to the fused silica has high smoothness while the opposite surface is rough. | ||
| Fig. 2 (a) TEM image of AuNPs. (b and c) SEM images of the end face of the silver-coated capillary at different magnifications. (d–f) SEM images of the top view of surfaces A, B and C, which were indicated in (b). | ||
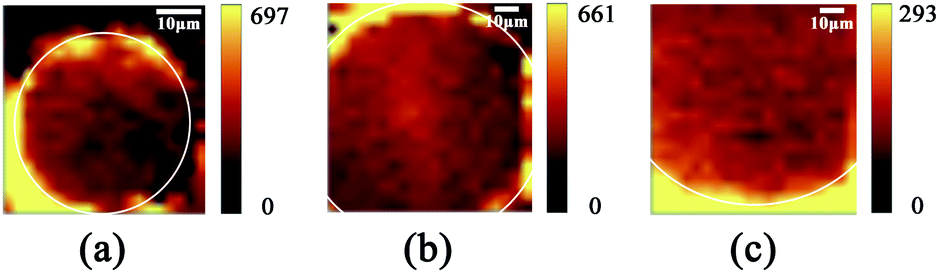
The smooth silver film reduces light scattering and ensures the excellent light guiding performance of the capillary. The Raman scattering intensity will be enhanced because of the extended interaction length. In contrast, the rough silver surface enhances the Raman scattering by localized surface plasmon resonance. To compare the SERS sensitivity, Raman spectra of R6G solution (10−5 M) were measured using three different kinds of capillary, the original capillary without silver coating (Capillary I), the inner-wall-silver-coated capillary (Capillary II), and the outer-wall-silver-coated capillary (Capillary III), respectively. The Raman spectra at the center (solid lines) and boundary (dashed lines) of the liquid core are shown in Fig. 3(a). Capillary III has a much stronger Raman intensity in the core center compared to Capillary I and Capillary II. The characteristic peaks of R6G located at 613, 773, 1184, 1313, 1363, 1511, and 1652 cm−1 are clearly observed. In contrast, Capillary II has the strongest Raman intensity near the core boundary because of the additional Raman enhancement from the rough silver surface. To clearly compare the SERS sensitivity and uniformity of the three kinds of capillary, hyperspectral Raman images of the R6G (10−5 M) at 1511 cm−1 were measured, as shown in Fig. 3(b)–(d), corresponding to Capillaries I, II and III, respectively. The samples were scanned in steps of 5 μm in the x and y directions and about 25 minutes were needed to finish the scan. From the hyperspectral Raman images, we can see that the SERS intensity near the inner wall of Capillaries I and II is much stronger than the SERS intensity near the core center. Capillary III has a uniform intensity distribution on the whole end face of the liquid channel. This illustrates that the long-time illumination of the laser beam does not change the density and concentration of the probe. To verify the uniformity and reproducibility of the SERS sensitivity in Capillary III, the RSD of Raman intensities21 was calculated. We detected the Raman signal of 10−5 M R6G using 6 individual outer-wall-silver-coated capillaries. For each capillary, we randomly chose 6 different points at the end face of the liquid channel. The Raman spectra are shown in Fig. 3(e). All the spectral shapes are well matched, and the characteristic peaks are invariant. The RSD values of the peaks centered at 613, 1363, and 1511 cm−1 are shown in Fig. 3(f). The variation of RSD values was within 7%, which indicated that the outer-wall silver-coated capillary has good reproducibility. The homogeneity and repeatability greatly reduce the difficulty of light coupling and improve the practicability.
 | ||
| Fig. 3 (a) Raman spectra of R6G (10−5 M) measured at the center and the boundary of the liquid core of the original capillary (Capillary I), the inner-wall silver-coated capillary (Capillary II), and the outer-wall silver-coated capillary (Capillary III). Hyperspectral Raman images of R6G (10−5 M) taken at 1511 cm−1 at the end face of (b) Capillary I, (c) Capillary II, and (d) Capillary III. (e) Raman spectra of 10−5 M R6G at 36 different points obtained from 6 individual Capillary III. (f) The peak intensities of Raman bands at 613, 1363 and 1511 cm−1 and the corresponding RSD values. | ||
To investigate the SERS sensitivity of Capillary III, R6G solutions with concentrations ranging from 10−3 M to 10−10 M were measured. The results are shown in Fig. 4(a). The detection limit is as low as 10−10 M. Notably, as shown in Fig. 4(c), SERS intensity is nearly linearly proportional to the concentration of R6G in the range of 10−3 to 10−8 M. The corresponding coefficient of determination (R2) was 0.9581. The results indicated that Capillary III could be applied in the ultra-trace and sensitive detection of R6G. To calculate the EF value, the normal Raman scattering spectrum of R6G solution without AuNPs in the liquid pool was also measured. The detection limit is 10−2 M and the SERS spectrum is shown in Fig. 4(b) (blue line). The EF of the Raman signal is calculated according to the following equation:22

 | ||
| Fig. 4 (a) Raman spectra of R6G with concentrations ranging from 10−3 M to 10−10 M. (b) SERS and Raman spectra of 10−5 M R6G aqueous solution in Capillary III, and Raman spectrum of 10−2 M R6G aqueous solution in the liquid pool. (c) The linear relationship between SERS intensity at 1511 cm−1 and concentration; (d) SERS intensity of R6G at 1511 cm−1 detected by the PDMS-coated capillary (red line) and non-PDMS-coated capillary (black line) after storage for different times of 0, 5, 10, 15, 20, 25 and 30 days. The error bars represent the deviation of five individual measurements based on different capillaries. | ||
Since the silver film coating on the outer wall of the capillary easily undergoes oxidative deterioration and is easily peeled off under the action of external force, the period of validity for SERS detection is quite short. PDMS is a kind of polymer film, non-porous, with natural compactness, temperature resistance, elasticity, and aging resistance. It has been widely used in pre-packaged food and electronic equipment. Therefore, we use PDMS as a coating material to protect the silver film. The long time effectiveness was compared for Capillary III with and without PDMS protection by detecting the 10−5 M R6G solution every 5 days. As shown in Fig. 4(d), the PDMS protected Capillary III keeps its SERS sensitivity for a long time. The SERS intensity at 1511 cm−1 still accounts for more than 80% of the original intensity after 30 days. In contrast, the SERS intensity in non-PDMS protected Capillary III falls to 50% after 5 days and to 2% after 20 days, with the SERS sensitivity approaching that of Capillary I. The results show that the PDMS layer can not only physically protect the silver film from damage but can also significantly reduce the oxidation rate of silver. The stabilized SERS sensing performance is important for practical use.
The high sensitivity and homogeneous SERS intensity across the liquid core of Capillary III can be understood from Fig. 5. As the AuNPs are densely distributed in the liquid core, Mie scattering and Raman scattering are both greatly enhanced. For the capillary without silver coating (Fig. 5(a)), the scattering light is incident almost normal to the boundary when the scattering particles are near the core center, the reflectivity is quite low and the scattering light will leak out of the capillary and be lost. In contrast, when the scattering particles are near the boundary, part of the scattering light is gazing incident on the boundary and the light will be highly reflected back into the liquid core. Therefore, the SERS intensity is much stronger near the core boundary than that at the core center. The rough inner surface of Capillary II increases the propagation loss but also provides more SERS hot spots and further improves SERS sensitivity near the boundary of the core. For the outer-wall-silver-coated capillary, the situation is quite different (Fig. 5(b)). The smooth silver coating functioning as a concave mirror will focus the scattered light back into the liquid channel no matter whether the scattering point is near the core center or near the boundary. Therefore, the SERS intensity is homogeneous across the liquid core. Simultaneously, the propagation loss of excitation light and Raman scattering light is greatly reduced. Therefore, the SERS intensity is accumulated and enhanced because of the extended interaction length. The sensitivity enhancement attributed to the silver coating can be verified by comparing the Raman intensity of R6G in Capillary III and the liquid pool, as shown in Fig. 4(b). The detection limit is 10−5 M in Capillary III without AuNPs, which is three orders of magnitude lower than the detection limit in the liquid pool.
 | ||
| Fig. 5 (a) Schematic diagram of scattered light propagation in a capillary without silver coating. When the scattering particles near the core center (in red), the scattering light is incident almost normal to the boundary. The reflectivity is quite low and the scattering light will leak out of the capillary and be lost. When the scattering particles near the boundary (in green), part of the scattering light is gazing incident on the boundary and the light will be highly reflected back into the liquid core. (b) Schematic diagram of the scattered light propagation in the outer-wall-silver-coated capillary. The smooth silver coating functioning as a concave mirror will focus the scattered light back into the liquid channel no matter whether the scattering point is near the core center or near the boundary. | ||
The refocusing optical feedback by coating silver on the outer wall of the capillary to obtain homogeneous SERS intensity can be applied to capillaries with different sizes. We experimentally studied the SERS performance of capillaries with ID = 40 μm and OD = 140 μm, ID = 100 μm and OD = 150 μm, and ID = 300 μm and OD = 430 μm, respectively. The hyperspectral Raman images of R6G (10−5 M) taken at 1511 cm−1 are shown in Fig. 6(a)–(c). Due to the limitation of the scanning range, only part of the liquid core was scanned for large-size capillaries. All of them have a homogeneous SERS intensity on the whole end face of the liquid channel. In other words, the uniformity of the SERS intensity is independent of the size of capillaries. However, the sensitivity depends on the ID of the capillary. The larger the ID, the larger the number of molecules, and the lower the optical power density. The ID is optimized and the capillary with an inner diameter of 70 μm which is studied in detail above has the best SERS sensitivity realizing a detection limit of 10−10 M.
 | ||
| Fig. 6 Hyperspectral Raman images of R6G (10−5 M) taken at 1511 cm−1 at the end face of the capillary with different sizes. (a) ID = 40 μm, OD = 140 μm. (b) ID = 100 μm, OD = 150 μm. (c) ID = 300 μm, OD = 430 μm. | ||
The SERS platform based on Capillary III has a large area with high uniformity of SERS sensitivity. The requirement of light coupling precision and liquid injection pressure is greatly reduced and is suitable for optofluidic integration. We used a portable Raman spectrometer to connect and analyze the Raman signal. The output light from the Raman probe head was coupled into a multimode fiber which aligns with the capillary using a common flange optical fiber connector. In such a way, the capillary can be easily replaced by plugging and inserting without further alignment. The primary experimental results are shown in Fig. 7. The detection limit is 10−8 M which proves the feasibility of optofluidic integration. The SERS sensitivity will be further improved by optimizing the parameters of the multimode fiber and capillary in the future.
 | ||
| Fig. 7 Raman spectra of R6G with concentrations ranging from 10−5 M to 10−8 M detected by a portable Raman spectrometer. The output light from the Raman probe head was coupled into a multimode fiber which aligns with the capillary using a common flange optical fiber connector. | ||
Conclusions
In summary, we have developed a silver-coated capillary for the direct detection of trace molecules in liquids, with highly uniform Raman sensitivity across the large size liquid channel. The inner surface of the silver coating on the outer wall of the capillary has high smoothness, which can focus the light scattered by the gold nanoparticles back to the liquid channel, which greatly increases the propagation length of the laser and the collection efficiency of Raman scattering. In addition, the capillary can simply use capillary force to sample and analyze the premixed SERS-active solution. Ultra-sensitive detection of R6G in aqueous solution has been realized. The EF is as high as 108, the detection limit is 10−10 M, and the variation of RSD values is within 7%, showing good uniformity and reproducibility. Moreover, the SERS intensity is almost linearly proportional to the concentration of R6G in the range of 10−3 to 10−8 M. The silver film is protected by the PDMS coating, and the SERS sensitivity performance can achieve long-term effectiveness. For practical applications, the multi-mode optical fiber is used to connect to the capillary and the detection limit is 10−8 M. Therefore, the SERS detection platform based on a silver-coated capillary is low-cost, easy to integrate, and suitable for various actual environments.Conflicts of interest
There are no conflicts to declare.Acknowledgements
We acknowledge the National Natural Science Foundation of China (61575007) for the financial support.Notes and references
- H. K. Lee, Y. H. Lee, C. S. L. Koh, C. P. Q. Gia, X. M. Han, C. L. Lay, H. Y. F. Sim, Y. C. Kao, Q. An and X. Y. Ling, Chem. Soc. Rev., 2019, 48, 731–756 RSC.
- S. Y. Ding, J. Yi, J. F. Li, B. Ren, D. Y. Wu, R. Panneerselvam and Z. Q. Tian, Nat. Rev. Mater., 2016, 1, 16 Search PubMed.
- J. Langer, D. J. de Aberasturi, J. Aizpurua, R. A. Alvarez-Puebla, B. Auguie, J. J. Baumberg, G. C. Bazan, S. E. J. Bell, A. Boisen, A. G. Brolo, J. Choo, D. Cialla-May, V. Deckert, L. Fabris, K. Faulds, F. J. G. de Abajo, R. Goodacre, D. Graham, A. J. Haes, C. L. Haynes, C. Huck, T. Itoh, M. Ka, J. Kneipp, N. A. Kotov, H. Kuang, E. C. Le Ru, H. K. Lee, J. F. Li, X. Y. Ling, S. A. Maier, T. Mayerhofer, M. Moskovits, K. Murakoshi, J. M. Nam, S. Nie, Y. Ozaki, I. Pastoriza-Santos, J. Perez-Juste, J. Popp, A. Pucci, S. Reich, B. Ren, G. C. Schatz, T. Shegai, S. Schlucker, L. L. Tay, K. G. Thomas, Z. Q. Tian, R. P. Van Duyne, T. Vo-Dinh, Y. Wang, K. A. Willets, C. Xu, H. Xu, Y. Xu, Y. S. Yamamoto, B. Zhao and L. M. Liz-Marzan, ACS Nano, 2020, 14, 28–117 CrossRef CAS PubMed.
- D. W. Li, W. L. Zhai, Y. T. Li and Y. T. Long, Microchim. Acta, 2014, 181, 23–43 CrossRef CAS.
- Z. Y. Wang, S. F. Zong, L. Wu, D. Zhu and Y. P. Cui, Chem. Rev., 2017, 117, 7910–7963 CrossRef CAS PubMed.
- P. A. Mosier-Boss, Nanomaterials, 2017, 7, 30 CrossRef PubMed.
- K. Liu, Y. C. Bai, L. Zhang, Z. B. Yang, Q. K. Fan, H. Q. Zheng, Y. D. Yin and C. B. Gao, Nano Lett., 2016, 16, 3675–3681 CrossRef CAS PubMed.
- J. Su, D. F. Wang, L. Norbel, J. L. Shen, Z. H. Zhao, Y. Z. Dou, T. H. Peng, J. Y. Shi, S. Mathur, C. H. Fan and S. P. Song, Anal. Chem., 2017, 89, 2531–2538 CrossRef CAS PubMed.
- R. L. Aggarwal, L. W. Farrar and S. K. Saikin, J. Phys. Chem. C, 2012, 116, 16656–16659 CrossRef CAS.
- Y. Shin, I. Jeon, Y. You, G. Song, T. K. Lee, J. Oh, C. Son, D. Baek, D. Kim, H. Cho, H. Hwang, T. Kim, S. K. Kwak, J. Kim and J. Lee, Adv. Opt. Mater., 2020, 8, 10 Search PubMed.
- S. Lin, W. L. Hasi, X. Lin, S. Q. Han, T. Xiang, S. Liang and L. Wang, ACS Sens., 2020, 5, 1465–1473 CrossRef CAS PubMed.
- L. Li, S. X. Deng, H. Wang, R. H. Zhang, K. Zhu, Y. Lu, Z. L. Wang, S. F. Zong, Z. Y. Wang and Y. P. Cui, Nanotechnology, 2019, 30, 10 Search PubMed.
- J. Zhang, S. M. Chen, T. C. Gong, X. L. Zhang and Y. Zhu, Plasmonics, 2016, 11, 743–751 CrossRef CAS.
- S. Yuksel, A. M. Schwenke, G. Soliveri, S. Ardizzone, K. Weber, D. Cialla-May, S. Hoeppener, U. S. Schubert and J. Popp, Anal. Chim. Acta, 2016, 939, 93–100 CrossRef PubMed.
- N. Zhang, G. Humbert, T. X. Gong, P. P. Shum, K. W. Li, J. L. Auguste, Z. F. Wu, D. J. J. Hu, F. Luan, Q. X. Dinh, M. Olivo and L. Wei, Sens. Actuators, B, 2016, 223, 195–201 CrossRef CAS.
- U. S. Dinish, F. Beffara, G. Humbert, J. L. Auguste and M. Olivo, J. Biophotonics, 2019, 12, 16 CrossRef PubMed.
- Z. T. Sun, C. Kang, X. H. Fang, H. M. Liu, J. N. Guo and X. P. Zhang, Nanoscale Adv., 2021, 3, 2617–2622 RSC.
- N. G. Bastús, J. Comenge and V. Puntes, Langmuir, 2011, 27, 11098–11105 CrossRef PubMed.
- X. Zhang, X. S. Zhu and Y. W. Shi, Opt. Lett., 2019, 44, 4550–4553 CrossRef CAS PubMed.
- X. Zhang, X. S. Zhu and Y. W. Shi, Opt. Laser Technol., 2019, 111, 802–809 CrossRef CAS.
- H. M. Parsons, D. R. Ekman, T. W. Collette and M. R. Viant, Analyst, 2009, 134, 478–485 RSC.
- M. Shanthil, H. Fathima and K. G. Thomas, ACS Appl. Mater. Interfaces, 2017, 9, 19470–19477 CrossRef CAS PubMed.
| This journal is © The Royal Society of Chemistry 2021 |