
 Open Access Article
 This Open Access Article is licensed under a Creative Commons Attribution-Non Commercial 3.0 Unported Licence
Optical and electrochemical tuning of hydrothermally synthesized nitrogen-doped carbon dots†
Christopher D.
Stachurski
 a,
Sophia M.
Click
a,
Kody D.
Wolfe
b,
Dilek
Dervishogullari
a,
Sandra J.
Rosenthal
abcdef,
G. Kane
Jennings
bcd and
David E.
Cliffel
*abd
a,
Sophia M.
Click
a,
Kody D.
Wolfe
b,
Dilek
Dervishogullari
a,
Sandra J.
Rosenthal
abcdef,
G. Kane
Jennings
bcd and
David E.
Cliffel
*abd
aDepartment of Chemistry, Vanderbilt University, Nashville, TN 37235-1822, USA. E-mail: d.cliffel@vanderbilt.edu
bInterdisciplinary Materials Science Program, Vanderbilt University, Nashville, Tennessee 37235-1822, USA
cDepartment of Chemical and Biomolecular Engineering, Vanderbilt University, Nashville, TN 37235-1604, USA
dVanderbilt Institute of Nanoscale Science and Engineering, Vanderbilt University, Nashville, TN 37235-0106, USA
eDepartment of Pharmacology, Vanderbilt University, Nashville, TN 37240-7933, USA
fDepartment of Physics and Astronomy, Vanderbilt University, Nashville, TN 37235-1807, USA
First published on 29th June 2020
Abstract
Carbon dots (CDs) are a rapidly progressing class of nanomaterial which show promise towards applications in solar energy conversion due to their low toxicity, favorable electrochemical properties, and tunability. In recent years there have been a number of reported CD syntheses, both top-down and bottom-up methods, producing a diverse range of CDs with intrinsic properties dependent on the starting materials and utilized dopants. This work presents a citrate buffer-facilitated synthesis of nitrogen-doped carbon dots (NCD) and explores the impact of urea concentration on observed electrochemical and optical properties. Optical absorbance and quantum yield of NCDs were found to increase with the dopant concentrations present in the hydrothermal reaction mixture. Electrochemical analysis demonstrates that increased nitrogen content results in the shifting of carbon dot oxidation potentials without the need of post-synthesis surface modifications. Over the range of molar ratios of dopant-to-citrate tested, the oxidation potentials of NCDs shifted up to 150 mV towards more negative potentials. X-ray photoelectron spectroscopy confirms the addition of pyrrolic and pyridinic nitrogen at different levels in different batches of NCDs, which are likely the source of the observed changes.
Introduction
Carbon dots (CDs) are an emerging class of carbon-based nanomaterial rapidly gaining interest due to their optical and electrochemical properties while maintaining low biological and environmental toxicity.1 CD materials, first identified in 2004 as fluorescent byproducts of a carbon nanotube synthesis,2 have been implemented as substitutes for metallic nanoparticles and quantum dots in applications ranging from bioimaging and drug delivery to energy harvesting and fuel production.3–8 Within energy harvesting applications, CDs have been shown to work as photocatalytic particles, charge transport materials, or fluorescent light emitters.2,3,9–13 The widespread use of CDs has been attributed to their facile syntheses, wide doping capabilities, and multiple post synthesis surface functionalization strategies leading to a diverse range of materials, each suited for their intended purpose.CD materials have been synthesized from both top-down and bottom-up synthetic pathways; however bottom-up approaches have produced more controlled and tunable products.14,15 Although top-down techniques are more effective at bulk conversion of macroscopic waste materials into usable CDs, they often produce polydisperse particles exhibiting broad emission spectra and non-uniform doping concentrations per CD.4,16,17 In general, bottom-up approaches, such as microwave-assisted pyrolysis or hydrothermal carbonization of a molecular precursor, provide more control over the produced nanomaterial leading to small, monodisperse particles with surfaces and compositions resembling the physical and chemical structure of the used starting materials.18–20
In addition to producing more uniform particles, bottom-up synthetic methods also provide control over CD doping by selective inclusion of additional molecular precursors in the reaction mixture rather than relying on heterogeneous elemental compositions of bulk materials or biomass, as is often the case in top-down techniques.16,21,22 To this end, hydrothermally synthesized nitrogen-doped carbon dots (NCDs) have become prevalent in the field due to their enhanced emissive properties originating from new electronic states created by electron-rich nitrogen groups.22,23 Bottom-up CD or NCD syntheses typically follow similar workflows regardless of the technique: a molecular carbon source such as sucrose, citric acid, or primary alcohols is dissolved alongside any desired dopant or alkaline agent and reacted to facilitate carbon dot growth.24,25 These conditions are believed to initiate polymerization of the carbon source into sheets that then grow into three dimensional particles.26
CDs and NCDs have seen use in a number of fields thanks to steady fluorescence, excellent electrical conductivity, and efficient electron transfer, with unique properties such as photoluminescence intensity25 and wavelength27,28 showing tunability depending on the chosen synthetic route and chosen molecular precursors.29–33 CD-based sensors synthesized from citric acid improve detection of biological analytes such as dopamine or environmental contaminants such as bisphenol A when compared to unmodified glassy carbon electrodes.34 Similar CDs synthesized with citrate as a carbon source and urea as a nitrogen dopant have also been used as fluorescence-based sensor for Hg2+.35 By using different molecular precursors such as 1,2,4-triaminobenzene, Jiang et al. demonstrated how a similar hydrothermal process could yield new, yellow NCDs selective for the detection of Ag+ ions.36
Electrochemical properties of CDs and NCDs, such as band gap and oxidation/reduction potentials, have also been shown to exhibit tunability dependent upon synthetic conditions, although to a lesser extent than optical properties, leading to their incorporation in a number of different energy harvesting or photocatalytic applications.37,38 Rigodanza et al. demonstrated that by adding various commercially available quinones into a novel microwave treatment of arginine and ethylenediamine, the oxidation and reduction potentials of produced CD materials could be tuned to energetically match different systems.18 Wang et al. showed tunable electrochemiluminescence properties in nitrogen-doped CDs upon changing the concentration of ammonium hydroxide used in the synthesis, however no direct measurement of oxidation potential is reported.39 Peng et al. reported shift in oxidation and reduction potential of nitrogen-doped CDs as a result of both changing the identity of the carbon and dopant source as well as pH of the electrolyte solution, but the impact of molar ratio of dopant to carbon source was not investigated.40 Moving beyond synthetic parameters, Privitera et al. demonstrated how post-synthesis surface modification of nitrogen-doped carbon dots with thiophene groups shifted oxidation potentials to more negative potentials, yet additional reactions may detract from favorable cost or environmental properties of CDs depending on the selected ligands.41
While the impact of the identity of carbon and dopant sources have been well studied across CD research over the years, the effects of dopant concentration on intrinsic CD properties has not had much attention.42,43 Few articles report a dependence of optical properties on dopant concentration during CD formation,44 and even less attention has been given towards its impact on electrochemical properties.45,46 Considering the widespread use of CDs and doped CDs in energy harvesting applications, this study seeks to identify the impact of dopant concentration on optical and electrochemical properties, specifically oxidation and reduction potential, as a way to design CD materials better suited for specific sensing and energy harvesting applications.
Experimental
Materials
All chemicals were used as purchased from the supplier without further modification. Sodium citrate dibasic (Sigma Aldrich, St. Louis, MO) and tribasic (Fisher Chemical, Loughborough, UK) were used to create an aqueous citrate buffer (0.67 M) held at pH 6.2 which was used as the hydrothermal reaction solution of all CD syntheses. Urea (Sigma Aldrich) was used as a nitrogen dopant for select batches of CDs. Potassium chloride (Fisher Chemical) was used to make all electrolyte solutions for electrochemical measurements. All water used was deionized H2O (DI-H2O) (18 MΩ cm) obtained from an in-house purification system (Barnstead Nanopure, Thermo Scientific, Waltham, MA). Dialysis was performed using a 1 kDa molecular weight cutoff membrane for 18 h to remove unreacted starting material (Repligen, Boston, MA). Lyophilization of the retentate was performed at 0.021 mbar and −83 °C (FreeZone 4.5 Plus, Labconco, Kansas City, MO).Carbon dot synthesis
![[thin space (1/6-em)]](https://www.rsc.org/images/entities/char_2009.gif) :moles of citrate; i.e. “1:2” denoting 5 mmol of urea added to 10 mmol citrate) in 10 mL of 0.67 M citrate buffer. Once dissolved, the solution was heated to 200 °C for 4 h then cooled to room temperature with fan-assisted air flow. After NCD synthesis, the yellow solution was dialyzed, lyophilized, and dissolved in DI-H2O to the desired concentration (mg mL−1). A complete list of synthesized particles can be found in Table S1.†
:moles of citrate; i.e. “1:2” denoting 5 mmol of urea added to 10 mmol citrate) in 10 mL of 0.67 M citrate buffer. Once dissolved, the solution was heated to 200 °C for 4 h then cooled to room temperature with fan-assisted air flow. After NCD synthesis, the yellow solution was dialyzed, lyophilized, and dissolved in DI-H2O to the desired concentration (mg mL−1). A complete list of synthesized particles can be found in Table S1.†
CD and NCD characterization
To determine the absorbance spectrum of CDs and NCDs, spectrophotometric measurements were taken. CDs and NCDs were dissolved in water to 2–2.5 mg mL−1 and 1 mL was added to a quartz cuvette and loaded into a Cary 5000-Bio UV-Vis spectrometer.Fluorescence measurements of CDs and NCDs were made on a Cary Eclipse fluorescence spectrophotometer. Time-resolved photoluminescence (PL) measurements were performed with solutions dispersed on glass slides (Fisher Scientific, Pittsburgh, PA) using a custom-built epi-fluorescence microscope following Orfield et al. as modified from Dukes et al.47,48 Samples were excited under wide-field illumination using a 405 nm PicoQuant pulsed diode laser with a repetition rate of 2.5 MHz. The beam was reflected with a 420 nm long pass (LP) dichroic filter (Omega Optics, 3RD420LP) into an inverted objective (Olympus UPLSAPO, apochromatic, water immersion, 1.2 N.A., 60 × x) and brought into focus at the sample. Fluorescence from the focal region was collected by the same objective, passed through the dichroic filter, further filtered by a 450 nm LP dichroic filter, and focused through a 150 μm aperture onto a single-photon avalanche photodiode (SPAD, Micro Photon Devices PD-050-0TC). A time-correlated single photon-counting unit (TCSPC, PicoHarp 300, ∼35 ps) was used to generate a histogram of photon arrival times. The obtained PL decay curves were fitted using a multi exponential function:
 | (1) |
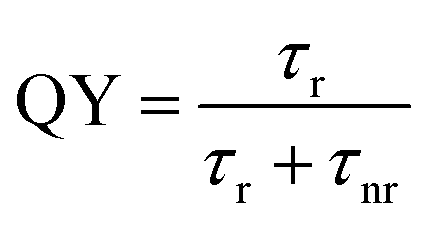 | (2) |
PL spectra were collected on an ISS PC1 photon counting spectrofluorometer using a 300 W Xe arc lamp as the excitation source. PL was measured with a 1 s integration time and a 1 mm slit width. Quantum yield (QY) measurements were determined by comparing the PL of the CD samples to that of a reference dye (coumarin 152A in hexanes, QY ∼ 100%). All samples and dyes used were diluted in their respective solvents so that their optical densities (OD) at the excitation wavelength were less than 0.1.
Infrared spectroscopy measurements of solid CD and NCD samples were made on a Nicolet iS 5 FTIR spectrometer using an ATR-IR crystal attachment for solid sample analysis.
High resolution transmission electron microscopy (TEM) was performed on a FEI Tecnai Osiris 200 keV transmission electron microscope. CDs and NCDs were deposited onto lacy carbon-coated copper grids (Ted Pella, Redding, CA) by dip-coating grids in a 2.5 mg mL−1 solution and air-drying overnight.
X-ray photoelectron spectroscopy (XPS) analyses were performed using an Ulvac-PHI Versaprobe 5000. Solutions of the particles were drop cast onto pieces of a silicon wafer, which were then mounted onto a sample holder using BeCu clips. A 100 μm diameter monochromatic Al Kα X-ray (1486 eV) beam rastered over an approximately 800 μm by 400 μm area and a takeoff angle of 45 degrees off sample normal were used in each acquisition. Pass energies of 187.7 eV and 23.5 eV were used for the survey and high-resolution acquisitions, respectively. Charge neutralization was accomplished using 1.1 eV electrons and 10 eV Ar+ ions. Binding energies were calibrated by setting the peak corresponding to –CH2– type bonding in the high-resolution carbon 1s spectrum acquired from each sample to 284.8 eV.
Electrochemical characterization was performed on a CHI-660a electrochemical workstation using a three-electrode setup in a 25 mL 3-neck round bottom flask. A 3 mm glassy carbon disk electrode (CH instruments, Austin, TX) was used as the working electrode, a homemade platinum mesh was used as the counter electrode, and a 3 M Ag/AgCl electrode (CH instruments) was used as the reference electrode. The electrolyte solution used for each measurement consisted of 100 mM KCl. Prior to each measurement, the glassy carbon electrode was cleaned by first hand-polishing using a polishing wheel with 0.05 μm alumina MicroPolish (Buehler, Ltd, Lake Bluff, IL), then sonicating for 15 s in distilled water, and finally drying with a stream of nitrogen gas. The platinum counter electrode was flame polished on an open flame prior to each run.
For all electrochemical measurements, approximately 20 mL of aqueous 100 mM KCl electrolyte solution was deoxygenated with nitrogen for 15–20 min. The glassy carbon working electrode was conditioned in deoxygenated electrolyte solution using a 100 cycle cyclic voltammetry experiment between 1.0 V and −1.0 V at a scan rate of 200 mV s−1. Background cyclic voltammograms were recorded prior to the addition of purified CD solutions at scan rates of 50, 100, 200, and 300 mV s−1 and used for background subtraction when specified. Cyclic voltammograms were recorded by scanning in the negative direction followed by a positive potential sweep using the potential window and scan rate denoted per figure. Linear sweep voltammetry followed the same general experimental workflow.
Results and discussion
CD and NCD synthesis and characterization
CDs and NCDs were produced using a hydrothermal, bottom-up synthesis that was capable of tuning the electrochemical properties by varying the doping quantities in the reaction solution. The doping quantities were, in turn, controlled by varying the concentration of heteroatoms present in the reaction mixture through the addition of urea to the citrate buffer.4,16 This synthesis was adapted from Qu et al. who reported the successful synthesis of CDs and NCDs by the hydrothermally reacting aqueous citric acid solution containing either an excess of base (sodium hydroxide) or alkaline dopant (urea, ethylenediamine, or diethyl amine).26 Presumably, in this synthesis the increase in pH from the addition of base or alkaline dopant facilitated the dehydration and polymerization reactions between citrate molecules, a critical step in the citrate-based CD formation mechanism. In our modified synthetic scheme, the pH is increased by buffer rather than dopant (Fig. 1). By decoupling the role of the base and the dopant, lower ratios of dopant could be added to the reaction mixture without impeding solution conditions necessary for CD or NCD formation.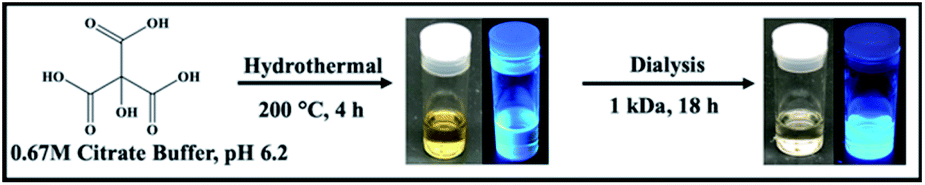 | ||
| Fig. 1 Representation of the CD synthetic scheme. For NCD synthesis, varying amount of urea (denoted as moles urea:citrate) was dissolved in the citrate buffer prior to hydrothermal treatment. Photographs of NCDs under ambient and UV (365 nm) light. | ||
The resulting CDs or NCDs products were first subjected to purification via dialysis. Before and after purification, CDs and NCDs exhibit a yellow and pale-yellow color, respectively, with higher doping ratios leading to visibly darker solutions. The need for purification was also apparent in obstructed TEM images (Fig. S1A†) and broad absorbance spectra (Fig. S4B†) of undialyzed product emphasizing the need for purification of these materials prior to use. All products were therefore subjected to purification via dialysis with a 1 kDa cutoff membrane prior to lyophilization to remove unwanted byproducts.
Following purification, the size, crystallinity, and polydispersity of synthesized CDs were investigated to assess the quality of the formed material. Changes in the doping ratio did not impact the size distribution of the produced NCDs indicating that the citrate molecules were responsible for the majority of the CD or NCD composition (Fig. S2†). Following a 4 h synthesis, the produced CDs (Fig. 2A) and NCDs (Fig. 2D) exhibited diameters of 2.5 ± 0.3 nm and 3.0 ± 0.5 nm, respectively, with both amorphous and crystalline particles present (Fig. 2B). The fast Fourier transform (FFT) revealed that crystalline particles exhibited a d-spacing of 2.40 Å for undoped CDs (Fig. 2C) and 2.45 Å for NCDs, which are both in agreement with the [100] plane of graphite.49 High resolution C(1s) spectra also confirm the graphitic nature of both CDs and NCDs, with strong peaks at 284.8 eV identifying the presence of graphitic C–C/C![[double bond, length as m-dash]](https://www.rsc.org/images/entities/char_e001.gif) C bonding (Fig. S3†). These results are also in agreement with previously reported CD syntheses in the literature, supporting a sequential dehydration and polymerization of citrate molecules into nanoparticles as proposed by many groups in the field.19,22,26,50 When longer synthetic times were employed the resulting particles increased in both size and polydispersity across all doped and undoped samples (Fig. 2E). This change in size and distribution is expected under the proposed CD formation scheme suggesting a similar if not identical process is at work under our novel buffer-assisted CD synthesis.26
C bonding (Fig. S3†). These results are also in agreement with previously reported CD syntheses in the literature, supporting a sequential dehydration and polymerization of citrate molecules into nanoparticles as proposed by many groups in the field.19,22,26,50 When longer synthetic times were employed the resulting particles increased in both size and polydispersity across all doped and undoped samples (Fig. 2E). This change in size and distribution is expected under the proposed CD formation scheme suggesting a similar if not identical process is at work under our novel buffer-assisted CD synthesis.26
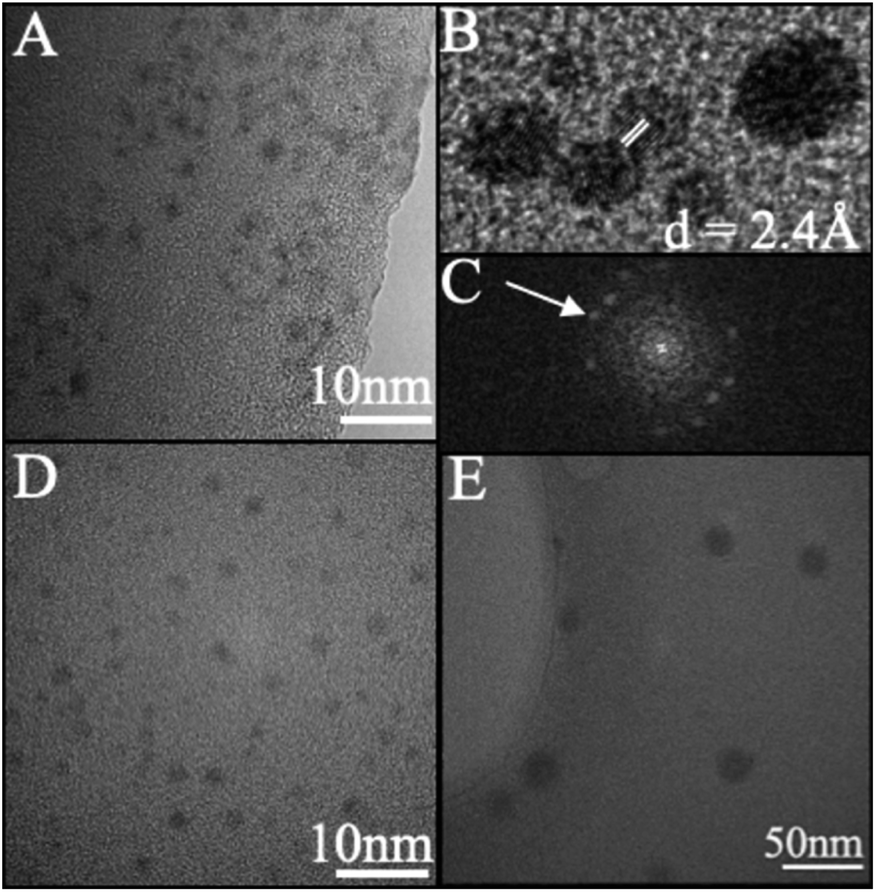 | ||
| Fig. 2 Representative TEM image of (A) undoped CDs, 4 h reaction time (diameter = 2.5 ± 0.3 nm). (B) Undoped CDs, 4 h reaction time exhibiting lattice. (C) FFT of (B) with spots matching lattice fringes at a d-spacing of 2.40 Å. (D) 1:2 NCD, 4 h (3.0 ± 0.5 nm). (E) Undoped CD, 24 h (diameter = 16 ± 2 nm). All experiments were performed at room temperature under 200 keV acceleration voltage and images were processed using ImageJ. | ||
Optical characterization of CDs and NCDs
The synthetic precursors, citrate and urea, both had featureless absorbance spectra in all but the deep UV region (Fig. S4A†). Therefore, any significant change in the observed absorbance following CD purification must be due to products of the hydrothermal treatment. The absorption spectrum of undoped CDs demonstrated a sharp absorption edge beginning at 270–280 nm, indicative of π → π* transitions within sp2 hybridized carbon (Fig. 3A).51 FTIR spectra collected on the lyophilized CD samples confirmed the presence of multiple sp2 and sp3 hybridized carbon-containing functional groups such as carbonyl, carboxyl, and alkene groups which contain pi-bonded electrons capable of undergoing π → π* transitions explaining possible sources of these optical transitions in undoped CDs (Fig. S5†).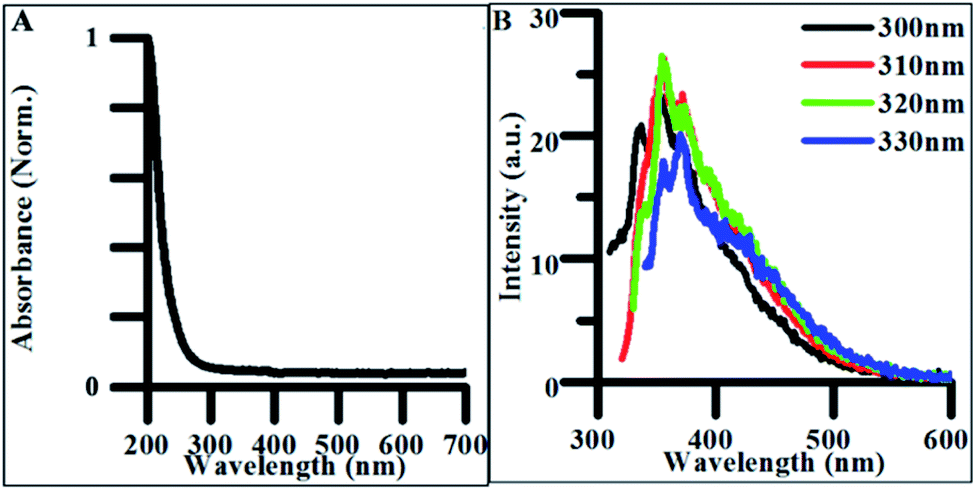 | ||
| Fig. 3 (A) Normalized absorbance spectrum of undoped CDs synthesized for 4 h. (B) Excitation-independent emission spectra for undoped CDs synthesized for 4 h. | ||
When longer hydrothermal reaction times were employed in the preparation of undoped CDs, no significant change in the absorption profile was observed, indicating that no new electronic transitions formed as a result of the extended reaction time (Fig. S4C†).
When excited between 300 and 330 nm, CDs exhibited weak excitation-independent emission spectra (Fig. 3B). The majority of this emission is believed to be due to radiative recombination of excitons within the carbon–oxygen containing functional groups in the CDs. The origin of fluorescence in carbon materials is highly debated in the literature as both excitation-dependent and excitation-independent behavior have been characterized.3,52 Excitation-independent emissive behavior is believed to be the result of both the uniformity of particle size and homogeneity of functional groups throughout the CD structure. This dependence on uniformity and functional groups explains why optical properties are closely tied to synthetic methods and precursors.36 Therefore, decreasing the uniformity in the distribution and density of electronic states expressed in the produced particles should result in excitation-dependent behavior in the synthesized product. This was verified in the photoluminescence of polydisperse undoped CD samples reacted for 24 h (Fig. S6A†), where the emission peak redshifted from ∼425 to ∼475 nm as the excitation energy increased from 300 to 400 nm. The shift in fluorescence from excitation-independent to excitation-dependent behavior with increased reaction time suggests particles synthesized under 4 h synthetic conditions exhibit more highly uniform surface morphologies and size distributions than those formed from longer hydrothermal reactions making them more applicable for general biomedical and energy harvesting applications.
The addition of any concentration of nitrogen-containing dopants into the synthesis significantly impacted the optical properties of the materials. The absorbance spectra of NCDs exhibited the same absorption edge as the CDs in the UV region (280–300 nm) as well as a new peak at 340 nm, attributed to n → π* electronic transitions, suggesting new electronic states tied to new functional groups resulting from heteroatom doping (Fig. 4A).3,53–55 The FTIR analysis of NCD materials shows many of the same stretches and bends attributed to the carbon–oxygen containing functional groups found in undoped CDs, while also confirming the presence of new nitrogen containing groups such as pyrrolic nitrogen, nitriles, and amines based new peaks observed in the spectrum (Fig. S5†). These additional functional groups are all associated with nonbonding electrons capable of undergoing n → π* transitions and are likely the source of new intrinsic optical properties as seen in other syntheses of NCDs.56
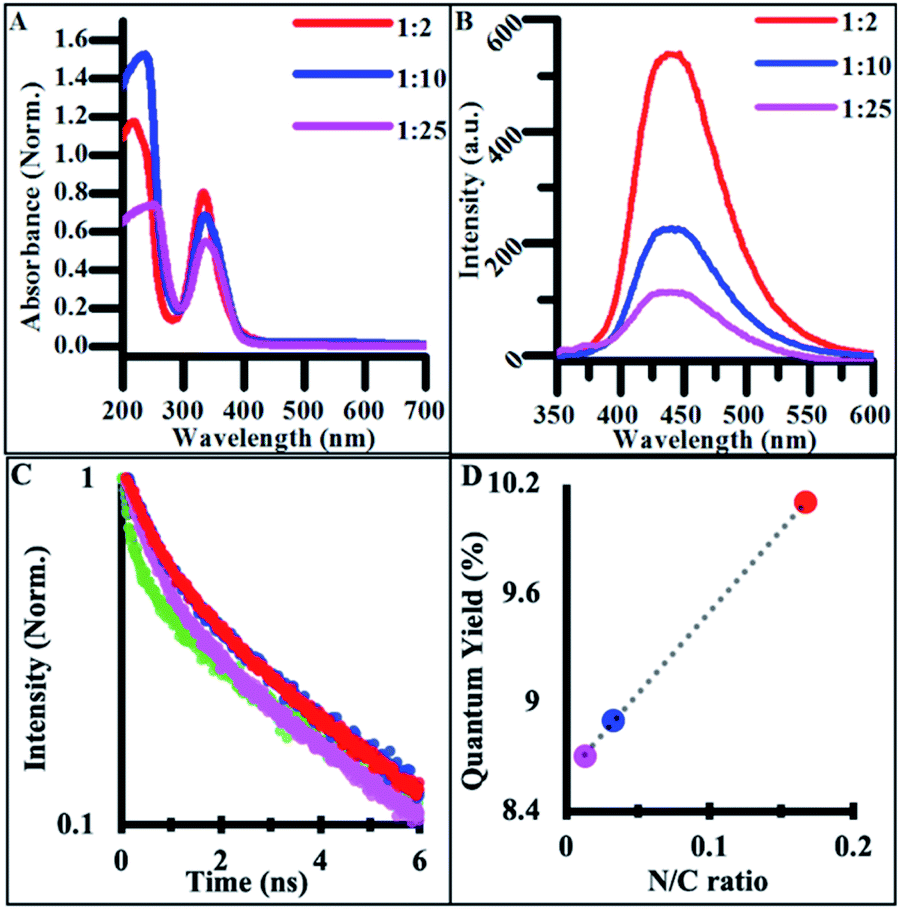 | ||
| Fig. 4 (A) Normalized absorbance spectra of synthesized NCDs under varying doping ratios. (B) Excitation-independent emission spectra NCD samples under 340 nm excitation light. (All CD solutions measured at concentrations of 2.5 mg mL−1). (C) Relative quantum yields for synthesized doped and undoped carbon materials. (D) Relative lifetime emission measurements of doped and undoped CD materials with third order polynomial best fits. | ||
The emission spectra of NCDs also featured excitation-independent behavior, suggesting that fluorescence is tied to functional groups rather than other structure-based mechanisms such as core–shell behavior.57 NCD emission redshifted and increased in intensity with doping when compared to undoped CDs (Fig. 4B).53,54 The drastic increase in quantum yield (QY) from undoped CDs to highly doped NCDs is believed to originate from different electronic states and emissive pathways tied to the new nitrogen-containing functional groups. When batches of NCDs synthesized under different doping ratios were compared, the quantum yield systematically increased with the increase in the nitrogen/carbon ratio while the emission wavelength stayed constant (Fig. 4C). This systematic increase in QY suggests that many of the same functional groups are present across batches of doped NCDs but in different quantities. Additionally, many of the same electronic transitions identified in undoped CDs are still present in NCDs as seen in the FTIR spectra, however their low emission intensity is masked by those of the dopant-containing functional groups when the ratio of dopant to citrate molecule in the reaction mixture is significantly large. Additionally, when NCD batches were synthesized for 24 h, a similar transition to excitation-dependent emission was observed as with undoped CDs suggesting the same dehydration/polymerization formation mechanism is at work in the reported synthesis regardless of the presence of dopant in the reaction (Fig. S6†). As such, NCDs synthesized for under 4 h of reaction time exhibit uniform surface functionalization, size, and optical emission, promoting their use in a variety of biological or energy harvesting applications.
In order to further compare the emissive behavior of doped and undoped carbon dots, the time-resolved photoluminescence (PL) was measured and fit to the best order polynomial (Fig. 4D). The PL traces were fit with tri-exponential decay functions, providing three time-constants (Table 1) that were then used to calculate amplitude-weighted average PL lifetimes, τw. Each CD and NCD sample exhibited a τw of 2–3 ns, which agrees with previous lifetime measurements conducted on hydrothermally synthesized NCDs from other groups (Table 1).58
| τ w (ns) | τ 1 (ns) | τ 2 (ns) | τ 3 (ns) | χ 2 | Quantum yield | |
|---|---|---|---|---|---|---|
| 1:2 NCD |
2.64 | 0.70 | 3.26 | 8.52 | 1.33 | 10.1% |
| 1:10 NCD |
2.61 | 0.65 | 3.35 | 8.27 | 1.19 | 8.9% |
| 1:25 NCD |
2.38 | 0.57 | 2.95 | 8.63 | 1.20 | 8.7% |
| Undoped CD | 2.25 | 0.26 | 3.06 | 7.17 | 1.19 | 0.9% |
The origin of CD and NCD fluorescence is complex, originating from multiple emissive transitions amongst electronic states contributed by diverse functional groups within the CD structure.16 Across the samples, there was a slight increase in the average radiative lifetime of the CDs with the increase of dopant concentration. The undoped CDs exhibited the shortest lifetime, at 2.25 ns, while the 1:2 NCDs exhibited the longest lifetime, at 2.64 ns. This change in lifetime indicates that the addition of nitrogen groups provides a more efficient radiative recombination center in the CDs. Conversely, the non-radiative component of the undoped CDs (239 ns) was an order of magnitude larger than those of the NCDs (∼25 ns). The significant difference in the non-radiative component between the doped and undoped samples further confirms the idea that nitrogen functional groups are responsible for new non-radiative pathways that are much faster than those present in undoped CDs.
High resolution XPS of the N(1s) region confirms the presence of new nitrogen-containing functional groups following the doping procedure. The 1:2 NCD (Fig. 5B) and 1:10 NCD (Fig. 5C) spectra show clear N(1s) signals, with the relative intensity of the 1:2 NCD spectra being much greater than that of the 1:10 NCD. The difference in peak intensity suggests that higher doping concentrations during synthesis create more nitrogen functional groups throughout the carbon dot, leading to the enhanced absorbance and fluorescence properties observed. The identity of these functional groups, when compared to the corresponding FTIR spectra, are most likely pyridinic (–C3N/C–NC) and pyrrolic nitrogen (C–N–C) at 398.5 eV and 400 eV, respectively, verifying their incorporation into the nanoparticle.16,59–61 In the 1:25 NCD spectrum, a weak nitrogen signal was detected (Fig. 5D), however its low intensity relative to the baseline prevented confident fitting of the peak. Likewise, the undoped CD samples showed no evidence of a nitrogen peak (Fig. 5A).
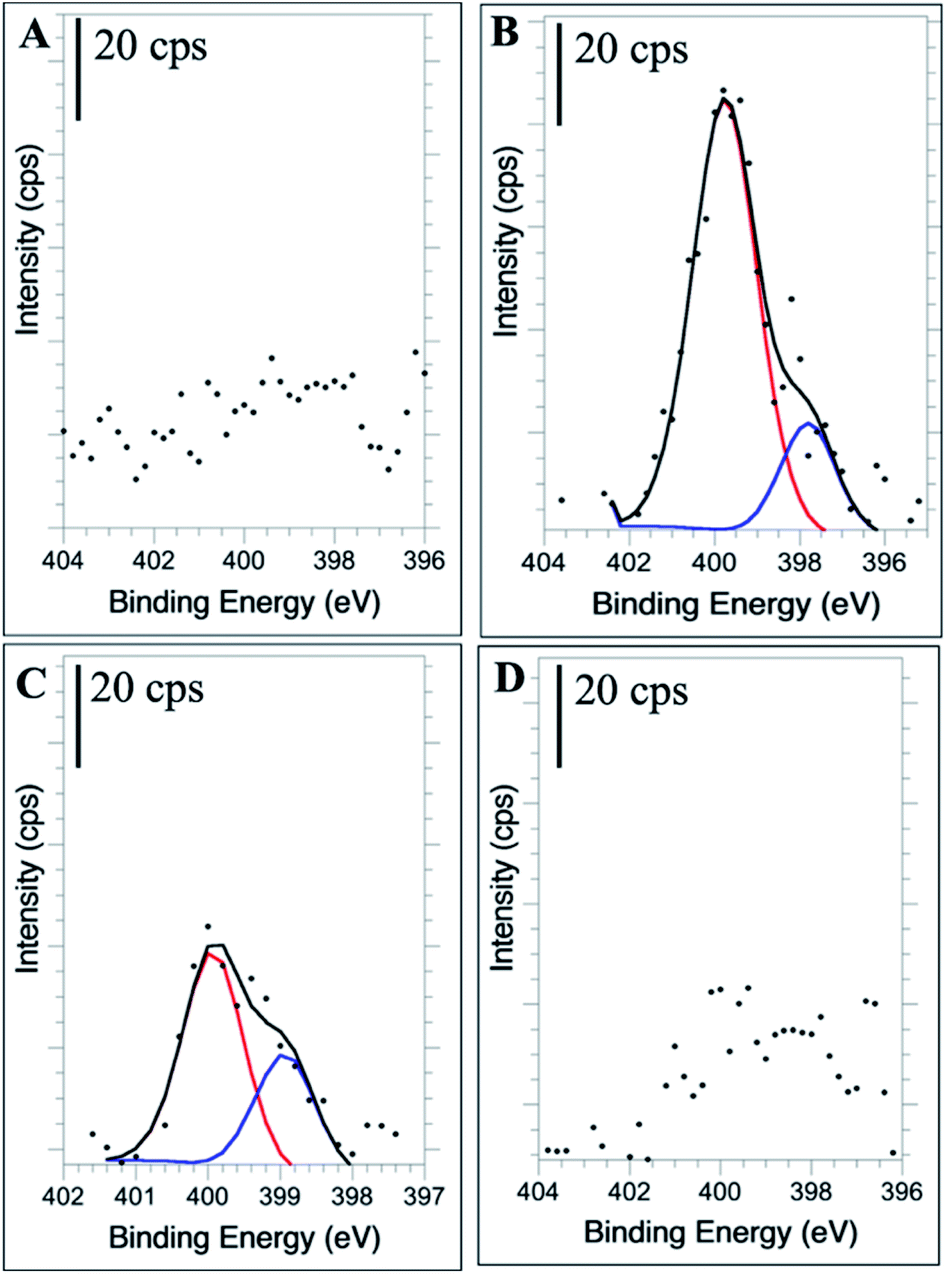 | ||
| Fig. 5 High resolution N 1s XPS spectra of undoped CDs (A), 1:2 NCDs (B), 1:10 NCDs (C), and 1:25 NCDs (D). | ||
Interestingly, as the radiative lifetime of the NCDs increases with dopant concentration, the non-radiative component remains relatively unchanged indicating that the efficiency of the new non-radiative pathway is not dependent on the structural changes induced by higher concentrations of doping during the carbon dot synthesis. The carboxyl groups, which are assumed to be the main radiative centers in undoped CDs, likely still contribute a radiative pathway in the NCDs, but because this pathway is highly inefficient it becomes masked as the dopant concentration, and resulting amount of nitrogen functional groups, increase. High resolution XPS spectra of the C(1s) peak confirm this rationale, as there is little change between the corresponding spectra from the undoped and doped CDs (Fig. S3†). The changes observed in the emissive properties of CDs and NCDS with respect to doping highlight how many intrinsic properties of the materials are structurally dependent and thus, easily modifiable doping routes can lead to carbon dots exhibiting a range of properties.
Electrochemical characterization of CDs and NCDs
To apply CD materials to energy harvesting applications, attaining the proper oxidation and reduction potential is crucial in ensuring efficient band alignment between adjacent materials. Using carbon dots doped to varying degrees, electrochemical properties were measured to identify the dependence of the doping concentration on redox potential.Cyclic voltammetry (CV) of undoped CDs synthesized for 4 h showed two prominent oxidations peak potentials (denoted Eox,1 and Eox,2, Fig. 6A), in both the initial scans as well as the background subtracted scan (Fig. 6A inset). Only a single reduction reaction (Ered) was observed in the potential window tested for the undoped CDs at around −0.44 V (vs. Ag/AgCl). Varying the particle size did not significantly change the observed oxidation and reduction potentials, indicating that size had no impact on the energetics of observed electrochemical properties and, as such, 4 h syntheses were used for all electrochemically tested materials (Fig. S7†).
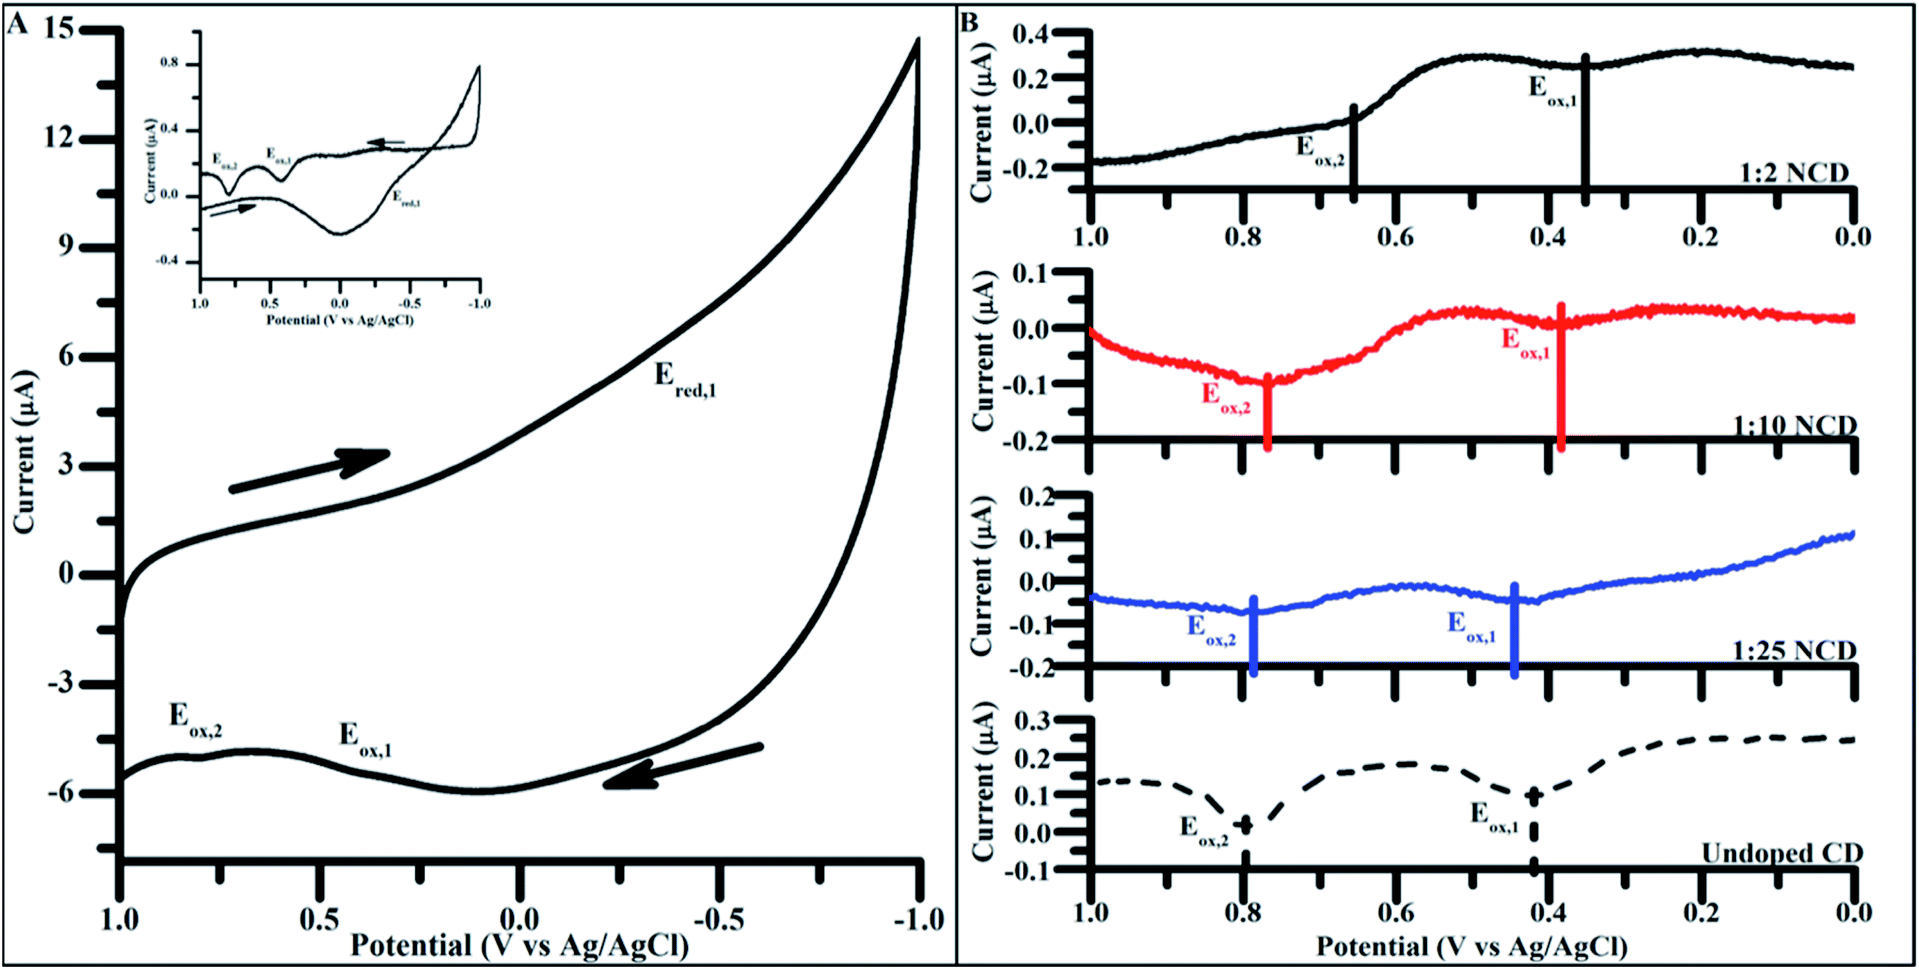 | ||
| Fig. 6 (A) Cyclic voltammograms of undoped CDs, 4 h. (Inset: background subtracted 4 h undoped CD cyclic voltammogram. Background scans performed over the same potential window in mediator containing only 100 mM KCl). Scans taken at 200 mV s−1 from 1.0 V to −1.0 V (vs. Ag/AgCl) in 100 mM KCl. Arrows indicate direction of potential sweep. (B) Positive potential sweeps of NCDs synthesized with increasing amounts of urea (undoped CD < 1:25 NCD < 1:10 NCD < 1:2 NCD). Scans taken at 200 mV s−1 from 0.0 V to 1.0 V (vs. Ag/AgCl) in 100 mM KCl. (Background subtracted negative scans as well as full cyclic voltammograms present in Fig. S7†). | ||
The same electrochemical analysis was carried out on NCDs synthesized under varying doping ratios. Sweeping the potential in a positive direction showed two distinct oxidation peaks in all NCD samples as seen in the undoped CDs (Fig. 6B). When comparing the Ep of the two oxidation peaks across different doping concentrations for NCD preparation, a shift of Eox,1 and Eox,2 to more negative potentials occurs with increased dopant levels. Over the range of dopants tested, Eox,1 and Eox,2 shift 100 mV and 150 mV more negative, respectively, without the need of any post-synthesis surface modifications (Table 2).
| E ox,1 (V vs. Ag/AgCl) | E ox,2 (V vs. Ag/AgCl) | |
|---|---|---|
| 1:2 NCD |
0.35 ± 0.02 | 0.65 ± 0.001 |
| 1:10 NCD |
0.40 ± 0.02 | 0.75 ± 0.02 |
| 1:25 NCD |
0.39 ± 0.03 | 0.79 ± 0.01 |
| Undoped CD | 0.45 ± 0.03 | 0.81 ± 0.02 |
Nitrogen is considered to be an n-type dopant with respect to carbon, meaning that the inclusion of pyrrolic and pyridinic nitrogen in the particle introduces more electron density to the particle in the form of nonbonding electrons. Pyrrolic and pyridinic nitrogen content in carbon materials are believed to affect catalytic properties of carbon in oxygen reduction, suggesting that such nitrogen groups are also responsible for the observed changes in carbon dot electrochemical properties.44,62,63 Increasing the ratio of nitrogen-containing groups to oxygen or carbon-containing groups in the CD effectively shift the particle composition from electron withdrawing to electron donating groups, which could explain the overall negative shift in oxidative peak potential of the particle surface as the doping ratio is systematically increased over the range of tested dopant levels.41,64
To further characterize the electrochemical properties of the as produced CDs and NCDs, the correlation between peak current (ip) and scan rate (ν) was studied using linear sweep voltammetry (LSV) (Fig. S8A†). When the ip was plotted against ν1/2 and ν (Fig. S8B and C†), the increase in current was found to be more linear with ν1/2 (Fig. S9†) indicating that electron transfer was governed by diffusion of the carbon dots to and from the electrode surface, rather than an absorption step.65,66 The same linear dependence on ν1/2 was seen for 1:2 NCDs (Fig. S10†). This is of particular interest in energy harvesting applications as it promotes the use of carbon nanoparticles as freely diffusing mediators or tunable, environmentally benign catalysts in photoelectrochemical applications without the need for post-synthesis surface functionalization.
Conclusions
In this work CDs and NCDs were synthesized using a buffer-assisted hydrothermal synthesis. A variety of NCDs were produced and exhibited tunability in regard to both optical and electrical properties, notably quantum yield and oxidation potential. While it was understood that nitrogen doping can increase the emissive properties of CDs, our findings suggest that many of the same emissive groups contribute to the electrochemical performance of the carbon dots. The negative shift in oxidative peak potential and gradual increase in quantum yield indicate that the new pyrrolic and pyridinic sites contained both on the surface and in the core of the carbon dot play a key role in defining the electronic structure of carbon dot materials. In the case of nitrogen doping, the new electronic states tied to these nitrogen-containing functional groups contribute more emissive electronic pathways. These new electronic states could also contribute new non-bonding electrons more accessible to oxidation than pi-bonded electrons shared amongst sp2-functionalized carbon. When assessing carbon nanomaterials for uses in various applications, varying the doping ratio during synthesis provides a quick and efficient way to tune CD compatibility with additional materials without the need of additional chemical modifications.Conflicts of interest
The authors declare no conflict of interest.Acknowledgements
We would like to thank the Buchannan Lab of Vanderbilt University for their use of the lyophilizer used in isolating carbon dots. We would also like to thanks Dr Bridget Rogers for acquiring the XPS spectra for CD and NCD samples. This work was supported by the U.S. Department of Agriculture (2019-67021-29857) and the National Science Foundation (DMR-1507505; DMR-0619789; CHE-1506587). The authors would like to extend special thanks to the Vanderbilt Institute of Nanoscale Science and Engineering for use of their instrumentation and lab space (NSF EPS 1004083).Notes and references
- R. Wang, K. Q. Lu, Z. R. Tang and Y. J. Xu, J. Mater. Chem. A, 2017, 5, 3717–3734 RSC.
- X. Xu, R. Ray, Y. Gu, H. J. Ploehn, L. Gearheart, K. Raker and W. A. Scrivens, J. Am. Chem. Soc., 2004, 126, 12736–12737 CrossRef CAS PubMed.
- H. Liu, Z. Li, Y. Sun, X. Geng, Y. Hu, H. Meng, J. Ge and L. Qu, Sci. Rep., 2018, 8, 1–8 CrossRef PubMed.
- Y. Meng, Y. Zhang, W. Sun, M. Wang, B. He, H. Chen and Q. Tang, Electrochim. Acta, 2017, 257, 259–266 CrossRef CAS.
- Q. Wang, X. Huang, Y. Long, X. Wang, H. Zhang, R. Zhu, L. Liang, P. Teng and H. Zheng, Carbon, 2013, 59, 192–199 CrossRef CAS.
- T. Kong, L. Hao, Y. Wei, X. Cai and B. Zhu, Cell Proliferation, 2018, 51, 1–9 CrossRef CAS PubMed.
- X. Zhang, F. Wang, H. Huang, H. Li, X. Han, Y. Liu and Z. Kang, Nanoscale, 2013, 5, 2274–2278 RSC.
- M. Rasmussen, A. Wingersky and S. D. Minteer, ECS Electrochem. Lett., 2013, 3, H1–H3 CrossRef.
- S. Paulo, E. Palomares and E. Martinez-Ferrero, Nanomaterials, 2016, 6, 1–20 CrossRef PubMed.
- J. C. G. Esteves da Silva and H. M. R. Gonçalves, TrAC, Trends Anal. Chem., 2011, 30, 1327–1336 CrossRef CAS.
- J. Zhang and S. H. Yu, Mater. Today, 2016, 19, 382–393 CrossRef CAS.
- S. K. Das, Y. Liu, S. Yeom, D. Y. Kim and C. I. Richards, Nano Lett., 2014, 14, 620–625 CrossRef CAS PubMed.
- S. Paulo, G. Stoica, W. Cambarau, E. Martinez-Ferrero and E. Palomares, Synth. Met., 2016, 222, 17–22 CrossRef CAS.
- Y. Wang and A. Hu, J. Mater. Chem. C, 2014, 2, 6921 RSC.
- S. Y. Lim, W. Shen and Z. Gao, Chem. Soc. Rev., 2015, 44, 362–381 RSC.
- D. Sun, R. Ban, P. H. Zhang, G. H. Wu, J. R. Zhang and J. J. Zhu, Carbon, 2013, 64, 424–434 CrossRef CAS.
- R. L. Calabro, D. S. Yang and D. Y. Kim, J. Colloid Interface Sci., 2018, 527, 132–140 CrossRef CAS PubMed.
- F. Rigodanza, L. Đorđević, F. Arcudi and M. Prato, Angew. Chem., Int. Ed., 2018, 57, 5062–5067 CrossRef CAS PubMed.
- F. Du, J. Yuan, M. Zhang, J. Li, Z. Zhou, Z. Li, M. Cao, J. Chen, L. Zhang, X. Liu, A. Gong, W. Xu and Q. Shao, RSC Adv., 2014, 4, 37536 RSC.
- L. Yan, Y. Yang, C.-Q. Ma, X. Liu, H. Wang and B. Xu, Carbon, 2016, 109, 598–607 CrossRef CAS.
- B. De and N. Karak, RSC Adv., 2013, 3, 8286 RSC.
- Y. Dong, H. Pang, H. Bin Yang, C. Guo, J. Shao, Y. Chi, C. M. Li and T. Yu, Angew. Chem., Int. Ed., 2013, 52, 7800–7804 CrossRef CAS PubMed.
- H. Zhang, Y. Chen, M. Liang, L. Xu, S. Qi, H. Chen and X. Chen, Anal. Chem., 2014, 86, 9846–9852 CrossRef CAS PubMed.
- H. Peng and J. Travas-Sejdic, Chem. Mater., 2009, 21, 5563–5565 CrossRef CAS.
- D. Qu, M. Zheng, P. Du, Y. Zhou, L. Zhang, D. Li, H. Tan, Z. Zhao, Z. Xie and Z. Sun, Nanoscale, 2013, 5, 12272–12277 RSC.
- D. Qu, M. Zheng, L. Zhang, H. Zhao, Z. Xie, X. Jing, R. E. Haddad, H. Fan and Z. Sun, Sci. Rep., 2014, 4, 1–9 Search PubMed.
- K. Jiang, S. Sun, L. Zhang, Y. Lu, A. Wu, C. Cai and H. Lin, Angew. Chem., Int. Ed., 2015, 54, 5360–5363 CrossRef CAS PubMed.
- H. Ding, S. B. Yu, J. S. Wei and H. M. Xiong, ACS Nano, 2016, 10, 484–491 CrossRef CAS PubMed.
- C. S. Lim, K. Hola, A. Ambrosi, R. Zboril and M. Pumera, Electrochem. Commun., 2015, 52, 75–79 CrossRef CAS.
- S. Liao, F. Zhu, X. Zhao, H. Yang and X. Chen, Sens. Actuators, B, 2018, 260, 156–164 CrossRef CAS.
- K. A. S. Fernando, S. Sahu, Y. Liu, W. K. Lewis, E. A. Guliants, A. Jafariyan, P. Wang, C. E. Bunker and Y. P. Sun, ACS Appl. Mater. Interfaces, 2015, 7, 8363–8376 CrossRef CAS PubMed.
- Z. Shen, X. Guo, L. Liu, J. Sunarso, G. Wang, S. Wang and S. Liu, ChemPhotoChem, 2017, 1, 470–478 CrossRef CAS.
- H. Wang, P. Sun, S. Cong, J. Wu, L. Gao, Y. Wang, X. Dai, Q. Yi and G. Zou, Nanoscale Res. Lett., 2016, 11, 1–6 CrossRef CAS PubMed.
- X. Wu, L. Wu, X. Cao, Y. Li, A. Liu and S. Liu, RSC Adv., 2018, 8, 20000–20006 RSC.
- Y. Zhang, Y. H. He, P. P. Cui, X. T. Feng, L. Chen, Y. Z. Yang and X. G. Liu, RSC Adv., 2015, 5, 40393–40401 RSC.
- K. Jiang, S. Sun, L. Zhang, Y. Wang, C. Cai and H. Lin, ACS Appl. Mater. Interfaces, 2015, 7, 23231–23238 CrossRef CAS PubMed.
- M. Sun, X. Ma, X. Chen, Y. Sun, X. Cui and Y. Lin, RSC Adv., 2014, 4, 1120–1127 RSC.
- Y. Li, Y. Hu, Y. Zhao, G. Shi, L. Deng, Y. Hou and L. Qu, Adv. Mater., 2011, 23, 776–780 CrossRef CAS PubMed.
- X. Wang, M. Zhang, X. Huo, W. Zhao, B. Kang, J. Xu and H. Chen, Nanoscale Adv., 2019, 1965–1969 RSC.
- H. Peng, Y. Li, C. Jiang, C. Luo, R. Qi and R. Huang, Carbon, 2016, 100, 386–394 CrossRef CAS.
- A. Privitera, M. Righetto, D. Mosconi, F. Lorandi, A. A. Isse, A. Moretto, R. Bozio, C. Ferrante and L. Franco, Phys. Chem. Chem. Phys., 2016, 18, 31286–31295 RSC.
- Y. Chen, M. Zheng, Y. Xiao, H. Dong, H. Zhang, J. Zhuang, H. Hu, B. Lei and Y. Liu, Adv. Mater., 2016, 28, 312–318 CrossRef CAS PubMed.
- Y. Liu, X. Gong, W. Dong, R. Zhou, S. Shuang and C. Dong, Talanta, 2018, 183, 61–69 CrossRef CAS PubMed.
- H. Jiang, L. Liu, K. Zhao, Z. Liu, X. Zhang and S. Hu, Electrochim. Acta, 2020, 337, 135758 CrossRef CAS.
- Y. Z. Fan, Y. Zhang, N. Li, S. G. Liu, T. Liu, N. B. Li and H. Q. Luo, Sens. Actuators, B, 2017, 240, 949–955 CrossRef CAS.
- P. Das, S. Ganguly, S. Mondal, M. Bose, A. K. Das, S. Banerjee and N. C. Das, Sens. Actuators, B, 2018, 266, 583–593 CrossRef CAS.
- N. J. Orfield, J. R. McBride, F. Wang, M. R. Buck, J. D. Keene, K. R. Reid, H. Htoon, J. A. Hollingsworth and S. J. Rosenthal, ACS Nano, 2016, 10, 1960–1968 CrossRef CAS PubMed.
- A. D. Dukes, P. C. Samson, J. D. Keene, L. M. Davis, J. P. Wikswo and S. J. Rosenthal, J. Phys. Chem. A, 2011, 115, 4076–4081 CrossRef CAS PubMed.
- D. D. L. Chung, J. Mater. Sci., 2002, 37, 1475–1489 CrossRef CAS.
- F. Gao, S. Ma, J. Li, K. Dai, X. Xiao, D. Zhao and W. Gong, Carbon, 2017, 112, 131–141 CrossRef CAS.
- M. Amjadi, T. Hallaj, H. Asadollahi, Z. Song, M. de Frutos and N. Hildebrandt, Sens. Actuators, B, 2017, 244, 425–432 CrossRef CAS.
- G. E. Lecroy, F. Messina, A. Sciortino, C. E. Bunker, P. Wang, K. A. S. Fernando and Y. P. Sun, J. Phys. Chem. C, 2017, 121, 28180–28186 CrossRef CAS.
- Y. H. Yuan, Z. X. Liu, R. S. Li, H. Y. Zou, M. Lin, H. Liu and C. Z. Huang, Nanoscale, 2016, 8, 6770–6776 RSC.
- Z. L. Wu, M. X. Gao, T. T. Wang, X. Y. Wan, L. L. Zheng and C. Z. Huang, Nanoscale, 2014, 6, 3868–3874 RSC.
- Z. Yang, M. Xu, Y. Liu, F. He, F. Gao, Y. Su, H. Wei and Y. Zhang, Nanoscale, 2014, 6, 1890–1895 RSC.
- C. Hu, M. Li, J. Qiu and Y.-P. Sun, Chem. Soc. Rev., 2019, 48, 2315–2337 RSC.
- Y.-P. Sun, B. Zhou, Y. Lin, W. Wang, K. A. S. Fernando, P. Pathak, M. J. Meziani, B. A. Harruff, X. Wang, H. Wang, P. G. Luo, H. Yang, E. Kose, B. Chen, L. M. Veca and S.-Y. Xie, J. Am. Chem. Soc., 2006, 128, 7756–7757 CrossRef CAS PubMed.
- Q. Zhang, C. Zhang, Z. Li, J. Ge, C. Li, C. Dong and S. Shuang, RSC Adv., 2015, 5, 95054–95060 RSC.
- X. Gong, W. Lu, M. C. Paau, Q. Hu, X. Wu, S. Shuang, C. Dong and M. M. F. Choi, Anal. Chim. Acta, 2015, 861, 74–84 CrossRef CAS PubMed.
- Y. Yang, X. Lin, W. Li, J. Ou, Z. Yuan, F. Xie, W. Hong, D. Yu, Y. Ma, Z. Chi and X. Chen, ACS Appl. Mater. Interfaces, 2017, 9, 14953–14959 CrossRef CAS PubMed.
- D. W. Zhang, N. Papaioannou, N. M. David, H. Luo, H. Gao, L. C. Tanase, T. Degousée, P. Samorì, A. Sapelkin, O. Fenwick, M. M. Titirici and S. Krause, Mater. Horiz., 2018, 5, 423–428 RSC.
- F. Lou, M. E. M. Buan, N. Muthuswamy, J. C. Walmsley, M. Ronning and D. Chen, J. Mater. Chem. A, 2015, 4, 1233–1243 RSC.
- K. Cong, M. Radtke, S. Stumpf, B. Schröter, D. G. G. McMillan, M. Rettenmayr and A. Ignaszak, Materials for Renewable and Sustainable Energy, 2015, 4, 1–11 CrossRef.
- K. M. Pelzer, L. Cheng and L. A. Curtiss, J. Phys. Chem. C, 2017, 121, 237–245 CrossRef CAS.
- A. J. Bard and L. R. Faulkner, Electrochemical Methods: Fundamentals and Applications, John Wiley & Sons, Inc., New York, 2nd edn, 2001 Search PubMed.
- S. N. Inamdar, P. P. Ingole and S. K. Haram, ChemPhysChem, 2008, 9, 2574–2579 CrossRef CAS PubMed.
Footnote |
| † Electronic supplementary information (ESI) available: Additional TEM micrographs of dialyzed and undialyzed product as well as additional doping ratios for NCD particles, additional absorbance spectra, FTIR characterization, additional fluorescence spectra for particles synthesized for 24 h, and complete cyclic voltammograms. See DOI: 10.1039/d0na00264j |
| This journal is © The Royal Society of Chemistry 2020 |