
 Open Access Article
 This Open Access Article is licensed under a Creative Commons Attribution-Non Commercial 3.0 Unported Licence
A hierarchical porous P-doped carbon electrode through hydrothermal carbonization of pomelo valves for high-performance supercapacitors†
Jing
Huang‡
 *a,
Jie
Chen‡
b,
Zhenyao
Yin
a and
Jinggao
Wu
c
*a,
Jie
Chen‡
b,
Zhenyao
Yin
a and
Jinggao
Wu
c
aState Key Laboratory of Silkworm Genome Biology, Key Laboratory of Sericultural Biology and Genetic Breeding, Ministry of Agriculture and Rural Affairs, College of Biotechnology, Southwest University, Chongqing 400715, P. R. China. E-mail: hj41012@163.com
bInstitute for Clean Energy & Advanced Materials, Chongqing 400715, P. R. China
cKey Laboratory of Rare Earth Optoelectronic Materials & Devices, College of Chemistry and Materials Engineering, Huaihua University, Huaihua 418000, P. R. China
First published on 22nd June 2020
Abstract
Porous carbon materials are synthesized from pomelo valves by the hydrothermal activation of H3PO4 followed by simple carbonization. The as-synthesized hierarchically porous carbon electrode exhibits a high specific capacitance of 966.4 F g−1 at 1 A g−1 and an ultra-high stability of 95.6% even after 10![[thin space (1/6-em)]](https://www.rsc.org/images/entities/char_2009.gif) 000 cycles. Moreover, the supercapacitor also demonstrates a maximum energy of 36.39 W h kg−1 and a maximum power of 33.33 kW kg−1 with an energy retention of 25.56 W h kg−1, which paves the way for the development of high-performance, green supercapacitors for advanced energy storage systems.
000 cycles. Moreover, the supercapacitor also demonstrates a maximum energy of 36.39 W h kg−1 and a maximum power of 33.33 kW kg−1 with an energy retention of 25.56 W h kg−1, which paves the way for the development of high-performance, green supercapacitors for advanced energy storage systems.
1. Introduction
The rapidly expanding market for portable electronic devices and hybrid vehicles is stimulating intensive research for developing cost-effective and eco-friendly energy storage devices.1–3 Energy storage devices play a crucial role in enabling the transition from fossil fuels to renewable energy sources.4–6 Supercapacitors feature ultrafast charge/discharge rates, high power densities, low maintenance costs, and long cycling lives as promising energy storage devices for electric vehicles, portable electronics, and stationary energy storage devices. They are classified into electrical double layer capacitors (EDLCs) and pseudocapacitors according to the different capacitive mechanisms.7–10Because the capacitance is proportional to the surface area of the electrode, carbon materials usually have good conductivities, abundant morphologies, and tunable surface properties with doping and/or surface functionalization, which are the main options to explore advanced EDLC electrode materials.11–13 Various carbon materials such as activated carbon (AC), carbon nanotubes (CNTs), and graphene have been intensively studied, and it has been demonstrated that there is still plenty of room to further improve the supercapacitive performance with new carbon architectures.14–16 In particular, porous carbon materials derived from biomass have attracted increasing attention due to their availability, chemical composition, environmentally friendly disposal and cost decrease associated with activated carbon production.17–20 More importantly, most biomass contains abundant hetero-atoms (e.g., oxygen, nitrogen, and sulfur) that can be in situ doped into carbon matrices during carbonization processes. These heteroatoms not only increase the wettability of the carbon material, but also contribute pseudo-capacitance.21–24
Several studies have dealt with functionalization of activated carbon to achieve the desired properties by grafting different surface groups at appropriate oxidation states.25–27 Among the methods for modification of AC properties, doping the carbon matrix with heteroatoms, such as oxygen, nitrogen, boron, sulfur, and phosphorus, is the most effective way to tailor the electronic structures and improve the surface properties. Oxygen functionalities are often present on the carbon surface, and their effect on the capacitive performance must be considered as they take part in faradaic interactions and thus significantly increase the specific capacitance of carbons in acidic aqueous supercapacitors. The conjugation of the lone-pair electrons of N and the graphitic π-bonds of carbon materials can further distort the carbon structure to create defects and available active sites, which has been extensively and deeply studied. However, the functional mechanism of the phosphorus configuration in the skeleton of P-doped carbon materials remains unclear.28–36
In this context, we report a novel type of porous P-enriched carbon material derived from pomelo valves through hydrothermal carbonization of H3PO4 (Scheme 1). By the way, the chemical bonding states of phosphorus with carbon and oxygen have been systematically explored and the type of P-doped configuration with the electrochemical performance has also been correlated. We expect that this research will pave the way for the identification of P-doped configuration and provide feasibility for the rational design of P-doped carbon materials with superior performance in many fields.
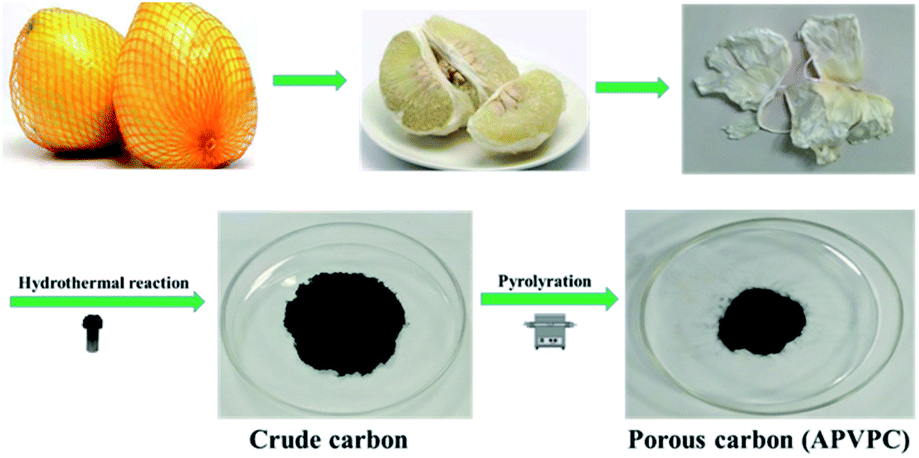 | ||
| Scheme 1 Synthesis of porous carbon from waste pomelo valves. | ||
2. Experimental section
2.1 Materials and methods
2.2 Characterization
The XRD patterns of all samples were recorded using powder X-ray diffraction (Shimadzu XRD-7000). The morphologies of the porous carbon materials were characterized using field emission scanning electron microscopy (FESEM, JSM-7800F) and high-resolution transmission electron microscopy (TEM, JEOL 2100) coupled with energy dispersive spectroscopy (EDS). Elemental analysis was carried out in a LECO CHNS microanalyzer. Nitrogen sorption isotherms were obtained using an Autosorb-1 (Quantachrome Instruments). The specific surface area was calculated using the modified Brunauer–Emmett–Teller (BET) method. The pore size distribution and the pore volume were analyzed from the adsorption branch isotherms by the density functional theory (DFT) method. Moreover, the total pore volume (Vt) was estimated from the amount adsorbed at a relative pressure P/P0 of 0.990. The micropore volume (Vmic) and micropore surface area (Smic) were determined using t-plot theory. Raman spectra were acquired with a Jobin-Yvon HR 800 spectrometer. X-ray photoelectron spectroscopy (XPS) measurements were performed on a Thermo Fisher Scientific instrument (Escalab 250xi, USA). Fourier transform infrared (FT-IR) spectra were recorded on a Thermo Scientific Nicolet iS 50 spectrometer.2.3 Electrochemical measurements
For the three-electrode system, the working electrode was fabricated through the dispersion of activated carbon in a mixed solution of Nafion and ethanol (1:20) dropped on a glassy carbon electrode; platinum foil and Hg/HgO were used as the counter and reference electrodes, respectively. The electrochemical capacitive performance was analyzed on an electrochemical workstation (Shanghai Chenhua Instrument Co. Ltd, China, CHI660D) at room temperature.
For the three-electrode system, the gravimetric specific capacitance, Csp (F g−1), can be calculated according to the following equations
| Csp = I × Δt/m × ΔV | (1) |
For the two-electrode system, the working electrodes were prepared by mixing the electroactive material, acetylene black, and polytetrafluoroethylene (PTFE) binder with a weight ratio of 8:1:1, followed by coating on foamed Ni grids (1 cm × 1 cm) and pressing under a pressure of 20 MPa as well as drying overnight at 80 °C. The mass of the active material loading in each working electrode was measured to be 2–3 mg cm−2. The symmetrical capacitor was assembled using two nearly identical working electrodes and a glass fiber membrane (Waterman, GF/B) as a separator as well as a 3 M KOH aqueous solution as the electrolyte.
For the two-electrode system, the gravimetric specific capacitance, Csp (F g−1), for a single electrode was calculated from each galvanostatic charge–discharge (GCD) curve using the following equation:
| Csp = 2I × Δt/m × ΔV | (2) |
The energy density E (W h kg−1) and the power density P (W kg−1) were estimated by using the following equations:
| E = CspV2/(2 × 3.6) | (3) |
| P = 3600E/Δt | (4) |
3. Results and discussion
3.1 Materials characterization
The detailed synthesis procedure of the APVPC is described in Scheme 1. It can be noted that H3PO4 activation plays an important role in the development of the pore structure in APVPC. In particular, the specific surface area (SSA) and the pore structure of the product are obviously influenced by the concentration of H3PO4. The sample produced with 85% H3PO4 is selected as a typical sample for characterization and used for SCs unless otherwise specified.The scanning electron microscopy (SEM) image (Fig. 1a) reveals that the APVPC-2 is made up of many carbon flakes with numerous uniformly sized mesopores and micropores through carbonizing the gelatinous tissue of pomelo valves, which are favorable for ion transport. Compared to the SEM image of APVPC-2, the PVPC (Fig. 1b) exhibits a monolithic morphology, implying that the activation of H3PO4 could help to form thin sheets of carbon and to create a porous structure. The high resolution TEM image of the APVPC-2 (Fig. 1c) demonstrates that the APVPC-2 consists of many carbon flakes with numerous nanopores of 1–3 nm in size, which contribute to a super high surface area. In addition to the connected thin layers, there are many amorphous carbon particles about 20 nm in diameter interconnected tightly, which are conducive to a high-rate-performance supercapacitor for facilitating the diffusion of electrolyte ions.37 Compared with that of APVPC-2, the TEM image of PVPC (Fig. 1d) indicates a highly defective micro- and mesoporous morphology surrounded by curved carbon, which confirms a highly disordered structure.38
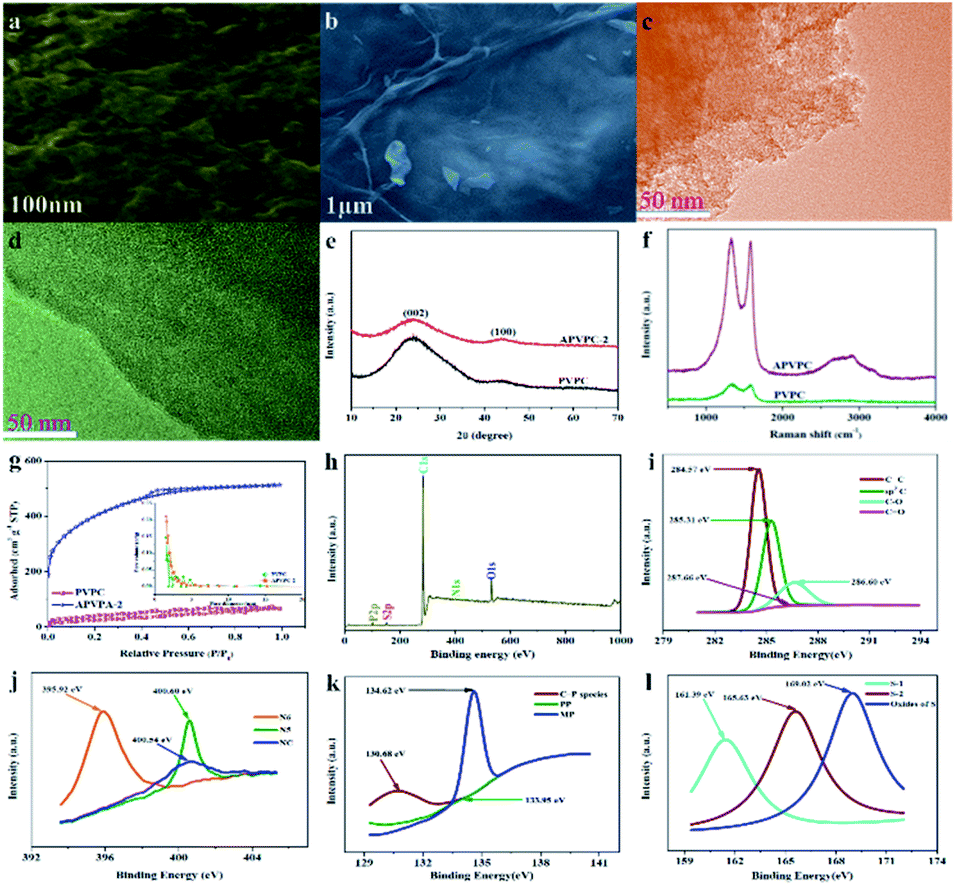 | ||
| Fig. 1 (a) SEM images of APVPC-2. (b) SEM images of PVPC. (c) TEM images of APVPC-2. (d) TEM images of PVPC. (e) XRD patterns of PVPC and APVPC-2. (f) Raman spectra of PVPC and APVPC-2. (g) N2 adsorption/desorption isotherms and the pore size distribution of APVPC-2 and PVPC. (h) XPS survey spectrum of APVPC-2. (i) High resolution C 1s spectrum of APVPC-2. (j) High resolution N 1s spectrum of APVPC-2. (k) High resolution P 2p spectrum of APVPC-2. (l) High resolution S 2p spectrum of APVPC-2. | ||
The X-ray diffraction (XRD) (Fig. 1e) patterns of the samples show two characteristic peaks located at 2θ values of 23.12° and 43.8°, corresponding to the (002) and (100) planes of graphitic carbon, respectively, and barely discernible peaks. The broad diffraction peak of carbon demonstrates the highly amorphous and disordered nature of porous carbon. Further, the high intensity in the low angle region may be ascribed to the existence of abundant micropores.39 Compared with the spectrum of APVPC-2, we can see that the water residue in the biomass tissue might be effective in increasing the porosity as the spectrum of PVPC shows a broader peak.40 In the Raman spectrum for APVPC-2 (Fig. 1f), the two peaks located at about 1331 and 1584 cm−1 correspond to the D (disordered carbon) and G (graphitic carbon) bands, respectively. The intensity ratio between D and G bands (ID/IG) is summarized in Fig. S2.† The ID/IG ratio obviously decreases from 1.051 for PVPC to 1.022 for APVPC-2 (Fig. S2a†), confirming that deeper activation decreased the presence of defects and the disordered section in the APVPC-2 sample,41 which agrees well with the XRD analysis and TEM images. However, the G band of APVPC-2 shows a higher redshift to 1584 cm−1 compared to that of pristine PVPC (1594 cm−1), which could be attributed to n-type substitutional doping of porous carbon and further confirms the heteroatom doping into the carbon framework.23 As for the effect of reaction time, the ID/IG ratio of APVPC-2 (1.022, 3 h) is obviously higher than that of APVPC-1 (0.948, 1 h) and APVPC-3 (0.96, 6 h) (Fig. S2b and c†), which indicates that the defect intensity gradually becomes stronger, and then turns slightly weaker at longer activation times. In addition, the ID/IG ratio increases along with the concentration of H3PO4 (1 M vs. 5 M vs. 10 M vs. 16 M H3PO4; APVPC-4 vs. APVPC-5 vs. APVPC-6 vs. APVPC-2; 0.927 vs. 0.941 vs. 0.958 vs. 1.022) (Fig. S2d and e†), which demonstrates that the graphitization intensity gradually becomes weaker. Based on the aforementioned results, the higher values for APVPC-2 indicate the highly disordered nature and heteroatom doping and could further contribute to the increase in electrical conductivity after heteroatom doping, which is due to broadening of van Hove singularities in the density of states making the Fermi level shift towards the conduction bands.8
Based on the apparent hysteresis loop at a relative pressure P/P0 from 0.4 to 0.9 (Fig. 1g), APVPC-2 possesses a well-ordered mesoporous structure, which agrees well with the pore size distribution calculated using the Barrett–Joyner–Halenda (BJH) model. Compared with PVPC, APVPC-2 has the widest pore size distribution, which results in a high nitrogen BET specific surface area of 1432.125 m2 g−1 (vs. 96.939 m2 g−1) with a pore volume of 0.718 cm3 g−1 (0.104 cm3 g−1). The SSA contributed by mesopores is determined to be about 115 m2 g−1. It is worth noting that the surface area of APVPC-2 is much higher than that of PVPC, further confirming that the activation of H3PO4 could effectively create holes and further increase the specific surface area. As shown in Table 1, all samples have both micropores (0–2 nm) and mesopores (2–50 nm), and the pore size is mainly ∼0.718 nm. Increasing the activation time from 1 h to 3 h generates a huge amount of gas (CO and CO2) from the activation agent (H3PO4) which favorably increases the textural properties (1 h vs. 3 h; 245.82 m2 g−1, 0.135 cm3 g−1vs. 1432.125 m2 g−1, 0.718 cm3 g−1; APVPC-1 vs. APVPC-2). However, further increasing the activation time to 6 h induces the pores to collapse, unfavorably resulting in the decrease of the textural properties (3 h vs. 6 h; 1432.125 m2 g−1, 0.718 cm3 g−1vs. 678.56 m2 g−1, 0.374 cm3 g−1; APVPC-2 vs. APVPC-3). Additionally, the textural properties also increase along with the concentration of H3PO4 (1 M vs. 5 M vs. 10 M vs. 16 M; from 373.664 to 1432.125 m2 g−1, from 0.144 cm3 g−1 to 0.718 cm3 g−1; APVPC-4 vs. APVPC-5 vs. APVPC-6 vs. APVPC-2). It is widely accepted that mesopores and macropores can provide electrolyte ion transport and diffusion channels, and the micropores offer space for ion storage energy.42 The high porosity greatly maximizes the ion adsorption sites, which could lead to high capacitance and provide quick electrolyte diffusion into deeper pores.43 Therefore, the as-prepared APVPC-2 should have a high specific capacitance and rate capability when applied as the electrode material in supercapacitors.
| Sample | S BET (m2 g−1) | V tot (cm3 g−1) | S mi (m2 g−1) | S me (m2 g−1) | S ma (m2 g−1) | V mi (cm3 g−1) | V me (cm3 g−1) | V ma (cm3 g−1) |
|---|---|---|---|---|---|---|---|---|
| a S BET: BET surface area. b V tot: total volume. c S mi: micropore surface area. d S me: mesopore surface area. e S ma: macropore surface area. f V mi: micropore volume. g V me: mesopore volume. h V ma: macropore volume. | ||||||||
| PVPC | 96.939 | 0.104 | 12.67 | 63.28 | 20.989 | 0.0162 | 0.0623 | 0.0255 |
| APVPC-1 | 245.82 | 0.135 | 86.132 | 105.62 | 54.068 | 0.0138 | 0.0461 | 0.0751 |
| APVPC-2 | 1432.125 | 0.718 | 349.06 | 969.377 | 113.688 | 0.175 | 0.486 | 0.058 |
| APVPC-3 | 678.56 | 0.374 | 213.62 | 268.53 | 196.41 | 0.102 | 0.153 | 0.119 |
| APVPC-4 | 373.664 | 0.144 | 121.56 | 134.89 | 117.214 | 0.319 | 0.157 | 0.255 |
| APVPC-5 | 421.694 | 0.224 | 163.72 | 136.26 | 121.714 | 0.0631 | 0.116 | 0.0449 |
| APVPC-6 | 631.502 | 0.624 | 168.42 | 251.68 | 211.402 | 0.168 | 0.235 | 0.221 |
For more information on the elemental chemical states of the heteroatoms in the APVPC-2, X-ray photoelectron spectroscopy (XPS) (Fig. 1h) is carried out and indicates five peaks at about 283.99, 399.94, 531.49, 128.12 and 163.8 eV corresponding to the C 1s, N 1s, O 1s, P 2p and S2p peaks, respectively. The relative percentages of the carbon species are given in Table 2. The results of elemental analysis reveal that the APVPC-2 mainly consists of C, N, O, P and S elements, and their contents are 62.86, 3.94, 32.28, 0.74 and 0.17 atom%, respectively, while for PVPC, the XPS spectrum also shows five peaks for C 1s, N 1s, O 1s, P 2p and S 2p at about 283.99, 399.94, 531.49, 128.12 and 163.8 eV, respectively. Meanwhile, the elemental contents for C, N, O, P and S are 91.72, 0.52, 7.63, 0.06 and 0.08%, respectively. Other possible metal impurities from the biomass source are below the detection limit; these could have been removed during the post-acid washing process. The high resolution C 1s spectra for APVPC-2 (Fig. 1i) have been resolved into four peaks centered at around 284.57, 285.31, 286.60, and 287.66 eV, which correspond to C![[double bond, length as m-dash]](https://www.rsc.org/images/entities/char_e001.gif) C, sp3C, C–O and CO,44 respectively. Moreover, the deconvoluted N 1s spectrum (Fig. 1j) contains three peaks, pyridinic-N (N-6, 395.92 eV), pyrrolic-N (N-5, 400.60 eV) and amides/amines or nitrile N (NC, 400.54 eV),45 which indicates the presence of nitrogen and further could improve the wettability and provide a large number of active sites for adsorption. In the 2p3/2 spectrum (Fig. 1k), the three peaks at 130.68 eV, 133.93 eV and 134.62 eV can be assigned to C–P species, pyrophosphate/polyphosphate (PP) and monophosphate/metaphosphate (MP) groups,46 respectively. After hydrothermal carbonization of pomelo valves through H3PO4-activation, the content of P is increased from 0.06 (PVPC) to 0.74 (APVPC-2), which confirms the successful phosphorus-doping of porous carbon. In addition, the high-resolution S 2p spectrum (Fig. 1l) shows three peaks at 161.39, 165.63 and 169.02 eV, which are attributed to CS and C–S bonds and the oxides of sulfur.47 Thus, the XPS results also demonstrate the existence of heteroatoms such as N, O, P and S-containing functional groups in the samples. These functional groups may participate in the faradaic reactions that increase the pseudo-capacitance and improve the wettability of the APVPC-based electrodes in the aqueous electrolytes.48
C, sp3C, C–O and CO,44 respectively. Moreover, the deconvoluted N 1s spectrum (Fig. 1j) contains three peaks, pyridinic-N (N-6, 395.92 eV), pyrrolic-N (N-5, 400.60 eV) and amides/amines or nitrile N (NC, 400.54 eV),45 which indicates the presence of nitrogen and further could improve the wettability and provide a large number of active sites for adsorption. In the 2p3/2 spectrum (Fig. 1k), the three peaks at 130.68 eV, 133.93 eV and 134.62 eV can be assigned to C–P species, pyrophosphate/polyphosphate (PP) and monophosphate/metaphosphate (MP) groups,46 respectively. After hydrothermal carbonization of pomelo valves through H3PO4-activation, the content of P is increased from 0.06 (PVPC) to 0.74 (APVPC-2), which confirms the successful phosphorus-doping of porous carbon. In addition, the high-resolution S 2p spectrum (Fig. 1l) shows three peaks at 161.39, 165.63 and 169.02 eV, which are attributed to CS and C–S bonds and the oxides of sulfur.47 Thus, the XPS results also demonstrate the existence of heteroatoms such as N, O, P and S-containing functional groups in the samples. These functional groups may participate in the faradaic reactions that increase the pseudo-capacitance and improve the wettability of the APVPC-based electrodes in the aqueous electrolytes.48
| Samples | C (%) | N (%) | O (%) | P (%) | S (%) |
|---|---|---|---|---|---|
| PVPC | 91.72 | 0.52 | 7.63 | 0.06 | 0.08 |
| APVPC-2 | 62.86 | 3.94 | 32.28 | 0.74 | 0.17 |
Fourier transform infrared (FT-IR) spectroscopy is used to identify the surface functional groups of the as-synthesized samples (Fig. S1f†). The absorptions at 3443, 2978, 1654, 1048, 1078 and 671 cm−1 are attributed to –NH, –C–H, –CO, C–OH, CS, and C–P,49 respectively. From the above FT-IR analysis, it could be deduced that oxygen-, nitrogen-, phosphorus- and sulphur-containing groups may exist in the samples, which agrees well with the XPS results. Based on the aforementioned characterization, the carbon material APVPC-2 derived from pomelo valves is a more preferential electrode material for supercapacitors by virtue of its high surface area and 3D interconnected porous structure as well as the heteroatom doping.
Based on the aforementioned investigation, we propose a formation mechanism of porous carbon nanosheets. The pomelo valves possess a net like structure consisting of a large amount of polymeric cellulose. Owing to substantial hydrophilic functional groups such as hydroxy and carbonyl groups, the molecules of the polymeric cellulose in the pomelo valves could adsorb certain amounts of water molecules. In the activation process, H3PO4 vibrates violently in water to prevent the adjacent cell walls from agglomerating, and then the atoms decomposed from the molecules of polysaccharides connect together in situ to form ultrathin nanosheets and abundant pores. During the subsequent high-temperature carbonizing process, the polymeric cellulose is hydrolyzed to oligosaccharides along with gas evolution, which could contribute to forming a porous structure.
3.2 Electrochemical behaviors
As shown in Fig. 2a, the cyclic voltammetry (CV) curves of the APVPC-2 electrode have perfect rectangular shapes with obvious humps in the low potential region, which is indicative of the combined effects of electric double-layer capacitance (EDLC) and pseudo-capacitance due to the existence of active heteroatoms.45 Even with an increase in scan rates from 5 to 100 mV s−1, the APVPC-2 electrode still maintains perfect rectangle-shaped profiles, indicating faster kinetics in the porous carbon by virtue of the openness in the structure resulting in fast ion transportation inside the pores.50 Because the CV curves at 100 mV s−1 are correlated with the capacitance of the electrode, APVPC-2 shows a larger rectangular shape of the CV curves than other materials (Fig. S3a and b†), suggesting the highest capacitance, which is consistent with the capacitance calculated from the GCD curves. This could be attributed to the broader PSD and higher mesoporosity of APVPC-2 that is conducive to facile, fast electrolyte ion transport and shortens the diffusion distances from the electrolyte to the inner micropore surface.51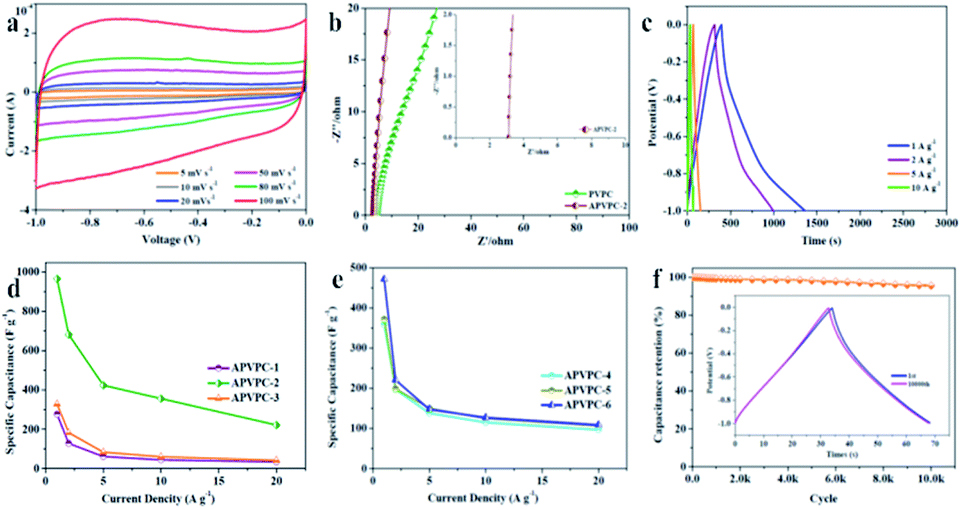 | ||
| Fig. 2 (a) CV curves of APVPC-2 at different scan rates. (b) Nyquist plots of PVPC and APVPC-2. (c) Galvanostatic charge/discharge curves of APVPC-2 at different current densities. (d) Capacitances of APVPC samples prepared with different reaction times at different current densities. (e) Capacitances of APVPC samples prepared with different concentrations of H3PO4 at different current densities. (f) Cycling performance of APVPC-2 at 10 A g−1. The inset shows the GCD curves of the 1st and 10000th cycle. | ||
Electrochemical impedance spectroscopy (EIS) is also a critical technique to further study the electrochemical performance of the samples. According to the Nyquist plots of APVPC-2 (Fig. 2b) in 3 M KOH, the steep linear curve of APVPC-2 in the low-frequency region is closer to a vertical line than that of PVPC, which reveals that the H3PO4-activation can improve the capacitive behavior effectively. In contrast to PVPC, APVPC-2 exhibits a larger slope of the straight line in Nyquist plots, which reveals lower diffusive resistance (W). At low frequency, electrolyte ions could penetrate inside the porous AC and access more of the electrode surface thereby contributing to the high capacitance value. However, at high frequency, electrolyte ions can only access the surface of carbon materials whereas the inner pores are not accessible, resulting in a sharp decrease in the capacitance.52 Meanwhile, the internal cell resistance (real Z′ axis in Nyquist plots) is 3.12 Ω (56.25 kHz) for APVPC-2 and 4.408 Ω (68.12 kHz) for PVPC. Moreover, pseudocapacitance originating from Faraday reactions owing to the surface functional groups of APVPC-2 has a insignificant effect in comparison to the double-layer capacitance, which agrees well with CV curves.53 As shown in Fig. S3c,† the internal cell resistance is 3.087 Ω (82.52 kHz) for APVPC-1 and 3.104 Ω (68.12 kHz) for APVPC-3. The slope of APVPC-2 parallel to the Z′′ axis is higher than those of APVPC-1 and APVPC-3 prepared with different activation times (1 h vs. 3 h vs. 6 h, APVPC-1 vs. APVPC-2 vs. APVPC-3) which reveals less diffusion restriction for electrolyte ions to access the electrode surface.54 From the slopes of the straight lines in the Nyquist plots, the order of WAPVPC-2 > WAPVPC-1 > WAPVPC-3 could be deduced. Additionally, the internal cell resistance is 6.289 Ω (68.12 kHz) for APVPC-4, 5.004 Ω (56.25 kHz) for APVPC-5 and 3.349Ω (56.25 kHz) for APVPC-6 (Fig. S3d†). The slope of APVPC-2 is also the higher than those of APVPC-4, APVPC-5 and APVPC-6 synthesized with different concentrations of H3PO4 (1 M vs. 5 M vs. 10 M vs. 16 M H3PO4, APVPC-4 vs. APVPC-5 vs. APVPC-6 vs. APVPC-2), which exhibits the order of WAPVPC-2 > WAPVPC-4 > WAPVPC-6 > WAPVPC-5. From the electrochemical impedance spectroscopy measurements, it could be deduced that the electrode material APVPC-2 has low ionic resistance inside the porous structure which promotes the fast diffusion of electrolyte ions into the porous network. In addition, the electrode material APVPC-2 exhibits good conductivity and low charge transfer resistance that facilitate fast charge transfer between the electrolytes and electrode materials. The results further demonstrate that the APVPC-2 is a promising electrode material for supercapacitor applications.
The capacitive performances of the porous materials are further tested with galvanostatic charge–discharge (GCD) measurements at various current densities in 3 M KOH with the same voltage windows as those in the CV analysis. The GCD curves are almost symmetrical with slight distortion, confirming the good capacitive behavior of electrical double layer capacitance (EDLC) and a little pseudo-capacitance, which coincides with the results of CV. As calculated from the GCD curves, APVPC-2 exhibits a specific capacitance of 966.4 F g−1 at 1 A g−1 (474.38 F g−1 at 1 A g−1 for PVPC) and still displays a specific capacitance of 221.6 F g−1 even at 20 A g−1, which reveals the good energy storage-output capacity at high current density and further confirms the effect of the activation agent H3PO4. The lower capacitance at higher current densities is also ascribed to the insufficient electrolyte ion diffusion kinetics across the micropores due to the narrow pore size at higher operating current densities, and the reduced accumulation amount of electrolyte ions on the porous electrode interface leads to a decrease in specific capacitance.49 The APVPC-2 electrode exhibits high specific capacitance due to the synergistic effect of the rich active heteroatom-doping and suitable pore size distribution. This result also illustrates that the conductivity of the electrode is good, but the pore structure is favorable for K+ and OH− ion diffusion. In the KOH aqueous electrolyte solution, the micropores with a pore size less than 0.5 nm are usually deemed too narrow for double-layer formation; however, pores larger than 2 nm are too wide. Consequently, the APVPC-2 that possesses a concentrated pore size distribution of 0.718 nm is very applicable for the delivery of the electrolyte ions in the sample porous channels, further achieving high electrosorption efficiency, which also could result in improved specific capacitance.55 In addition, the surface functionalities and incorporation of N, O, P and S heteroatoms in APVPC-2 which have been investigated by XPS could also contribute to high pseudocapacitance.56 In this context, the graphitic N in APVPC-2 greatly improves the electron transport by decreasing the intrinsic resistance, and the pyridinic and pyrrolic N in porous carbon strongly favors rapid ion transport kinetics inside the pores.54 The P-doped configuration of APVPC-2 could inhibit the formation of electrophilic oxygen species but also greatly stabilizes the electrochemical interface of the graphene electrode.57 The S heteroatoms can greatly enhance space utilization by promoting the electrosorption of electrolyte ions.58 The presence of heteroatoms increases the polarity of the pores and thereby facilitates easy contact between pores and the electrolyte. In general, the co-doping effect of N, P and S could greatly modify the chemical and surface nature of the porous carbon and improve the ion and electron transfer kinetics of carbon, which could contribute to a superior performance. At the same time, the reaction time and concentration of H3PO4 could also affect the specific capacitance. Fig. 2d and e compare the capacitance retention of all APVPC samples in a range of current density from 1 to 20 A g−1. As the reaction time increases (Fig. 2d), the APVPC-2 delivers higher capacitance than APVPC-1 and APVPC-3, which is attributed to the increased pores formed from the activated carbon atoms and the activator with the optimal reaction time (1 h vs. 3 h vs. 6 h, 474.38 vs. 966.4 vs. 276.9 F g−1; APVPC-1 vs. APVPC-2 vs. APVPC-3). With the increase of concentration of H3PO4 (Fig. 2e), the specific capacitances are also progressively increased in the same way (1 M vs. 5 M vs. 10 M vs. 16 M, 506 vs. 53.8 vs. 475 vs. 966.4 F g−1; APVPC-4 vs. APVPC-5 vs. APVPC-6 vs. APVPC-2). When the concentration of H3PO4 is relatively low, the amount of activator is inadequate to fully activate the carbon. But with the increase of concentration of H3PO4, more carbon can react with the activator and further generate more pores, which eventually contribute to the increase of the specific surface area and the pore volume. In general, APVPC-2 exhibits a smaller charge-transfer resistance and larger ion diffusion than the other APVPC samples and other previously reported biomass derived porous carbon with aqueous electrolytes,59 which demonstrates that despite having a moderate micropore surface area, appropriate PSD, rich active heteroatom contents and good crystallinity endow APVPC-2 with the best capacitive performance.
The long-term cycling stability is a crucial factor for electrode materials in energy storage applications. Fig. 2f demonstrates the variation of capacitance retention and GCD curves as a function of cycle number for APVPC-2 at a current density of 10 A g−1. The specific capacitance decreases slowly in the first 1000 cycles and is maintained at about 95.6% of the initial specific capacitance with a slight fluctuation even after 10000 cycles. Moreover, the 1st and 10000th charge–discharge curves are almost fully overlapping except for a faint decay, which evidences the excellent cycling stability and the robust structure of these pomelo valve derived porous carbons.
A symmetric two-electrode cell was assembled to further evaluate the capacitive performance of APVPC-2 in 3 M KOH. The CV curves (Fig. 3a) recorded at different current densities from 5 to 100 mV s−1 have a quasi-rectangular shape, which demonstrates good electric double-layer capacitance (EDLC) behavior with fast charge/discharge processes and a good rate electrochemical performance.60 Meanwhile, there are also no redox peaks/humps due to the pseudocapacitive interaction of ions with functional groups which could be observed. The pseudocapacitance behavior in porous carbon strongly depends on the nature of the electrolytes (e.g.: type and pH) and the effect is almost negligible in neutral and non-aqueous electrolytes.61 The Nyquist plot for APVPC-2 (Fig. 3b) is almost vertical in the low-frequency region, revealing easy electrolyte diffusion to the surface and good capacitive behavior. Simultaneously, the internal cell resistance (real Z′ axis from Nyquist plots) is 2.146 Ω (6.17 kHz) for the supercapacitor. The GC curves (Fig. 3c) exhibit perfect symmetric triangular shapes at different current densities, confirming a facile, smooth adsorption/desorption process and further good capacitive characteristics. During the measurement, the change of capacitance from 181.95 to 127.78 A g−1 accompanies the current density variation from 1 to 20 A g−1 (Fig. 3d), which reveals a good rate performance with a capacitance retention of 70.22%. The attractive rate capability can be ascribed to the matching between the pore and the electrolyte 3 M KOH. The results are also superior to those for reported carbon-based capacitors,62,63 illustrating that the electrolyte ions could efficiently, rapidly and fully penetrate into the electrochemically active interface of the APVPC-2 carbon material even at a high current density (20 A g−1), which is due to its 3D hierarchically interconnected porous structure. Compared with other energy storage systems, the Ragone plot shows an energy density of 36.39 W h kg−1 at a low power density of 1.67 kW kg−1 (Fig. 3e). Even at an ultra-high power density of 33.33 kW kg−1, the supercapacitor could still function efficiently with an energy density of 25.56 W h kg−1, which surpasses those of several previously reported systems.64,65 The superior energy-power output behavior effectively bridges the performance gap between batteries and capacitors. The long cycle life of the supercapacitor is evaluated using constant current charge–discharge cycles at a current density of 10 A g−1 as shown in Fig. 3f. The energy loss could be calculated to be 5.1% after 10000 cycles, indicating good cycling stability. To further demonstrate the practical application of the as-fabricated SC, a tandem device is assembled by connecting two prototype units in series. Subsequently, the device is used to light up a red light-emitting-diode (LED, the lowest working potential is 2.0 V), as depicted in the inset of Fig. 3f. This tentative test suggests the great potential of the APVPC-2 materials for high performance energy storage systems.
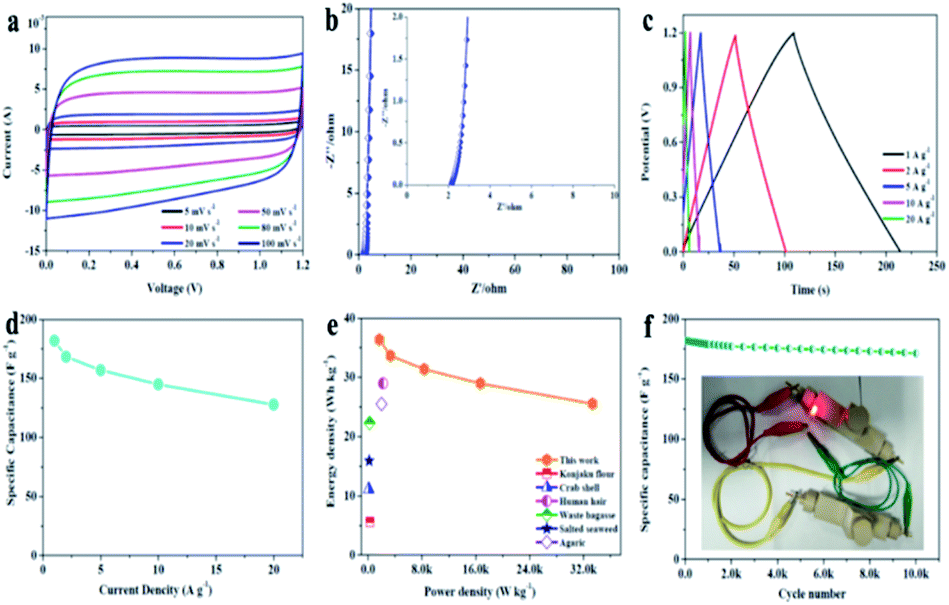 | ||
| Fig. 3 (a) CV curves of the APVPC//APVPC symmetrical supercapacitor at different scan rates in the voltage window of 0–1.2 V. (b) Nyquist plots of the APVPC//APVPC symmetrical supercapacitor before and after recycling. (c) Galvanostatic charge/discharge curves of the APVPC//APVPC symmetrical supercapacitor at different current densities. (d) Specific capacitances of the as-assembled APVPC symmetrical supercapacitor at different current densities. (e) Ragone plots of the APVPC symmetrical supercapacitor and other previously reported carbon-based symmetric supercapacitors. (f) Cycle performance of the APVPC symmetrical supercapacitor at a current density of 10 A g−1 (inset: photograph of a lit LED bulb). | ||
4. Conclusions
In conclusion, porous carbon materials with interconnected hierarchical pores are derived from a sustainable, low-cost, and environmentally abundant waste pomelo valve biomass precursor by the hydrothermal activation with H3PO4 and simple carbonization. In addition, surface functionalities on the pore wall could be tuned using nitrogen, sulfur and phosphorus heteroatoms to achieve excellent electrochemical performance. The electrochemical performance of the porous carbon is superior to that of conventional porous carbon and graphene-based electrodes. The stability and energy-power behavior were among the best reported for any porous carbon. A maximum energy density of 36.39 W h kg−1 is achieved, along with an ultra-high output power of ∼25.56 W h kg−1, while retaining an energy density of ∼33.33 kW kg−1. Moreover, a long-lasting stability of 10000 cycles with an energy loss of 5.1% is also demonstrated. The superior performance contributes to a good platform for large-scale production of porous activated carbon networks to achieve high-performance and stable supercapacitors.
Conflicts of interest
There are no conflicts to declare.Acknowledgements
We gratefully acknowledge the financial support from the Faculty of Materials and Energy and Institute for Clean Energy & Advanced Materials, Southwest University, the Chongqing Key Laboratory for Advanced Materials and Technologies of Clean Electrical Power Sources and the Recruitment Program of Southwest University (SWU117023).References
- M. Jana, R. Xu, X. B. Cheng, J. S. Yeon, J. M. Park, J. Q. Huang, Q. Zhang and H. S. Park, Energy Environ. Sci., 2020, 13, 1049 RSC.
- B. B. Shao, Z. F. Liu, G. M. Zeng, H. Wang, Q. H. Liang, Q. Y. He, M. Cheng, C. Y. Zhou, L. B. Jiang and B. Song, J. Mater. Chem. A, 2020, 8, 7508 RSC.
- Q. Hao, C. W. Liu, G. H. Jia, Y. Wang, H. Arandiyan, W. Wei and B. J. Ni, Mater. Horiz., 2020, 7, 1014 RSC.
- Y. Y. Wang, J. Liu, Y. P. Feng, N. Y. Nie, M. M. Hu, J. Q. Wang, G. X. Pan, J. H. Zhang and Y. Huang, Chem. Commun., 2020, 56, 4793 RSC.
- R. J. Young, M. T. Huxley, E. Pardo, N. R. Champness, C. J. Sumby and C. J. Doonan, Chem. Sci., 2020, 11, 4031 RSC.
- J. J. Zhang, H. P. Zhao, J. Li, H. L. Jin, X. C. Yu, Y. Lei and S. Wang, Adv. Energy Mater., 2018, 9, 1803221 CrossRef.
- L. J. Kong, M. Zhong, W. Shuang, Y. H. Xu and X. H. Bu, Chem. Soc. Rev., 2020, 49, 2378 RSC.
- L. Tong, M. Y. Gao, C. Jiang and K. F. Cai, J. Mater. Chem. A, 2019, 7, 10751 RSC.
- S. S. Qin, Q. Zhang, X. X. Yang, M. M. Liu, Q. J. Sun and Z. L. Wang, Adv. Energy Mater., 2018, 8, 1800069 CrossRef.
- M. P. Browne, Z. Sofer and M. Pumera, Energy Environ. Sci., 2019, 12, 41 RSC.
- H. J. Zhang, Y. K. Wang and L. B. Kong, Nanoscale, 2019, 11, 7263 RSC.
- J. H. Han, A. Hirata, J. Du, Y. Ito, T. Fujita, S. Kohara, T. Ina and M. W. Chen, Nano Energy, 2018, 49, 354 CrossRef CAS.
- Z. N. Deng, H. Jiang and C. Z. Li, Small, 2018, 14, 1800148 CrossRef PubMed.
- Y. C. Ding, L. Mo, C. Gao, X. P. Liu, T. Yu, W. Y. Chen, S. H. Chen, Z. Q. Li and L. H. Hu, ACS Sustainable Chem. Eng., 2018, 6, 9822 CrossRef CAS.
- S. Ramaraj, M. Sakthivel, S. M. Chen and K. C. Ho, Anal. Chem., 2019, 91, 8358 CrossRef CAS PubMed.
- H. L. Jin, J. Li, Y. F. Yuan, J. C. Wang, J. Lu and S. Wang, Adv. Energy Mater., 2018, 8, 1801007 CrossRef.
- L. F. Chen, Y. Lu, L. Yu and X. W. Lou, Energy Environ. Sci., 2017, 10, 1777 RSC.
- E. Hao, W. Liu, S. Liu, Y. Zhang, H. L. Wang, S. G. Chen, F. L. Cheng, S. P. Zhao and H. Z. Yang, J. Mater. Chem. A, 2017, 5, 2204 RSC.
- J. T. Hu, J. Yang, Y. D. Duan, C. K. Liu, H. T. Tang, L. P. Lin, Y. Lin, H. B. Chen and F. Pan, Chem. Commun., 2017, 53, 857 RSC.
- G. Wang, S. K. Kim, M. C. Wang, T. S. Zhai, S. Munukutla, G. S. Girolami, P. J. Sempsrott, S. Nam, P. V. Braun and J. W. Lyding, ACS Nano, 2020, 14, 632 CrossRef CAS PubMed.
- M. Y. Liu, J. Niu, Z. P. Zhang, M. L. Dou and F. Wang, Nano Energy, 2018, 51, 366 CrossRef CAS.
- J. J. Xue, T. Wu, Y. Q. Dai and Y. N. Xia, Chem. Rev., 2019, 119, 5298 CrossRef CAS PubMed.
- H. Khani, T. J. Dowell and D. O. Wipf, ACS Appl. Mater. Interfaces, 2018, 10, 21262 CrossRef CAS PubMed.
- S. Y. Lu, M. Jin, Y. Zhang, Y. B. Niu, J. C. Gao and C. M. Li, Adv. Energy Mater., 2018, 8, 1702545 CrossRef.
- S. Bhattacharya, I. Roy, A. Tice, C. Chapman, R. Udangawa, V. Chakrapani, J. L. Plawsky and R. J. Linhardt, ACS Appl. Mater. Interfaces, 2020, 12, 19369 CrossRef CAS PubMed.
- J. Niu, R. Shao, J. J. Liang, M. L. Dou, Z. L. Li, Y. Q. Huang and F. Wang, Nano Energy, 2017, 36, 322 CrossRef CAS.
- S. H. Chen, L. Qiu and H. M. Cheng, Chem. Rev., 2020, 120, 2811 CrossRef CAS PubMed.
- Y. Gao, J. Zhang, N. Li, X. Han, X. Luo, K. Y. Xie, B. Q. Wei and Z. H. Xia, J. Mater. Chem. A, 2020, 8, 7756 RSC.
- X. K. Huang, X. Y. Sui, W. X. Ji, Y. L. Wang, D. Y. Qu and J. H. Chen, J. Mater. Chem. A, 2020, 8, 7641 RSC.
- L. J. Kong, M. Zhong, W. Shuang, Y. H. Xu and X. H. Bu, Chem. Soc. Rev., 2020, 49, 2378 RSC.
- F. X. Wu, J. Maier and Y. Yu, Chem. Soc. Rev., 2020, 49, 1569 RSC.
- L. Chen, N. J. Luo, S. P. Huang, Y. F. Li and M. D. Wei, Chem. Commun., 2020, 56, 3951 RSC.
- M. Fingerle and H. F. Bettinger, Chem. Commun., 2020, 56, 3847 RSC.
- T. P. Zhou, N. Zhang, C. Z. Wu and Y. Xie, Energy Environ. Sci., 2020, 13, 1132 RSC.
- M. Jana, R. Xu, X. B. Cheng, J. S. Yeon, J. M. Park, J. Q. Huang, Q. Zhang and H. S. Park, Energy Environ. Sci., 2020, 13, 1049 RSC.
- S. A. Hashemi, S. Ramakrishna and A. G. Aberle, Energy Environ. Sci., 2020, 13, 685 RSC.
- T. Deepalakshmi, T. T. Nguyen, N. H. Kim, K. T. Chong and J. H. Lee, J. Mater. Chem. A, 2019, 7, 24462 RSC.
- M. Y. Song, Y. H. Zhou, X. Ren, J. F. Wan, Y. Y. Du, G. Wu and F. W. Ma, J. Colloid Interface Sci., 2019, 535, 276 CrossRef CAS PubMed.
- Q. Chang, M. A. Darabi, Y. Q. Liu, Y. F. He, W. Zhong, K. Mequanin, B. Y. Li, F. Lu and M. M. Q. Xing, J. Mater. Chem. A, 2019, 7, 24626 RSC.
- R. Samal, S. Mondal, A. S. Gangan, B. Chakraborty and C. S. Rout, Phys. Chem. Chem. Phys., 2020, 22, 7903 RSC.
- M. Y. Zhu, J. J. Tang, W. J. Wei and S. J. Li, Mater. Chem. Front., 2020, 4, 1105 RSC.
- T. Y. Liu, P. Diao, Z. Lin and H. L. Wang, Nano Energy, 2020, 74, 104787 CrossRef CAS.
- B. K. Deka, A. Hazarika, S. Lee, D. Y. Kim, Y. B. Park and H. W. Park, Nano Energy, 2020, 73, 104754 CrossRef CAS.
- S. Abdolhosseinzadeh, R. Schneider, A. Verma, J. Heier, F. Nüesch and C. F. Zhang, Adv. Mater., 2020, 32, 2000716 CrossRef CAS PubMed.
- S. H. Zheng, X. Y. Shi, P. Das, Z. S. Wu and X. H. Bao, Adv. Mater., 2019, 31, 1970351 CrossRef.
- Y. S. Zhao, Y. Alsaid, B. W. Yao, Y. C. Zhang, B. Z. Zhang, N. Bhuskute, S. W. Wu and X. M. He, Adv. Funct. Mater., 2020, 10, 1909133 CrossRef.
- X. R. Li, H. P. Li, X. Q. Fan, X. L. Shi and J. J. Liang, Adv. Energy Mater., 2020, 14, 1903794 CrossRef.
- R. Z. Hou, M. Miao, Q. Y. Wang, T. Yue, H. F. Liu, H. S. Park, K. Qi and B. Y. Xia, Adv. Energy Mater., 2020, 1, 1901892 CrossRef.
- M. Y. Wang, S. L. Xie, C. Q. Tang, X. Fang, M. Liao, L. Wang, Y. Zhao, Y. Z. Wen, L. Ye, B. J. Wang and H. S. Peng, Small, 2019, 52, 1905903 CrossRef PubMed.
- H. H. Lu, C. Yang, J. Chen, J. Li, H. l. Jin, J. C. Wang and S. Wang, Small, 2020, 17, 1906584 CrossRef PubMed.
- R. Y. Bi, N. Xu, H. Ren, N. L. Yang, Y. G. Sun, A. Cao, R. B. Yu and D. Wang, Angew. Chem., Int. Ed., 2020, 12, 4865 CrossRef PubMed.
- J. J. Liu, Y. Zhou, Z. Xie, Y. Li, Y. P. Liu, J. Sun, Y. H. Ma, O. Terasaki and L. Chen, Angew. Chem., Int. Ed., 2020, 3, 962 CrossRef.
- S. Thurakkal and X. Y. Zhang, Adv. Sci., 2020, 2, 1902359 CrossRef PubMed.
- R. Thangavel, A. G. Kannan, R. Ponraj, V. Thangavel, D. W. Kim and Y. S. Lee, J. Mater. Chem. A, 2018, 6, 17751 RSC.
- R. Thangavel, A. G. Kannan, R. Ponraj, X. L. Sun, D. W. Kim and Y. S. Lee, J. Mater. Chem. A, 2018, 6, 9846 RSC.
- G. J. Guan and M. Y. Han, Adv. Sci., 2019, 23, 1901837 CrossRef PubMed.
- Z. H. Bi, L. Huo, Q. Q. Kong, F. Li, J. P. Chen, A. Ahmad, X. X. Wei, L. J. Xie and C. M. Chen, ACS Appl. Mater. Interfaces, 2019, 11, 11421 CrossRef CAS PubMed.
- J. Edberg, R. Brooke, H. Granberg, I. Engquist and M. Berggren, Adv. Sustainable Syst., 2019, 8, 1668 Search PubMed.
- J. H. Zhu, J. Roscow, S. Chandrasekaran, L. B. Deng, P. X. Zhang, T. S. He, K. Wang and L. C. Huang, ChemSusChem, 2020, 6, 1275 CrossRef PubMed.
- W. F. Mao, W. Yue, Z. J. Xu, S. Y. Chang, Q. Q. Hu, F. Pei, X. D. Huang, J. B. Zhang, D. J. Li, G. Liu and G. Ai, ACS Nano, 2020, 14, 4741 CrossRef CAS PubMed.
- C. F. Xue, L. Feng, Y. N. Hao, F. J. Yang, Q. Zhang, X. L. Ma and X. G. Hao, Green Chem., 2018, 20, 4983 RSC.
- Y. X. Liu, Z. C. Xiao, Y. C. Liu and L. Z. Fan, J. Mater. Chem. A, 2018, 6, 160 RSC.
- Y. Zhang, S. S. Liu, X. Y. Zheng, X. Wang, Y. Xu, H. Q. Tang, F. Y. Kang, Q. H. Yang and J. Y. Luo, Adv. Funct. Mater., 2017, 27, 1604687 CrossRef.
- M. Zohair, K. Moyer, J. E. Rathert, C. Z. Meng, J. Waugh and C. L. Pint, ACS Nano, 2020, 14, 2308 CrossRef CAS PubMed.
- B. J. Zhu, B. Liu, C. Qu, H. Zhang, W. H. Guo, Z. B. Liang, F. Chen and R. Q. Zou, J. Mater. Chem. A, 2018, 6, 1523 RSC.
Footnotes |
| † Electronic supplementary information (ESI) available. See DOI: 10.1039/d0na00211a |
| ‡ Equal contribution to this work. |
| This journal is © The Royal Society of Chemistry 2020 |