DOI:
10.1039/D0NA00183J
(Paper)
Nanoscale Adv., 2020,
2, 2004-2017
Bandgap engineering via boron and sulphur doped carbon modified anatase TiO2: a visible light stimulated photocatalyst for photo-fixation of N2 and TCH degradation†
Received
4th March 2020
, Accepted 26th March 2020
First published on 31st March 2020
Abstract
The present research reports the synthesis of two-dimensional (2D) sheet/flake-like nanostructures of crystalline carbon modified TiO2 (CT), B-TiO2 (B-CT), and S-TiO2 (S-CT) using a facile one-pot synthesis method. The crystallinity and phase purity (anatase) of the prepared nano-photocatalyst were characterised using X-ray diffraction, selected area electron diffraction (SAED) and high-resolution transmission electron microscopy (HRTEM) analysis. Furthermore, the morphological details and elemental content of the sample were studied via scanning electron microscopy (SEM) and transmission electron microscopy (TEM), and X-ray photoelectron spectroscopy (XPS), respectively. Additionally, the optoelectronic features of all of the prepared specimens were measured via UV-vis diffuse reflectance spectroscopy (DRS), photoluminescence (PL), impedance and Mott–Schottky studies. After successful characterisation, their photocatalytic performance was tested towards dinitrogen photo-fixation and tetracycline hydrochloride (TCH) degradation under visible light illumination. Moreover, the effective charge separation and greater availability of the active surface area led to the robust photocatalytic activity of the fabricated B-CT compared to the CT and S-CT samples, which correlates well with the PL, impedance and surface area analysis. B-CT displays the highest photocatalytic activity, i.e. 32.38 μmol L−1 (conversion efficiency = 0.076%) of ammonia production, and 95% tetracycline hydrochloride (10 ppm) degradation. Here, we have effectively designed a novel and productive pathway towards the enhancement of the photocatalytic performance of visible photon active TiO2-based materials for energy and environmental sustainability.
Introduction
In the 21st century, ammonia (NH3) is considered to be an asset towards the world economic forum in the form of feedstock, manures, fertilizer, plastics and textile industries. It is also known to be a stable carrier of hydrogen gas.1 Along with its economic contribution, ammonia has been considered to be an alternative energy vector because of its high density of sustainable energy like H2 for the upcoming generation.2 Furthermore, ammonia can be regarded as a replacement for non-renewable fossil fuels to meet the energy demands of the increasing population and industries. Ammonia also makes a major contribution in the biological field, as it is an important source of nitrogen in vital biomolecules such as DNA, proteins, amino acids, etc.3,4 Although NH3 makes a great contribution towards the well-being of society, its production by traditional methods has created environmental chaos. The commercialization of NH3 is possible because of the historic 19th-century discovery of the artificial fixation of N2 to NH3via the Haber–Bosch process, which propagates under extreme conditions of temperature and pressure due to the stable triple bond between the bonded N-atoms. But, the bottleneck in the reaction lies in the great use of energy and the generation of a huge amount of greenhouse gas (CO2) emissions.5,6 With the fast depletion of fossil fuels and increasing environmental problems, the production of ammonia in a sustainable way is a great challenge that faces the scientific community. In this regard, the research world has used its dextrous brain for the development of different methods, such as biological, electrochemical and catalytic, towards the reduction of dinitrogen (N2) to ammonia (NH3).7–9 Among these adopted techniques, photocatalytic pathway of N2 fixation emerges as a sustainable, green and environmentally benign process, which utilizes photon power to reduce N2 to NH3.10–14 In the current era, a good number of photocatalysts, such as TiO2, ZnO, CdS, ZnS, MoS2, g-C3N4, black phosphorus and BiOBr have been examined towards the photocatalytic reduction of dinitrogen.5,15
Of the reported photocatalysts, TiO2 exhibits a notable potential towards N2 reduction because of certain favourable features, including photostability, cost-effectiveness, non-toxicity and suitable band edge positions required for nitrogen reduction.5 However, the efficiency of TiO2 is hindered by its wide bandgap (3.2 eV) that confines its light harnessing properties to the ultraviolet region of the solar spectrum, which accounts for only 4–5% of the total light that reaches the Earth's surface.16 Additionally, the rapid recombination of photo excitons is another reason for its limited photocatalytic activity. Many research groups across the globe have tried their utmost to enhance the photocatalytic performance of TiO2 by improving its light-absorbing capacity via various techniques such as bandgap engineering, heterojunction formation, metal/non-metal doping, and so on.17,18 All these efforts have been made to enhance the photocatalytic activity by improving the light-harvesting properties, but doping with a metal or non-metal has been found to be facile and productive.19 Furthermore, compared to metals, non-metal addition is more promising and cost-effective, as they form intermediate band states between the two extremes, i.e. conduction and valence band, which extends the material light absorption range, electronegativity and, more importantly, acts as a trapping state, favouring the effective anti-recombination of exciton pairs.19–21 However, the problems associated with metal and noble metal doping are that the materials undergo a bandgap shift that leads to faster recombination, photo-corrosion reducing stability and lastly the synthesis procedure becomes expensive. Also, metal ion doping leads to thermal instability and the formation of sub-bands that act as exciton recombination sites and hence minimise the catalytic performance of the photocatalysts. However, the introduction of anions into the lattice results in an upward movement of the valence band, narrowing the bandgap energy and creating anion vacancies with a stable cubic or tetrahedral phase of the metal oxide system under atmospheric conditions.22 So, non-metal introduction into the TiO2 lattice is the best way to drive UV-TiO2 to the visible region and also suppress the charge recombination mechanism.23,24 Additionally, carbon doping forms hybrid levels and sulphur addition results in the formation of localized states that ultimately reduce the optical bandgap and increase the photon absorption range,25 whereas highly electronegative non-metal (e.g. fluorine) doping generates sub-bands below the valence band and widens the optical energy gap.19 In terms of anion-doped TiO2 photocatalysts, our groups have made a significant contribution.26–29
Taking all the above knowledge from the reported literature, herein we have developed carbon modified TiO2, S-doped carbon modified TiO2 and B-doped carbon modified TiO2via a simple solvothermal method. Furthermore, to the best of our knowledge, this is the first ever report on the photoreduction of dinitrogen to ammonia using a one pot synthesis of visible active TiO2 nanosheets. Additionally, their catalytic activities were also tested towards tetracycline hydrochloride photodegradation and the fragmentation pathway was verified via liquid chromatography mass spectrometry (LC-MS) analysis. The phase purity and morphological modifications of the as-synthesized photocatalysts were analysed by X-ray diffraction (XRD) and transmission electron microscopy (TEM) studies. The effective charge carrier separation and large exposed surface sites were well characterised via photoluminescence (PL), electrochemical impedance spectroscopy (EIS) and Brunauer–Emmett–Teller (BET) analysis. The existence of sulphur and boron in the respective doped carbon modified TiO2 was confirmed from the XPS and elemental mapping. This finding will project some new ideas towards the photocatalytic application of modified TiO2.
Characterization
The detailed crystallographic features of the synthesised samples were analysed with the help of a Rigaku-Ultima IV XRD instrument equipped with a Cu Kα radiation source (λ = 0.154 nm) in the 2θ scan range of 10°–80°. A JASCO V-750 UV-VIS spectrophotometer was used to estimate the optical behaviour in the range of 200–800 nm. Furthermore, the PL properties were characterised using a JASCO spectrofluorometer FP-8300. The peripheral morphologies of S-CT, B-CT and CT were investigated by SEM using a ZEISS SUPRA-55 microscope. Additionally, the internal topological details of the photocatalyst were studied using TEM (200 kV power) using a JEOL JEM 2100 microscope. XPS measurements were undertaken using a VG microtechmultilab ESCA 3000 spectrometer fitted with a non-monochromatic Mg-Kα X-ray radiation lamp to determine the chemical environment of the material. The BET surface area and Barrett–Joyner–Halenda (BJH) pore size distribution studies of the samples were carried out using NOVA2200e Quantachrome Apparatus. A multi-channel framed IVIUM-n-STAT electrochemical analyser was used for electrochemical measurements of the as-synthesized materials. To trace the intermediate products of TCH degradation, LS-MS analysis was performed using a TSQ Quantum Access MAX triple quadrupole mass spectrometer, Thermo Fisher Scientific.
Electrochemical characterization
The electrochemical behaviour of the as-prepared photocatalysts was characterised using a conventional three electrode-based quartz cell containing 0.2 M Na2SO4 as the electrolyte, Pt as the counter electrode, saturated Ag/AgCl as the reference electrode and catalyst-coated fluorine-doped tin oxide (FTO) glass as the working electrode. A drop casting method was generally used to make the working electrode, where the FTO was first rinsed with deionised water (DW) and ethanol by sonication for nearly 30 min to clean the surface and then dried at 100 °C in a hot air oven. Next, the above polished FTO plates (conducting surface) were coated with a pasty mass containing a mixture of the sample, ethanol, binder (Nafion) and DW. The slurry was prepared by mixing the photocatalyst (1 mg) + ethanol (1.4 mL) + Nafion (40 mL) + DW (1.6 mL) and then subjecting this suspension to sonication for 30–45 min to ensure proper mixing. Then, this slurry was applied to the FTO, which was dried in a vacuum oven.
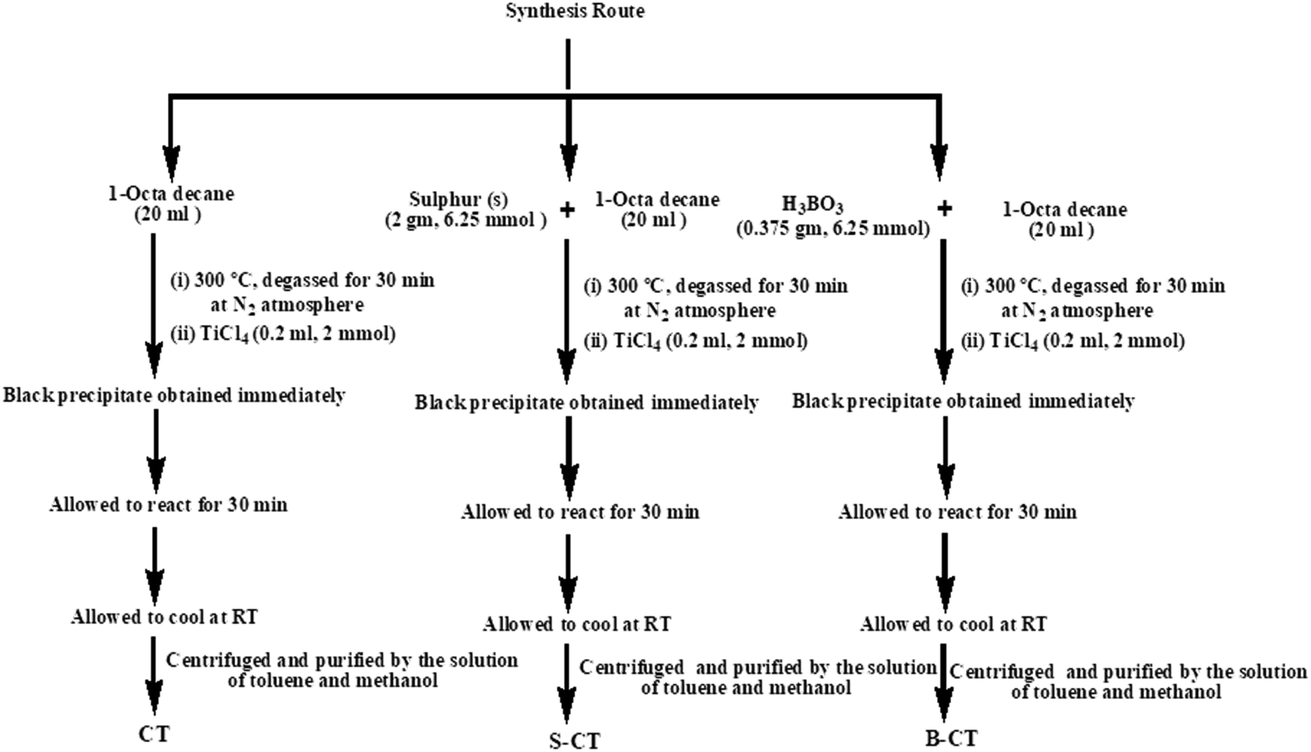
Experimental section
Chemicals used
1-Octadecene (90%) and TiCl4 were purchased from Sigma Aldrich. Sulphur (S) and boric acid (H3BO3) were purchased from Merck and used as received.
Synthesis procedure
The synthesis was carried out as follows. 20 mL of 1-octadecene (90%, Aldrich) was added to 2 g (6.25 mmol) of sulfur and was stirred for 30 min. The resulting suspension was then heated up to 300 °C for 30 min before adding 0.2 mL (1 mmol) of TiCl4 into the rapidly stirring sulphur solution and the mixture immediately turned black. The total experiment was conducted under a N2 atmosphere, where the solution was kept under the same conditions for 30 min and then allowed to cool to room temperature. Then, the resulting solution was centrifuged and purified by washing it with a solution of toluene and methanol repeatedly seven times. The black precipitate obtained was dried under vacuum at 80 °C to obtain S-doped carbon modified titania (S-CT). B-Doped carbon-modified titania (B-CT) was prepared using the same procedure instead using 0.375 g (6.25 mmol) of boric acid (H3BO3) in place of sulphur. Carbon-modified TiO2 (CT) was prepared using the same procedure without sulphur or boric acid. Scheme 1 shows the adopted synthesis procedure.
 |
| | Scheme 1 Schematic representation of the synthesis of S-CT, B-CT and CT. | |
Photocatalytic nitrogen reduction
The catalytic supremacy of the prepared photocatalysts was tested for the photoreduction of N2 to NH3 under a visible light-emitting 250 W medium pressure Hg lamp (intensity = 1330 mW) with a cut-off filter (≥420 nm) for 3 h. In a typical experiment, 15 mg of the photocatalyst was added to 50 mL of DW in a quartz batch reactor fitted with a chiller to maintain an inner temperature of around 25 °C. Furthermore, the reaction mixture was slowly bubbled with N2 gas for nearly 1 h to saturate the solution with N2. Then, it was stirred in the dark for 1/2 h to develop an adsorption–desorption equilibrium. After this, the light source was switched on and at a calculated time gap, 5 mL of the treated reaction solution was withdrawn and at once centrifuged to remove the catalyst. Moreover, another quartz container with dilute H2SO4 was used to trap the NH3 carried by the gas-phase effluent and later analysed. While calculating the total amount of ammonia formed, NH3 contained in both the reactor and trapping vessel were taken into consideration. An indophenol blue method was followed to quantify the amount of NH3 produced. The optical absorbance of the as-developed coloured solutions was characterised using UV-vis spectroscopy. Again, quantification of the ammonia and hydrazine amount was analysed with the previously made standard calibration curves of each complex. A blank analysis was carried out in the absence of catalyst, i.e. only of the complexing reagents and N2 saturated DW.
Results and discussion
X-ray diffraction analysis (XRD)
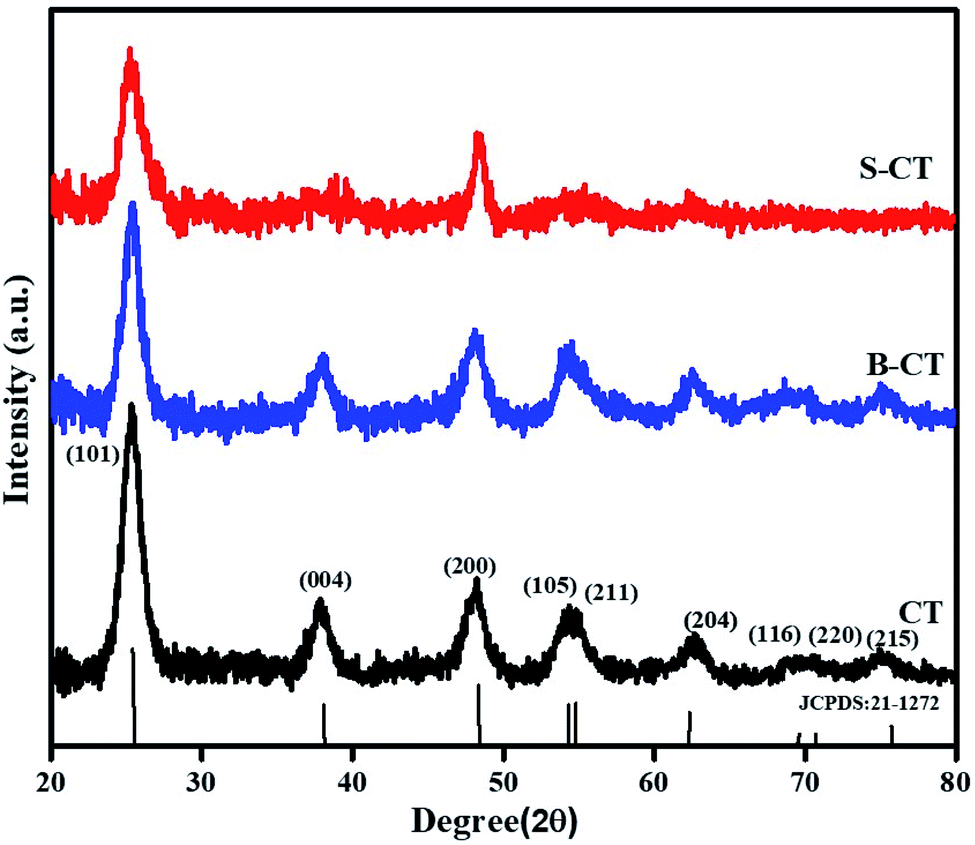
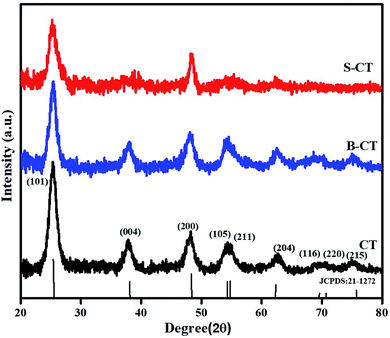
The X-ray diffraction pattern in Fig. 1 represents a pure anatase crystal phase for all of the prepared samples, i.e. carbon modified TiO2, B-CT and S-CT, without any additional TiO2 phase (rutile or brookite). The observed Bragg's diffractogram at 2θ = 25.55°, 37.86°, 48.04°, 54.29°, 67.72°, 69.49°, 70.71° and 75.38° was indexed to the (101), (004), (200), (105), (204), (116), (220) and (215) crystal planes, respectively, of anatase TiO2 which corresponds to JCPDS 21-1272.30,31 Furthermore, it was clearly visible that upon the addition of dopant (S and B atoms) to CT, the sharpness of the XRD peaks was reduced notably and there was also a shift in the 2θ value, which implies a good lattice interaction and increase in the crystallite size or in other words, the added species enters the lattice framework. From the plotted data, it was obvious that the introduction of S and B atoms into the TiO2 lattice resulted in a suppression of crystal nucleation, as observed via the peak broadening and decrease in intensity, i.e. a distortion of the crystal lattice.32 Again, the peak broadening also indicates a reduction in particle size, which was well supported by TEM analysis. As discussed above, doping of S and B into TiO2 causes a minute shift in peak position, which can be attributed to the difference in electronegativity and radius of the substituted atom and substituting atoms.33 Interaction between the added dopant results in intrinsic defects or anion vacancies. Furthermore, a detailed crystallographic parameters are shown in Table 1, which provides information regarding the mean crystallite size (calculated using Scherrer and Williamson–Hall (W–H) formulae), micro-strain and dislocation density.31
 |
| | Fig. 1 XRD patterns of CT, B-CT and S-CT. | |
Table 1 Crystallographic parameters
| Sample name |
The average crystallite size (D) (nm) |
Lattice strain (ε) × 10−3 |
Dislocation density (δ) |
| Scherrer's |
W–H |
| CT |
0.96 |
1.24 |
0.00035 |
0.6536 |
| B-CT |
1.02 |
1.31 |
0.00033 |
0.5848 |
| S-CT |
0.88 |
1.38 |
0.00039 |
0.5263 |
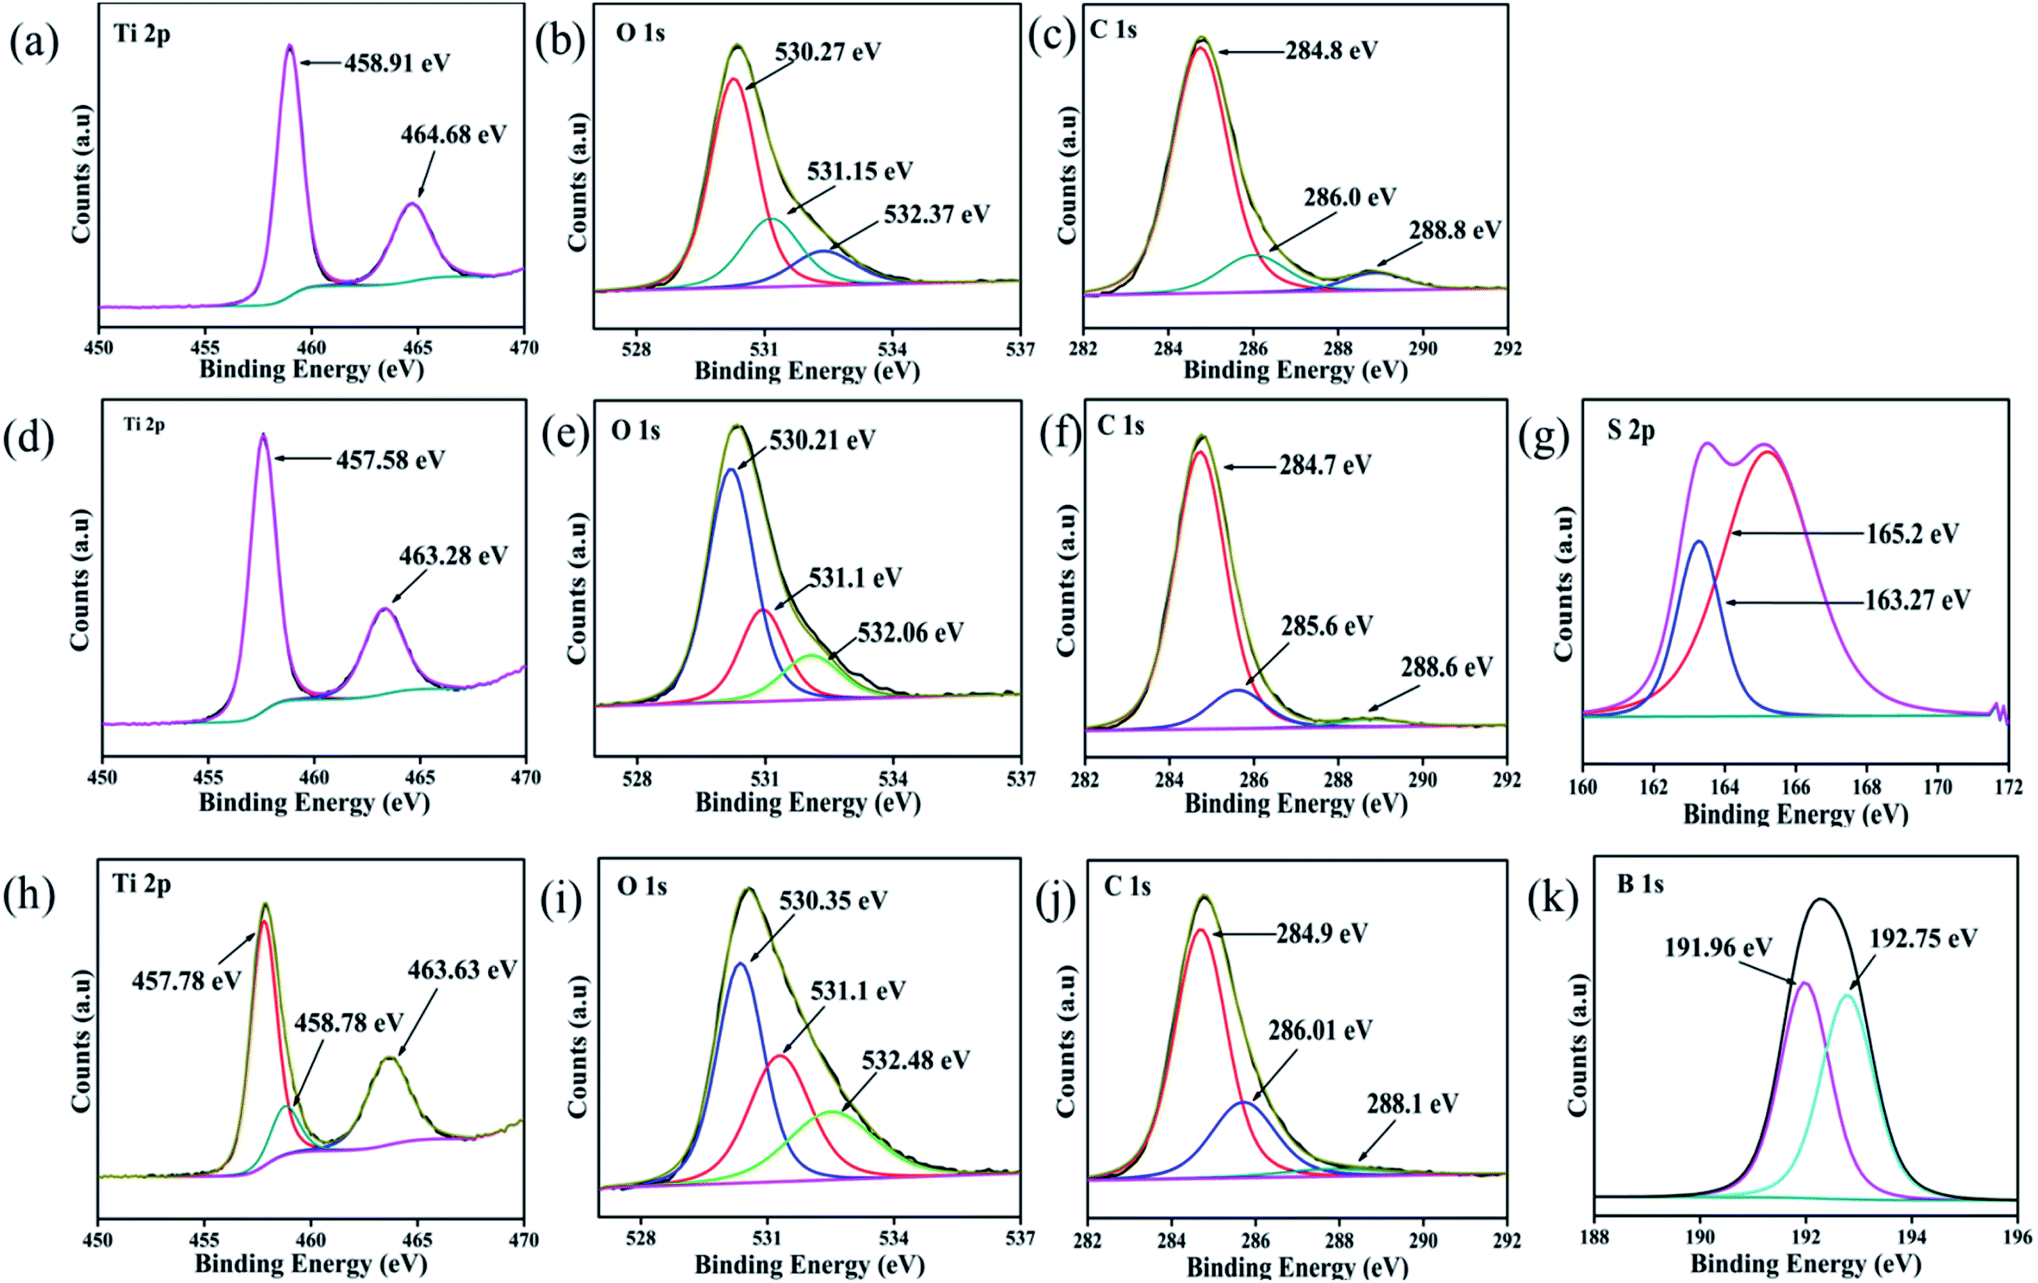
Chemical composition (XPS) analysis
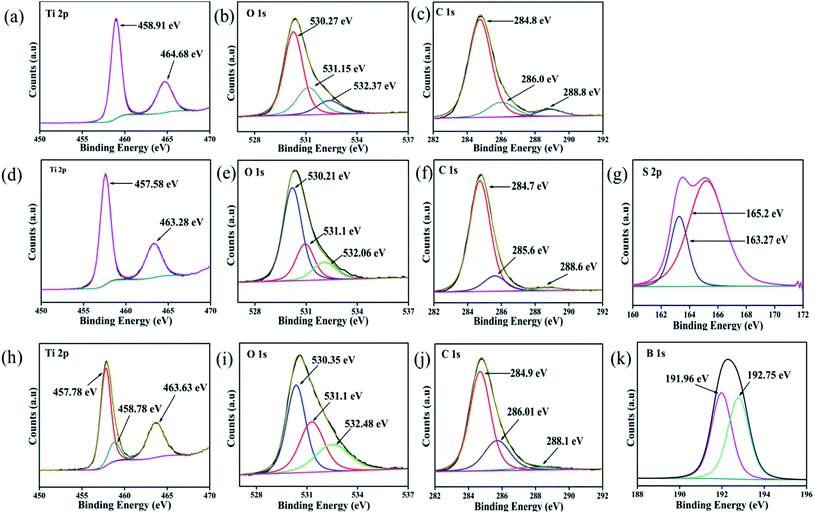
To examine the elemental content, respective oxidation state and their corresponding electronic environment of all the developed photocatalysts, XPS measurements were carried out. The core-level XPS spectra of Ti 2p, S 2p, B 1s, O 1s and C 1s are shown in Fig. 2. The full survey scans of each sample, viz. CT and doped CT, along with the XPS spectra of unmodified anatase TiO2, are shown in Fig. S1 (ESI†). Fig. 2a depicts the deconvoluted XPS spectra of Ti 2p, where the peaks positioned at 464.68 and 458.91 eV represent the Ti 2p1/2 and Ti 2p3/2 spin states, further suggesting the presence of Ti in a +4 oxidation state.16 In the case of S-doped CT (Fig. 2d), the Ti 2p1/2 and Ti 2p3/2 spin states of Ti can be observed at 463.28 and 457.58 eV. However, a negative shift in the Ti peaks can be observed in the case of S-doped CT, which could be ascribed to the partial replacement of oxygen atoms from TiO2 by S ions of lower electronegativity. The replacement of oxygen leads to an increase in the charge of Ti atoms and subsequently decreases the binding energy of Ti 2p.34 In B-doped CT (Fig. 2h), Ti 2p1/2 and Ti 2p3/2 are located at 463.63 and 457.78 eV. However, in the case of boron, a peak for titanium can be observed at a higher binding energy of 458.78 eV, which can be ascribed to the formation of a Ti–B species. Fig. 2b, e and i displays the O 1s deconvoluted XPS spectra of CT, sulphur and boron-doped CT. In carbon-modified TiO2, two peaks for O 1s can be observed at binding energies of 530.27 and 532.37 eV, which can be ascribed to the lattice oxygen (Ti–O–Ti), Ti–OH groups and surface H2O (absorbed oxygen), respectively. Moreover, the peak observed at 531.15 eV can be correlated with an oxygen vacancy, which plays a crucial role in the catalytic process as it acts as an electron trapping centre and also a substrate anchoring site.16,35 Similar types of bands were observed for sulphur and boron-doped carbon-modified TiO2, with a slight shift in the peak position. For S-doped CT, the peaks located at binding energies of 530.21, 531.12 and 532.06 eV can be assigned to Ti–O, S–Ti–O and S–O bonds, respectively, indicating that some of the O atoms in TiO2 have been replaced by S atoms.36 For B-doped CT, the peaks positioned at 530.35 eV correspond to the Ti–O and Ti–O–B bonds and the peak centred at 532.48 eV arises due to the B–O–B and surface adsorbed water, while the peak centred at 531.1 eV indicates the displacement of oxygen in the TiO2 lattice.37,38 Similarly, Fig. 2c, f and j displays the C 1s spectra of CT and doped CT. The carbon spectra of TiO2 can be deconvoluted into three peaks which are located at 284.8, 286 and 288.8 eV. The peak at 284.8 eV can be ascribed to the C–C bond, which covers a maximum area of a C 1s peak. The bands at 286 and 288 eV can be assigned to C–O/C–OH and C–OH bonds, respectively. Fig. 2f displays three deconvoluted XPS peaks of S-doped CT positioned at 284.7, 285.6 and 288.6 eV, which could have originated from C–C, C–O and C![[double bond, length as m-dash]](https://www.rsc.org/images/entities/char_e001.gif) O, respectively. Similar trends were also observed in the case of boron-doped CT. However, no carbon phase was observed in the XRD spectrum, but the appearance of carbon peaks in the XPS spectra supports the entry of carbon into TiO2 as a dopant. The S 2p core level deconvoluted spectra, as displayed in Fig. 2g, represents two XPS peaks at 163.27 and 165.19 eV and can be ascribed to the S 2p3/2 and S 2p1/2 spinal states, which further confirms the presence of sulphur in the S2− and S4+ states in the TiO2 lattice.39,40 Additionally, the band at 163.27 eV represents the development of the Ti–S bond. It can be suggested that sulphur replaced the oxygen atoms in the TiO2 framework.34 However, on deconvolution, we did not find any band above 165.5 eV, which confirms that sulphur was not been oxidized to sulphate and sulphite groups.34 The observed XPS peaks between 190 and 194 eV are because of the B 1s electronic level, which can again be deconvoluted into two peaks at binding energies of 191.96 and 192.75 eV, as shown in Fig. 2k. The first one is related to the B atom going into the TiO2 lattice and replaces the oxygen site to form O–Ti–B bond.38 However, the higher one is attributed to the Ti–O–B bond.41 Again, the elemental composition, as shown in the XPS of each sample, is well supported by the EDX and colour mapping images discussed in the respective sections.
O, respectively. Similar trends were also observed in the case of boron-doped CT. However, no carbon phase was observed in the XRD spectrum, but the appearance of carbon peaks in the XPS spectra supports the entry of carbon into TiO2 as a dopant. The S 2p core level deconvoluted spectra, as displayed in Fig. 2g, represents two XPS peaks at 163.27 and 165.19 eV and can be ascribed to the S 2p3/2 and S 2p1/2 spinal states, which further confirms the presence of sulphur in the S2− and S4+ states in the TiO2 lattice.39,40 Additionally, the band at 163.27 eV represents the development of the Ti–S bond. It can be suggested that sulphur replaced the oxygen atoms in the TiO2 framework.34 However, on deconvolution, we did not find any band above 165.5 eV, which confirms that sulphur was not been oxidized to sulphate and sulphite groups.34 The observed XPS peaks between 190 and 194 eV are because of the B 1s electronic level, which can again be deconvoluted into two peaks at binding energies of 191.96 and 192.75 eV, as shown in Fig. 2k. The first one is related to the B atom going into the TiO2 lattice and replaces the oxygen site to form O–Ti–B bond.38 However, the higher one is attributed to the Ti–O–B bond.41 Again, the elemental composition, as shown in the XPS of each sample, is well supported by the EDX and colour mapping images discussed in the respective sections.
 |
| | Fig. 2 XPS spectra of (a, b and c) Ti 2p, O 1s and C 1s of CT, (d, e, f and g) Ti 2p, O 1s, C 1s and S 2p of S-CT (h, i, j and k) Ti 2p, O 1s, C 1s and B 1s of B-CT respectively. | |
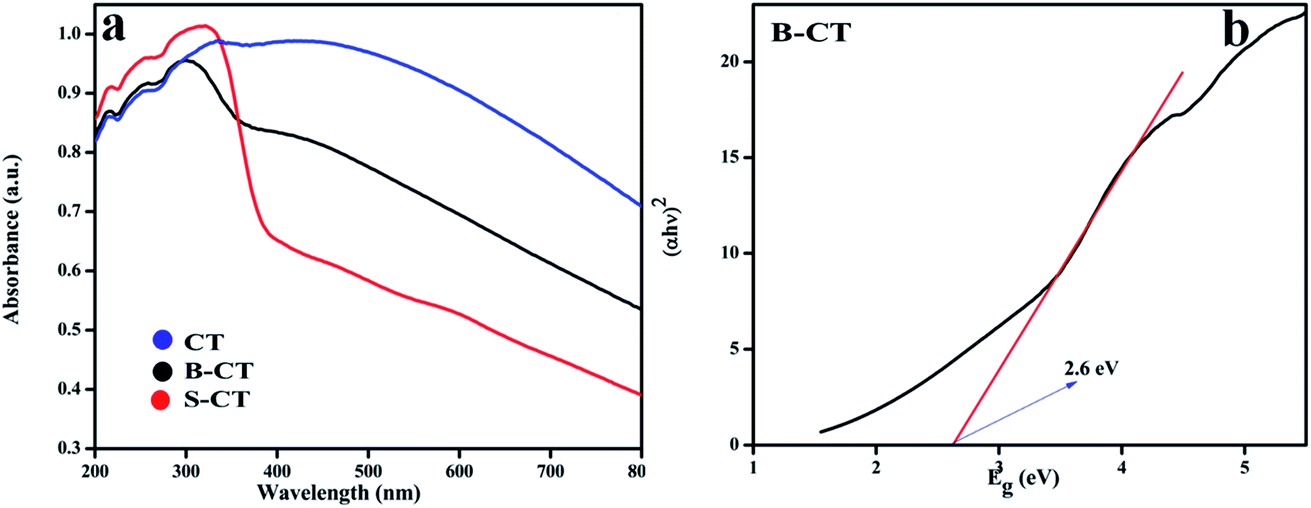
UV-vis DRS
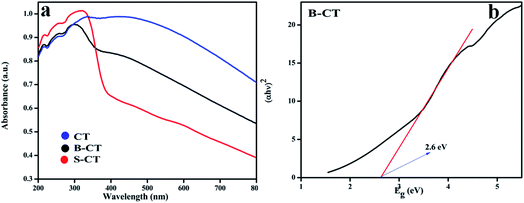
The light responsive properties of the catalyst play a crucial role in the process of photocatalytic reactions. To verify the light-sensitive characteristics of all of the synthesised photocatalysts, UV-vis DRS analysis was performed and the obtained absorbance values are shown in Fig. 3a. From the plotted optical absorbance graph, it can be clearly seen that CT (carbon-modified TiO2) has a wide light harnessing ability that covers the whole visible and part of the infrared region of the solar spectrum, which is due to the carbon presence as carbon shows black body properties. However, a new phenomenon is visualised, i.e. when CT is doped with the B or S atom, the absorbance experiences a lower wavelength region (hypochromic shift) drift, as shown in Fig. 3a, which is due to the doping effect. Moreover, the bandgap energy of the B-CT photocatalyst was calculated using the Kubelka–Munk eqn (1):where h, α, Eg, ν, and A are Planck's constant, optical absorption coefficient, bandgap energy, frequency of light and the proportionality constant, respectively. For the above equation, n indicates the type of optical transition of the photocatalyst, i.e., n = 1/2 for a direct transition and n = 2 for an indirect transition.42 The band-gap energy of the B-TiO2 photocatalyst is 2.6 eV (Fig. 3b) and those of CT and S-CT are depicted in Fig. S2.† Furthermore, the calculated Urbach energies for CT, B-CT and S-CT are 1.31, 1.95 and 1.81 eV and the bandgap energy of CT and S-CT, respectively, are shown in Fig. S3 (ESI†). The higher value for B-CT implies that there are more disorders/defects in the TiO2 lattice. All the calculations were made following our previously reported work.43
 |
| | Fig. 3 (a) UV-Vis absorption spectra of CT, S-CT and B-CT and (b) the band gap energy of B-CT. | |
Photoluminescence spectroscopy (PL) analysis
Another important optical characterization technique is PL spectroscopy, which gives vital information regarding the photogenerated e−/h+ pair recombination and transfer behaviour.33Fig. 4 depicts the PL analysis results of carbon-modified TiO2 and its doped counterparts. It was observed that the PL peak of doped TiO2 is of low intensity compared to that of CT (B-CT < S-CT < CT). The different excitonic transition that occurs in the photocatalyst is due to the oxygen vacancies and surface defects of the TiO2 photocatalyst. The PL spectra centred at 399 nm is related to the light responsive electronic transition between the valence band and conduction band of TiO2 while the other peaks centred at 413, 451, 469, 490 and 532 nm can be allocated to the oxygen vacancies of self-trapped electrons, recombination of photogenerated electrons and holes and the intrinsic state of TiO2.44 In particular, the peak that arises at 413 nm is due to the indirectly allowed transition of excitons at TiO6 octahedral sites, while the peak at 451 nm is due to the charge separation between Ti3+ and O2− in (TiO6)8−.45 Furthermore, the peaks at around 469, 490 and 532 nm originate from the surface defects and oxygen vacancies of the TiO2 photocatalyst, respectively.46 These defect states act as trapping sites and hence reduce the exciton recombination process and prolong the lifetime of charge carriers. Again, effective separation means a greater number of photogenerated electrons and holes, and hence more catalytic activity. The above claim of productive charge separation in B-CT was well justified from the EIS study and photocatalytic activity.
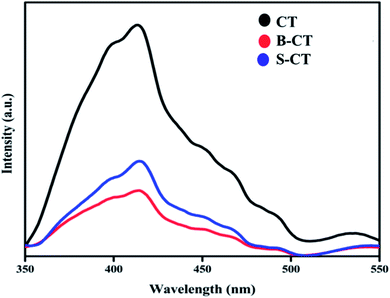 |
| | Fig. 4 Photoluminescence spectra of CT, S-CT and B-CT. | |
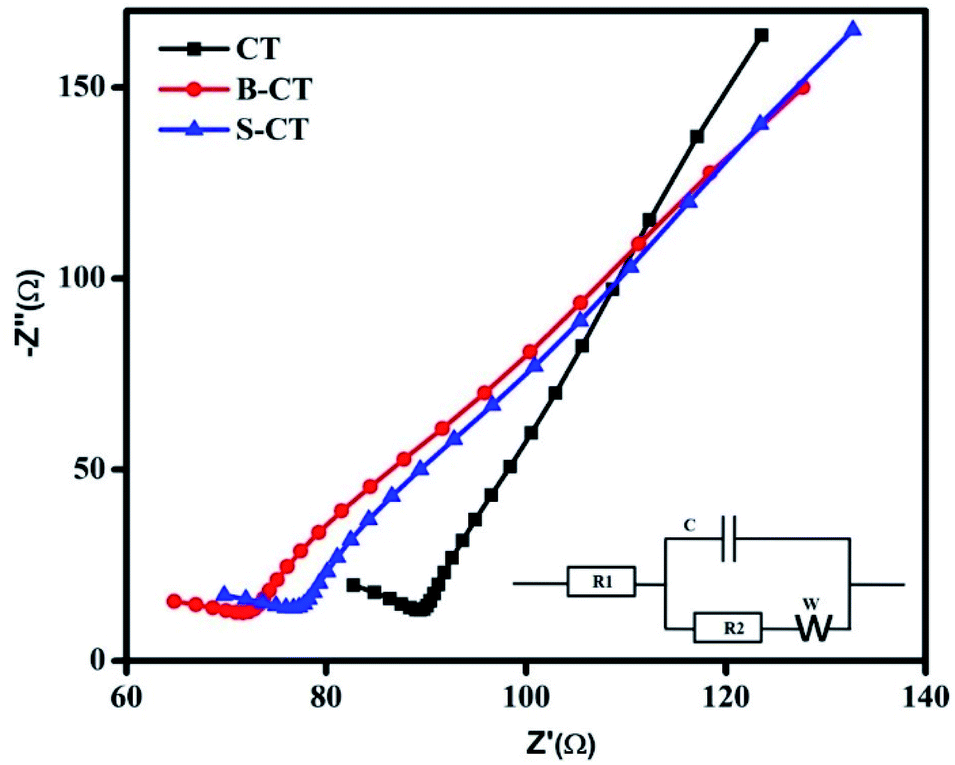
Electrochemical impedance spectroscopy (EIS) analysis
So far, we have discussed the exciton separation efficiency through observing the radiative emission of samples, i.e. PL analysis. Now to add more to the above phenomenon, such as charge carrier separation and the effective transfer of photogenerated e−–h+ pairs to carry out the photocatalytic reaction, EIS measurements were performed under zero basing conditions in the dark of the as-synthesised CT and doped CT. The plotted Nyquist graph in Fig. 5 is divided into two parts (i) a higher frequency region containing the semi-circle gives an idea about the pace of charge separation and transfer phenomenon and (ii) the second part in a lower zone (loop) gives information about the electron transport kinetics and ion diffusion rate.47 Generally, the smaller the diameter of the arc, the better the charge separation and transfer effect. Similarly, the straighter the loop, the faster the electron migration and ion diffusion kinetics.30,48,49 In the present investigation, doped CT (B-CT) shows an effective separation and better transport of the charge carriers (small arc diameter and straight loop) compared to S-CT followed by CT, as observed from the Nyquist graph. Additionally, the inset in Fig. 5 represents a suitable circuit diagram that fits the plotted Nyquist graph where R1 and R2 stand for the electrolyte and electrolyte/electrode resistance and C and W represent the capacitance and Warburg impedance value. Moreover, the above conclusion is well supported by the PL and catalytic activity studies.
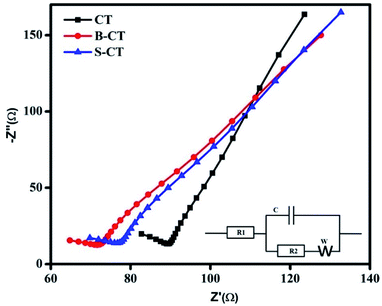 |
| | Fig. 5 Nyquist plots of CT, S-CT and B-CT. | |
Mott–Schottky (MS) analysis
Mott–Schottky analysis was carried out to determine the nature of the semiconductor (n or p-type) and to compute the band edge potential which will be used in sketching out the reaction mechanism. The flat band potential was calculated following the Mott–Schottky formula referring to our published article.50Fig. 6 depicts the MS plot of the synthesised photocatalyst scanned in the dark at an applied frequency of 500 Hz. The positive slope drawn on the potential axis for all of the samples implies an n-type semiconducting feature, i.e. electrons as the majority charge carriers and the calculated flat band potentials are found to be CT = −0.36 V, S-CT = −0.42 V and B-CT = −0.5 V vs. Ag/AgCl.51 The intercept on the X-axis gives the flat band potential (Efb) value and in the case of n-type semiconductors, the bottom of the conduction band (CB) lies just 0–0.1 V above the Efb. So, we can say that the conduction band potential of B-CT is −0.41 eV and the VB is 2.19 eV vs. the NHE scale at pH 6.8 as the Eg of B-CT is 2.6 eV.43 Furthermore, it was observed that in doped systems the Efb undergoes a negative shift/smaller slope, suggesting a higher donor density, which can be attributed to the presence of oxygen vacancies/defects (proved via XPS and the Urbach energy) and this will lead to effective separation and transport of charge carriers about the electrode–electrolyte interface.52 Additionally, as the B-doped carbonised TiO2 has a higher negative Efb value, it will show higher charge conductivity and mobility that ultimately boost the catalytic activity.
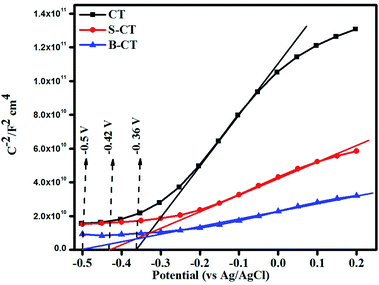 |
| | Fig. 6 Mott–Schottky plot of CT, S-CT and B-CT. | |
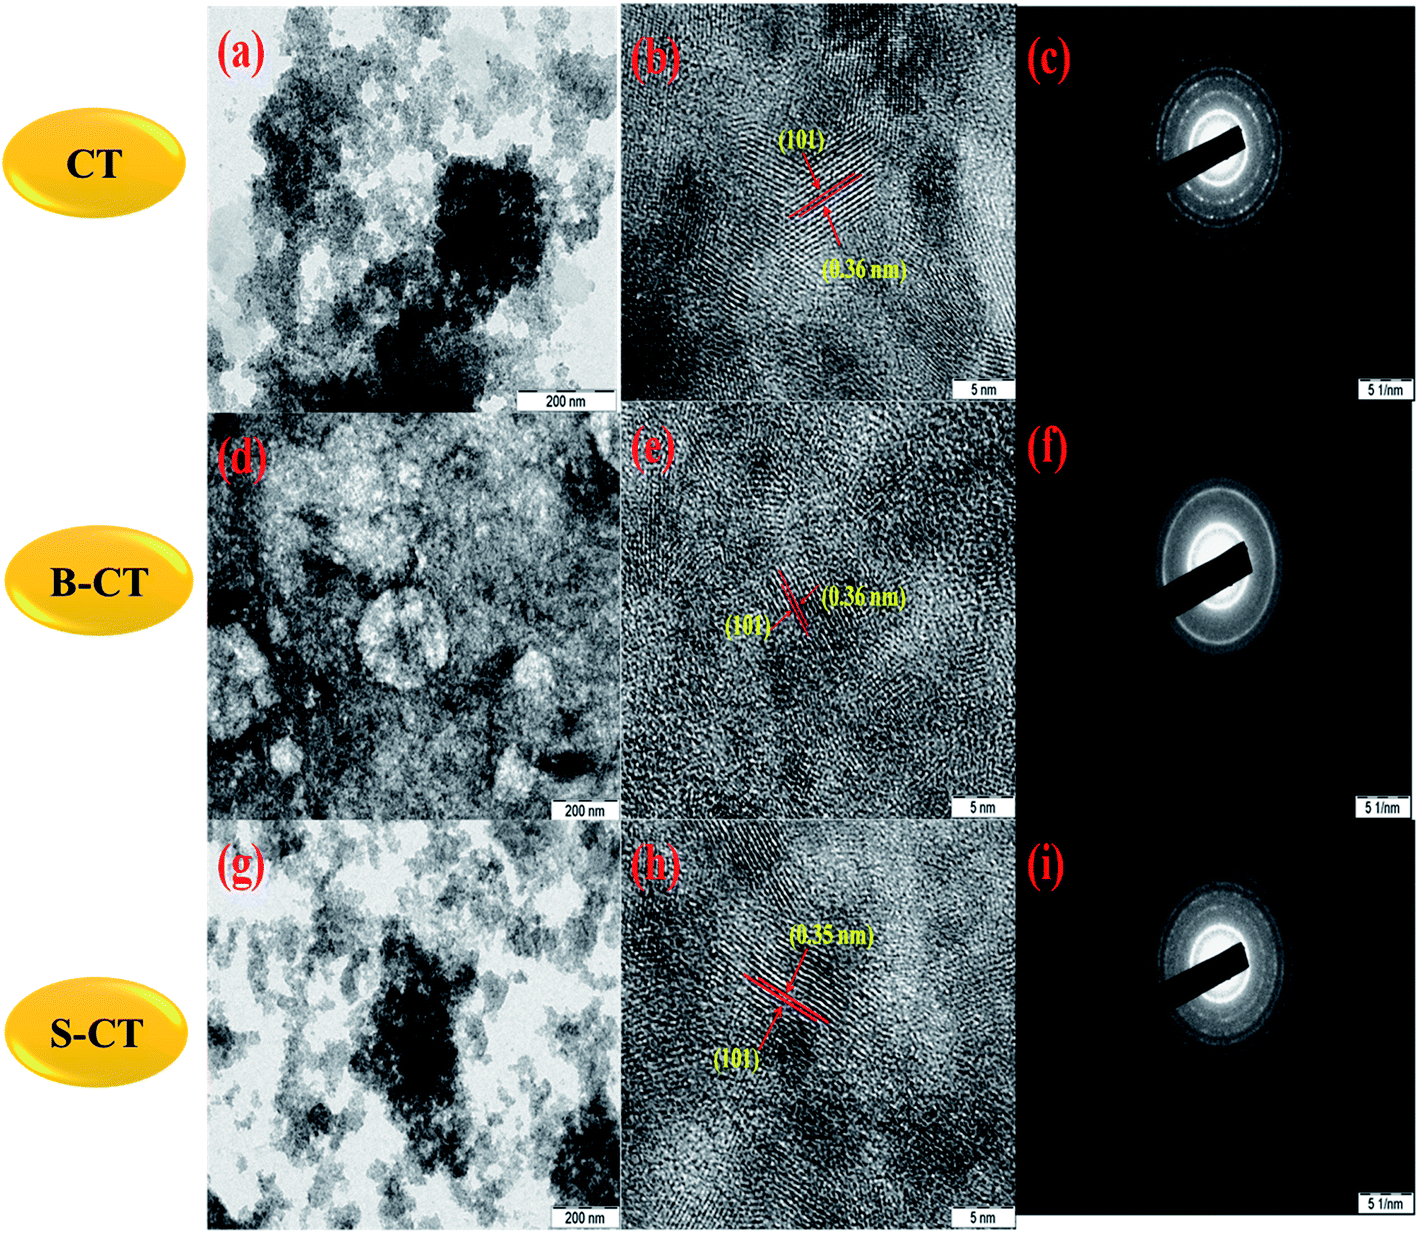
SEM and HRTEM analysis
In order, to ascertain the shape, size, elemental content and crystallinity of the as-prepared material, SEM, TEM, HRTEM, SAED and EDX analyses were performed. The SEM image shown in Fig. 7a presents a sheet-like morphology for CT. However, more agglomeration and a fragmented sheet-like morphology were observed in the case of S- and B-doped CT (Fig. 7b and c). The agglomeration of sheets may be due to the existence of van der Waals forces of attraction, whereas the TEM of CT depicts the sheets more clearly, in the case of doped carbonised TiO2 (S- and B-doped), the sheets were more or less of the fragmented type with a number of white spots that indicate poor formation on the sheet horizon. Furthermore, the lattice d-spacing as calculated for all of the prepared samples (CT, B-CT and S-CT) were found to be d = 0.36 nm and indexed to the (101) crystal plane of anatase TiO2. Fig. 8c, f and i displays the SAED images of doped and un-doped TiO2. The definite circular ring along with dots implies the polycrystalline character of the prepared samples and these data show good correlation with the performed XRD analysis. The elemental content, such as Ti, O, S, B and C, was well proved via EDX analysis, which was further confirmed through colour elemental mapping that shows the elemental distribution in the different as-prepared samples and detailed images are shown in the ESI (S3 and S4†).
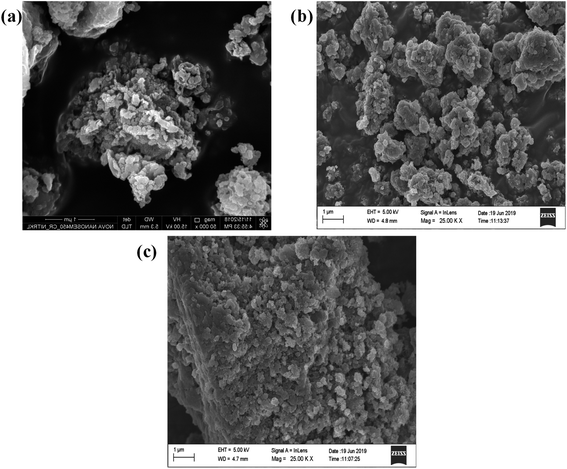 |
| | Fig. 7 FESEM images of (a) CT, (b) B-CT and (c) S-CT. | |
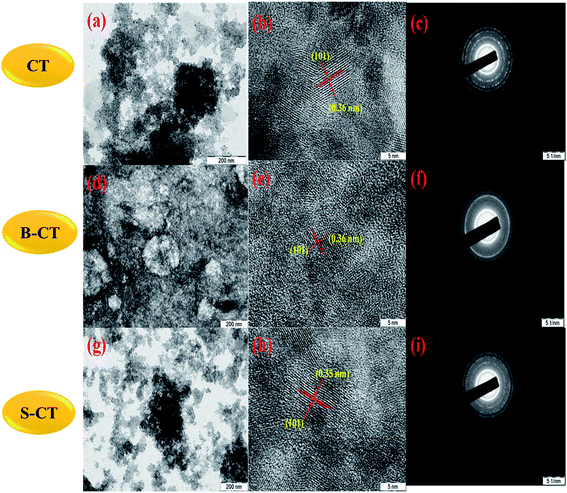 |
| | Fig. 8 TEM, HRTEM and SAED images of ((a), (b) and (c)) CT, ((d), (e) and (f)) B-CT and ((g), (h) and (i)) S-CT. | |
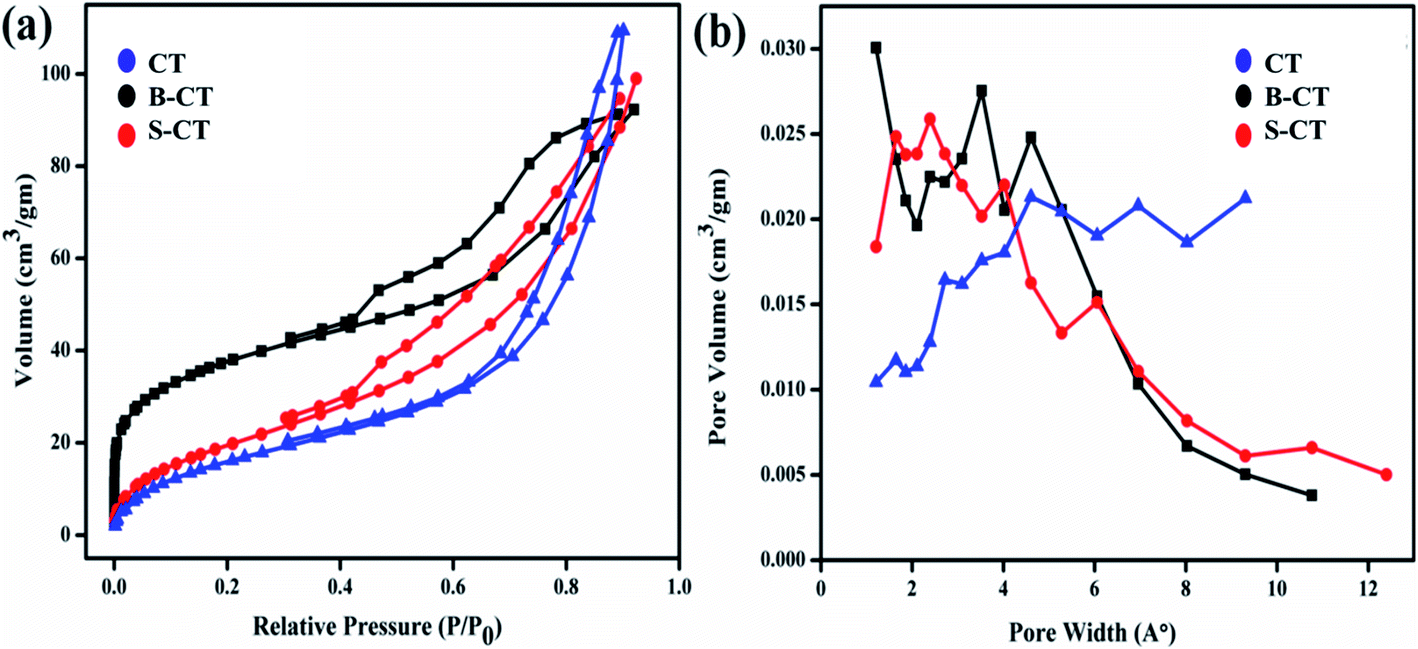
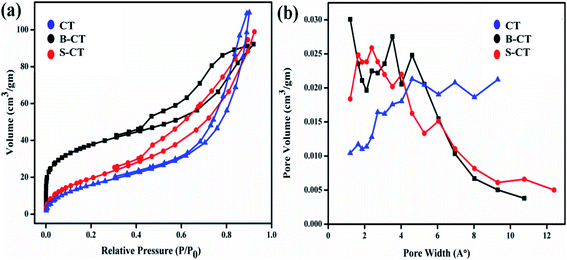
N2 adsorption–desorption analysis
As we know, surface area plays a vital role in magnifying the catalytic potential of photocatalytic materials, so BET and BJH measurements, i.e. N2 the adsorption–desorption isotherms and pore size distributions of the as-prepared samples were carried out and are presented in Fig. 9. It can be clearly visualised from the plotted BET results that all of the studied photocatalysts depict a type-IV isotherm with a H2 hysteresis loop, which implies a mesoporous framework of aggregated small TiO2 crystallites (well supported by the TEM images).53 Furthermore, in the BJH graph, peaks were observed at a pore diameter of 8.08 nm (CT), 11.12 nm (B-CT) and 4.35 nm (S-CT), indicating the narrow distribution of the mesopore dimensions. Moreover, all of the collected data regarding pore volume, surface area and pore diameter distribution of the prepared samples are tabulated in Table 2. From the above-obtained results, it was confirmed that B-doped CT has a higher surface area with a larger pore diameter and volume compared to CT. This is because doping of non-metals/anions into the TiO2 lattice prevents the aggregation of smaller TiO2 crystallites, resulting in a bigger pore and higher surface area. But, in the case of CT, the small TiO2 aggregates to form sheets that are small in size.32 The high surface area of doped TiO2 is well reflected in its high catalytic performance. This further clarifies that high light absorption is not the only criterion that determines the photocatalytic superiority of the material, the surface area also plays a major role.
 |
| | Fig. 9 (a) Nitrogen sorption isotherms and (b) pore size distribution curves of CT, S-CT and B-CT. | |
Table 2 Representation of the obtained surface area, mean pore diameter and pore volume
| Sample |
Surface area (m2 g−1) |
Mean pore diameter (nm) |
Pore volume (cm3 g−1) |
| B-CT |
127.28 |
11.12 |
0.16 |
| S-CT |
60.87 |
5.62 |
0.20 |
| CT |
75.74 |
8.08 |
0.17 |
Photocatalytic reduction of N2 to NH3
The catalytic ability of the designed photocatalysts was examined towards the reduction of dinitrogen to ammonia under visible light illumination. In these experiments, 0.15 g of the sample was added to 50 mL of deionised water (DW) saturated with N2 gas and in the absence of a scavenging reagent. A series of other experiments were performed, i.e. in the absence of a catalyst or light, no ammonia formation was observed, which confirms that ammonia generation only occurs via the photocatalytic pathway. It can be seen from Fig. 10a that CT displays a low catalytic activity with 24.33 μmol L−1 whereas B-CT and S-CT produce NH4+ with 32.38 and 29.33 μmol L−1, respectively. The above reduction experiment was carried out in a methanol solution (10 vol%) and in a low pH range; detailed effects of the used reagents and conditions are given below. This enhancement in the yield rate due to CH3OH use can be attributed to it (i) acting as an electron donor and (ii) producing CO2, as both these factors favour N2 fixation. Additionally, it was observed that N2 reduction is more feasible under a low pH as the activation energy barrier is reduced under acidic conditions and a greater number of protons will be in the medium to accelerate the conversion process. Hence, the photoreduction reaction was performed for the as-prepared samples in an acidic medium by adjusting the pH with dilute HCl. Out of them all, B-CT shows the best result due to the effective separation of charge carriers via defect sites and a porous framework that act as anchoring points for N2 and its further reduction to ammonia. Hence, under a low pH or in a high proton concentration, catalysts are more active towards N2 photoreduction. Again, the apparent conversion efficiency (solar to chemical) of B-CT was found to be 0.076%.54
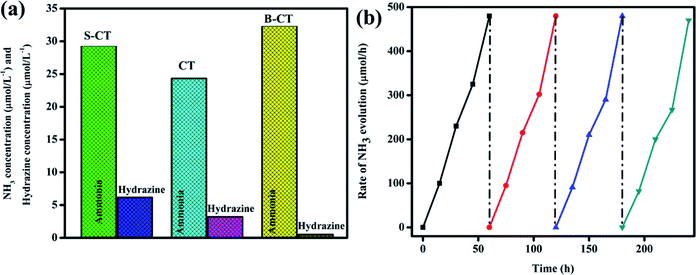 |
| | Fig. 10 (a) Photo fixation of nitrogen to ammonia and to hydrazine over CT, S-CT and B-CT and (b) reusability graph of B-CT. | |
Furthermore, to justify the importance of N2 gas, DW and photoelectrons, more reactions were set up such as (i) no ammonia was obtained when the reaction was carried out in argon saturated DW, which suggests that the photoreduction of the supplied N2 gas takes place specifically, (ii) again, when the aprotic solvent DMF was used still no ammonia formation was seen, which implies the protons of water aid in the photo fixation process, and finally, (iii) with the addition of AgNO3 (an electron scavenger) a very low or negligible amount of ammonia was produced, suggesting the importance of electrons in the conversion of N2 to NH3. Furthermore, longevity or stability is a vital parameter in quantifying the efficiency of the catalyst, and hence the best photocatalyst (B-CT) was again subjected to a reusability test and it can be observed in Fig. 10b that the material maintains its activity for up to three consecutive cycles and then starts to reduce in the fourth cycle.
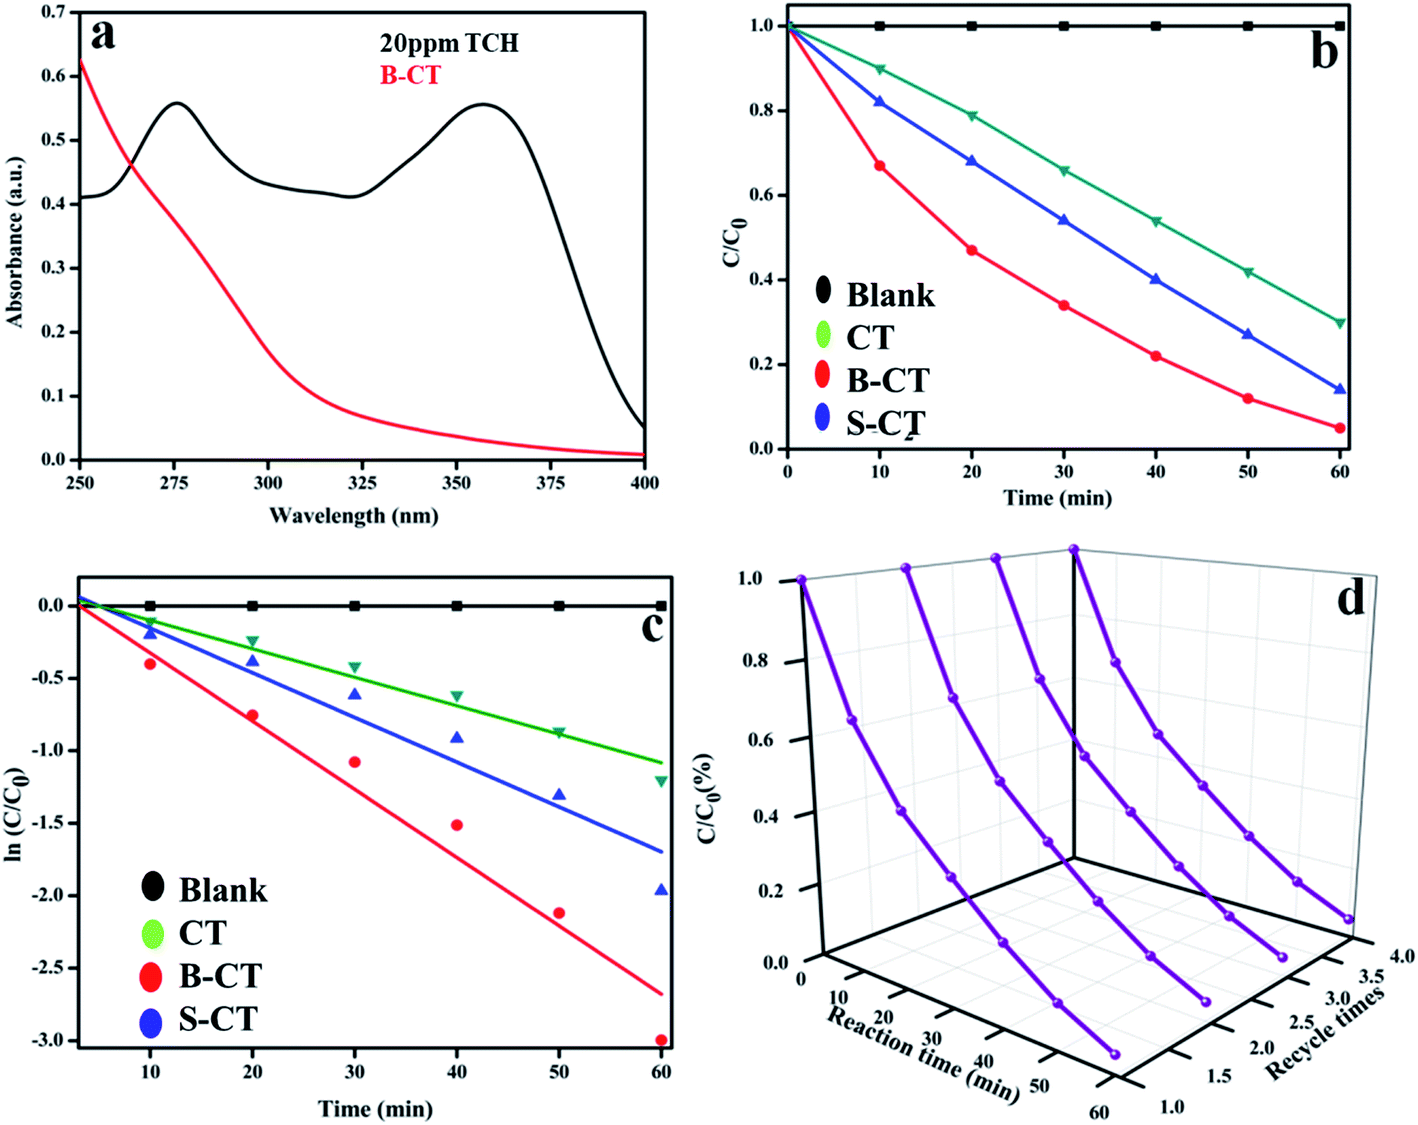
Photodegradation of TCH
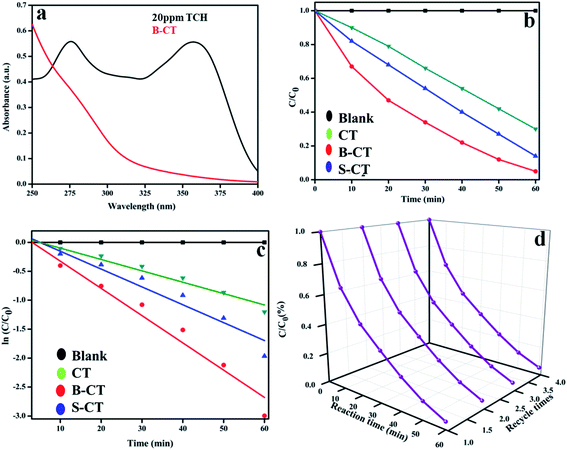
Furthermore, to aid the photocatalytic potential, as shown in Fig. 6, measurements were again carried out for the decomposition of TCH (20 mL (10 ppm) TCH + 20 mg catalyst) under visible photon irradiation (250 W medium pressure Hg-lamp) in the same quartz batch reactor setup. Fig. 11a displays the optical absorbance graph of neat TCH and B-CT photocatalysed TCH. Furthermore, it was found from the C/C0 as highlighted in Fig. 11b that B-CT shows the best degradation results, i.e. 95%, with S-doped at 86% and CT at 70% within a time gap of 1 h. The plotted absorbance graph depicts two peaks, one at 275 nm (acylamino and a hydroxyl group) and the other at about 357 nm (hydroxyl-containing rings). Again, the degradation kinetics, i.e. the ln![[thin space (1/6-em)]](https://www.rsc.org/images/entities/char_2009.gif) C/C0vs. time plot (Fig. 11c) follows pseudo first-order kinetics with a high rate contact value for B-CT (see Table 3). Furthermore, to examine the photo durability, which is an important physical parameter in distinguishing the material photocatalytic ability from other properties, a catalyst reusability experiment was performed following our previously reported paper and the obtained data are plotted in Fig. 11d. The results suggest that the catalyst is quite stable up to four consecutive cycles with a very small decrease in the activity, which can be attributed to mass loss and active surface deterioration during the cleaning process for further use. Additionally, to showcase the robust photocatalytic performance of our prepared photocatalyst with those of other reported doped TiO2 photocatalytic systems, a comparison table is in included in the ESI (T1†).
C/C0vs. time plot (Fig. 11c) follows pseudo first-order kinetics with a high rate contact value for B-CT (see Table 3). Furthermore, to examine the photo durability, which is an important physical parameter in distinguishing the material photocatalytic ability from other properties, a catalyst reusability experiment was performed following our previously reported paper and the obtained data are plotted in Fig. 11d. The results suggest that the catalyst is quite stable up to four consecutive cycles with a very small decrease in the activity, which can be attributed to mass loss and active surface deterioration during the cleaning process for further use. Additionally, to showcase the robust photocatalytic performance of our prepared photocatalyst with those of other reported doped TiO2 photocatalytic systems, a comparison table is in included in the ESI (T1†).
 |
| | Fig. 11 (a) Optical absorption spectra of neat TCH and B-CT treated TCH, (b) C/C0 plot of CT and doped CT, (c) kinetics plot of CT and doped (B and S) CT and (d) a graph showing the photostability of B-CT. | |
Table 3 TCH degradation details
| Photocatalyst |
R
2
|
Rate constant ‘k’ (min−1) |
Half-life period t1/2 (min) |
TCH degradation (%) |
| B-CT |
0.95 |
47 × 10−3 |
14.74 |
95 |
| S-CT |
0.93 |
30 × 10−3 |
23.1 |
86 |
| CT |
0.95 |
19 × 10−3 |
36.47 |
70 |
Scavenger test
In order to elaborate the reaction pathway (a mechanism), i.e. the active species (h+, e−, OH˙, O2˙−) responsible for the photocatalytic reaction, and hence draw a proper scheme of the mechanism, scavenger experiments were carried out and the details are described as follows. In the performed test, tracing reagents were taken for specific active species, such as benzoquinone (˙O2−), isopropyl alcohol (˙OH), EDTA (h+) and AgNO3 (e−). In the case of antibiotic degradation, it was found that with the addition of isopropanol and benzoquinone, the degradation percentage significantly reduces. This observation clearly suggests that hydroxyl (˙OH) and super-oxide (˙O2−) radicals play a key role in the photodegradation process. Fig. 12 clearly supports the above claim, wherein the presence of a superoxide and the hydroxyl maximum degradation is shown.
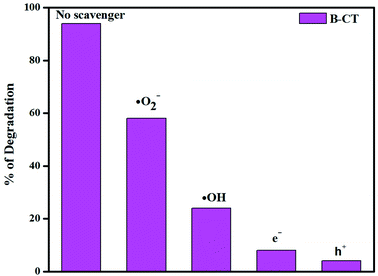 |
| | Fig. 12 Histogram showing the scavenger test results. | |
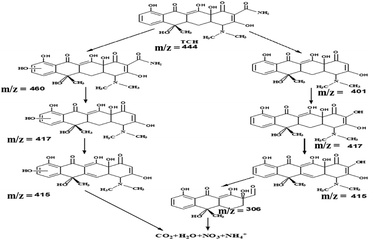
The LC-MS analysis of the TCH photodegradation over B-CT
To gain more insight about the degradation pathway of TCH over a B-CT surface under light irradiation, LC-MS characterization was carried out. Based on the obtained MS spectrum as shown in ESI (S5†), a fragmentation pathway of TCH photo-degradation via different intermediate species identified by their respective m/z ratio is presented in Scheme 2.
 |
| | Scheme 2 The degradation pathway via different intermediates. | |
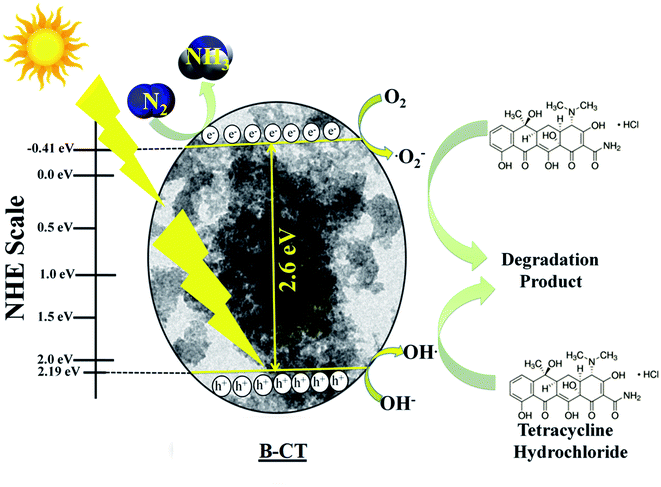
Mechanistic approach
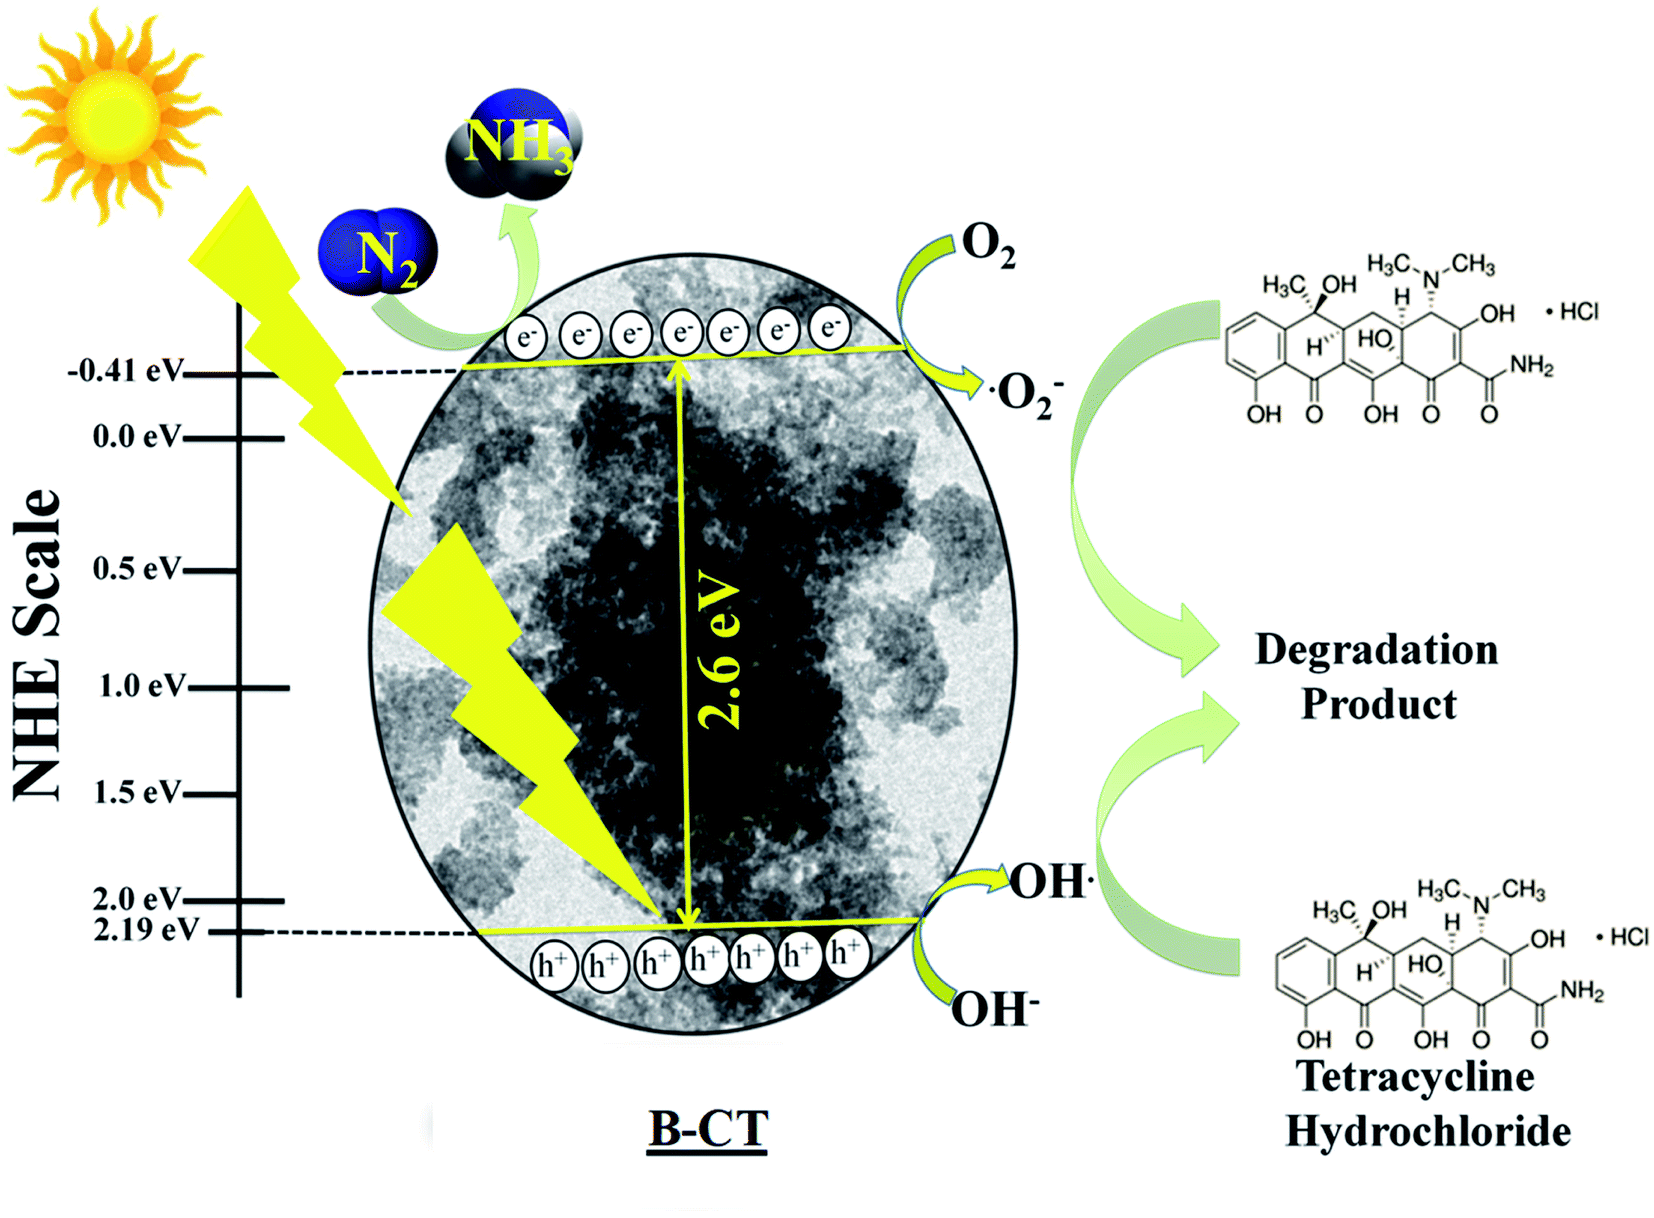
To explain the high photocatalytic activity of B-doped CT towards N2 reduction and TCH degradation under visible light illumination, we have designed a plausible mechanistic pathway, as depicted in Scheme 3. From the Mott–Schottky analysis, the CB position of B-CT was estimated to be −0.41 eV and VB is about 2.19 eV on the NHE scale (at pH 6.8). Upon light irradiation, the electrons in the VB of B-CT get photoexcited and accelerate to the CB leaving behind holes. The gathered photoelectrons on CB come into action and start reducing N2 to NH3 along with protons generated from the acidic solvent. Also, these highly reducing electrons interact with molecular oxygen and produce a superoxide radical as the CB band position is highly negative (−0.41 eV) compared to the standard redox potential (O2/˙O2− = −0.33 eV vs. NHE).43,55,56 This favours the production of a high amount of superoxide radicals which then react with TCH and initiate the degradation process. Furthermore, the holes in the VB (2.19 eV) are capable of generating hydroxyl radicals (OH/OH˙ = 1.99 eV vs. NHE) due to their high reduction potential.56 Thereby, one indirect pathway is also that the OH˙ radical is formed (detail equated below) and carries out the decomposition of TCH. The effect of both these species on the degradation process is well established via scavenger experiments. The designed Scheme 1 navigates the reduction (N2 to NH3) and degradation (TCH) pathway.
 |
| | Scheme 3 The mechanism of N2 photo-fixation and TCH degradation over B-CT. | |
Eqn (2) and (3) for the indirect hydroxyl radical generation are narrated as follows:
| | | O2 + e− → ˙O2−, ˙O2− + H+ → H2O2 + O2 | (2) |
| | | H2O2 + O2 + ˙O2− → OH˙ + O2 + OH− | (3) |
Additionally, the eqn (4) depicts the N2 reduction.57
Conclusion
In this study, we demonstrated a successful synthetic protocol for carbonised TiO2 and its doped counterparts and further verified their catalytic ability by exposing these fabricated photocatalysts towards dinitrogen photoreduction and TCH degradation under a visible light source. It was observed that of our prepared catalysts, B-CT displays the best activity, i.e. a 0.076% conversion efficiency towards nitrogen photo-fixation and 95% TCH degradation, which is well supported by the PL, BET and EIS data. The above characterization techniques clearly indicate a better charge separation and more active site availability in B-CT, which result in its high catalytic activity. Further, more defects in the formed B-CT can be well justified by XPS and Urbach energy analyses, which also play a crucial role in its increase in activity. The synthesis route is expected to be applicable in designing other anions doped with defect-oriented metal oxide 2D systems. Additionally, this investigation may open up a new avenue for exploring various hybrids of defect framed doped TiO2, which would be effective towards environmental sustainability and energy-related applications.
Conflicts of interest
There is no conflict of interest.
Acknowledgements
The authors are very much thankful to the S ‘O’ A (Deemed to be University) management for their encouragement and constant support. Mr Sriram Mansingh and Sabiha Sultana are grateful to CSIR for awarding SRF.
References
- P. Song, H. Wang, L. Kang, B. Ran, H. Song and R. Wang, Electrochemical nitrogen reduction to ammonia at ambient conditions on nitrogen and phosphorus co-doped porous carbon, Chem. Commun., 2019, 55, 687–690 RSC.
- S. L. Foster, S. I. P. Bakovic, R. D. Duda, S. Maheshwari, R. D. Milton, S. D. Minteer and L. F. Greenlee, Catalysts for nitrogen reduction to ammonia, Nat. Catal., 2018, 1, 490 CrossRef.
- R. R. Schrock, Molybdenum does it again, Nat. Chem., 2011, 3, 95–96 CrossRef CAS PubMed.
- X. Chen, N. Li, Z. Kong, W. J. Ong and X. Zhao, Photocatalytic fixation of nitrogen to ammonia: state-of-the-art advancements and future prospects, Mater. Horiz., 2018, 5, 9–27 RSC.
- J. M. Walls, J. S. Sagu and K. U. Wijayantha, Microwave synthesised Pd–TiO2 for photocatalytic ammonia production, RSC Adv., 2019, 9, 6387–6394 RSC.
- R. Strait and M. Nagvekar, Carbon dioxide capture and storage in the nitrogen and syngas industries, Nitrogen + Syngas, 2010, 303, 1–3 Search PubMed.
- P. J. Gonzalez, C. Correia, I. Moura, C. D. Brondino and J. J. G. Moura, Bacterial nitrate reductases: molecular and biological aspects of nitrate reduction, J. Inorg. Biochem, 2006, 100, 1015–1023 CrossRef CAS PubMed.
- M. Dortsiou and G. Kyriacou, Electrochemical reduction of nitrate on bismuth cathodes, J. Electroanal. Chem., 2009, 630, 69–74 CrossRef CAS.
- F. Epron, F. Gauthard and J. Barbier, Catalytic reduction of nitrate in water on a monometallic Pd/CeO2 catalyst, J. Catal., 2002, 206, 363–367 CrossRef CAS.
- Y. Huang, N. Zhang, Z. Wu and X. Xie, Artificial nitrogen fixation over bismuth-based photocatalysts: fundamentals and future perspectives, J. Mater. Chem. A, 2020, 8, 4978–4995 RSC.
- J. Liu, R. Li, X. Zu, X. Zhang, Y. Wang, Y. Wang and C. Fan, Photocatalytic conversion of nitrogen to ammonia with water on triphase interfaces of hydrophilic–hydrophobic composite Bi4O5Br2/ZIF-8, Chem. Eng. J., 2019, 371, 796–803 CrossRef CAS.
- J. Li, P. Liu, Y. Tang, H. Huang, H. Cui, D. Mei and C. Zhong, Single-Atom Pt–N3 Sites on the Stable Covalent Triazine Framework Nanosheets for Photocatalytic N2 Fixation, ACS Catal., 2020, 10, 2431–2442 CrossRef CAS.
- S. Mansingh, S. Sultana, R. Acharya, M. K. Ghosh and K. M. Parida, Efficient Photon Conversion via Double Charge Dynamics CeO2–BiFeO3 p–n Heterojunction Photocatalyst Promising toward N2 Fixation and Phenol–Cr(VI) Detoxification, Inorg. Chem., 2020, 59, 3856–3873 CrossRef CAS PubMed.
- G. Swain, S. Sultana and K. Parida, Constructing a Novel Surfactant-free MoS2 Nanosheet Modified MgIn2S4 Marigold Microflower: An Efficient Visible-Light Driven 2D–2D p–n Heterojunction Photocatalyst toward HER and pH Regulated NRR, ACS Sustainable Chem. Eng., 2020, 12, 4848–4862 CrossRef.
- S. Liu, Y. Wang, S. Wang, M. You, S. Hong, T. S. Wu and B. Wang, Photocatalytic Fixation of Nitrogen to Ammonia by Single Ru Atom Decorated TiO2 Nanosheets, ACS Sustainable Chem. Eng., 2019, 7, 6813–6820 CrossRef CAS.
- Z. L. Zhang, M. Wan and Y. L. Mao, Enhanced photovoltaic effect of TiO2-based composite ZnFe2O4/TiO2, J. Photochem. Photobiol., A, 2012, 233, 15–19 CrossRef CAS.
- A. Sinhamahapatra, J. P. Jeon and J. S. Yu, A new approach to prepare highly active and stable black titania for visible light-assisted hydrogen production, Energy Environ. Sci., 2015, 8, 3539–3544 RSC.
- X. Wang, R. Fu, Q. Yin, H. Wu, X. Guo, R. Xu and Q. Zhong, Black TiO2 synthesized via magnesiothermic reduction for enhanced photocatalytic activity, J. Nanopart. Res., 2018, 20, 89 CrossRef.
- N. Li, X. Zhang, W. Zhou, Z. Liu, G. Xie, Y. Wang and Y. Du, High quality sulfur-doped titanium dioxide nanocatalysts with visible light photocatalytic activity from non-hydrolytic thermolysis synthesis, Inorg. Chem. Front., 2014, 1, 521 RSC.
- P. S. Basavarajappa, S. B. Patil, N. Ganganagappa, K. R. Reddy, A. V. Raghu and C. V. Reddy, Recent progress in metal-doped TiO2, non-metal doped/codoped TiO2 and TiO2 nanostructured hybrids for enhanced photocatalysis, Int. J. Hydrogen Energy, 2019, 45, 7764–7778 CrossRef.
- A. Zada, Y. Qu, S. Ali, N. Sun, H. Lu, R. Yan, X. Zhang and L. Jing, Improved visible light activities for degrading pollutants on TiO2/g-C3N4 nanocomposites by decorating SPR Au nanoparticles and 2,4-dichlorophenol decomposition path, J. Hazard. Mater., 2018, 342, 715–723 CrossRef CAS PubMed.
- Y. B. Cheng and D. P. Thompson, Role of anion vacancies in nitrogen-stabilized zirconia, J. Am. Ceram. Soc., 1993, 76(3), 683–688 CrossRef CAS.
- L. Yuan, C. Han, M. Q. Yang and Y. J. Xu, Photocatalytic water splitting for solar hydrogen generation: fundamentals and recent advancements, Int. Rev. Phys. Chem., 2016, 35, 1–36 Search PubMed.
-
F. Huang, A. Yan and H. Zhao, Influences of doping on photocatalytic properties of TiO2 photocatalyst, Semiconductor Photocatalysis—Materials, Mechanisms and Applications, ed. W. Cao, 2016, pp. 31–80 Search PubMed.
- J. Zhou, G. Tian, Y. Chen, J. Q. Wang, X. Cao, Y. Shi, K. Pan and H. Fu, Synthesis of hierarchical TiO2 nanoflower with anatase–rutile heterojunction as Ag support for efficient visible-light photocatalytic activity, Dalton Trans., 2013, 42, 11242–11251 RSC.
- S. Pany and K. M. Parida, A facile in situ approach to fabricate N,S-TiO2/g-C3N4 nanocomposite with excellent activity for visible light induced water splitting for hydrogen evolution, Phys. Chem. Chem. Phys., 2015, 17, 8070–8077 RSC.
- S. Pany, B. Naik, S. Martha and K. Parida, Plasmon induced nano Au particle decorated over S,N-modified TiO2 for exceptional photocatalytic hydrogen evolution under visible light, ACS Appl. Mater. Interfaces, 2014, 6, 839–846 CrossRef CAS PubMed.
- S. Pany and K. M. Parida, Sulfate-anchored hierarchical meso–macroporous N-doped TiO2: a novel photocatalyst for visible light H2 evolution, ACS Sustainable Chem. Eng., 2014, 2, 1429–1438 CrossRef CAS.
- K. M. Parida, S. Pany and B. Naik, Green synthesis of fibrous hierarchical meso–macroporous N doped TiO2 nanophotocatalyst with enhanced photocatalytic H2 production, Int. J. Hydrogen Energy, 2013, 38, 3545–3553 CrossRef CAS.
- Y. Ma, M. Ni and S. Li, Optimization of malachite green removal from water by TiO2 nanoparticles under UV irradiation, Nanomaterials, 2018, 8, 428 CrossRef PubMed.
- S. Pany, K. M. Parida and B. Naik, Facile fabrication of mesoporosity driven N–TiO2@CS nanocomposites with enhanced visible light photocatalytic activity, RSC Adv., 2013, 3, 4976–4984 RSC.
- A. K. Tripathi, M. C. Mathpal, P. Kumar, M. K. Singh, M. A. G. Soler and A. Agarwal, Structural, optical and photoconductivity of Sn and Mn doped TiO2 nanoparticles, J. Alloys Compd., 2015, 622, 37–47 CrossRef CAS.
- X. Yang, C. Cao, L. Erickson, K. Hohn, R. Maghirang and K. Klabunde, Photo-catalytic degradation of Rhodamine B on C-, S-, N-, and Fe-doped TiO2 under visible-light irradiation, Appl. Catal., B, 2009, 91, 657–662 CrossRef CAS.
- S. Mansingh, D. K. Padhi and K. M. Parida, Enhanced visible light harnessing and oxygen vacancy promoted N, S co-doped CeO2 nanoparticle: a challenging photocatalyst for Cr(VI) reduction, Catal. Sci. Technol., 2017, 7, 2772–2781 RSC.
- F. Wei, H. Wang, W. Ran, T. Liu and X. Liu, Preparation of S–N co-doped CoFe2O4@rGO@TiO2 nanoparticles and their superior UV-Vis light photocatalytic activities, RSC Adv., 2019, 9, 6152–6162 RSC.
- R. T. Bento, O. V. Correa and M. F. Pillis, Photocatalytic activity of undoped and sulfur-doped TiO2 films grown by MOCVD for water treatment under visible light, J. Eur. Ceram. Soc., 2019, 39, 3498–3504 CrossRef CAS.
- W. Yuan, L. Cheng, Y. An, S. Lv, H. Wu, X. Fan, Y. Zhang, X. Guo and J. Tang, Laminated hybrid junction of sulfur-doped TiO2 and a carbon substrate derived from Ti3C2 MXenes: toward highly visible light-driven photocatalytic hydrogen evolution, Adv. Sci., 2018, 5, 1700870 CrossRef PubMed.
- M. Sun, Y. Jiang, M. Tian, H. Yan, R. Liu and L. Yang, Deposition of platinum on boron-doped TiO2/Ti nanotube arrays as an efficient and stable photocatalyst for hydrogen generation from water splitting, RSC Adv., 2019, 9, 11443–11450 RSC.
- X. Xue, Y. Wang and H. Yang, Preparation and characterization of boron-doped titania nano-materials with antibacterial activity, Appl. Surf. Sci., 2013, 264, 94–99 CrossRef CAS.
- H. Jing, Q. Cheng, J. M. Weller, X. S. Chu, Q. H. Wang and C. K. Chan, Synthesis of TiO2 nanosheet photocatalysts from exfoliation of TiS2 and hydrothermal treatment, J. Mater. Res., 2018, 33, 3540–3548 CrossRef CAS.
- H. Gao, Z. Liu, L. Song, W. Guo, W. Gao, L. Ci, A. Rao, W. Quan, R. Vajtai and P. M. Ajayan, Synthesis of S-doped graphene by liquid precursor, Nanotechnology, 2012, 23, 275605 CrossRef PubMed.
- W. H. Abdelraheem, M. K. Patil, M. N. Nadagouda and D. D. Dionysiou, Hydrothermal synthesis of photoactive nitrogen- and boron-codoped TiO2 nanoparticles for the treatment of bisphenol A in wastewater: Synthesis, photocatalytic activity, degradation byproducts and reaction pathways, Appl. Catal., B, 2019, 241, 598–611 CrossRef CAS.
- K. K. Das, S. Patnaik, B. Nanda, A. C. Pradhan and K. Parida, ZnFe2O4-Decorated Mesoporous Al2O3 Modified MCM-41: A Solar-Light-Active Photocatalyst for the Effective Removal of Phenol and Cr(VI) from Water, ChemistrySelect, 2019, 4, 1806–1819 CrossRef CAS.
- S. Sultana, S. Mansingh and K. M. Parida, Facile Synthesis of CeO2 Nanosheets Decorated Upon BiOI Microplate: A Surface Oxygen Vacancy Promoted Z-Scheme Based 2D–2D Nanocomposite Photocatalyst With Enhanced Photocatalytic Activity, J. Phys. Chem. C, 2018, 122, 808–819 CrossRef CAS.
- S. Mathew, A. Prasad Kumar, T. Benoy, P. Rakesh, M. Hari, T. Libish, P. Radhakrishnan, V. Nampoori and C. Vallabhan, UV-visible photoluminescence of TiO2 nanoparticles prepared by hydrothermal method, J. Fluoresc., 2012, 22, 1563–1569 CrossRef CAS PubMed.
- M. Diak, M. Klein, T. Klimczuk, W. Lisowski, H. Remita, A. Zaleska-Medynska and E. Grabowska, Photoactivity of decahedral TiO2 loaded with bimetallic nanoparticles: degradation pathway of phenol-1-13C and hydroxyl radical formation, Appl. Catal., B, 2017, 200, 56–71 CrossRef CAS.
- C. A. D'Amato, R. Giovannetti, M. Zannotti, E. Rommozzi, S. Ferraro, C. Seghetti, M. Minicucci, R. Gunnella and A. D. Cicco, Enhancement of visible-light photoactivity by polypropylene coated plasmonic Au/TiO2 for dye degradation in water solution, Appl. Surf. Sci., 2018, 441, 575–587 CrossRef.
- G. Darabdhara, P. K. Boruah, P. Borthakur, N. Hussain, M. R. Das, T. Ahamad, S. M. Alshehri, V. Malgras, K. C. W. Wu and Y. Yamauchi, Reduced graphene oxide nanosheets decorated with Au–Pd bimetallic alloy nanoparticles towards efficient photocatalytic degradation of phenolic compounds in water, Nanoscale, 2016, 8, 8276–8287 RSC.
- C. Li, X. Zhu, H. Zhang, Z. Zhu, B. Liu and C. Cheng, 3D ZnO/Au/CdS Sandwich Structured Inverse Opal as Photoelectrochemical Anode with Improved Performance, Adv. Mater. Interfaces, 2015, 2, 1500428 CrossRef.
- N. Tian, H. Huang, C. Liu, F. Dong, T. Zhang, X. Du, S. Yu and Y. Zhang,
In situ co-pyrolysis fabrication of CeO2/g-C3N4 n–n type heterojunction for synchronously promoting photo-induced oxidation and reduction properties, J. Mater. Chem. A., 2015, 3, 17120–17129 RSC.
- F. Ning, M. Shao, S. Xu, Y. Fu, R. Zhang, M. Wei, D. G. Evans and X. Duan, TiO2/graphene/NiFe-layered double hydroxide nanorod array photoanodes for efficient photoelectrochemical water splitting, Energy Environ. Sci., 2016, 9, 2633–2643 RSC.
- M. Szkoda, A. Lisowska-Oleksiak and K. Siuzdak, Optimization of boron-doping process of titania nanotubes via electrochemical method toward enhanced photoactivity, J. Solid State Electrochem., 2016, 20, 1765–1774 CrossRef CAS.
- M. Rahman, K. Krishna, T. Soga, T. Jimbo and M. Umeno, Optical properties and X-ray photoelectron spectroscopic study of pure and Pb-doped TiO2 thin films, J. Phys. Chem. Solids, 1999, 60, 201 CrossRef CAS.
- H. Hirakawa, M. Hashimoto, Y. Shiraishi and T. Hirai, Photocatalytic conversion of nitrogen to ammonia with water on surface oxygen vacancies of titanium dioxide, J. Am. Chem. Soc., 2017, 139, 10929–10936 CrossRef CAS PubMed.
- S. Gu, Y. Chen, X. Yuan, H. Wang, X. Chen, Y. Liu, Q. Jiang, Z. Wu and G. Zeng, Facile synthesis of CeO2 nanoparticles sensitized CdS nanorods photocatalyst with improved visible-light photocatalytic degradation of rhodamine B, RSC Adv., 2015, 5, 79556–79564 RSC.
- S. Subudhi, S. Mansingh, G. Swain, A. Behera, D. Rath and K. Parida, HPW-Anchored UiO-66 Metal–Organic Framework: A Promising Photocatalyst Effective toward Tetracycline Hydrochloride Degradation and H2 Evolution via Z-Scheme Charge Dynamics, Inorg. Chem., 2019, 58, 4921–4934 CrossRef CAS PubMed.
- H. Hirakawa, M. Hashimoto, Y. Shiraishi and T. Hirai, Photocatalytic conversion of nitrogen to ammonia with water on surface oxygen vacancies of titanium dioxide, J. Am. Chem. Soc., 2017, 139, 10929–10936 CrossRef CAS PubMed.
Footnote |
| † Electronic supplementary information (ESI) available: XPS survey scan and Urbach energy of all of the catalysts, bandgap energies of CT and S-CT, EDX and colour elemental mapping images of CT and B-CT, comparison table and LC-MS spectrum of TCH. See DOI: 10.1039/d0na00183j |
|
| This journal is © The Royal Society of Chemistry 2020 |

 Open Access Article
 This Open Access Article is licensed under a
  ,
Sabiha
Sultana
and
Kulamani
Parida
,
Sabiha
Sultana
and
Kulamani
Parida