DOI:
10.1039/D0NA00151A
(Paper)
Nanoscale Adv., 2020,
2, 2943-2949
A facile synthesis of two ionized fluorescent carbon dots and selective detection toward Fe2+ and Cu2+†
Received
23rd February 2020
, Accepted 18th May 2020
First published on 19th May 2020
Abstract
In this study, a facile synthesis of two ionized carbon dots (CDs-2 and CDs-3) is reported, in which different ionic pairs are formed at the surface of the carbon core. In contrast to CDs-3, the accumulation of carbon core can be clearly observed in the TEM image of CDs-2. This is due to the linkage of the dibromine alkyl group. Compared with naked CDs in the absence of the ionic pair, the maximum emission wavelength undergoes a red-shift of nearly 60 nm. Moreover, protic solvents (water, ethanol and N,N′-dimethyl formamide) have an apparent effect on the emission intensities of CDs-2 and CDs-3. The time-resolved average lifetimes of CDs-2 and CDs-3 are calculated as 56.34 ns and 54.50 ns, respectively. Furthermore, they both have much better fluorescence stability in the solution with pH ranging from 2 to 11 due to the presence of the imidazolium cation. It is interesting to see that CDs-2 and CDs-3 have much different responses towards Cu2+ and Fe2+. The CDs-3 solution generates clear fluorescence quenching when treated with Fe2+. In brief, we believe that these findings can inspire more research developments in the synthesis and further application of functional CDs.
Introduction
Luminescent materials, such as carbon dots (CDs),1,2 graphene quantum dots,3,4 and polycyclic aromatic hydrocarbons,5,6 have been receiving extensive interest in recent years. They are widely applied as probes. Among them, fluorescent CDs exhibit special physicochemical and optical properties, which are not limited to the emissive sources composed of conjugated or condensed groups.7–17 For the synthesis of CDs, citric acid is commonly applied as the carbon source, which reacts with amine oligomers via polymerization or thermal pyrolysis.7–15 The as-synthesized materials have remarkable fluorescence quantum yield. There is no doubt that tunable optical properties can be achieved by choosing appropriate amine precursors with different chemical structures. Furthermore, the physicochemical and optical properties of CDs have been investigated in detail. Even so, some problems involving CDs still need to be addressed. For example, most of the synthesized fluorescent CDs are unstable in acidic or basic solutions due to the presence of the amido bond. In addition, they are sensitive to metal ions, such as ferric ion (Fe3+) and mercuric ion (Hg2+), showing selective fluorescence quenching.7,12,13,15,17 The above-mentioned problems may restrict their further application in some fields, like a system, which requires high stability in various environments with different pH or sensitive detection towards other metal ions. Given that, it is necessary to choose a fire-new amine oligomer for the synthesis of functional CDs.
To improve the stability of CDs in acidic or basic solutions, supernumerary groups should be added and simultaneously they should be able to maintain high quantum yield (QY). Very different from previous studies, we wondered whether an ionic pair could be introduced as a modifier instead of the unprotected heteroatom-containing bonds. In addition, what would be its impact on the presence of electrostatic interactions? Ionic liquids, consisting of entire cations and anions, can be a better choice.18,19 They have been widely used in the fields of electrochemistry,20–22 separation,23,24 and catalysis.25,26 More importantly, ionic liquids present great stability in hard conditions. Thus, the addition of ionic liquids into CDs may be worth studying.
This study demonstrates the convenient fabrication of two ionized luminescent CDs (CDs-2 and CDs-3, under 345 nm and 350 nm UV illumination, respectively) via a hydrothermal method. As presented in Fig. 1A, first of all, 4-pyridinemethaneamine was reacted with citric acid via dehydration. Then, n-alkyl bromide was directly linked to the pyridinium group. The fluorescence spectra show a red-shift of ∼60–70 nm under excitation at ∼350 nm after the formation of an ionic pair. Furthermore, the obtained fluorescent CDs could maintain the original emission intensity in the weak acidic or alkaline environments with pH ranging from 2 to 11. Importantly, Fe2+ and Cu2+ could be directly detected through a comparison of the signals from CDs-2 and CDs-3, in the response of selective fluorescence quenching.
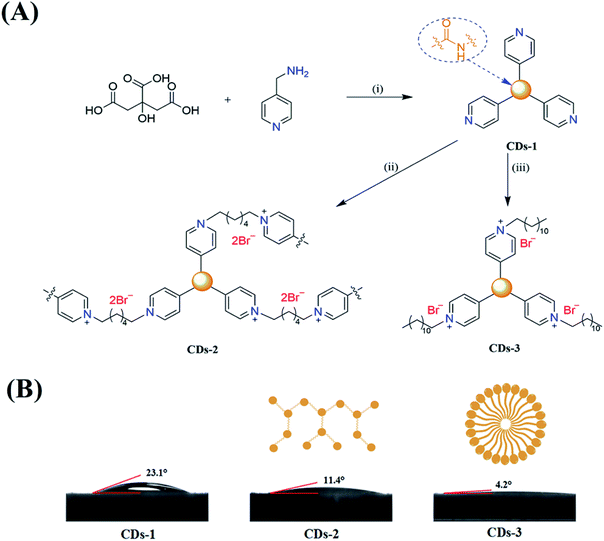 |
| | Fig. 1 (A) Reaction schematic for the synthesis of CDs-1, CDs-2, and CDs-3: (i) 155 °C, 8 h; (ii) 1,6-dibromohexane, 80 °C, 24 h; and (iii) 1-bromododecane, 80 °C, 24 h. (B) Water contact angles obtained for CDs-1, CDs-2, and CDs-3. | |
Experimental section
Materials
For the synthesis of CDs-2 and CDs-3, citric acid monohydrate, 4-pyridinemethaneamine, 1,6-dibromohexane, 1-bromododecane, and quinine sulfate dihydrate were purchased from Aladdin Industrial Inc. (Shanghai, China) and used without further purification. Metal salts, including NaCl, KCl, CaCl2, FeCl3, FeCl2, CuCl2, ZnCl2, NiCl2, and CoCl2, were obtained from Sinopharm Group Co. Ltd. (Shanghai, China). Milli-Q water and analytical grade pure ethanol were used during the preparation and spectroscopic measurements.
Instruments
A Bruker Avance 400 spectrometer (Bruker, Germany) at 400 MHz was used out to record 1H NMR spectra. Fourier transform infrared (FTIR) spectra were recorded on a Nicolet NEXUS-470 FTIR spectrometer (Thermo Nicolet, USA). The X-ray photoelectron spectroscopy (XPS) data were recorded on an ESCALAB 250Xi spectrometer (Thermo Fisher Scientific, USA). UV-vis absorption spectra were recorded on a UV-1700 UV-vis spectrophotometer (Shimadzu, Japan). Fluorescene spectra were recorded using an LS-55 fluorescence spectrometer (PerkinElmer, USA).
Synthesis of CDs-1, CDs-2, and CDs-3
CDs-2 and CDs-3 were synthesized via a two-stage process. In the first step, citric acid (2.10 g, 10.0 mmol) and 4-pyridinemethaneamine (3.24 g, 30.0 mmol) were dissolved in ethanol (25 mL) in a pressure flask. Then, it was held at 155 °C under stirring for 8 h to obtain CDs-1. The color of the solution turned orange. After the solution was cooled to room temperature, 1,6-dibromohexane (3.66 g, 15.0 mmol) or 1-bromododecane (7.47 g, 30.0 mmol) were added and heated to 80 °C for 24 h. It is observed that the orange color of the solution became blue-green under a high temperature and changed to orange at room temperature (Fig. S1†). Finally, the solvent was removed under a reduced pressure and then the obtained product was washed with 30 mL of hexane. The purified products (CDs-2 and CDs-3) were dried under vacuum.
Quantum yield calculation
The quantum yield (QY) of the as-prepared CDs was determined using eqn (1),27,28 commercial quinine sulfate dihydrate dissolved in a 0.1 M H2SO4 solution (Φ = 0.54) was applied as the standard. The corresponding equation is shown below:| | 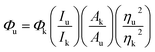 | (1) |
where Φ is the quantum yield determined at the excitation wavelength of 350 nm, I is the integrated fluorescence intensity. A is the absorbance at an excitation wavelength in the UV spectrum, which should be below 0.05. η is the refractive index of the solvent. The subscripts k and u refer to known and unknown samples, respectively.
LOD calculation
The limit of detection is calculated by the following equation:where LOD means the limit of detection, SD means the standard deviation of intercept, slope means the slope of the calibration curve of (I0 − I)/I0versus the concentration of the metal ions.
Results and discussion
Physical properties
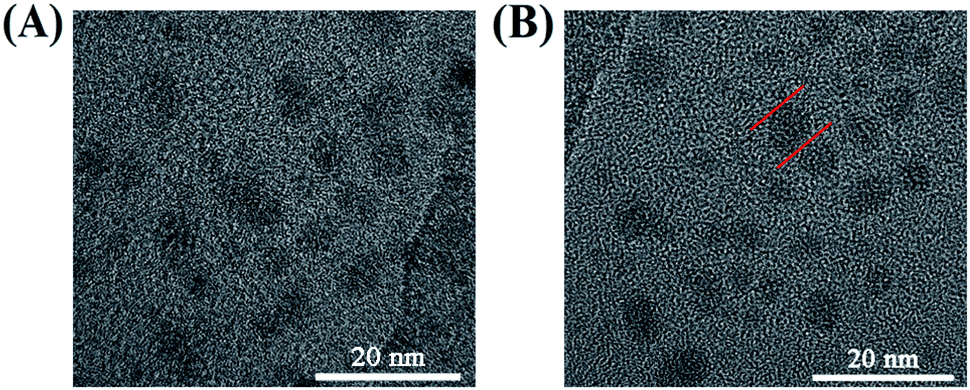
In the first step of the synthesis of CDs-1, a molar ratio of 1![[thin space (1/6-em)]](https://www.rsc.org/images/entities/char_2009.gif) :3 between citric acid and 4-pyridinemethaneamine was formed via amidation at 155 °C for 8 h. Also, the formation mechanism has been discussed in detail by Mandal et al.7 Secondly, 4-pyridinemethaneamine can directly react with n-alkyl bromide to produce the pyridinium cation, as in the synthesis of ionic liquids.29,30 In order to investigate the effect of n-alkyl bromide, two precursors with different chain lengths (1,6-dibromohexane and 1-bromododecane) were employed in this experiment. Much different physicochemical and optical properties for CDs-2 and CDs-3 were achieved. For CDs-3, its structure looks much like that of the surfactant with both hydrophilic and hydrophobic groups, leading to very high hydrophilicity. Its water contact angle is only 4.2° (Fig. 1B). For CDs-2, the contact angle is 11.4°. Both of them are lower than those of CDs-1 (23.1°) due to the formation of ionic pairs. The difference between hydrophobic and hydrophilic performances can influence its optical properties in protic and aprotic solvents. Furthermore, the TEM image (Fig. 2A) of CDs-2 proves the accumulation of the carbon core due to the linkage of dibromine alkyl. Differently, CDs-2 has great dispersibility with a diameter of 5–8 nm (Fig. 2B).
:3 between citric acid and 4-pyridinemethaneamine was formed via amidation at 155 °C for 8 h. Also, the formation mechanism has been discussed in detail by Mandal et al.7 Secondly, 4-pyridinemethaneamine can directly react with n-alkyl bromide to produce the pyridinium cation, as in the synthesis of ionic liquids.29,30 In order to investigate the effect of n-alkyl bromide, two precursors with different chain lengths (1,6-dibromohexane and 1-bromododecane) were employed in this experiment. Much different physicochemical and optical properties for CDs-2 and CDs-3 were achieved. For CDs-3, its structure looks much like that of the surfactant with both hydrophilic and hydrophobic groups, leading to very high hydrophilicity. Its water contact angle is only 4.2° (Fig. 1B). For CDs-2, the contact angle is 11.4°. Both of them are lower than those of CDs-1 (23.1°) due to the formation of ionic pairs. The difference between hydrophobic and hydrophilic performances can influence its optical properties in protic and aprotic solvents. Furthermore, the TEM image (Fig. 2A) of CDs-2 proves the accumulation of the carbon core due to the linkage of dibromine alkyl. Differently, CDs-2 has great dispersibility with a diameter of 5–8 nm (Fig. 2B).
 |
| | Fig. 2 TEM images of (A) CDs-2 and (B) CDs-3. | |
Characterization of CDs-2 and CDs-3
The FTIR analysis of CDs-1, CDs-2, and CDs-3 is shown in Fig. 3. For CDs-1 (curve a), it clearly confirms the presence of functional groups for CDs including –O–H (the bending vibration in the region ranging from 3311 cm−1 to 3693 cm−1), –C–H (asymmetric and symmetric stretching vibration at 2974 cm−1 and 2925 cm−1, respectively). The peak at 1704 cm−1 could be attributed to the C![[double bond, length as m-dash]](https://www.rsc.org/images/entities/char_e001.gif) O stretching vibration of the amide group. The signal at 1608 cm−1 belongs to the CC stretching vibration of the pyridine ring. 1H NMR also proves the existence of the pyridinium group, in which their characteristic peaks are shown in the range of 8.50–7.21 ppm (Fig. S2†). Furthermore, in the FTIR spectrum, similar peaks can be found by comparing the three materials (curves a, b, and c). That is, most characteristic peaks mentioned in the curve a are all shown in curves b and c. The difference between these materials is that the signal intensity of line c enhances obviously in the region ranging from 2974 cm−1 to 2925 cm−1 due to the addition of the long-chain alkyl group. However, further evidence of the conjugation between CDs-1 and 1-bromo-hydrocarbon should be provided.
O stretching vibration of the amide group. The signal at 1608 cm−1 belongs to the CC stretching vibration of the pyridine ring. 1H NMR also proves the existence of the pyridinium group, in which their characteristic peaks are shown in the range of 8.50–7.21 ppm (Fig. S2†). Furthermore, in the FTIR spectrum, similar peaks can be found by comparing the three materials (curves a, b, and c). That is, most characteristic peaks mentioned in the curve a are all shown in curves b and c. The difference between these materials is that the signal intensity of line c enhances obviously in the region ranging from 2974 cm−1 to 2925 cm−1 due to the addition of the long-chain alkyl group. However, further evidence of the conjugation between CDs-1 and 1-bromo-hydrocarbon should be provided.
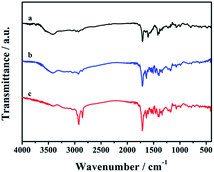 |
| | Fig. 3 FTIR spectra of CDs-1 (a), CDs-2 (b), and CDs-3 (c). | |
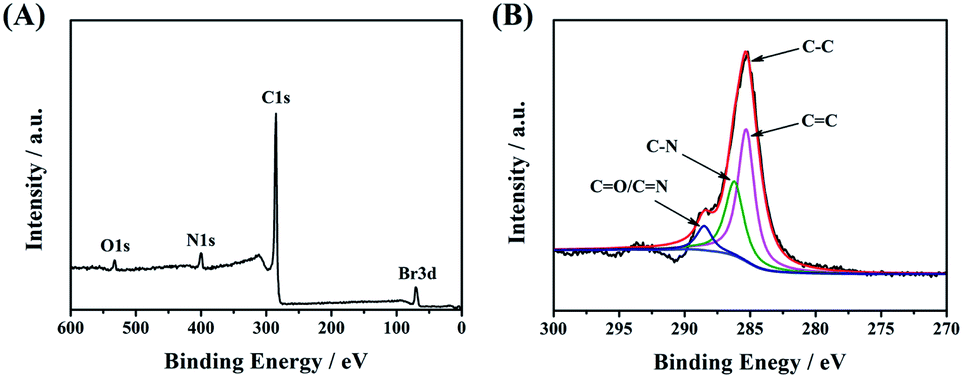
Next, X-ray photoelectron spectroscopy (XPS) was applied to confirm the successful linkage between CDs-1 and 1-bromo-hydrocarbon. As shown in Fig. 4A, the characteristic elements and content belonging to CDs-3 fit very well in the XPS survey spectrum. The intensity of C 1s at 285.1 eV is much higher than that of others (O 1s at 533.1 eV, N 1s at 400.0 eV, and Br 3d at 70.1 eV). The C 1s peak can be deconvoluted into four contributory peaks (Fig. 4B), CC (285.1 eV), C–N (286.2 eV), and N–CO/CN (288.5 eV). Besides that, the XPS survey spectrum shows that the carbon content of CDs-1 is lower than that of CDs-2 and CDs-3 (Fig. S3†), which is in agreement with the FTIR analysis.
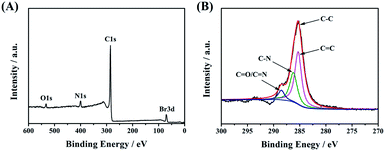 |
| | Fig. 4 (A) XPS survey and (B) C 1s spectra of CDs-3. | |
Optical properties
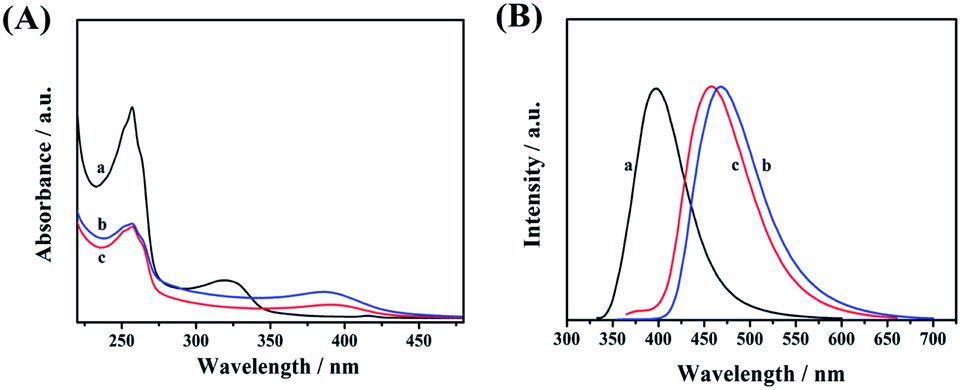
UV-vis absorption spectroscopy (Fig. 5A), photoluminescence spectroscopy (Fig. 5B), and time-resolved photoluminescence spectroscopy (Fig. 6) were used to investigate the optical properties of CDs-1, CDs-2, and CDs-3. Clear absorption signals of these three samples with different intensities are shown at 256 nm (Fig. 5A), which are attributed to the π–π* transition of CN and CO groups. It is worth noting that the absorption bands of CDs-2 and CDs-3 red-shift from 322 nm to 389 nm compared to CDs-1. This broad band can be directly used as the excitation wavelength of photo-luminescence. After performing fluorescence spectroscopy, the maximum excitation wavelength was found to be 320 nm, 350 nm, and 345 nm for CDs-1, CDs-2, and CDs-3, respectively.
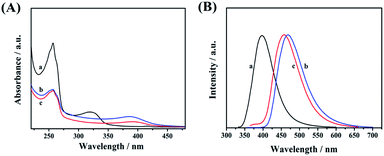 |
| | Fig. 5 (A) UV-vis absorption and (B) photoluminescence spectra of CDs-1 (a), CDs-2 (b), and CDs-3 (c). | |
 |
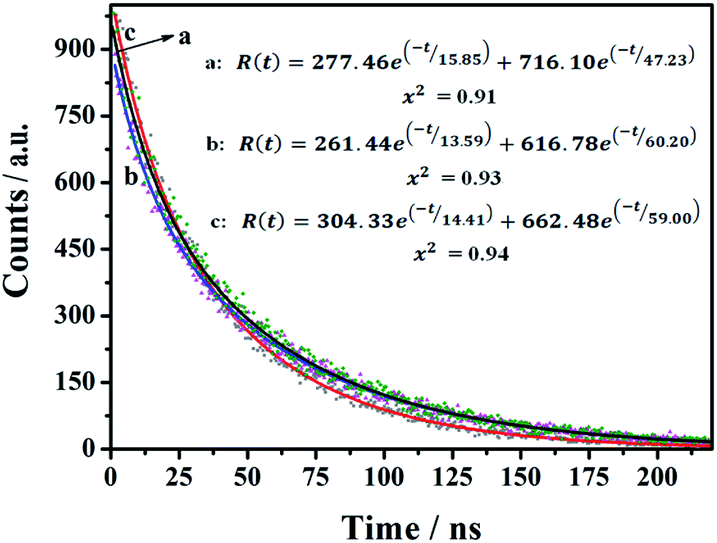
| | Fig. 6 Fluorescence lifetime decay profiles of CDs-1 (a), CDs-2 (b), and CDs-3 (c). | |
The photo-luminescence spectra of three materials were recorded and are presented in Fig. 5B by using different excitation wavelengths. Their corresponding unimodal maximum emission wavelengths were observed at 398 nm, 468 nm, and 458 nm, for CDs-1, CDs-2, and CDs-3, respectively. Clearly, compared to CDs-1, the emission peaks of CDs-2, and CDs-3 red-shifted with a difference of ∼60 nm. In addition, the fluorescence spectra of CDs-2 and CDs-3 at different excitation wavelengths are presented in Fig. S4,† proving that the maximum intensity of both ionic nanomaterials depends on the excitation wavelengths.
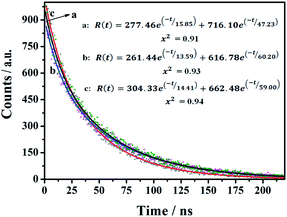
The time-resolved fluorescence (TRF) measurements were used to investigate the fluorescence decay of the as-prepared nanomaterials. The CDs-1, CDs-2, and CDs-3 solutions were irradiated at 320 nm, 350 nm, and 345 nm, respectively. As shown in Fig. 6, a two-exponential decay model is fitted for the TRF curves of these three samples. The relevant details are summarized in Table S1.† CDs-1 has an average fluorescence lifetime (τave) value of 43.62 ns, with two decay components of 15.85 ns (11.50%) and 47.23 ns (88.5%). Also, for CDs-2 and CDs-3, their τave values are 56.34 ns and 54.50 ns, respectively. The obtained results mean that the two chromophores (the pyridyl group and carbon dot) are present in this kind of nanomaterials. Furthermore, the ionized CDs have higher τave values compared to those of CDs-1. It could be due to the enrichment of nanomaterials by the linkage of 1,6-dibromohexane for CDs-2 or the formation of micelle for CDs-3.
Solvent effect
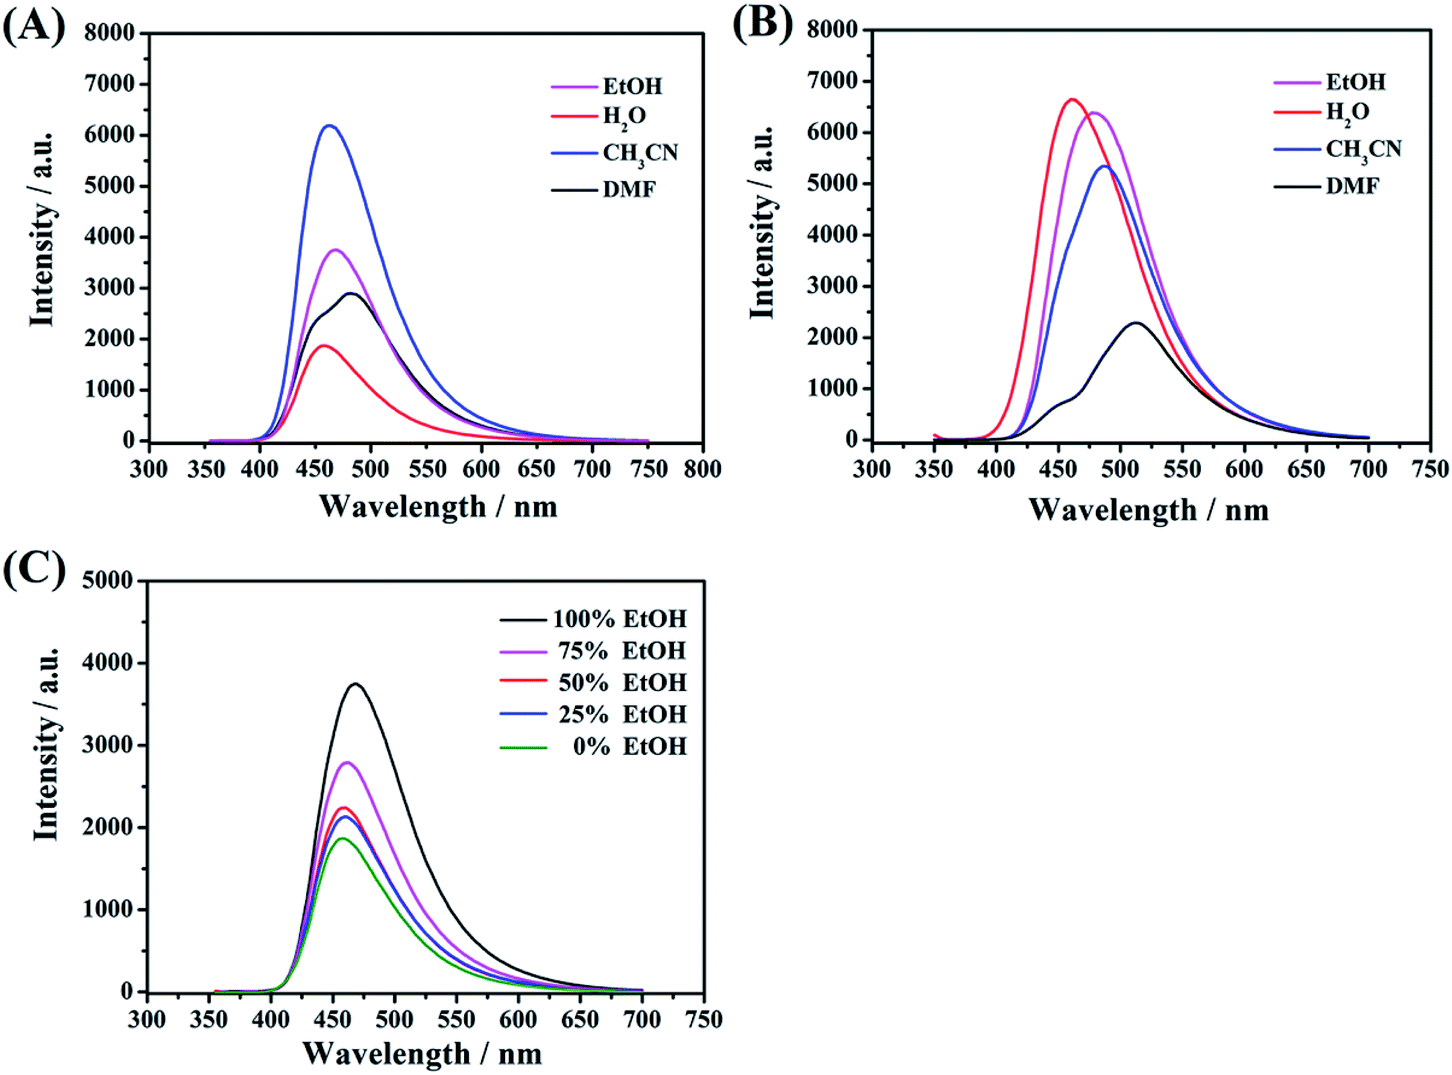
Acetonitrile, ethanol, water, and dimethylformamide were used to investigate the effect of different media on the FL activities of these functional CDs. As shown in Fig. 7A, remarkably, whether strong or weak, polar protic solvents (water, EtOH and DMF) can decrease the emission intensity for CDs-2 compared to those with an aprotic solvent (CH3CN). Taking water as an example, the hydrogen-bond network of the medium surrounding the C-dots can easily form stable hydrogen bonds with the amido group and bromonium ion with enhanced rigidity. Exactly, it can affect the radiative process and hence reduce the energy transfer. In contrast, the optical activities of CDs-3 (Fig. 7B) are inactive to polar solvents (water, EtOH and CH3CN). The emission intensities have few changes due to the formation of micelle in these media. The obvious differences are also presented in QY, wherein all the samples are dissolved in water. In the absence of an ionic pair, the QY of CDs-1 is estimated to be 7.4%, in reference to quinine sulfate dihydrate as a standard. Also, the QY of CDs-2 is much lower than that of CDs-3, whose QY values are 6.9% and 16.8%, respectively. Furthermore, in the mixed solutions composed of different volume ratios between EtOH and water, the PL emission intensity of the CDs-2 solution decreases correspondingly with the increase in the content of water (Fig. 7C). These characteristic changes can be employed as one of the detecting tools for solvent determination.
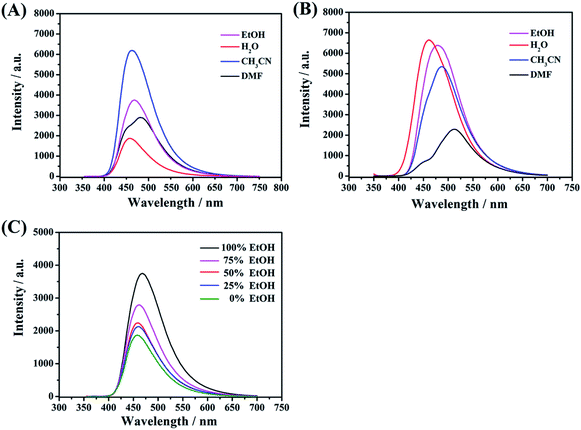 |
| | Fig. 7 Fluorescence spectra of (A) CDs-2 and (B) CDs-3 in different solvents (water, EtOH, CH3CN, and DMF); (C) CDs-2 solution composed of different volume ratios (100%, 75%, 50%, 25% and 0%) between ethanol and water. | |
Effect of acidic and basic environment
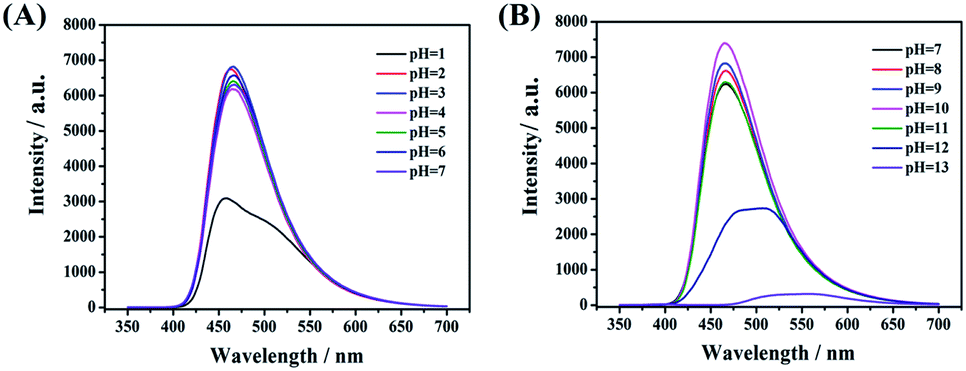
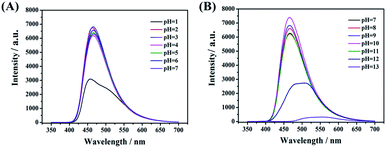
In the reported work, most of the nanocarbon materials derived from amine and carboxylic acid as precursors are sensitive to pH.7,13 The emission intensity would decrease obviously in a weak or basic environment. This may limit its further applications in numerous fields. As shown in Fig. 8A and B, the present CDs-3 shows better photo-stability in different environments. That is, switching pH by adding the HCl or NaOH solution, the fluorescence intensity almost remains unchanged ranging from 2 to 11. The maximum emission intensity was found at pH = 10. The high fluorescence stability of CDs-3 may be attributed to the protonation of the ionic pairs at the surface, rather than the amido bond of the core. In addition, a sudden decrease in the emission intensity of CDs-3 was observed at pH < 1 and pH > 12. There is no doubt that a strong acid or base solution can result in the cleavage of the amido bond and further affect their stability. Similar results are obtained for CDs-2. Apparently, the good stability of the as-synthesized CDs in the broad pH range is in favor of their further applications.
 |
| | Fig. 8 Fluorescence spectra of CDs-3 with varying pH including (A) acid solution (pH = 1–7) and (B) basic solution (pH = 7–13). | |
Selective recognition of Cu2+ and Fe2+
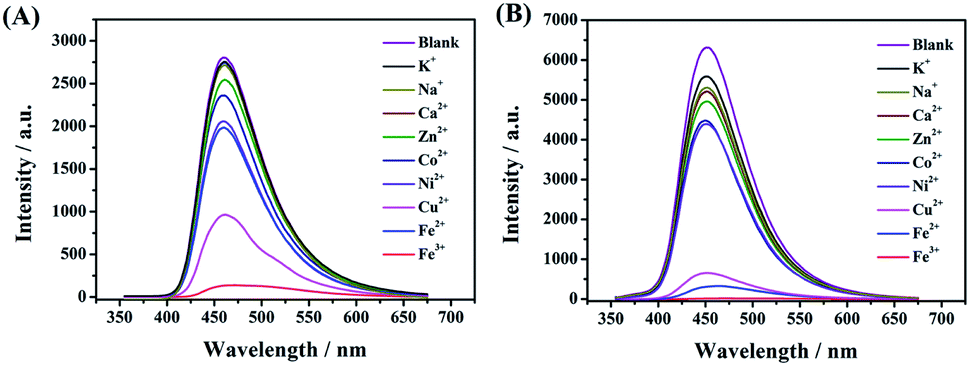
A few studies have reported that the selective sensing of certain metal ions, particularly ferric ion (Fe3+), cupric ion (Cu2+), and mercuric ion (Hg2+), were commonly performed via fluorescence quenching or enhancement.31–37 It is convincing that coordination interaction between metal ions and a hydroxy group can easily occur which can further result in that partial electron derived from the energy of ultraviolet light transferring into the d orbital of Fe3+. Both, CDs-2 and CDs-3 solutions (0.4 mg mL−1) are sensitive to Fe3+, generating almost complete fluorescence quenching by the addition of 1.5 μM metal ions (Fig. 9A and B). Nevertheless, fluorescence quenching toward Fe2+ is not observed by using the CDs-2 solution (Fig. 9A). The PL quenching of CDs-2 for Fe2+ and Cu2+ is only 29% and 66%, respectively. Differently, the PL quenching of CDs-3 for Fe2+ and Cu2+ can be achieved with the values of 95% and 93%, respectively. It is interesting to see that the selective detection for Fe2+ is rarely reported using CDs but commonly applied for the detection of other kinds of fluorescent probes.38–42 Simultaneously, only 30% PL quenching is observed by metal ion mixtures except for Fe3+, Fe2+, and Cu2+. These results clearly confirm that the linkage of the ionic moiety into CDs can bring different properties. For CDs-3, it is inclined to form micelle in the presence of a long hydrophobic chain (Fig. 10), resulting in more metal ions surrounding the micelle to interact with the pyridinium cation, particularly for Fe3+, Fe2+, and Cu2+. Furthermore, the TEM image indicates that obvious agglomeration happens with an increase in the diameter in the range of 50–80 nm (Fig. S6†). More energy is under nonradiative relaxation pathways, instead of the charge transfer process. Nevertheless, CDs-2 consisting of a compact structure is difficult to assemble metal ions. Thus, the selective fluorescence quenching toward CDs-2 and CDs-3 can be deemed as a detecting technique for Fe2+. Importantly, the Fe2+ detection is not interrupted by other metal ions. In addition, a good linear relationship for an (I0–I)/I0 range can be established ranging from 50 nM to 1500 nM using CDs-3 in the absence of other metal ions (Fig. S7†). In addition, according to eqn (2), the LOD of Fe2+ and Cu2+ is obtained with the values of 17 nM and 42 nM, respectively.
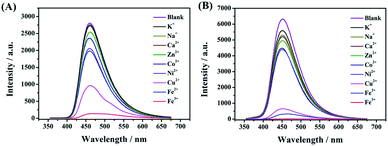 |
| | Fig. 9 Fluorescence spectra of (A) CDs-2 and (B) CDs-3 with different metal salts including K+, Na+, Zn2+, Ca2+, Co2+, Ni2+, Cu2+, Fe2+, and Fe3+. | |
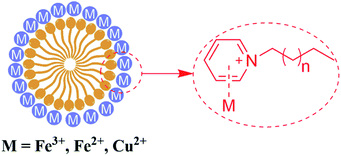 |
| | Fig. 10 Proposed mechanism for the detection of metal ions using CDs-3. | |
Conclusions
To summarize, two functional CDs composed of ionic pairs at the surface were synthesized. Compared with the reported studies, the present CDs possess distinctive optical properties due to multiple interactions including π–π stacking, H-bonding, and electrostatic repulsion/attraction. They have a relatively long PL lifetime (∼55 ns). Due to electrostatic interactions, the maximum emission wavelength would red-shift with a difference of 60 nm. Much higher emission intensity is obtained in aprotic solvents (CH3CN) for CDs-2. CDs-3 presents much higher stability in polar solvents. In particular, CDs-2 and CDs-3 are selectively sensitive towards Cu2+ and Fe2+ from the comparison of their fluorescence signals. In brief, all these findings promote the development of the synthesis of smart functional CDs and allow promising opportunities for further applications.
Conflicts of interest
There are no conflicts to declare.
Acknowledgements
We are grateful to National Science Foundation of China (21804013, 21775013), Natural Science Foundation of Jiangsu Province (BK20171194), Natural Science Foundation of the Higher Education Institutions of Jiangsu Province (18KJB150003), the Fifth Phase of “333 Project” of Jiangsu Province (BRA2019091), “Six Talents Peaks” of Jiangsu Province (GDZB-075), and Qing Lan Project of Jiangsu Higher Education Institutions for the financial support.
Notes and references
- S. Y. Lim, W. Shen and Z. Gao, Chem. Soc. Rev., 2015, 44, 362–381 RSC.
- K. Jiang, S. Sun, L. Zhang, Y. Lu, A. Wu, C. Cai and H. Lin, Angew. Chem., Int. Ed., 2015, 54, 1–5 CrossRef.
- F. Liu, M. H. Jang, H. D. Ha, J. H. Kim, Y. H. Cho and T. S. Seo, Adv. Mater., 2013, 25, 3657–3662 CrossRef CAS PubMed.
- P. Zheng and N. Wu, Chem.–Asian J., 2017, 12, 2343–2353 CrossRef CAS PubMed.
- Y. Zhou and J. Yoon, Chem. Soc. Rev., 2012, 41, 52–67 RSC.
- L. E. Santos-Figueroa, M. E. Moragues, E. Climent, A. Agostini, R. Martinez-Manez and F. Sancenon, Chem. Soc. Rev., 2013, 42, 3489–3613 RSC.
- A. Das, V. Gude, D. Roy, T. Chatterjee, C. K. De and P. K. Mandal, J. Phys. Chem. C, 2017, 121, 9634–9641 CrossRef CAS.
- Y. Song, S. Zhu, S. Zhang, Y. Fu, L. Wang, X. Zhao and B. Yang, J. Mater. Chem. C, 2015, 3, 5976–5984 RSC.
- N. Dhenadhayalan, K. C. Lin, R. Suresh and P. Ramamurthy, J. Phys. Chem. C, 2016, 120, 1252–1261 CrossRef CAS.
- J. Schneider, C. J. Reckmeier, Y. Xiong, M. von Seckendorff, A. S. Susha, P. Kasak and A. L. Rogach, J. Phys. Chem. C, 2017, 121, 2014–2022 CrossRef CAS.
- Z. Guo, Z. Zhang, W. Zhang, L. Zhou, H. Li, H. Wang, C. Andreazza-Vignolle, P. Andreazza, D. Zhao, Y. Wu, Q. Wang, T. Zhang and K. Jiang, ACS Appl. Mater. Interfaces, 2014, 6, 20700–20708 CrossRef CAS PubMed.
- S. Zhu, Q. Meng, L. Wang, J. Zhang, Y. Song, H. Jin, K. Zhang, H. Sun, H. Wang and B. Yang, Angew. Chem., Int. Ed., 2013, 52, 3953–3957 CrossRef CAS PubMed.
- Y. Dong, R. Wang, H. Li, J. Shao, Y. Chi, X. Lin and G. Chen, Carbon, 2012, 50, 2810–2815 CrossRef CAS.
- S. Zhu, X. Zhao, Y. Song, S. Lu and B. Yang, Nano Today, 2016, 11, 128–132 CrossRef CAS.
- L. Vallan, E. P. Urriolabeitia, F. Ruiperez, J. M. Matxain, R. Canton-Vitoria, N. Tagmatarchis, A. M. Benito and W. K. Maser, J. Am. Chem. Soc., 2018, 140, 12862–12869 CrossRef CAS PubMed.
- D. Chen, M. Xu, W. Wu and S. Li, J. Alloys Compd., 2017, 701, 75–81 CrossRef CAS.
- K. J. Mintz, B. Guerrero and R. M. Leblanc, J. Phys. Chem. C, 2018, 122, 29507–29515 CrossRef CAS.
- R. D. Rogers and K. R. Seddon, Science, 2003, 302, 792–793 CrossRef PubMed.
- W. Qian, J. Texter and F. Yan, Chem. Soc. Rev., 2017, 46, 1124–1159 RSC.
- D. Wu, W. Tan, Y. Yu, B. Yang, H. Li and Y. Kong, Anal. Chim. Acta, 2018, 1033, 58–64 CrossRef CAS PubMed.
- D. Wu and Y. Kong, Anal. Chem., 2019, 91, 5961–5967 CrossRef CAS PubMed.
- D. Wu, W. Tan, H. Li, Z. Lei, L. Deng and Y. Kong, Analyst, 2019, 144, 543–549 RSC.
- W. Ma and K. Ho Row, J. Chromatogr. A, 2018, 1559, 78–85 CrossRef CAS PubMed.
- T. Yao and S. Yao, J. Chromatogr. A, 2017, 1481, 12–22 CrossRef CAS PubMed.
- Y. Leng, J. Wang, D. Zhu, X. Ren, H. Ge and L. Shen, Angew. Chem., Int. Ed., 2009, 48, 168–171 CrossRef CAS PubMed.
- C. P. Mehnert, R. A. Cook, N. C. Dispenziere and M. Afeworki, J. Am. Chem. Soc., 2002, 124, 12932–12933 CrossRef CAS PubMed.
-
J. R. Lakowicz, Principles of Fluorescence Spectroscopy, Springer Science, New York, 3rd edn, 2006 Search PubMed.
- D. Bain, S. Maity, B. Paramanik and A. Patra, ACS Sustainable Chem. Eng., 2018, 6, 2334–2343 CrossRef CAS.
- D. Wu, Y. Yu, J. Zhang, L. Guo and Y. Kong, ACS Appl. Mater. Interfaces, 2018, 10, 23362–23368 CrossRef CAS PubMed.
- D. Wu, P. Cai, X. Zhao, Y. Kong and Y. Pan, J. Sep. Sci., 2018, 41, 373–384 CrossRef CAS PubMed.
- W. Y. Liu, H. Y. Li, B. X. Zhao and J. Y. Miao, Analyst, 2012, 137, 3466–3469 RSC.
- Z. Xu, J. Yoon and D. R. Spring, Chem. Commun., 2010, 46, 2563–2565 RSC.
- L. Huang, J. Cheng, K. Xie, P. Xi, F. Hou, Z. Li, G. Xie, Y. Shi, H. Liu, D. Bai and Z. Zeng, Dalton Trans., 2011, 40, 10815–10817 RSC.
- X. Li, Y. Yin, J. Deng, H. Zhong, J. Tang, Z. Chen, L. Yang and L. J. Ma, Talanta, 2016, 154, 329–334 CrossRef CAS PubMed.
- W. Lin, L. Long, L. Yuan, Z. Cao and J. Feng, Anal. Chim. Acta, 2009, 634, 262–266 CrossRef CAS PubMed.
- R. Zhang and W. Chen, Biosens. Bioelectron., 2014, 55, 83–90 CrossRef CAS PubMed.
- S. Barman and M. Sadhukhan, J. Mater. Chem., 2012, 22, 21832–21837 RSC.
- X. Yang, Y. Wang, R. Liu, Y. Zhang, J. Tang, E. Yang, D. Zhang, Y. Zhao and Y. Ye, Sens. Actuators, B, 2019, 288, 217–224 CrossRef CAS.
- S. Yang, Z. Jiang, Z. Chen, L. Tong, J. Lu and J. Wang, Microchim. Acta, 2015, 182, 1911–1916 CrossRef CAS.
- Y. Lu, B. Yan and J. L. Liu, Chem. Commun., 2014, 50, 9969–9972 RSC.
- H. Song, Y. Wang, G. Wang, H. Wei and S. Luo, Microchim. Acta, 2017, 184, 3399–3404 CrossRef CAS.
- Z. Liu, S. Wang, W. Li and Y. Tian, Anal. Chem., 2018, 90, 2816–2825 CrossRef CAS PubMed.
Footnote |
| † Electronic supplementary information (ESI) available: 1H NMR of CDs-1 and fluorescence spectra. See DOI: 10.1039/d0na00151a |
|
| This journal is © The Royal Society of Chemistry 2020 |

 Open Access Article
 This Open Access Article is licensed under a Creative Commons Attribution-Non Commercial 3.0 Unported Licence
 *a,
Wensheng
Tan
b,
Fei
Pan
a,
Jiale
Xu
b,
Yongxin
Tao
*a,
Wensheng
Tan
b,
Fei
Pan
a,
Jiale
Xu
b,
Yongxin
Tao