Strategies to reduce the dynamic disorder in molecular semiconductors†
Tahereh
Nematiaram
 * and
Alessandro
Troisi

Dept. of Chemistry and Materials Innovation Factory, University of Liverpool, Liverpool L69 7ZD, UK. E-mail: tahereh.nematiaram@liverpool.ac.uk; a.troisi@liverpool.ac.uk
First published on 27th August 2020
Abstract
The dynamic disorder is known to be one of the crucial parameters limiting the charge carrier transport in molecular semiconductors and a parameter that cannot be easily controlled through known design rules. To identify much needed guiding principles we evaluate the dependence of dynamic disorder on a large number of molecular and crystal characteristics for a set of almost five thousand known molecular semiconductors. We find that the strength of dynamic disorder is highly correlated with the gradient of the transfer integral, a property easily computable for any molecular orientation. We also show that orientations of molecular pairs with just a few atoms in contact are more likely to yield low dynamic disorder. This observation is highly counterintuitive as for years the focus has been to maximize the number of π-stacked atoms. Other properties with meaningful influence on the dynamic disorder include the presence of alkyl chains, the strength of the transfer integral and the presence of heavy atoms. The findings of this work provide important design principles for low-disorder high-mobility molecular semiconductors.
New conceptsWe answer one of the most challenging questions in the field of organic electronics: “How to reduce the dynamic disorder?” Answering this question has been difficult as the available theoretical methods/experimental techniques could not evaluate this property for more than a handful (∼15) of materials. Since the dynamic disorder is one of the main factors limiting the charge mobility, not having any design principle to limit it means that trial and error methods remain the main approach to improve mobility. We utilize the largest existing database of computed dynamic disorders (developed in our group) to devise practical design principles to reduce the dynamic disorder. The screening of this large set of data is useful to: (i) confirm in a statistically more rigorous way the correlations that have been noted on small samples, and (ii) find novel approaches to material discovery. This work presents practical guidelines which can be coupled to crystal structure prediction methods and bottom-up design strategies to develop a set of high-performance materials. |
Small organic molecules present a potential application for flexible, low-cost, and light-weight electronic devices.1–4 The performance of these devices strongly depends on the efficiency of charge transport processes and, accordingly, discovering and designing materials with high carrier mobilities are two of the major research objectives in the field of organic electronics.5–10 Molecular semiconductors are held together by weak van der Waals (vdW) forces; therefore, the thermal motion of molecules even at room temperature, known as the dynamic disorder, is large enough to cause fluctuations in the transfer integrals,11 with a magnitude comparable to that of the average transfer integral.12 There is a growing body of evidence that the charge mobility and, subsequently, the performance of electronic devices are largely affected by the strength of dynamic disorder.13–16 This effect, which is a manifestation of nonlocal electron–phonon couplings, is independent of the specific model of transport.17–23 While there are other important parameters, e.g. the molecular area,24 the local electron–phonon coupling,25–27 and the two-dimensional nature of transport,20,28 the dynamic disorder remains the one without clear design rules that can help the discovery of new high-performance materials. As shown in ref. 24, these important parameters are either uncorrelated or “constructively” correlated. Specifically, reducing the dynamic disorder would not present any detrimental impacts on the other crucial parameters affecting the charge carrier mobility. At present, except the simple principle of employing stiff structures,29 no generic practical strategies are known for designing structures with a small dynamic disorder. Understanding what can cause a low degree of dynamic disorder is, therefore, one of the key points which can open up vast opportunities for designing high mobility materials.
The evaluation of dynamic disorder, on the one hand, is a computationally extremely expensive task requiring the transfer integrals’ gradients and the crystal phonon calculations.30,31 On the other hand, the low-energy nature of thermal fluctuations prevents them from being feasibly accessible experimentally.16,32–34 All of these together have led to a situation where the existing works report calculations of this parameter on one35 or a few36 molecules with the requirement of millions of CPU hours for the state of the art calculations.37 A novel multi-scale quantum mechanics/molecular mechanics (QM/MM) methodology reported in ref. 24 enabled us to significantly speed up the dynamic disorder calculations and create the first large database of computed dynamic disorders (∼5000 entries – a subset of the Cambridge Structural Database (CSD)38). The aim of the present work is to utilize this unique large set of data to evaluate what are the major characteristics of the structures representing a low degree of dynamic disorder. We identify a list of characteristics that could potentially be linked with the degree of dynamic disorder and we establish if the correlation is meaningful.
Dataset
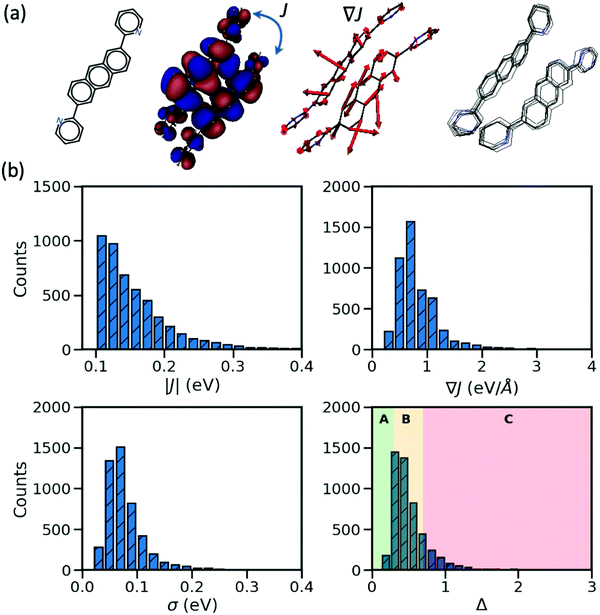
In the considered database, the materials possess two important characteristics: their largest transfer integral |J| between the HOMO orbitals localized on different molecules is greater than 0.1 eV and their valence bands expand in two dimensions (a desirable property for the charge transport in molecular semiconductors20,28). From each entry, we consider the molecular pair with the largest J, the corresponding dynamic disorder σ (i.e. the standard deviation of J fluctuations at room temperature30) and the gradient of the transfer integral ∇J with respect to the displacement of the atomic coordinates. The latter quantity can be visualized as vectors applied on each atom and the displacement along such vectors would cause the largest variation of the transfer integral as illustrated in Fig. 1. J and ∇J are electronic properties depending only on the mutual orientation of the molecules, while σ also depends on the phonons (shown schematically in Fig. 1) and temperature – set to 290 K in this work. For convenience, the “relative dynamic disorder” defined as Δ = σ/J is also considered. The distributions of the data constituting the foundation of the present study (i.e. |J|, ∇J, σ and Δ) are shown in the lower rows of Fig. 1. As can be seen, (i) the variation of the dynamic disorder σ is of the same order of magnitude as the transfer integral itself–a fact that has been noted in the past39 and essentially the reason for its importance; (ii) the distribution of the dynamic disorder is quite similar to that of the transfer integrals’ gradients (this aspect will be outlined in further detail later); (iii) the distribution of Δ is broad, peaking around 0.5 in agreement with many works in the literature,20 with a useful fraction of materials with small Δ that can be used to identify patterns in materials with a low degree of dynamic disorder. The materials are classified into three groups such that the first group represents the small relative dynamic disorder of Δ ≤ 0.3 (group A), the second one an intermediate regime of 0.3 < Δ ≤ 0.7 (group B) and the last one incorporates the highly fluctuating structure Δ > 0.7 (group C). This classification, highlighted in the last panel of Fig. 1, allows one to better understand the impact of structural characteristics on the degree of dynamic disorder.Considered parameters
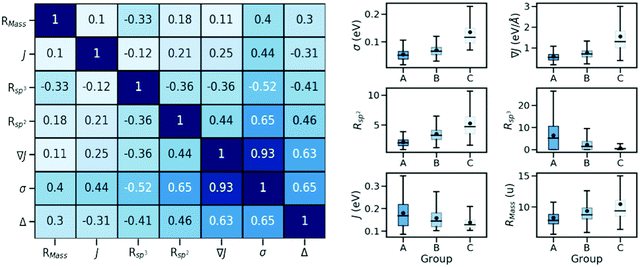
In order to identify possible correlations between the strength of dynamic disorder and the molecular/crystal characteristics, we have identified a list of characteristics that could potentially be linked with the degree of dynamic disorder. A large number of properties that we have considered and related to the molecular topology, the stoichiometry, the frontier orbital energy levels, descriptors of the HOMO orbitals and crystal descriptors did not display any appreciable correlation with the strength of dynamic disorder and the corresponding correlation factors with the original motivation for considering them are reported in the ESI.† In the main manuscript, we discuss properties with appreciable correlation with the dynamic disorder that can be used for the design of new materials. The key data and their correlations are summarized in a correlation matrix as shown in Fig. 2. Their variation range is represented in a series of box plots on the right side of the figure. The box plots help to understand how the variation range of a parameter changes within different groups. As such, as can be seen, for parameters negatively correlated to the dynamic disorder, the trend of parameter variation in going from group A to group C is descending while an opposite scenario applies to the positively correlated parameters. In the following, we discuss each key property and its correlation with the others.(i) Strength of the transfer integral's gradient (∇J)
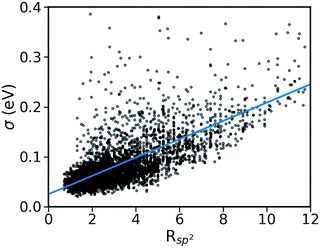
As shown in Fig. 2, there is a significant positive correlation between the dynamic disorder σ and the gradient of the associated transfer integral ∇J, suggesting that the gradient of the transfer integral is the main parameter determining the strength of dynamic disorder. This behaviour which is shown in Fig. 3 was partially anticipated by the work of Landi et al.31 and implies that the dynamic disorder is mostly but not entirely an electronic property. In a similar analysis, Schweicher et al.40 have evaluated the transfer integrals as a function of relative intermolecular shift along the molecular long axis z. Their results indicate that if the equilibrium position in a molecule is in the immediate proximity of a “sweet spot”, where the transfer integral (plotted as a function of z) shows an extremum, small values of the derivative and dynamic disorder are expected. Accordingly, given the relative position of two molecules, one can predict if the dynamic disorder is going to be large regardless of the surroundings. This observation is of particular importance as (i) it can justify the use of approximate phonons24,31,41 for evaluating the dynamic disorder, and (ii) it allows one to search for materials with small transfer integral gradients rather than small dynamic disorder.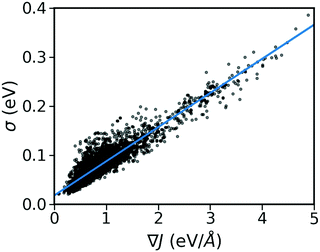 | ||
| Fig. 3 Correlation between σ and ∇J for the considered database composed of ∼5k molecular semiconductors. | ||
(ii) Pairing geometry of the molecules (Rsp2)
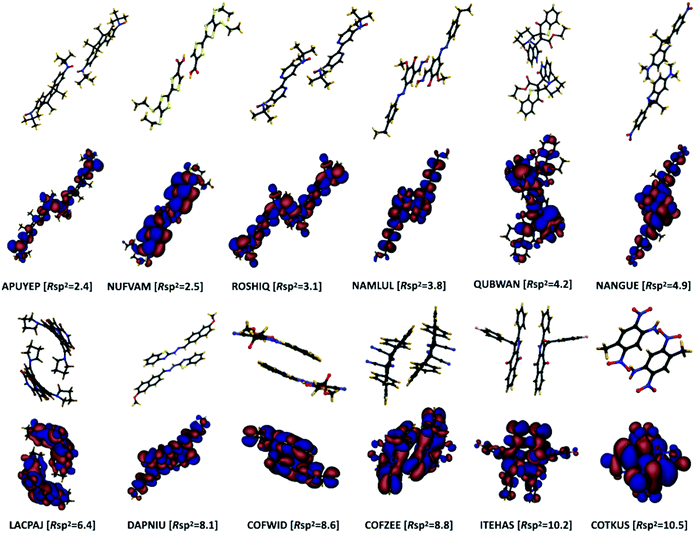
The pairing geometry of the molecules quantified by the number of sp2-hybridized atoms in vdW contact (normalized to the total number of atoms and expressed in percentage) is another important parameter that affects the strength of dynamic disorder substantially. In the analysis, only atoms contributing to the HOMO orbital are considered. Furthermore, the atoms are assumed in contact if the distance between them is shorter than the sum of their vdW radii (values extracted from ref. 42) multiplied by a constant value. The correlation matrix shown in Fig. 2 depicts a strong positive correlation (+0.65) between Rsp2 and the dynamic disorder σ (shown in Fig. 4). This high level of dependence of the dynamic disorder on the pairing geometry of molecules can be related to the interaction between orbitals with many nodes. As such, in structures revealing smaller degrees of dynamic disorder, the molecular orbitals overlap through the region of the orbital where there are not many nodes. This aspect is noted in ref. 39 and 43.The concept of pairing geometry can be better understood from Fig. 5 where representative examples of different values of Rsp2 are shown. As can be seen, the overlap between the two molecules increases for growing values of Rsp2. The materials with smaller values of Rsp2 are arranged in a “head-to-tail” fashion, but with the conjugated cores of the interacting molecules not lying on the same plane. The head-to-tail arrangement of the molecules is highly counterintuitive. This field has tried for years to have the maximum π-stacking and our results propose that a minimum π-stacking represents another optimum (i.e. a lower degree of dynamic disorder). It has also been noted that the correlation between Rsp2 and the relative dynamic disorder Δ is slightly weaker than that of σ. Nevertheless, due to the possibility of independent engineering of J, it does not diminish the importance of this parameter. This analysis suggests that molecular crystals with molecules interacting through the terminal ends of their conjugated core are potentially promising for smaller fluctuations.
(iii) Presence of alkyl chains
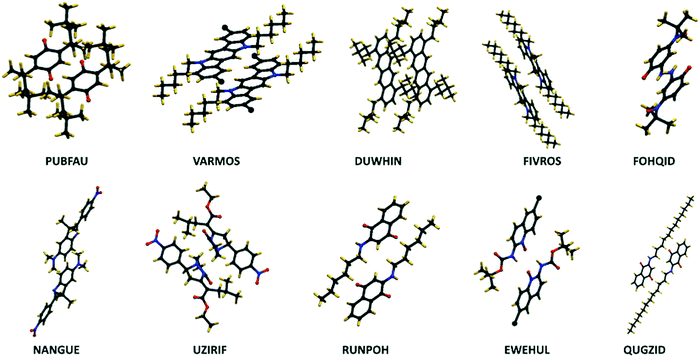
The negative correlation between σ and the number of sp3-hybridized carbon atoms divided by the total number of atoms, denoted as Rsp3, is significant (−0.52) meaning that the presence of alkyl chains (i.e. CnH2n+1 group) can potentially suppress the thermal fluctuations. Similar to the case of Rsp2, the correlation becomes slightly weaker when considering the relative dynamic disorder, however, the same scenario is present here and one can try to engineer J independently. According to the correlation matrix shown in Fig. 2, Rsp3 correlates appreciably more with σ than with ∇J suggesting that the attachment of the side chains can shift the vibration range of the conjugated core toward higher frequencies. A detailed analysis of this effect was recently reported by Schweicher et al.40 who stressed the importance of alkyl side chains on shifting in-plane modes to higher frequencies, which results in energy fluctuations to be dominated by a single sliding mode. It is known that the phonons contribute to the dynamic disorder if they are thermally populated. This alteration in the vibrational frequencies leads to a reduced number of low-frequency (i.e. thermally populated) modes that contribute to the dynamic disorder. Therefore, the side chains lead to a conjugated core more rigidly held in its equilibrium position and are potentially desirable to diminish the dynamic disorder.37,44–46 In this context, an emerging design is two-dimensional molecular semiconductors with long side chains which have been argued to reduce large amplitude motions.47 It also has to be noted that the transfer integrals for the considered structures are sufficiently large implying that a balanced compromise of a large transfer integral and a small dynamic disorder can be achieved by proper design of molecules with alkyl side chains. In the best materials (i.e. those in group A), this might be achieved when the interacting molecules face the conjugated core of each other (Fig. 6 – top row) or when the alkyl chain of one molecule interacts with the conjugated core of the other molecule (Fig. 6 – bottom row). These conformations while providing a sufficiently large transfer integral avoid large amplitude thermal fluctuations.(iv) Strength of the transfer integral (J)
The correlation map reveals that the larger transfer integral J is moderately correlated with the larger dynamic disorder σ, as expected. Moreover, the relative dynamic disorder Δ is positively (negatively) correlated with σ (J) as anticipated from its definition. The ultimate role of increasing J is, therefore, to reduce the relative dynamic disorder. While it has been noted that increasing the transfer integral J has no significant impact on the charge carrier mobility if the relative disorder Δ is constant, according to the correlation matrix, increasing values of J contribute to a smaller relative disorder and consequently can boost the mobility.(v) Ratio between molecular mass and number of atoms (RMass)
Another important observation of the present work is the presence of a positive correlation between the strength of dynamic disorder and the presence of heavy atoms. To better quantify the trend, we have defined a parameter, RMass, which is a ratio between molecular mass and the number of atoms. The positive correlation between RMass and the dynamic disorder suggests that the small molecules (i.e. those with fewer atoms) containing elements of heavier weight are expected to lead to higher degrees of dynamic disorder. Furthermore, it is notable that the correlation between RMass and ∇J is significantly smaller than that of σ implying that the effect of heavy atoms is predominantly vibrational. In fact, the involvement of the heavy atoms in the molecular structure leads to an increased number of low-frequency modes that contribute to the dynamic disorder and consequently leads to an increment in the strength of the dynamic disorder. Some early works have also shown a growing behavior of electron–phonon coupling with the involvement of heavy atoms.48 In addition, the observed impact of heavy atoms is well in line with the results of experimental studies, which predicts reduced mobility for the heavier isotope of a given structure.49Due to the computationally/experimentally demanding nature of dynamic disorder evaluations, the investigation of this property has been traditionally limited to a few structures with no possibilities to derive useful design rules. The screening of a large material space is useful to confirm in a statistically more rigorous way the correlations that have been noted on small samples in the literature and this work gives further support to ideas already presented and related to the beneficial effect of alkyl side chains or heavy atoms. However, the most useful findings are those allowing novel approaches to material discovery. The results of this work point to two novel discovery strategies related to each other but different in the way they are implemented. The first insight is to use the gradient of the transfer integral ∇J as a simpler guide to the best possible arrangement of molecules in a molecular crystal to minimize the dynamic disorder. Its evaluation still requires input from computational chemistry but without the computationally demanding evaluation of the crystal phonons. It can be useful to identify in silico convenient intermolecular arrangements combining low potential energy and low ∇J and to screen the output of predicted crystal structures.50 The second strategy is possibly more appealing to bottom-up design and chemical intuition51 and it is based on the crystal engineering of molecules with strong head-to-tail interactions. These not only minimize ∇J, σ and Δ, but also increase the charge carrier mobility, if the molecule possesses a long axis, which is proportional to the square of the intermolecular axis.24 Furthermore, this is a strategy almost opposite to what is normally pursued in organic electronics, where the number of sp2 hybridized atoms in contact tends to be maximized. A series of examples of such arrangements identified from the CSD can serve as blueprints for the design of new molecules packing in a similar fashion. It has to be noted that the implementation of these design principles in new materials with unknown crystal structures would still require a set of trial-and-error evaluations. These practical guidelines, however, are expected to significantly reduce the search space and accordingly increase the success rate of trial and error methods. We believe that these insights can provide practical strategies for reducing the degree of dynamic disorder and consequently increasing the mobility in molecular semiconductors.
Conflicts of interest
There are no conflicts to declare.Acknowledgements
This work was supported by the ERC-PoC grant (Grant 403098). We thank Dr Alessandro Landi for useful discussions.References
- S. R. Forrest, Nature, 2004, 428, 911–918 CrossRef CAS.
- H. Sirringhaus, Adv. Mater., 2014, 26, 1319–1335 CrossRef CAS.
- M. Muccini, Nat. Mater., 2006, 5, 605–613 CrossRef CAS.
- B. Movaghar, L. O. Jones, M. A. Ratner, G. C. Schatz and K. L. Kohlstedt, J. Phys. Chem. C, 2019, 123, 29499–29512 CrossRef CAS.
- T. Nematiaram and A. Troisi, J. Chem. Phys., 2020, 152, 190902 CrossRef CAS.
- C. Schober, K. Reuter and H. Oberhofer, J. Phys. Chem. Lett., 2016, 7, 3973–3977 CrossRef CAS.
- M. Nikolka, I. Nasrallah, B. Rose, M. K. Ravva, K. Broch, A. Sadhanala, D. Harkin, J. Charmet, M. Hurhangee, A. Brown, S. Illig, P. Too, J. Jongman, I. McCulloch, J.-L. Bredas and H. Sirringhaus, Nat. Mater., 2017, 16, 356–362 CrossRef CAS.
- S. Fratini, M. Nikolka, A. Salleo, G. Schweicher and H. Sirringhaus, Nat. Mater., 2020, 19, 491–502 CrossRef CAS.
- G. Schweicher, G. Garbay, R. Jouclas, F. Vibert, F. Devaux and Y. H. Geerts, Adv. Mater., 2020, 32, 1905909 CrossRef CAS.
- A. J. Petty, Q. Ai, J. C. Sorli, H. F. Haneef, G. E. Purdum, A. Boehm, D. B. Granger, K. Gu, C. P. L. Rubinger, S. R. Parkin, K. R. Graham, O. D. Jurchescu, Y.-L. Loo, C. Risko and J. E. Anthony, Chem. Sci., 2019, 10, 10543–10549 RSC.
- S. Fratini, D. Mayou and S. Ciuchi, Adv. Funct. Mater., 2016, 26, 2292–2315 CrossRef CAS.
- A. Troisi and G. Orlandi, J. Phys. Chem. A, 2006, 110, 4065–4070 CrossRef CAS.
- V. Dantanarayana, T. Nematiaram, D. Vong, J. E. Anthony, A. Troisi, K. Nguyen Cong, N. Goldman, R. Faller and A. J. Moulé, J. Chem. Theory Comput., 2020, 16, 3494–3503 CrossRef CAS.
- A. S. Eggeman, S. Illig, A. Troisi, H. Sirringhaus and P. A. Midgley, Nat. Mater., 2013, 12, 1045–1049 CrossRef CAS.
- J. H. Fetherolf, D. Golež and T. C. Berkelbach, Phys. Rev. X, 2020, 10, 021062 CAS.
- M. Asher, D. Angerer, R. Korobko, Y. Diskin-Posner, D. A. Egger and O. Yaffe, Adv. Mater., 2020, 1908028 CrossRef CAS.
- T. Nematiaram, S. Ciuchi, X. Xie, S. Fratini and A. Troisi, J. Phys. Chem. C, 2019, 123, 6989–6997 CrossRef CAS.
- L. Wang, O. V. Prezhdo and D. Beljonne, Phys. Chem. Chem. Phys., 2015, 17, 12395–12406 RSC.
- S. Giannini, A. Carof, M. Ellis, H. Yang, O. G. Ziogos, S. Ghosh and J. Blumberger, Nat. Commun., 2019, 10, 3843 CrossRef.
- S. Fratini, S. Ciuchi, D. Mayou, G. T. de Laissardière and A. Troisi, Nat. Mater., 2017, 16, 998–1002 CrossRef CAS.
- Y. Yi, V. Coropceanu and J.-L. Brédas, J. Chem. Phys., 2012, 137, 164303 CrossRef.
- P. Ordejón, D. Boskovic, M. Panhans and F. Ortmann, Phys. Rev. B, 2017, 96, 1–9 CrossRef.
- H. Tamura, M. Tsukada, H. Ishii, N. Kobayashi and K. Hirose, Phys. Rev. B: Condens. Matter Mater. Phys., 2012, 86, 035208 CrossRef.
- T. Nematiaram, D. Padula, A. Landi and A. Troisi, Adv. Funct. Mater., 2020, 30, 2001906 CrossRef CAS.
- M. Malagoli, V. Coropceanu, D. A. da Silva Filho and J. L. Brédas, J. Chem. Phys., 2004, 120, 7490–7496 CrossRef CAS.
- K.-H. Lin and C. Corminboeuf, Phys. Chem. Chem. Phys., 2020, 22, 11881–11890 RSC.
- T. Nematiaram, A. Asgari and D. Mayou, J. Chem. Phys., 2020, 152, 044109 CrossRef CAS.
- J. Kirkpatrick, V. Marcon, J. Nelson, K. Kremer and D. Andrienko, Phys. Rev. Lett., 2007, 98, 1–4 CrossRef.
- T. Kubo, R. Häusermann, J. Tsurumi, J. Soeda, Y. Okada, Y. Yamashita, N. Akamatsu, A. Shishido, C. Mitsui, T. Okamoto, S. Yanagisawa, H. Matsui and J. Takeya, Nat. Commun., 2016, 7, 11156 CrossRef CAS.
- V. Coropceanu, R. S. Sánchez-Carrera, P. Paramonov, G. M. Day and J.-L. Brédas, J. Phys. Chem. C, 2009, 113, 4679–4686 CrossRef CAS.
- A. Landi and A. Troisi, J. Phys. Chem. C, 2018, 122, 18336–18345 CrossRef CAS.
- R. G. Della Valle, E. Venuti, L. Farina, A. Brillante, M. Masino and A. Girlando, J. Phys. Chem. B, 2004, 108, 1822–1826 CrossRef CAS.
- A. Brillante, I. Bilotti, R. G. Della Valle, E. Venuti and A. Girlando, CrystEngComm, 2008, 10, 937 RSC.
- R. Ulbricht, E. Hendry, J. Shan, T. F. Heinz and M. Bonn, Rev. Mod. Phys., 2011, 83, 543–586 CrossRef CAS.
- N.-E. Lee, J.-J. Zhou, L. A. Agapito and M. Bernardi, Phys. Rev. B, 2018, 97, 115203 CrossRef CAS.
- N. Bedoya-Martínez, A. Giunchi, T. Salzillo, E. Venuti, R. G. Della Valle and E. Zojer, J. Chem. Theory Comput., 2018, 14, 4380–4390 CrossRef.
- T. F. Harrelson, V. Dantanarayana, X. Xie, C. Koshnick, D. Nai, R. Fair, S. A. Nuñez, A. K. Thomas, T. L. Murrey, M. A. Hickner, J. K. Grey, J. E. Anthony, E. D. Gomez, A. Troisi, R. Faller and A. J. Moulé, Mater. Horiz., 2019, 6, 182–191 RSC.
- C. R. Groom, I. J. Bruno, M. P. Lightfoot and S. C. Ward, Acta Crystallogr., Sect. B: Struct. Sci., Cryst. Eng. Mater., 2016, 72, 171–179 CrossRef CAS.
- A. Troisi, G. Orlandi and J. E. Anthony, Chem. Mater., 2005, 17, 5024–5031 CrossRef CAS.
- G. Schweicher, G. D’Avino, M. T. Ruggiero, D. J. Harkin, K. Broch, D. Venkateshvaran, G. Liu, A. Richard, C. Ruzié, J. Armstrong, A. R. Kennedy, K. Shankland, K. Takimiya, Y. H. Geerts, J. A. Zeitler, S. Fratini and H. Sirringhaus, Adv. Mater., 2019, 31, 1902407 CrossRef CAS.
- A. Y. Sosorev, Phys. Chem. Chem. Phys., 2017, 19, 25478–25486 RSC.
- S. S. Batsanov, Inorg. Mater., 2001, 37, 871–885 CrossRef CAS.
- J. L. Bredas, J. P. Calbert, D. A. da Silva Filho and J. Cornil, Proc. Natl. Acad. Sci. U. S. A., 2002, 99, 5804–5809 CrossRef CAS.
- S. Illig, A. S. Eggeman, A. Troisi, L. Jiang, C. Warwick, M. Nikolka, G. Schweicher, S. G. Yeates, Y. Henri Geerts, J. E. Anthony and H. Sirringhaus, Nat. Commun., 2016, 7, 1–10 Search PubMed.
- M. J. Kang, I. Doi, H. Mori, E. Miyazaki, K. Takimiya, M. Ikeda and H. Kuwabara, Adv. Mater., 2011, 23, 1222–1225 CrossRef CAS.
- T. Minari, Y. Miyata, M. Terayama, T. Nemoto, T. Nishinaga, K. Komatsu and S. Isoda, Appl. Phys. Lett., 2006, 88, 083514 CrossRef.
- J. Qian, S. Jiang, S. Li, X. Wang, Y. Shi and Y. Li, Adv. Mater. Technol., 2019, 4, 1800182 CrossRef.
- G. Weinzierl and J. Friedrich, Chem. Phys. Lett., 1981, 77, 139–142 CrossRef CAS.
- X. Ren, M. J. Bruzek, D. A. Hanifi, A. Schulzetenberg, Y. Wu, C.-H. Kim, Z. Zhang, J. E. Johns, A. Salleo, S. Fratini, A. Troisi, C. J. Douglas and C. D. Frisbie, Adv. Electron. Mater., 2017, 3, 1700018 CrossRef.
- P. Cui, D. P. McMahon, P. R. Spackman, B. M. Alston, M. A. Little, G. M. Day and A. I. Cooper, Chem. Sci., 2019, 10, 9988–9997 RSC.
- D. Schwalbe-Koda and R. Gómez-Bombarelli, in Machine Learning Meets Quantum Physics, ed. K. T. Schütt, S. Chmiela, O. A. von Lilienfeld, A. Tkatchenko, K. Tsuda and K.-R. Müller, Springer International Publishing, Cham, 2020, pp. 445–467 Search PubMed.
Footnote |
| † Electronic supplementary information (ESI) available. See DOI: 10.1039/d0mh01159b |
| This journal is © The Royal Society of Chemistry 2020 |

