
 Open Access Article
 This Open Access Article is licensed under a
 Creative Commons Attribution 3.0 Unported Licence
The influence of molecular geometry on the efficiency of thermally activated delayed fluorescence†
Roberto S.
Nobuyasu‡
a,
Jonathan S.
Ward‡
 b,
Jamie
Gibson
c,
Beth A.
Laidlaw
c,
Zhongjie
Ren
bd,
Przemyslaw
Data
ae,
Andrei S.
Batsanov
b,
Thomas J.
Penfold
*c,
Martin R.
Bryce
*b and
Fernando B.
Dias
*a
b,
Jamie
Gibson
c,
Beth A.
Laidlaw
c,
Zhongjie
Ren
bd,
Przemyslaw
Data
ae,
Andrei S.
Batsanov
b,
Thomas J.
Penfold
*c,
Martin R.
Bryce
*b and
Fernando B.
Dias
*a
aDurham University, Physics Department, South Road, Durham, DH1 3LE, UK. E-mail: f.m.b.dias@durham.ac.uk
bDurham University, Chemistry Department, South Road, Durham, DH1 3LE, UK. E-mail: m.r.bryce@durham.ac.uk
cChemistry-School of Natural and Environmental Sciences, Newcastle University, Newcastle upon Tyne, NE1 7RU, UK. E-mail: tom.penfold@ncl.ac.uk
dBeijing University of Chemical Technology, State Key Laboratory of Chemical Resource Engineering, Beijing 100029, China
eFaculty of Chemistry, Silesian University of Technology, M. Strzody 9, 44-100 Gliwice, Poland
First published on 29th May 2019
Abstract
In this work we successfully developed a strategy for positively influencing the conformation of thermally activated delayed fluorescence (TADF) molecules containing phenothiazine as the electron donor (D) unit, and dibenzothiophene-S,S-dioxide as the acceptor (A), linked in D–A and D–A–D structures. In this strategy the effect of restricted molecular geometry is explored to maximize TADF emission. The presence of bulky substituents in different positions on the donor unit forces the molecules to adopt an axial conformer where the singlet charge transfer state is shifted to higher energy, resulting in the oscillator strength and luminescence efficiency decreasing. With bulky substituents on the acceptor unit, the molecules adopt an equatorial geometry, where the donor and acceptor units are locked in relative near-orthogonal geometry. In this case the individual signatures of the donor and acceptor units are evident in the absorption spectra, demonstrating that the substituent in the acceptor uncouples the electronic linkage between the donor and acceptor more effectively than with donor substitution. In contrast with the axial conformers that show very weak TADF, even with a small singlet triplet gap, molecules with equatorial geometry show stronger oscillator strength and luminescence efficiency and are excellent TADF emitters. Acceptor-substituted molecules 6 and 7 in particular show extremely high TADF efficiency in solution and solid film, even with a singlet–triplet energy gap around 0.2 eV. This extensive study provides important criteria for the design of novel TADF and room temperature phosphorescence (RTP) emitters with optimized geometry.
Introduction
Three quarters of the excitons created by the electrical current used when driving an organic light emitting diode (OLED) are non-emissive triplet states. The localized nature of the excitons in organic materials gives rise to large exchange interactions, and leads to the formation of excited states with spin zero (singlet) and spin one (triplet).1 In addition, a fraction of the singlet states (S1) created upon charge recombination may also be converted into triplet states, due to intersystem crossing (ISC) caused by local hyperfine interactions,2 or due to spin–orbit coupling.3Singlet and triplet states have significantly different photophysical characteristics. The singlet state lives for a few nanoseconds and is often highly emissive. In contrast the decay of the triplet state occurs in the microsecond and even millisecond time ranges. The triplet state is also often non-emissive in organic molecules.3 Since singlet and triplet states are formed in a ratio of 1![[thin space (1/6-em)]](https://www.rsc.org/images/entities/char_2009.gif) :3 in OLEDs, the formation of triplet states is a major loss mechanism in the efficiency of these devices. This problem has driven research in OLEDs since they were first demonstrated in the late 20th century,4,5 and has led to the application of organic heavy-metal complexes, which have been the benchmark materials for phosphorescent OLEDs.6,7 Remarkably, OLEDs with internal quantum efficiency of nearly 100% have been fabricated with metal complexes, owing to the fast ISC and room temperature phosphorescent properties of these materials, which are promoted by the spin orbit coupling (SOC) of metals, such as iridium(III) and platinum(II).8,9 However heavy-metal complexes show significant problems when applied in OLEDs. The heavy metals are scarce and expensive materials, they may create environmental challenges, and readily degrade in the blue spectral region.10,11 These issues limit the utilization of metal complexes in areas that require high volume manufacturing, such as in lighting and display technologies. Therefore, alternative materials free of heavy metals are needed.
:3 in OLEDs, the formation of triplet states is a major loss mechanism in the efficiency of these devices. This problem has driven research in OLEDs since they were first demonstrated in the late 20th century,4,5 and has led to the application of organic heavy-metal complexes, which have been the benchmark materials for phosphorescent OLEDs.6,7 Remarkably, OLEDs with internal quantum efficiency of nearly 100% have been fabricated with metal complexes, owing to the fast ISC and room temperature phosphorescent properties of these materials, which are promoted by the spin orbit coupling (SOC) of metals, such as iridium(III) and platinum(II).8,9 However heavy-metal complexes show significant problems when applied in OLEDs. The heavy metals are scarce and expensive materials, they may create environmental challenges, and readily degrade in the blue spectral region.10,11 These issues limit the utilization of metal complexes in areas that require high volume manufacturing, such as in lighting and display technologies. Therefore, alternative materials free of heavy metals are needed.
Molecules showing thermally activated delayed fluorescence (TADF) have been introduced in recent years and have emerged as a promising alternative to heavy-metal complexes.12,13 To date the most successful TADF emitters have been designed with electron donor (D) and electron acceptor (A) units covalently linked with conjugational separation between the units. This separation can lead to a very small excited state singlet–triplet gap (ΔEST). In many cases ΔEST can be on the order of a few meV.14 If ΔEST is small, a significant population of the triplet state that occupies upper vibrational levels is able to undergo reverse intersystem crossing (RISC), giving rise to delayed fluorescence.15
OLEDs fabricated with TADF emitters have shown impressive performances, sometimes with external efficiencies (EQE) above 30%.16–18 However, the performance of TADF-based OLEDs is often weaker in the red and blue regions,19 and is in general affected by poor stability showing significant device efficiency roll-off at high current densities. The causes of poor stability are not always clear, but triplet–triplet annihilation and triplet–polaron processes are often responsible for the luminescence quenching. Both processes can compete with TADF due to the long lifetime of the triplet excited state.20 Faster decaying TADF molecules are thus highly desirable for resolving the device efficiency roll-off issues. Crucially, deeper understanding of the TADF mechanism is necessary to overcome these drawbacks and optimize device performance.21
The formation of excited states with strong charge transfer (CT) character in D–A and D–A–D structures leads to a vestigial overlap between the highest occupied and lowest unoccupied frontier molecular orbitals, (HOMOs and LUMOs, respectively). This effect strongly minimizes the exchange energy and leads to a small ΔEST. The sole presence of CT states is not a sufficient condition for a small ΔEST; near-orthogonal geometry between D and A units is also required.22–24 The dihedral angle between the D and A units is therefore important for the TADF contribution in these molecules, which can significantly vary among regioisomers of the same emitter.25 Non-exponential luminescence decays often occur in the solid-state, with the emitter dispersed in amorphous matrices, due to the presence of conformational heterogeneity induced by molecular packing.26,27 Additionally, a small ΔEST is not the only important parameter for RISC. Recent literature highlights the importance of spin-vibronic coupling,28,29 and mixing of charge transfer and localized electronic states to promote RISC.15,26,30,31
The motivation for the present study comes from literature reports of a series of phenothiazine (D) and dibenzothiophene-S,S-dioxide (A) TADF molecules where the donor is substituted with side bulky groups, aiming to force near D–A orthogonal geometry.32 Remarkably, while in the unsubstituted D–A and D–A–D molecules strong TADF is observed, even in solid thin films, for the substituted emitters the TADF emission is suppressed, and is almost entirely replaced by room temperature phosphorescence (RTP) in some molecules.30,31 Here, we expand the study of D–A and D–A–D molecules, with additional analogues utilizing bulky substituents in different positions of both the D and A units. The effect of the substituents on the energy of the singlet and triplet excited states, and on molecular geometry is studied in detail with a variety of spectroscopic techniques and supporting density functional theory (DFT) and time-dependent density functional theory (TDDFT) calculations.
Results and discussion
Molecular structures
The molecular structures studied in this work are shown in Fig. 1. Compounds 1–5, 10, 1132 and 933 have been reported previously; compounds 6–8 and 12 are new. Molecules 1 and 9 are the unsubstituted D–A–D and D–A reference compounds, which allows the influence of the bulky side-groups on the excited state dynamics of the substituted molecules to be established. Molecules 2–5 are D–A–D, and are all substituted on the phenothiazine donor. Molecules 6 and 7 are also D–A–D, but substituted on the dibenzothiophene-S,S-dioxide acceptor; molecule 8 is substituted on both D and A units. Finally, molecules 10–12 are the asymmetric D–A versions substituted on the donor unit, with molecule 12 substituted at a remote site, thus being a useful control molecule in assessing steric hindrance at the D–A bond. The structures and high purity of the molecules were confirmed by NMR spectroscopy, mass spectrometry and elemental analysis, with X-ray crystal structures for compounds 6, 7, and 8.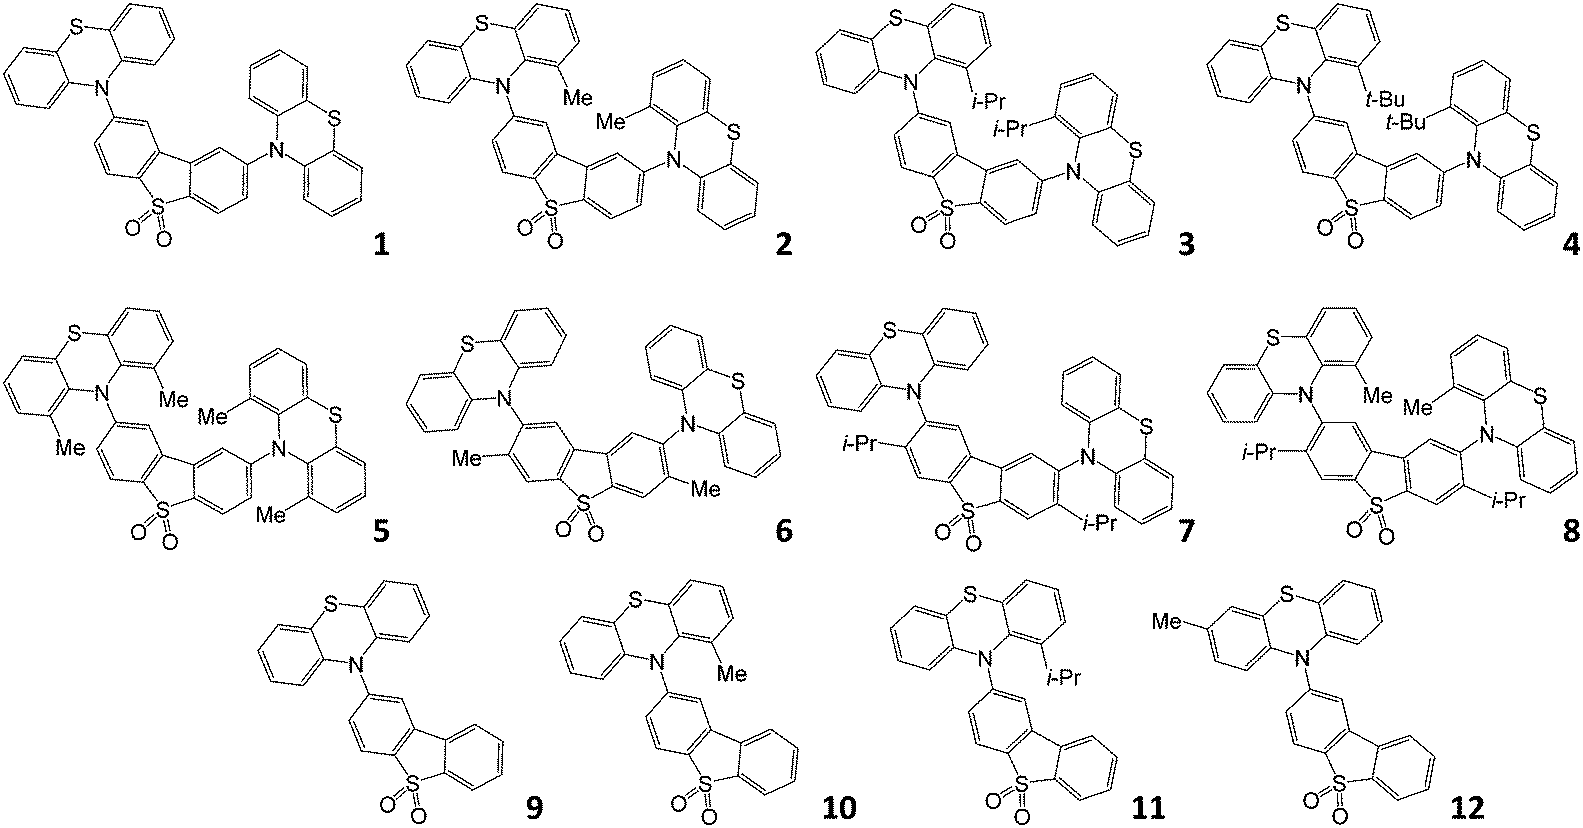 | ||
| Fig. 1 Molecular structures of the emitters investigated in this work. | ||
With this comprehensive mapping of structural substitutions, the influence of the substituents on the TADF efficiency in phenothiazine-based emitters can be assessed in unprecedented detail. The focus is on studying the intricate role of the steric effects that influence molecular geometry, and the energy of electronic excited states on the photophysics of TADF.
X-ray crystal data
Fig. 2 shows the molecular structures obtained from X-ray experiments for molecules 6, 7 and 8. In each molecule, both thiazine moieties have equatorial orientations and are folded inward along the N⋯S vectors (Table S3.2, ESI†, dihedral angles θ1 and θ2). In molecules 6 and 7, the twist angles (τ1, τ2) around the C(A)–N bonds are somewhat unsymmetrical: 86–88° and 66–74°, showing the extent of conformational flexibility, although the donor–acceptor π-conjugation is precluded in either case and the nitrogen atom's lone pair is interacting with the arene rings of the donor rather than the acceptor (compare C(A)–N and C(D)–N bond distances in Table S3.2, ESI†). Molecule 8 in the non-solvated crystal has crystallographic C2 symmetry, the methylphenothiazine moiety is disordered (in a 0.86:0.14 ratio) between two equatorial orientations with the methyl group lying on either side of the dibenzothiophene plane. Thus, the prevalent isomer must have anti-disposition of methyls and genuine local C2 symmetry, although the syn-isomer (with approximate Cs symmetry) is not impossible. In 8·CDCl3, the molecule has crystallographic Cs symmetry, with the mirror plane passing through the S(1) and both O atoms. Here, the methylphenothiazine moiety is similarly disordered in a 0.9:0.1 ratio, but in this case the prevalent conformation is syn. In contrast with all the other structures, in 8·CDCl3 the dibenzothiophene system is not planar but bent by 15.7°. The distortion cannot be explained by steric repulsion between syn methyl groups, which are too distant for a van der Waals contact (C⋯C 6.62 Å).
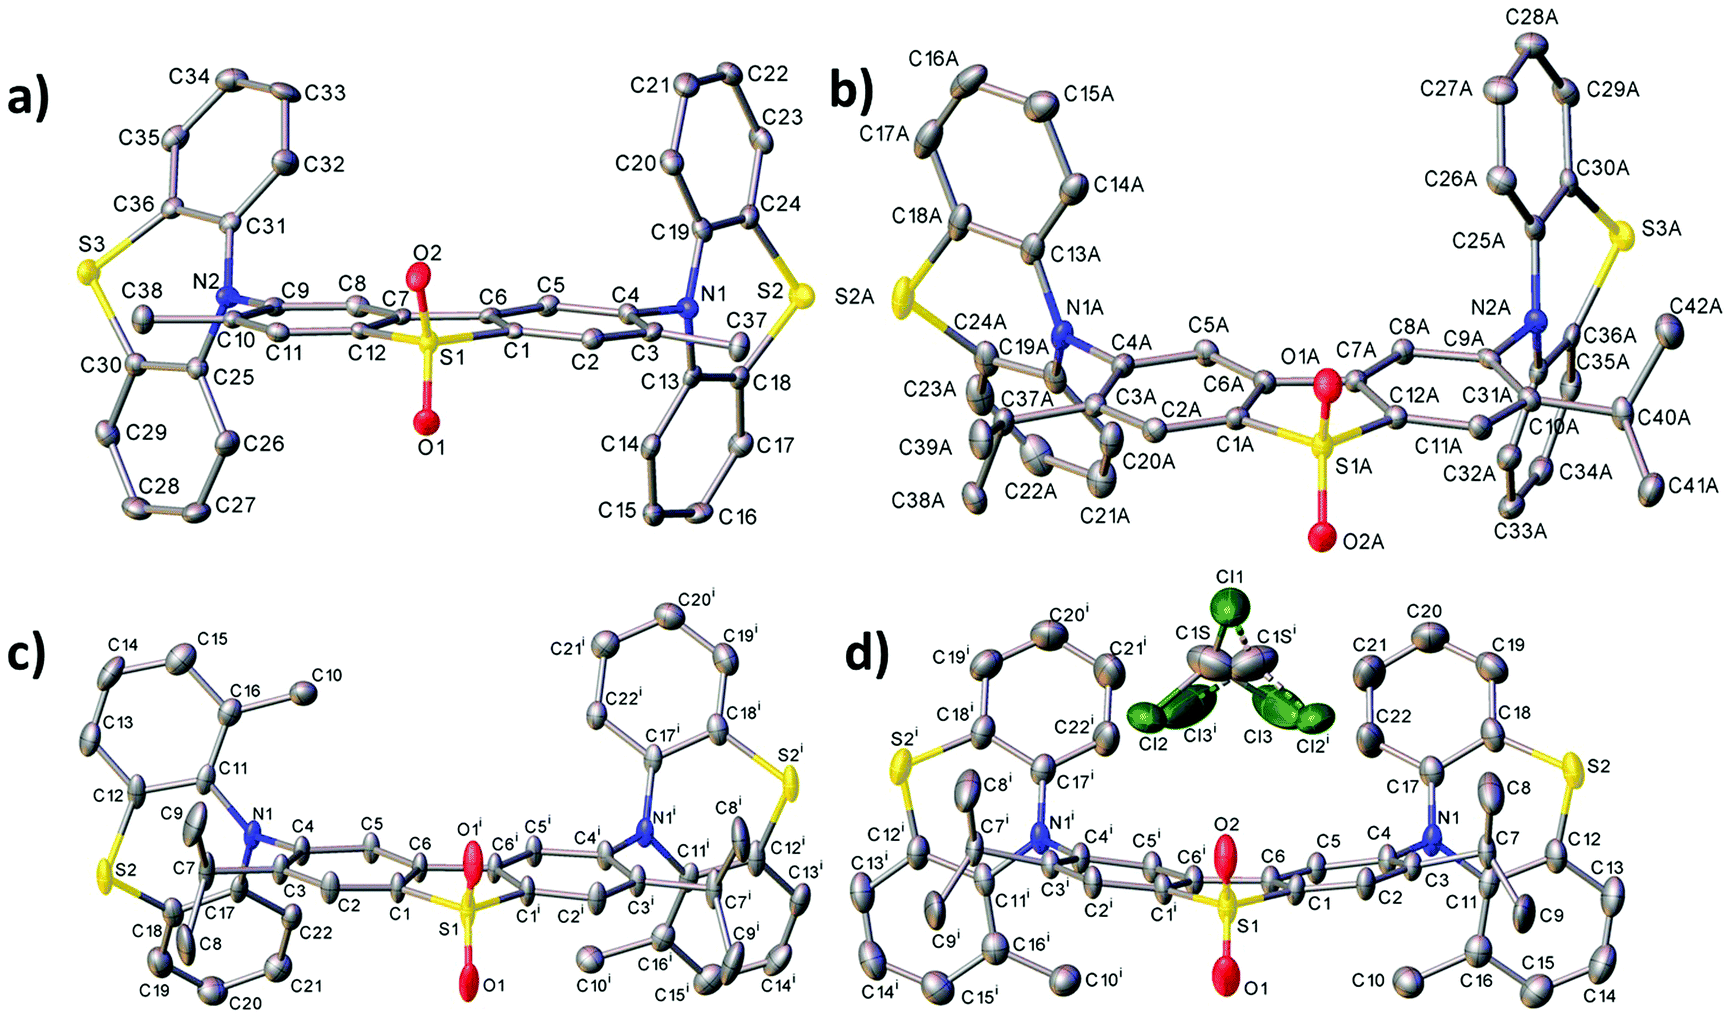 | ||
| Fig. 2 Molecular structures of 6 (a), 7 at 120 K (b), 8 (c) and 8·CDCl3 (d) showing ellipsoids at 50% probability. H atoms are omitted. Primed atoms are generated by a twofold axis (c) and a mirror plane (d). | ||
Computational studies and electrochemistry
Molecules 1, 9 and their substituted D–A–D and D–A analogues can exhibit more than one stable conformer, with both the H-intra and H-extra folded conformers of the phenothiazine possible.25 This allows formation of parallel quasi-axial (ax) and perpendicular quasi-equatorial (eq) conformers, as shown in Fig. 3 for compounds 1 and 9. For the D–A–D molecules there is also the possibility for mixed conformers, where one donor is quasi-axial and the other quasi-equatorial. The nomenclature of axial and equatorial conformers is defined as previously labelled in the literature,34 and is in reference to the N⋯S axis and plane of the phenyl rings.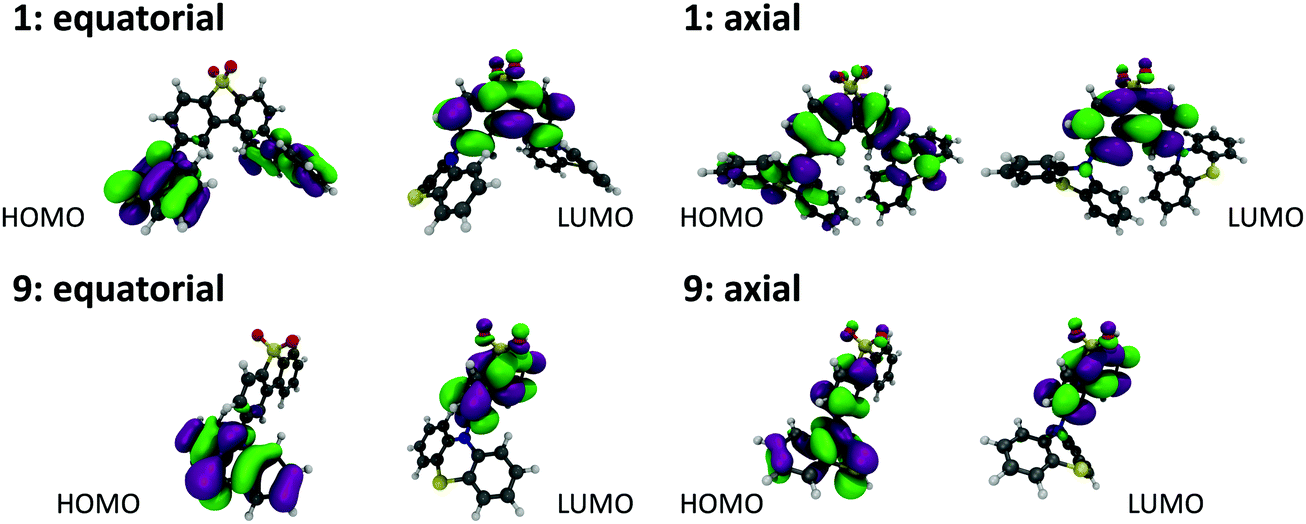 | ||
| Fig. 3 DFT(M062X) optimised structures and Kohn–Sham HOMO and LUMO orbitals for the (a) quasi-equatorial and (b) quasi-axial conformers of molecules 1 and 9. | ||
Molecules substituted in the 1-position of the phenothiazine donor favour the axial conformation. This is the case for molecules 2, 3, 4, 10 and 11. In contrast, molecules substituted on the acceptor favour the equatorial conformation. This is the case for molecules 6 and 7 which exhibit no axial conformations. The twist angles (τ1, τ2) around the C(A)–N bonds in 6 and 7 range between 86–88° and 66–74° (Table S3.2, ESI†), showing room for some conformational flexibility, but where significant donor–acceptor π-conjugation is prevented. Importantly, no interconversion between ax. and eq. forms is possible in both sets, as only one form is observed in our measurements and calculations. Unsubstituted molecule 1 and methyl-donor substituted 5 favour the axial conformer, but show equatorial and mixed forms at higher energy (Table S2.1, ESI†). Molecule 1 can interconvert between the ax., eq., and mixed forms in solution, as the barrier that separates these conformers is relatively low (<0.15 eV). This calculated barrier is consistent with previous calculations on 1,35 and highlights the suitability of the DFT parameters used in this more expanded study. In molecule 5 however, such interconversion is more difficult as the energy barrier is higher (0.33 eV between ax. and mixed forms, and 0.64 between ax. and eq. forms). Molecule 8 shows eq., ax. and also the mixed form, all separated by a considerable energy barrier, around 0.2 eV. Therefore, interconversion between conformers is also difficult in compound 8. Finally, molecules 9 and 12 are both asymmetrical and do not show a significant energy barrier between the ax. and eq. conformers. Therefore, interconversion between both forms should occur in solution. Control molecule 12 is clearly useful to demonstrate that the effects observed here are predominantly steric.
In summary, as shown in Table S2.1 (ESI†), all the molecules with the exception of 6 and 7 favour the axial or the mixed form in the electronic ground state. Interconversion to the eq. form is possible in molecules 1, 9 and 12, with molecules 6 and 7 permanently in the eq. form. This is important, as it has been recently proposed that the different conformers of phenothiazine have profound influence on the electronic structure, and on TADF efficiency.25,35
All the compounds show oxidation and reduction processes in cyclic voltammetry (CV) studies (Fig. S1.1, ESI†). The redox potentials, electron affinity (EA) and ionization potential (IP) values are shown in Fig. S1.2 (ESI†). The trends observed in this figure are also reproduced by a plot of the HOMO and LUMO energies for each of the molecules, calculated using DFT(M062X)/def2-SVP and shown in Fig. S2.2 (ESI†). The axial conformers exhibit the largest energy gap between the HOMO and LUMO due to the stabilisation of the HOMO in this form. While care should be exercised in interpreting excited state energies from DFT HOMO–LUMO energy gaps, this data set is consistent with the higher CT energy observed for the axial conformers.25 The stabilisation of the HOMO is due to its ability to delocalise over both the donor and acceptor groups, as shown in Fig. S2.2 (ESI†) for molecules 1 and 9.
For compounds 1–4 the IP increases with increasing the size of the alkyl groups, varying from −5.4 eV in 1, to −6.1 eV, in 4. The effect on the EA energy is the opposite and is less pronounced. With increasing the bulkiness of the donor side groups the EA energy varies from −3.09 eV in 1, to −2.68 eV in 4. This is associated with the increasing energy of the LUMO related to orbital density across the strained N–C (donor–acceptor) bond. Interestingly, there is almost no significant difference in the IP and EA energy levels of the t-butyl mono-substituted 4, and the methyl bi-substituted analogue 5. This suggests that the steric effects caused by the presence of the two methyl groups on the phenothiazine donor are similar to that of a single t-Bu group.
Similar behaviour is observed for the D–A derivatives, compounds 9–11. With increasing the bulkiness of the alkyl substituents the IP energy is stabilised, while the EA is destabilised. The bulkier side groups force the angle between donor and acceptor to increase, making oxidation more difficult. However, when the phenothiazine is substituted with a methyl group at a remote position, compound 12, no significant effect is observed, i.e. compounds 9 and 12 have similar IP and EA energies. This indicates that there is no influence on the dihedral angle between the donor and acceptor groups when the substitution is not adjacent to the D–A bond, as expected.
When the alkyl substitution occurs on the acceptor unit, the IP remains almost unaffected, i.e. compounds 1, 6 and 7 show similar IP energies. There is however, a very small change in the EA energy, but this is not correlated with the size of the alkyl substituent. As shown in Fig. 2b, the alkyl substituent on the acceptor induces an equatorial conformation of the phenothiazine units to minimise energy. In the equatorial conformation the steric penalty of the alkyl substituent is effectively negated. Therefore, switching from methyl to isopropyl does not change the EA of the acceptor significantly because the steric hindrance of both substituents is quite similar in the equatorial conformation. Interestingly, when both donor and acceptor are substituted in compound 8, the influence of the methyl group on the phenothiazine donor is less pronounced (see the relative changes observed between compounds 1, 2, and 7, 8 in Fig. S1.2, ESI†).
UV-vis absorption in DCM solution
Fig. 4a shows the absorption spectra of the 10−4 M solutions of unsubstituted D–A–D, 1, and D–A, 9, in dichloromethane (DCM), compared with the absorption of the D and A uncoupled fragments. The absorption of the phenothiazine unit is clearly identified by the two well-defined bands, one peaking at 250 nm and the other at ≈325 nm. The absorption of the dibenzothiophene-S,S-dioxide acceptor is also clearly identified, showing bands that peak at ≈280 nm, and below 250 nm.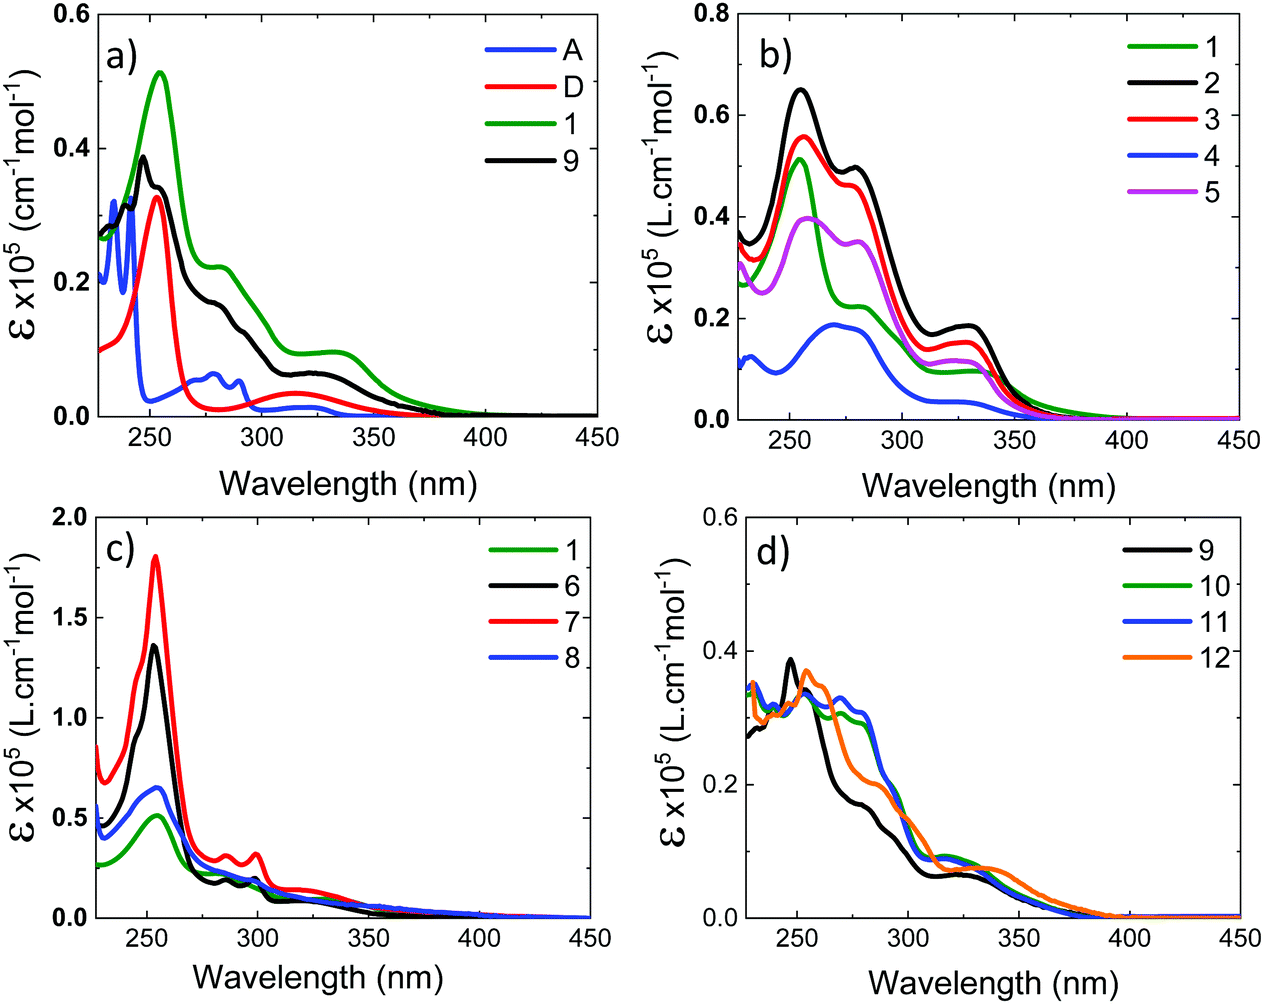 | ||
| Fig. 4 Absorption spectra in dichloromethane. (a) Donor, acceptor and the unsubstituted D–A–D and D–A molecules, 1 and 9; (b) D–A–D molecules with the substituents on the donor, 1–5; (c) D–A–D molecules with the substituents on the acceptor 6 and 7, and on both D and A units, molecule 8; (d) D–A molecules with substituents on the donor, 10–12. | ||
In general, the absorption spectra of compounds 1 and 9 are well reproduced by the superposition of the absorption of the individual D and A fragments, with the exception of a tail with low oscillator strength that is observed up to 450 nm, which is attributed to the direct absorption of the charge transfer (CT) state.26,32,33 This assignment is further confirmed by computational studies, as these peaks are very weak in the calculated absorption spectrum (Section S2.4, ESI†). They are only expected to gain intensity from thermal fluctuations.36 When the D unit is substituted with bulky substituents in 2–5, marked differences are observed in the absorption spectra, when compared with the unsubstituted counterpart D–A–D (see Fig. 4b). With increasing bulkiness of the substituent, the absorption band appearing at 250 nm becomes broadened. The molar absorption coefficient at 250 nm decreases, suggesting a decrease of the oscillator strength of the electronic transitions associated with the D unit. Additionally, the CT absorption tail that extends to 450 nm in 1 and 9 is also suppressed with a bulkier substituent. These data indicate that the direct absorption of the CT state is weak in the D-substituted compounds. In contrast, the absorption spectra of A-substituted 6 and 7 show an enhanced molar absorption coefficient around 250 nm (Fig. 4c). This is a clear signature of the phenothiazine donor unit, and shows no broadening effect in the D region, as these two molecules are substituted only on the acceptor unit. The absorption band of the acceptor unit is more clearly observed in compounds 6 and 7 than in 1–5. The increased acceptor absorption suggests that the substitution of the acceptor uncouples the electronic linkage between the D and A units more effectively than donor substitution. In molecule 8, the vibrational structure in the acceptor unit is lost and the peak around 250 nm is broad with weaker oscillator strength, confirming the effects are due to D substitution.
For asymmetrical donor-substituted 10 and 11, the absorption spectra are strongly suppressed at 250 nm as occurs in 1–4 (Fig. 4d). The behaviour is clearly different for molecule 12. The absorption spectrum of 12 is almost identical to the spectrum of 9 due to the alkyl substitution in the remote position on the donor. The UV-vis absorption data is entirely consistent with the CV data, showing the influence of substitution position on the electronic properties of the donor or acceptor regions due to the steric hindrance introduced by the side groups.
The absorption spectra were calculated using TDDFT(M062X) at the DFT(M062X) optimised ground state geometry of the major conformers for 1–12 (Section S2.4, ESI†). The spectra broadly reproduce the trends observed experimentally. The calculated absorption spectra for 1–5 indicate the axial conformer is predominant in these molecules. In contrast, for 6 and 7 the equatorial conformer is predominant, while 8 favours the axial. Finally, molecules 9–12 exhibit relatively broad featureless absorption spectra due to the increased mixing of the donor and acceptor electronic structures, consistent with a preference of the axial form.
Steady-state emission in toluene solution
Photoluminescence experiments were performed in toluene solution, in the absence of oxygen. Fig. 5a shows the emission spectra of molecules 1–5. Molecule 1 shows strongly red-shifted broad emission, relative to the emission of the uncoupled units, and consistent with the CT character of the emissive singlet excited state, peaking around 600 nm. According to calculations (Tables S2.1 and S2.3, ESI†), this red-shifted emission can only be derived from the equatorial conformer of one of the D–A groups, suggesting conformational reorganisation in the excited state. This ability to reorganise derives from an elongation of the D–A bond distance in the excited state, which lowers the barrier between the two conformers.29 For 2 and 5 the scenario is similar. However, the emissive CT state shifts to higher energies due to the methyl substituent groups. In the D methyl substituted molecules, the axial conformer becomes the most stable and the equatorial conformer is raised in energy significantly. This elevated energy barrier therefore prevents the occurrence of axial to equatorial conformational reorganization in 2 and 5. Molecules 3 and 4 show no equatorial or mixed conformers in the DFT calculations (Table S2.1, ESI†). This is consistent with the emission spectrum of 4, which is dominated by a well-resolved band, peaking around 400 nm. 3 still shows emission with a degree of CT character, but this appears at higher energies than in 1, 2 and 5. The band peaking around 400 nm is also more intense in 3 than in 1, 2 and 5. A clear trend is observed for molecules 1–5, where the steric hindrance caused by the substituent on the donor narrows and shifts the CT emission to higher energies. An emission band around 400 nm is therefore observed, and grows in intensity with increasing steric hindrance. The growing emission band is assigned to the radiative decay of the axial conformer, and is most likely mixed with emission of the singlet local excited state (1LE), as shown in the calculations in Table S2.1 (ESI†). These observations are consistent with the CV data. The effect is particularly pronounced in 4, where the 1CT emission is almost completely quenched. The 1LE emission dominates the entire spectrum, showing that the steric-effect imposed by the substituent also affects the formation and stabilisation of the CT state.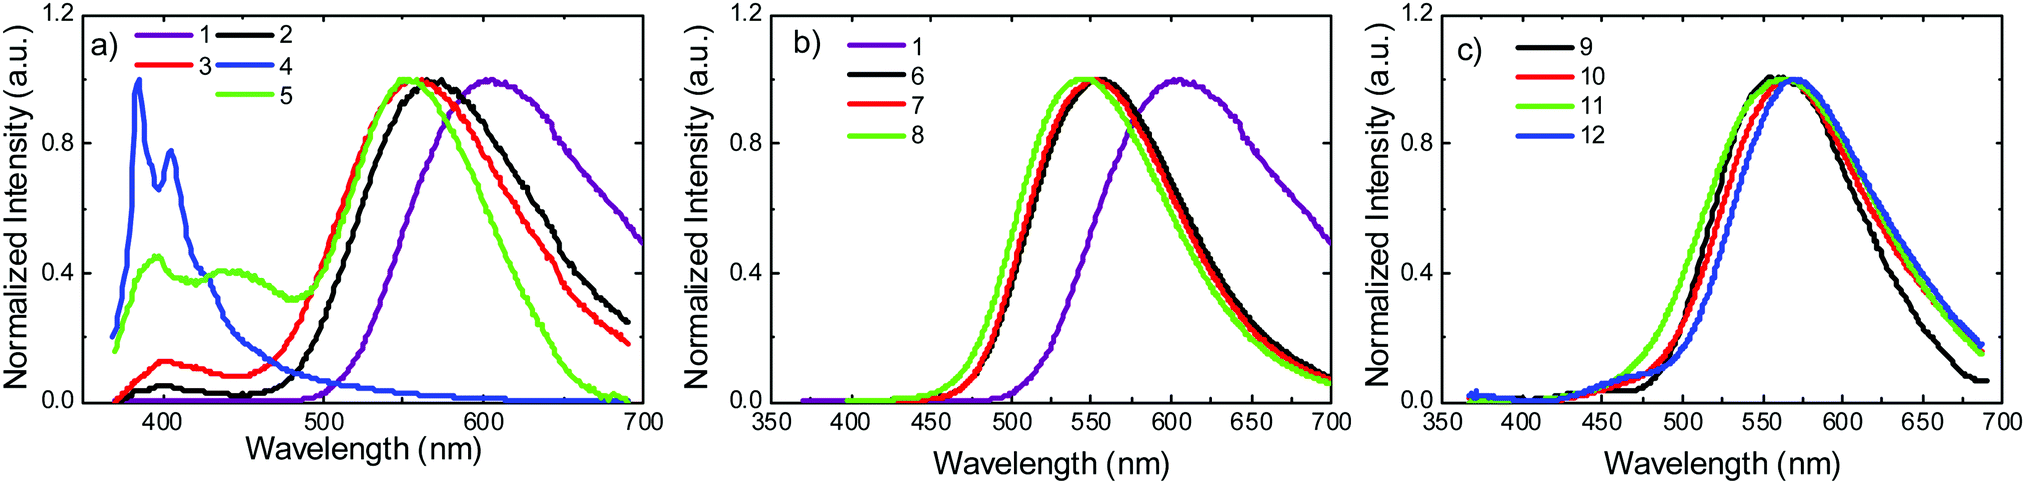 | ||
| Fig. 5 Steady state emission in degassed toluene solution at room temperature for molecules: (a) 1–5, (b) 1, 6–8, and (c) 9–12. | ||
The emissions of the molecules 6–8 substituted on the acceptor are shown in Fig. 5b. Compared with 1, the 1CT emissions in 6 and 7 that are substituted with methyl and i-propyl groups, respectively, are significantly blue-shifted, relative to the emission of 1, but no other significant effects are observed in these measurements. The emission of D and A substituted molecule 8, shows a slight blue shift, compared with 6 and 7. This is consistent with the calculations in Table S2.3 (ESI†), where no axial conformer is detected for 6 and 7, but in 8 the mixed axial–equatorial form is favoured relative to the axial conformer.
Fig. 5c shows the emission spectra of D–A molecules 9–12. The spectral shifts induced by the substitution at the D unit are significantly smaller, when compared with the shifts observed for the D–A–D counterparts 1–5. The emission of 10 is slightly red shifted relative to the emission of 9. A similar effect is observed for 12. However, the emission of 11 appears broader than all the others, peaking at a similar wavelength to 9. Therefore, in general, the effect of the substituent on the emission of the asymmetrical D–A molecules is weaker than in their D–A–D counterparts. The emission of 9 appears significantly blue-shifted when compared to 1, showing that the 1CT state is more stabilised in the D–A–D structure than it is in the asymmetrical D–A counterpart. The second donor in the D–A–D structures weakens the strength of the acceptor.
Thermally activated delayed fluorescence
The intensity of the emission in TADF molecules is often strongly dependent on the oxygen concentration. This occurs due to triplet quenching mechanisms competing with the RISC rate, giving weaker TADF. In general terms the TADF mechanism involves the recycling of singlet (S1) and triplet (T1) states, mediated by the intersystem crossing kISC and reverse intersystem crossing kRISC rates. Both singlet and triplet states are also affected by internal conversion, represented by kSIC and kTIC, and by their radiative decay rates, kf, and kPh, accounting for the fluorescence and phosphorescence emissions (Fig. 6a).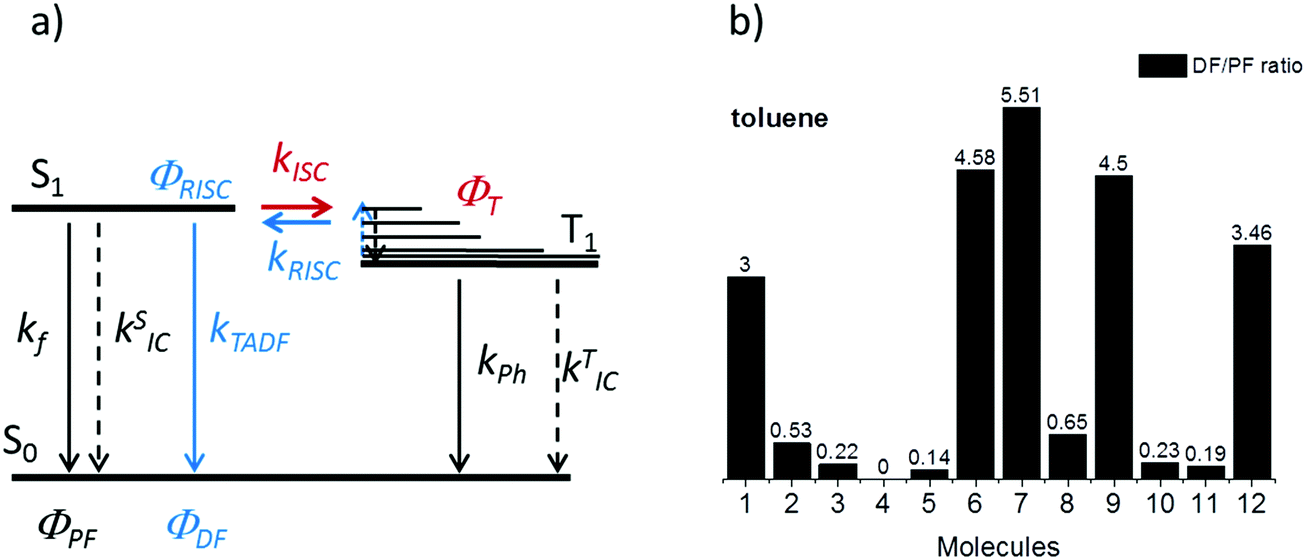 | ||
| Fig. 6 (a) Schematic representation of the triplet harvesting mechanism responsible for TADF, (b) DF/PF ratio for the 12 molecules studied in this work, measured in toluene by comparing steady-state fluorescence integrals in deoxygenated and aerated solutions. | ||
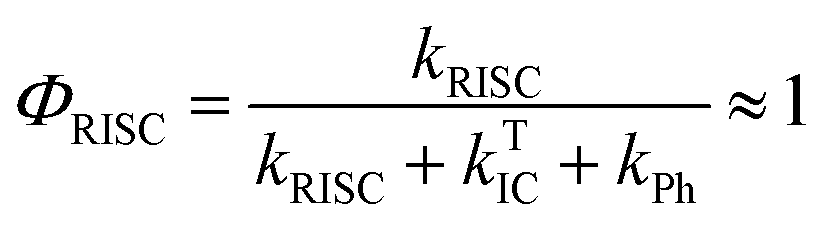
The total fluorescence emission from a TADF emitter (Φf) comprises prompt (ΦPF) and delayed fluorescence (ΦDF) components due to the triplet harvesting, as described in Fig. 6a. Strong TADF is easy to observe and analyse in molecules with a relatively strong triplet yield, ΦT, and where the yield of singlet states formed by reverse intersystem crossing, ΦRISC, is close to 100%. Such conditions are met in compounds where the energy gap between the singlet and triplet states is small, (typically <0.1 eV), and the pathways for vibrational decay affecting the triplet excited state are suppressed, i.e. kRISC ≫ kPh + kTIC, see eqn (1).15
 | (1) |
 | (2) |
Strong TADF is observed in the unsubstituted molecules 1 and 9, in acceptor-substituted molecules 6 and 7, and in control molecule 12. For the other molecules, the TADF contribution is weaker, and is absent in 4. Strong TADF emission is thus observed only in molecules where the equatorial conformer is favoured in the excited state geometry (Table S2.3, ESI†).
Time dependent fluorescence decays were also collected to evaluate the influence of the substituent groups on the delayed fluorescence lifetime. TADF occurs while triplet excited states are available, so TADF emission decays with the triplet lifetime. This data gives insight into the triplet deactivation pathways.15 Molecules with efficient triplet harvesting and TADF will have shorter emission lifetimes. Fig. 7 shows the time-dependent fluorescence decays for all the molecules in this study. The decays are in general complex, even in the PF region, requiring bi-exponential and even tri-exponential fittings. The interpretation of complex fluorescence decays is not always obvious. This is especially true in TADF compounds in general, and particularly in the compounds reported here which have a tendency to show fluorescence from local excited states, pronounced spectral shifts over time due to solvatochromism of the CT emission, emission appearing from different conformers and thus different CT states, and even potentially delayed fluorescence contributions to the tail of the PF decay due to fast RISC processes. Therefore, it is not possible to give a unique and well-defined reasoning for the observation of the multi-exponential decays. Instead, they reflect the complexity of the CT and TADF mechanisms in these molecules. However, despite this complexity it is clear that some trends can be defined. The unsubstituted molecule 1 shows mono-exponential TADF decay with 0.69 μs lifetime. This molecule also has a large DF/PF ratio (Fig. 6b), showing that the fast DF lifetime results from a fast RISC rate. In contrast, the substituted molecules 2–5 exhibit increasingly longer and more complex TADF decays and increasingly smaller DF/PF ratios. Molecules 2–4, substituted on the donor unit with increasingly bulky groups, show fast bi-exponential TADF decays with lifetimes in the 1 μs to 15 μs range. TADF emission is followed by a longer decay component that varies from 32 μs to 53 μs. Tetramethyl-substituted molecule 5 shows the slowest emission with 88 μs lifetime. Molecule 4 shows complex three-component decay in the ns range and negligible delayed fluorescence. The trend of smaller DF/PF ratios and increasingly complex DF decays is clearly associated with the high-energy barrier to the equatorial form, due to the steric hindrance imposed by the substituent groups.
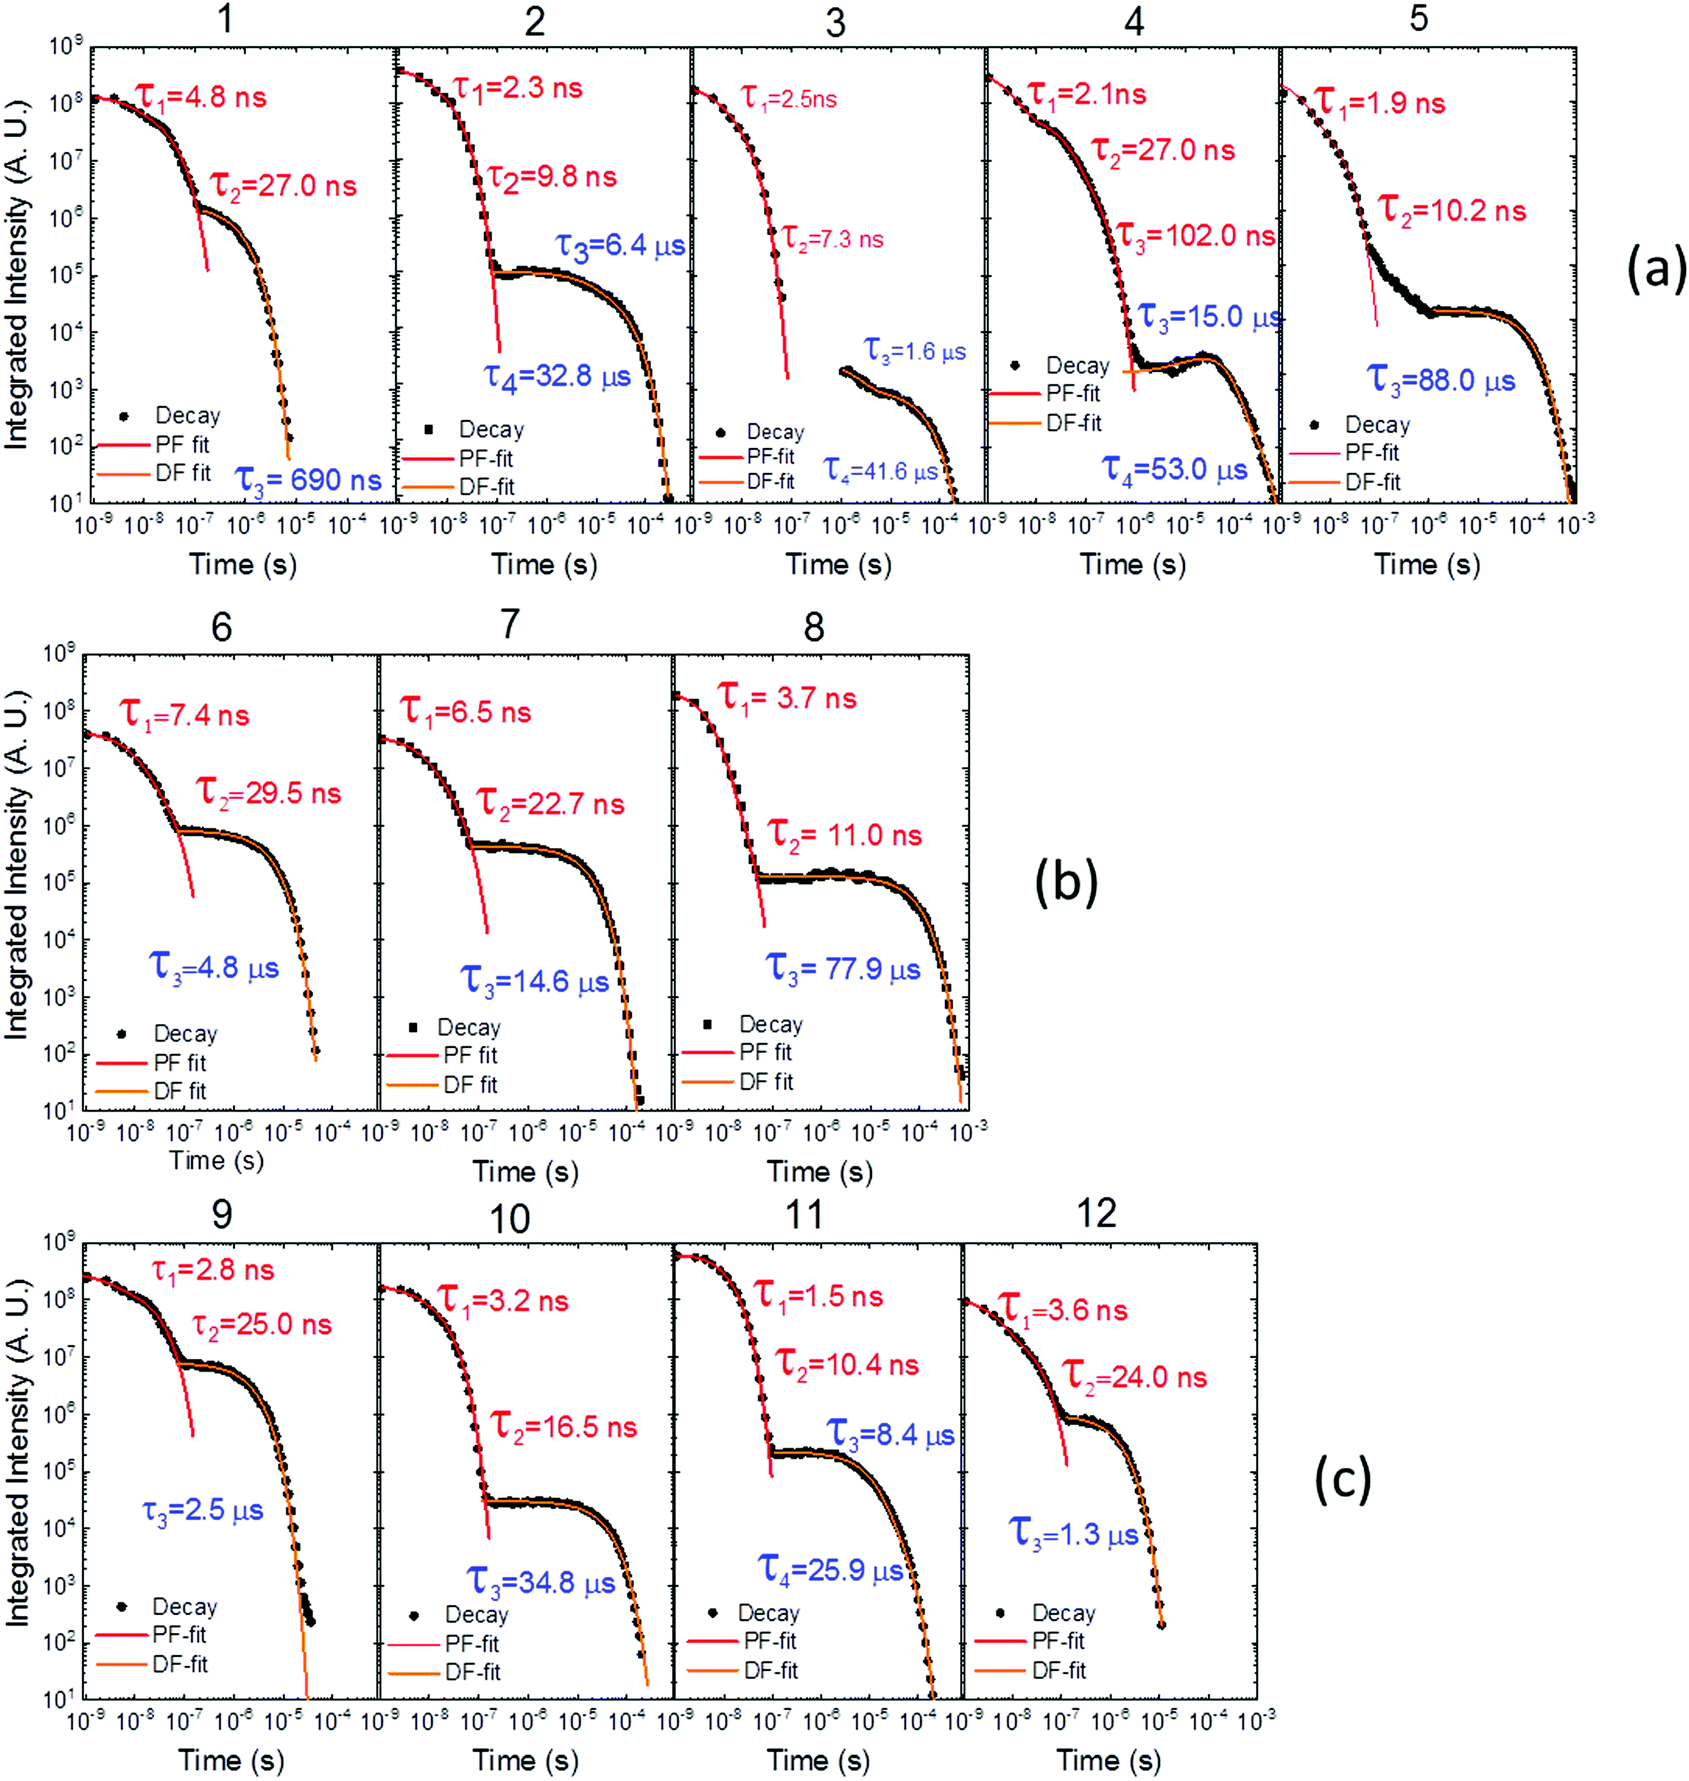 | ||
| Fig. 7 Time-dependent fluorescence decays for molecules (a) 1–5, (b) 6–8 and (c) 9–12, all collected in degassed toluene solution at room temperature. | ||
Molecules 6 and 7 adopt the equatorial conformation, and show clear mono-exponential TADF decays, with lifetimes of 4.8 μs, and 14.6 μs, and larger DF/PF ratios (Fig. 6b) when compared with molecules 1–5. The excellent TADF performance of molecules 6 and 7 indicates that the presence of the axial conformer acts as a quenching centre for TADF. Molecule 8 shows mono-exponential TADF decay with a long lifetime of 77.9 μs, and small DF/PF ratio. This is consistent with the equatorial form only being accessible in 8via the mixed conformer.
D–A molecule 9 is a very strong TADF emitter (DF/PF ratio 4.5), and TADF decays mono-exponentially with 2.5 μs lifetime. Molecules 10 and 11 have slow TADF lifetimes of 34.8 μs and 25.9 μs, respectively, and small DF/PF ratios. Control molecule 12 shows strong TADF (DF/PF ratio 3.4), and TADF decays mono-exponentially with 1.5 μs lifetime. Molecules 9 and 12 show the equatorial conformation, whereas 10 and 11 show axial, again confirming that the equatorial conformation is a key parameter for TADF emission in these systems.
Fig. 8 shows a plot of the DF/PF ratio vs. the ratio between the RISC and ISC rates, determined by fitting the decays in Fig. 7 using the kinetic equations developed in ref. 29. There is a clear correlation showing that molecules with high TADF efficiency measured by the DF/PF ratio in Fig. 6b, have a larger ratio between the RISC and ISC rates, confirming TADF contributions measured from steady-state and time-resolved data are consistent with each other. The compounds with larger DF/PF ratio are those that are able to promote more triplets back to the singlet manifold. Molecules 3 and 4 deviate from the correlation because they have a small TADF contribution, making determination of RISC/ISC rates problematic.
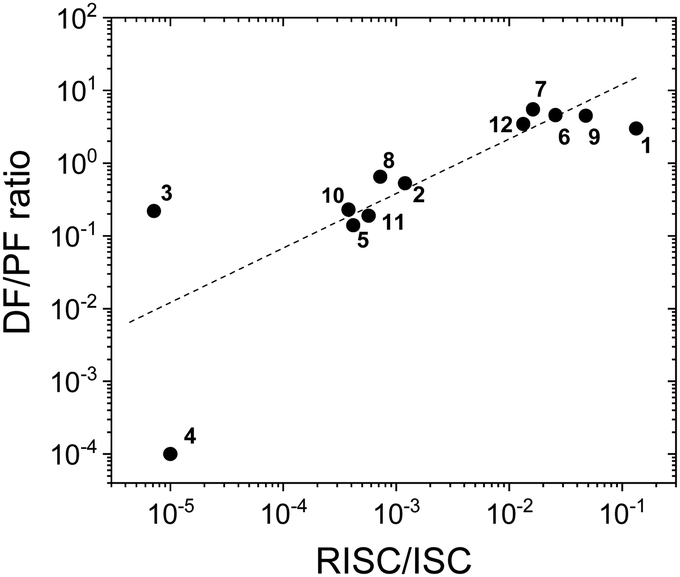 | ||
| Fig. 8 The DF/PF ratio vs. the ratio between the RISC and ISC rates in toluene obtained from a fit of the time-decays using the equations developed in ref. 29 plotted in logarithmic scale (the dash-line in the figure is a guide for the eye). | ||
Steady-state luminescence in solid film
In contrast with the emission in solution, the steady-state emission spectra of compounds 2–5 in solid zeonex film show dual luminescence. The dual emission is composed of fluorescence at short wavelengths (≈400 nm) from a mix of axial 1LE and 1CT fluorescence and red-shifted phosphorescence, peaking at ≈500 nm (Fig. 9). The phosphorescence emission matches the emission of the separate donor and acceptor units, and is assigned to a local triplet excited state (3LE).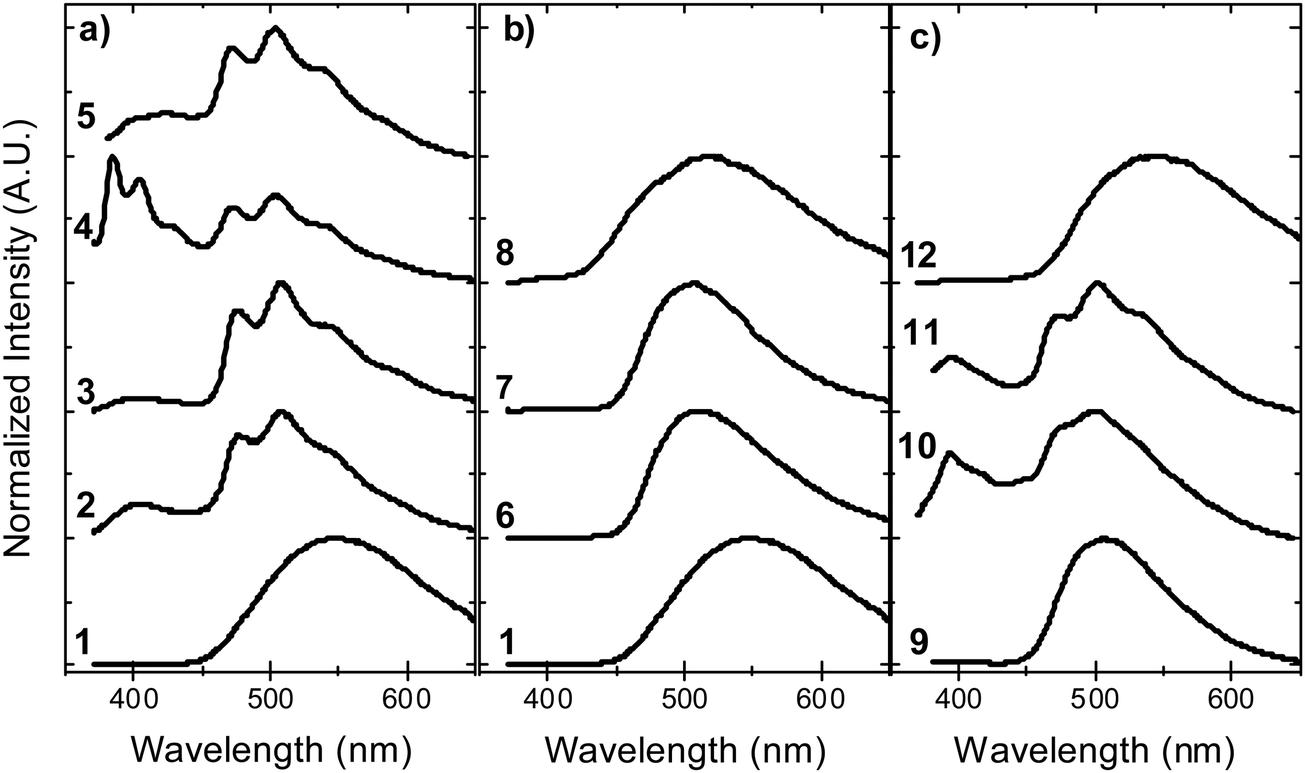 | ||
| Fig. 9 Steady-state emission in solid zeonex film, in vacuum, at room temperature for molecules: (a) 1–5, (b) 1, 6–8, and (c) 9–12. | ||
Room temperature phosphorescence (RTP) is also observed for molecules 10 and 11 in Fig. 9c, and in 8, where it is less pronounced (Fig. 9b). In summary, all the molecules that show a large DF/PF ratio in Fig. 6b, e.g.1, 6, 7, 9 and 12, show broad CT fluorescence in zeonex, and no RTP is observed. Molecules 2–5, 8, 10 and 11 show dual luminescence composed of fluorescence at shorter wavelengths, and RTP. These data indicate that quenching of delayed fluorescence is due to a slow RISC rate in the more geometrically restricted molecules, and is consistent with the correlation shown in Fig. 8. Triplets are formed in relatively high yield, and are not significantly quenched by internal conversion as RTP is observed at ms delay times. However, the RISC rate is not fast enough to make triplet-to-singlet up-conversion a viable step. Note also that the molecules showing weak DF are those where the interconversion from axial to equatorial conformation is more difficult to occur, as described above.
Fig. 10 shows the phosphorescence of molecules 1–12 in zeonex at 80 K. Molecules 6 and 7 stand out as their phosphorescence is clearly dominated by the donor phenothiazine. No phosphorescence from the dibenzothiophene-S,S-dioxide acceptor is observed. In all the other molecules both donor and acceptor phosphorescence is observed. This indicates that the triplet states in 6 and 7 are able to relax to the low energy triplet localised in the D unit (3D), while in the other compounds some of the triplets are trapped in the high energy triplet localised in the acceptor unit. The contribution of the acceptor phosphorescence is particularly strong in compounds 2–5 and 10–11. Molecules in this series with strong acceptor phosphorescence show less efficient TADF, while acceptor phosphorescence is absent in the strongest TADF emitters 6 and 7. The question here is: what stops some of the triplets, given their long lifetime, relaxing to the 3D triplet of lower energy?
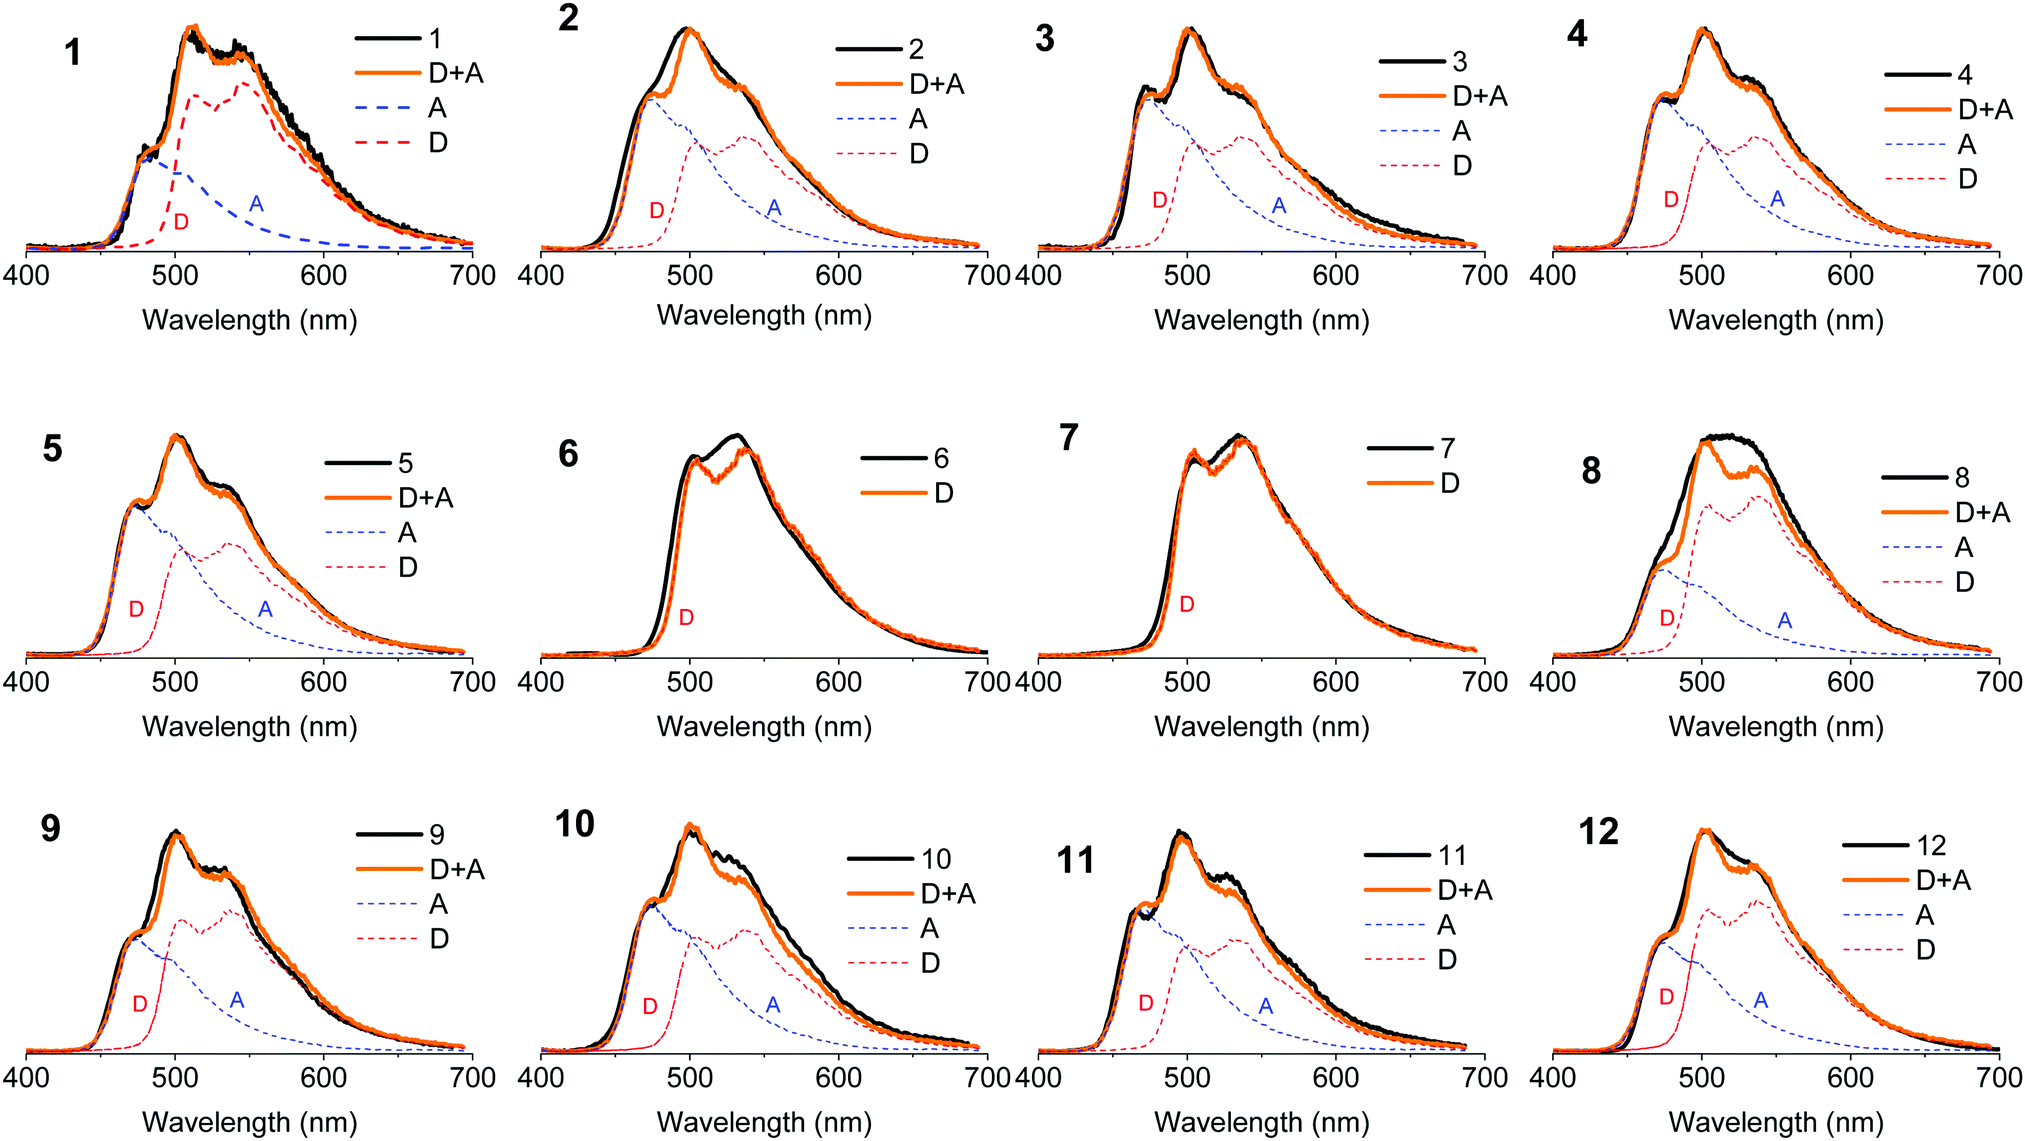 | ||
| Fig. 10 Phosphorescence in solid zeonex film, in vacuum, at 80 K for molecules 1–12. The phosphorescence of the single D phenothiazine and A dibenzothiophene-S,S-dioxide fragments have been used to fit the phosphorescence of each compound. | ||
Previous research shows that the triplet energy of the phenothiazine unit does not change with alkyl substitution.36 This is also confirmed here, by comparing molecules 1–5. The phosphorescence from the phenothiazine changes only in intensity and not in energy. Comparing molecules 1 and 8 it is concluded that the triplet energy of the acceptor fragment does not change as a response to simple substitution; in both 1 and 8 the phosphorescence of the acceptor is observed at the same energy. Therefore, the phosphorescence spectra of the unsubstituted phenothiazine and dibenzothiophene-S,S-dioxide were used to fit the phosphorescence of all the molecules in Fig. 10. Interestingly, the acceptor phosphorescence disappears entirely in 6 and 7. This leads to the conclusion that the change in the contributions of the 3D and 3A to overall phosphorescence is not purely due to the substitution, and that conformation is a key factor in explaining why the high energy triplets localised in the acceptor unit do not relax to the low energy triplet localised on the donor unit. In molecules 6 and 7 only the equatorial form is present and only the phosphorescence of the low energy triplet localised in the donor unit is observed. In the remaining molecules both equatorial and axial (or only axial) forms may exist independently, therefore, two different phosphorescence emissions are observed. The observed phosphorescence originates from the donor and acceptor units at low and high energies, respectively. This is consistent with the calculations and the high and low energy triplets are assigned to the axial and equatorial forms, respectively. In some cases the calculations predict the formation of the equatorial form at inaccessible energies. This is in apparent disagreement with our interpretation as no 3D phosphorescence should be observed for these molecules, assuming that no triplet interconversion from 3A to 3D triplet exists in the axial form. However, calculations are more suitable to describe the behaviour in gas and solution phases, while our experimental data is obtained in solid zeonex films, which may explain these differences. Also a potential triplet interconversion rate between 3A and 3D may be sufficiently slow to allow direct phosphorescence from the 3A triplet to occur simultaneously with 3D phosphorescence.
The influence of substituent groups on the 1CT energy
Fig. 11 shows the variation of the 1CT energy determined in toluene (a) and in zeonex (b) at RT, for all molecules used in this study. The 1CT energy was determined from the onset of the emission spectra using time dependent emission data. This is to determine the energy of the most relaxed charge transfer state without being affected by the emission of the short lived 1LE state. In general, the 1CT energy is more stabilised in toluene than in zeonex, as expected. Four different groups can be identified in Fig. 11. In the first group (blue line-squares) molecules 1–4, show a clear progression of the 1CT energy to higher energies with increasing bulkiness of the substituent. This is observed in both toluene and zeonex. The unsubstituted molecule 1 shows the most stabilised 1CT energy in toluene (2.43 eV) and zeonex (2.63 eV). Molecules 2 and 5 can be directly compared, as they are both substituted with methyl groups at the same positions of the donor. Each donor in 2 is substituted with one methyl group and in 5 with two methyl groups. The effect in 5 is expected to be more pronounced due to stronger steric hindrance in 5. As expected the 1CT energy is shifted further to high energies in 5, when compared to 2. Molecules 2–4 are weak TADF emitters, both in toluene and zeonex, and the data appear to be independent of ΔEST. In zeonex the ΔEST is larger than 0.1 eV, weak TADF is thus expected. However, in toluene, molecules 2 and 4 in particular, have the 1CT state almost isoenergetic with the triplets, 3D and 3A, respectively. Despite this fact no strong TADF is observed in these molecules.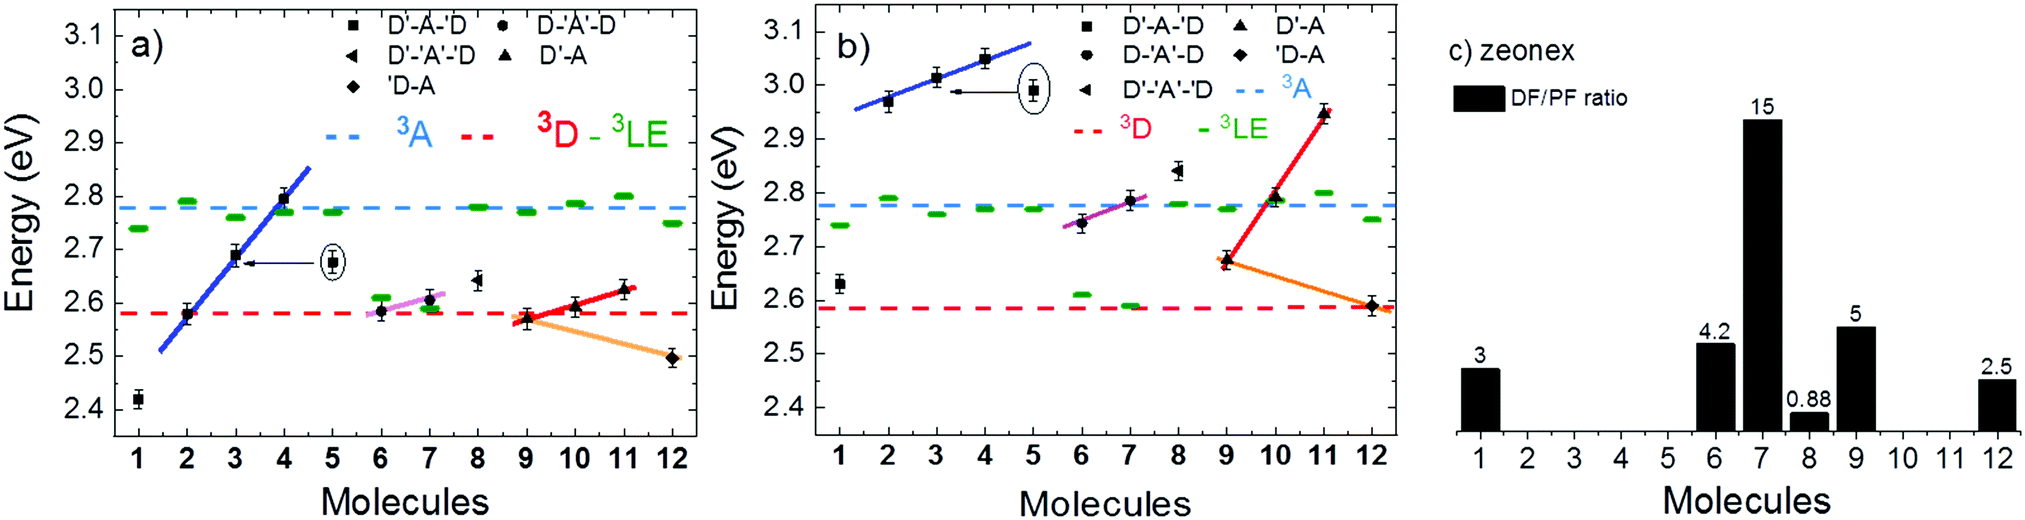 | ||
| Fig. 11 Energy of the singlet charge transfer state (1CT) collected in (a) toluene and (b) zeonex at room temperature. The blue and red dashed lines represent the energy of the triplet of the acceptor and donor fragments, 3A and 3D, respectively. The short dark green mark represents the energy of the triplet state of each molecule, measured from the onset of the phosphorescence. The DF/PF ratio measured in zeonex by comparing steady-state fluorescence integrals in degassed and aerated solutions is represented in (c). | ||
The second group (pink line, circles) are molecules 6–8. The 1CT emission shifts to higher energies with increasing bulkiness of the substituent. However, the variation is much less pronounced compared with donor substituted molecules, showing that the effect of the acceptor substitution on the 1CT energy is smaller than with donor substitution. This observation is consistent with the CV data, and strongly suggests that the substituents on the A unit could be sterically interacting with the donor imposing a strong restriction to the rotation around the D–A axis. The restricted movement prevents the formation of the axial conformer due a high energy barrier. Molecule 8 shows the 1CT energy shifting to slightly higher energies, when compared with 7. This is due to some contribution of axial conformers to the emission because of the methyl group, as shown in the calculations (Table S2.1, ESI†). Molecules 6 and 7 both have large DF/PF ratios showing strong TADF contributions in toluene and zeonex.
In the third group, (red line, triangles), molecules 9–11, a similar trend to the molecules in group one is observed. The variation in emission is less pronounced than in group one due to D–A substitution. Molecule 10, which directly compares with 2, shows no TADF in zeonex even though the ΔEST gap is less than 0.01 eV, confirming that additional parameters affect the TADF efficiency.
Control molecule 12 shows 1CT energy directly comparable with the unsubstituted molecule 9. In this case, the 1CT energy is slightly more stabilised than in the unsubstituted molecule. This effect is however dominated by electronic factors as demonstrated in the CV data. The HOMO–LUMO energy difference in 9 and 12 is 2.47 eV and 2.44 eV, respectively.
Interestingly, in 7 the ΔEST increases from 0.01 eV in toluene to 0.19 eV in zeonex. The RISC rate is thus slower in zeonex than in toluene, given its exponential dependence with ΔEST. A slower RISC rate is consistent with the longer TADF lifetime observed in zeonex, as seen in Fig. 12. However, the large DF/PF ratio shows that the RISC yield, ΦRISC, is close to unity in both solution and zeonex film (according with eqn (2)). This indicates that the RISC rate is significantly faster than any other process leading to luminescence quenching in 7.
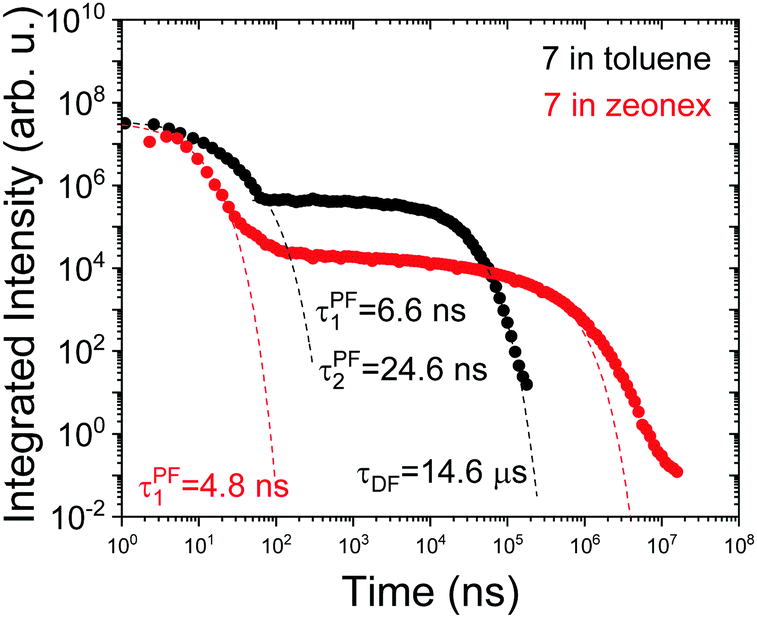 | ||
| Fig. 12 Time-dependent fluorescence decays for molecule 7 in toluene degassed solution and zeonex film in vacuum, at room temperature. | ||
Finally, PLQY measurements were performed in zeonex for the twelve molecules studied here. The results are shown in Table 1, giving clear indication for pronounced decreases in the luminescence efficiency of molecules that are exclusively in the axial conformation. This is especially evident for molecules 2–5. In contrast, molecules that are exclusively in the equatorial form 6–7, or that can adopt mixed conformations 1, 8, 9 and 12, show consistently higher PLQY values.
| Compound | PLQY | Compound | PLQY |
|---|---|---|---|
| 1 | 0.32 | 7 | 0.38 |
| 2 | 0.07 | 8 | 0.20 |
| 3 | 0.08 | 9 | 0.42 |
| 4 | 0.09 | 10 | 0.13 |
| 5 | 0.07 | 11 | 0.11 |
| 6 | 0.32 | 12 | 0.21 |
Conclusions
In summary, the reason that different substitution leads to different conformers is due to the steric repulsion of the alkyl substituent with the neighbouring arene rings. With alkyl substitution on the donor, if the system was to remain in the equatorial conformation with perpendicular donor and acceptor, there would be a large steric interaction between the donor alkyl group and the acceptor aryl rings. The molecules with 1-alkyl substitution exclusively on the donor (compounds 2–4, 10 and 11) can reduce this steric repulsion by placing the phenothiazine in the axial conformation. The axial phenothiazine donor tilts from the plane of the acceptor, and this therefore tilts the alkyl substituent away from the acceptor, because this substituent is on the donor (as revealed in the X-ray data in ref. 32). This is the reason why the axial conformation is preferred for the donor-substituted compounds, as the steric interactions are minimised in this conformation.In contrast, when only the acceptor is alkyl substituted (compounds 6 and 7), similar ‘tilting’ of the phenothiazine unit as previously described does not move the alkyl substituent with respect to it, as the alkyl group is on the acceptor, not on the phenothiazine donor. The phenothiazine in this case is forced equatorial and perpendicular with respect to the acceptor because the phenothiazine cannot rotate to an axial co-planar orientation (see Fig. 2b). In this case the acceptor substituent is in close proximity to the entire phenothiazine donor and therefore remains perpendicular to negate this large steric penalty (see steric presence of iPr substituent in Fig. 2b). By remaining perpendicular and equatorial this large penalty is therefore minimised. The equatorial conformation is therefore preferred for compounds 6 and 7. Compound 8 is a special case as it is substituted on both D and A units. Therefore, there is significant steric repulsion in both the axial or equatorial conformations of 8, and a mixture of conformations is predicted (Table S2.1, ESI†).
The introduction of bulky substituents on the phenothiazine D unit induces the formation of the axial conformer and shifts the singlet 1CT state to higher energies with increasing bulkiness of the substituent. The excited state relaxation of the phenothiazine donor and rotation around the D–A axis are also increasingly restricted. In the sterically hindered cases TADF is strongly suppressed, even if ΔEST is small. With acceptor unit substitutions, D and A are essentially locked in a relative near-orthogonal geometry, and the D adopts the equatorial conformation. Significant destabilization of the 1CT state is no longer observed in these cases, and strong TADF is observed in both solution and solid film. The two distinct molecular geometries have, therefore, profound influence on TADF efficiency and emphasise the importance of conformational features in the design of new TADF emitters.
Experimental section
Experimental details for all relevant compounds are available in the ESI,† with details of general procedures and equipment; synthesis and characterisation of molecules, additional photophysical, electrochemical, computational and crystallographic data; CCDC 1884007–1884011.†Conflicts of interest
There are no conflicts of interest to declare.Acknowledgements
R. S. N. thanks the financial support from CAPES Foundation, Ministry of Education-Brazil (Grant No. BEX9474-13-7). Z. R. thanks the China Scholarship Council for funding a visit to Durham University. P. D. kindly acknowledges the support received from the First Team program of the Foundation for Polish Science co-financed by the European Union under the European Regional Development Fund, project no. First TEAM 2017-4/32. F. B. D. and P. D. acknowledge supporting actions by the EU's Horizon 2020 OCTA project under grant agreement no. 778158. F. B. D. thanks also EPSRC for funding Grant EP/L02621X/1. J. S. W. and M. R. B. thank EU Horizon 2020 Grant Agreement No. 732103 (HyperOLED) for funding. T. J. P. thanks the EPSRC for funding Grants EP/N028511/1, EP/R021503/1 and EP/P012388/1. The Diamond Light Source is thanked for the award of instrument time on Station I19 (MT 11145), and the instrument scientists are thanked for their kind support.References
- S. Reineke, N. Seidler, S. R. Yost, F. Prins, W. A. Tisdale and M. A. Baldo, Appl. Phys. Lett., 2013, 103, 093302 CrossRef.
- H. Kraus, S. Bange, F. Frunder, U. Scherf, C. Boehme and J. M. Lupton, Phys. Rev. B, 2017, 95, 241201 CrossRef.
- A. Köhler and H. Bässler, Mater. Sci. Eng., R, 2009, 66, 71–109 CrossRef.
- J. H. Burroughes, D. D. C. Bradley, A. R. Brown, R. N. Marks, K. Mackay, R. H. Friend, P. L. Burn and A. B. Holmes, Nature, 1990, 347, 539–541 CrossRef CAS.
- C. W. Tang and S. A. VanSlyke, Appl. Phys. Lett., 1987, 51, 913–915 CrossRef CAS.
- S. R. Forrest, M. A. Baldo, D. F. O’Brien, Y. You, A. Shoustikov, S. Sibley and M. E. Thompson, Nature, 1998, 395, 151–154 CrossRef.
- C. Adachi, M. A. Baldo, M. E. Thompson and S. R. Forrest, J. Appl. Phys., 2001, 90, 5048–5051 CrossRef CAS.
- X. Yang, G. Zhou and W. Y. Wong, Chem. Soc. Rev., 2015, 44, 8484–8575 RSC.
- E. Zysman-Colman, Iridium(III) in Optoelectronic and Photonics Applications, John Wiley & Sons, 2017 Search PubMed.
- V. Sivasubramaniam, F. Brodkorb, S. Hanning, H. P. Loebl, V. van Elsbergen, H. Boerner, U. Scherf and M. Kreyenschmidt, J. Fluorine Chem., 2009, 130, 640–649 CrossRef CAS.
- S. Schmidbauer, A. Hohenleutner and B. Konig, Adv. Mater., 2013, 25, 2114–2129 CrossRef CAS PubMed.
- H. Uoyama, K. Goushi, K. Shizu, H. Nomura and C. Adachi, Nature, 2012, 492, 234–238 CrossRef CAS PubMed.
- F. B. Dias, K. N. Bourdakos, V. Jankus, K. C. Moss, K. T. Kamtekar, V. Bhalla, J. Santos, M. R. Bryce and A. P. Monkman, Adv. Mater., 2013, 25, 3707–3714 CrossRef CAS PubMed.
- P. L. dos Santos, J. S. Ward, M. R. Bryce and A. P. Monkman, J. Phys. Chem. Lett., 2016, 7, 3341–3346 CrossRef CAS PubMed.
- F. B. Dias, T. J. Penfold and A. P. Monkman, Methods Appl. Fluoresc., 2017, 5, 012001 CrossRef PubMed.
- P. L. dos Santos, J. S. Ward, D. G. Congrave, A. S. Batsanov, J. Eng, J. E. Stacey, T. J. Penfold, A. P. Monkman and M. R. Bryce, Adv. Sci., 2018, 5, 1700989 CrossRef PubMed.
- K. J. Kim, G. H. Kim, R. Lampande, D. H. Ahn, J. B. Im, J. S. Moon, J. K. Lee, J. Y. Lee, J. Y. Lee and J. H. Kwon, J. Mater. Chem. C, 2018, 6, 1343–1348 RSC.
- T. L. Wu, M. J. Huang, C. C. Lin, P. Y. Huang, T. Y. Chou, R. W. Chen-Cheng, H. W. Lin, R. S. Liu and C. H. Cheng, Nat. Photonics, 2018, 12, 235–240 CrossRef CAS.
- Y. Tao, K. Yuan, T. Chen, P. Xu, H. Li, R. Chen, C. Zheng, L. Zhang and W. Huang, Adv. Mater., 2014, 26, 7931–7958 CrossRef CAS PubMed.
- A. S. D. Sandanayaka, K. Yoshida, T. Matsushima and C. Adachi, J. Phys. Chem. C, 2015, 119, 7631–7636 CrossRef CAS.
- A. S. D. Sandanayaka, T. Matsushima and C. Adachi, J. Phys. Chem. C, 2015, 119, 23845–23851 CrossRef CAS.
- Q. Zhang, H. Kuwabara, W. J. Potscavage, S. Huang, Y. Hatae, T. Shibata and C. Adachi, J. Am. Chem. Soc., 2014, 136, 18070–18081 CrossRef CAS PubMed.
- M. Y. Wong and E. Zysman-Colman, Adv. Mater., 2017, 29, 1605444 CrossRef PubMed.
- Y. Liu, C. Li, Z. Ren, S. Yan and M. R. Bryce, Nat. Rev. Mater., 2018, 3, 18020 CrossRef CAS.
- M. K. Etherington, F. Franchello, J. Gibson, T. Northey, J. Santos, J. S. Ward, H. F. Higginbotham, P. Data, A. Kurowska, P. L. Dos Santos, D. R. Graves, A. S. Batsanov, F. B. Dias, M. R. Bryce, T. J. Penfold and A. P. Monkman, Nat. Commun., 2017, 8, 14987 CrossRef PubMed.
- F. B. Dias, J. Santos, D. R. Graves, P. Data, R. S. Nobuyasu, M. A. Fox, A. S. Batsanov, T. Palmeira, M. N. Berberan-Santos, M. R. Bryce and A. P. Monkman, Adv. Sci., 2016, 3, 1600080 CrossRef PubMed.
- T. Northey, J. Stacey and T. J. Penfold, J. Mater. Chem. C, 2017, 5, 11001–11009 RSC.
- T. J. Penfold, E. Gindensperger, C. Daniel and C. M. Marian, Chem. Rev., 2018, 118, 6975–7025 CrossRef CAS PubMed.
- T. J. Penfold, F. B. Dias and A. P. Monkman, Chem. Commun., 2018, 54, 3926–3935 RSC.
- J. Gibson, A. P. Monkman and T. J. Penfold, ChemPhysChem, 2016, 17, 2956–2961 CrossRef CAS PubMed.
- J. Gibson and T. J. Penfold, Phys. Chem. Chem. Phys., 2017, 19, 8428–8434 RSC.
- J. S. Ward, R. S. Nobuyasu, A. S. Batsanov, P. Data, A. P. Monkman, F. B. Dias and M. R. Bryce, Chem. Commun., 2016, 52, 2612–2615 RSC.
- R. S. Nobuyasu, Z. Ren, G. C. Griffiths, A. S. Batsanov, P. Data, S. Yan, A. P. Monkman, M. R. Bryce and F. B. Dias, Adv. Opt. Mater., 2016, 4, 597–607 CrossRef CAS.
- A. Stockmann, J. Kurzawa, N. Fritz, N. Acar, S. Schneider, J. Daub, R. Engl and T. Clark, J. Phys. Chem. A, 2002, 106, 7958–7970 CrossRef CAS.
- J. S. Ward, R. S. Nobuyasu, M. A. Fox, A. S. Batsanov, J. Santos, F. B. Dias and M. R. Bryce, J. Org. Chem., 2018, 83, 14431–14442 CrossRef CAS PubMed.
- R. Huang, J. S. Ward, N. A. Kukhta, J. Avó, J. Gibson, T. Penfold, J. C. Lima, A. S. Batsanov, M. N. Berberan-Santos, M. R. Bryce and F. B. Dias, J. Mater. Chem. C, 2018, 6, 9238–9247 RSC.
Footnotes |
| † Electronic supplementary information (ESI) available. CCDC 1884007–1884011. For ESI and crystallographic data in CIF or other electronic format see DOI: 10.1039/c9tc00720b |
| ‡ These authors contributed equally to this work. |
| This journal is © The Royal Society of Chemistry 2019 |