
 Open Access Article
 This Open Access Article is licensed under a Creative Commons Attribution-Non Commercial 3.0 Unported Licence
Predicting the capacitance of carbon-based electric double layer capacitors by machine learning†
Haiping
Su‡
 a,
Sen
Lin‡
b,
Shengwei
Deng
c,
Cheng
Lian
*a,
Yazhuo
Shang
a and
Honglai
Liu
*a
a,
Sen
Lin‡
b,
Shengwei
Deng
c,
Cheng
Lian
*a,
Yazhuo
Shang
a and
Honglai
Liu
*a
aState Key Laboratory of Chemical Engineering, Shanghai Engineering Research Center of Hierarchical Nanomaterials, School of Chemistry and Molecular Engineering, East China University of Science and Technology, Shanghai 200237, PR China. E-mail: hlliu@ecust.edu.cn; liancheng@ecust.edu.cn
bNational Engineering Research Center for Integrated Utilization of Salt Lake Resources, East China University of Science and Technology, Shanghai 200237, China
cCollege of Chemical Engineering, Zhejiang University of Technology, Hangzhou 310014, China
First published on 25th April 2019
Abstract
Machine learning (ML) methods were applied to predict the capacitance of carbon-based supercapacitors. Hundreds of published experimental datasets are collected for training ML models to identify the relative importance of seven electrode features. This present method could be used to predict and screen better carbon electrode materials.
Supercapacitors, also known as electric double layer capacitors (EDLCs), have remarkable advantages like fast charging kinetics, high power densities, and long cycling lifespans.1–3 EDLCs store electrical energy by physical adsorption of ions onto the surfaces of porous electrodes, and the capacitance of supercapacitors strongly rely on the non-redox ionic behavior inside the microspores of porous electrodes.4–9 The energy density per surface area of an EDLC device is proportional to its capacity and to the square of its operating potential window (PW), E = CV2/2, where C is the capacitance per surface area and V is the maximum operating PW.10,11 Accordingly, the energy density of an EDLC can be enhanced by maximizing the capacitance of the electric double layer (EDL) and expanding the PW through various methods. Currently, the most prominently employed electrode materials are porous carbons, and the properties of carbon materials greatly affect the performance of EDLCs. A better understanding of the effects of each carbon variable and their synergistic action is essential for the rational design of novel electrode materials with improved energy and power densities.
Carbon-based materials, including activated carbon, carbon nanotubes, templated carbons, carbon aerogels, and graphene, are widely used as electrodes because of their desirable physical and chemical properties.12 These properties include easy processability, low density, non-toxicity, high chemical stability and conductivity, large specific surface area, and relatively low cost. During the past few decades, many experimental efforts have been devoted to the practical applications of EDLC devices by utilizing a wide variety of carbon-based electrodes with diverse pore size distributions,13–17 morphologies,18 architectures19,20 and surface chemistries.21–23 Meanwhile, test conditions have been optimized to improve the performance of supercapacitors. However, the effects of the pore structures, surface properties, and testing conditions on the EDLC performance remain poorly understood. Traditional EDL theory and models only give a mathematical equation for EDLs on a flat surface. It is hard to capture the pore network effects on the capacitive performances. Molecular simulation tools are good for studying and screening porous electrodes, but there is a big challenge to obtain the relations between the microscopic structures and the macroscopic performances because molecular simulation is very time-consuming. There are no general rules to guide the synthesis of porous carbon electrodes, and it is urgent but necessary to find the quantitative structure–activity relationship for predicting the capacitance of carbon-based supercapacitors.
In this work, machine learning (ML) is introduced to study and predict the capacitance of carbon-based supercapacitors. ML is a data-based method, which has been treated as an alternative tool to solve many practical problems. Recently, several chemical engineering issues have been studied by ML methods efficiently,24,25 which inspired us to investigate the influences of carbon variables on the EDL capacitance thorough a ML method. As a kind of ML method, an artificial neural network (ANN) has been applied to predict the capacitance of carbon-based supercapacitors. Zhu et al. studied the impact of five variables (specific surface area, calculated pore size, ID/IG ratio, N-doping level and voltage window) by the ANN method.26 The authors compared the ANN method with two different machine learning models (linear regression and Lasso), demonstrating that the ANN method is more accurate with a higher correlation coefficient (R2 = 0.91). However, the ANN method can't explain the impact of each feature separately. Deep learning networks rely on layers of artificial neural networks, which are often treated as a black box, and the outputs are unexplainable. On the other hand, machine learning algorithms are built to learn to do things by understanding labeled data, which could generate easy rules, making the outputs more explainable.27
To predict the EDL capacitance, a sequential procedure is used, as shown in Fig. 1. The first step is to collect the experimental data. Then, the experimental data are applied to assess the performance of different ML models to predict the EDL capacitance. Herein, 121 sets of carbon-based supercapacitors with seven variables reported (potential window, specific surface area, pore volume, pore size, ratio of ID/IG, N-doping percentage, and O-doping percentage) were obtained for ML models from different papers (part of the data source was from ref. 26). All of these data are available in the ESI.†
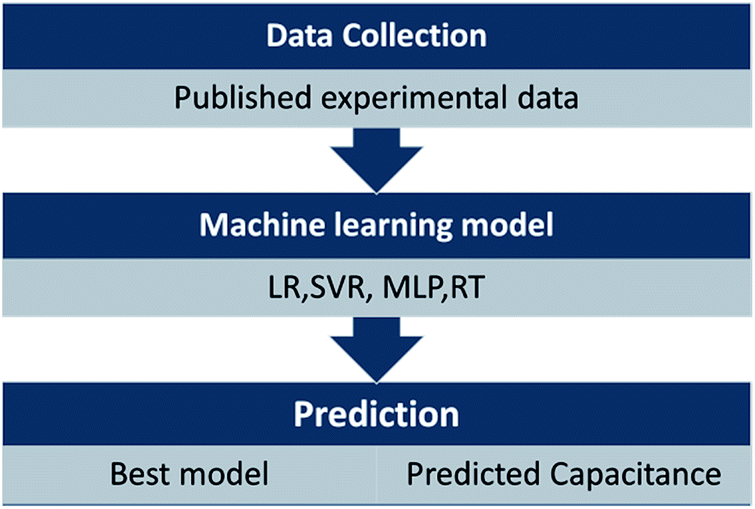 | ||
| Fig. 1 Illustration of the sequential approach used for predicting EDL capacitance by using machine learning models. | ||
Fig. 2 shows the EDL capacitance in relation to different variables. Six features including the physical and chemical properties of porous carbon electrode materials and the test potential windows are summarized in Table 1. The minimum, maximum, mean and standard deviation (SD) number of these data are also presented in the table. For better comparison, the highest capacitances reported in the papers were selected, which were tested at a low current density (≤1 A g−1). The capacitance from different papers are shown in Fig. 2(a), and the capacities range from tens to several hundreds of F g−1. It is notable from the conventional energy density equation E = CV2/2 that the testing potential windows have significant influence on the performance of supercapacitors, while the potential windows are mainly determined by the electrolyte types. Therefore, we mainly focused on the EDL capacitances tested in aqueous electrolytes, and the PW was around 1 V. Fig. 2(b) shows the relationship between the capacitance and potential window. According to the Helmholtz model (the capacitance C = Aεrε0/d, where A is the specific surface area, ε0 is the vacuum dielectric constant and εr is the dielectric constant of the electrolyte), the capacitance of EDLCs should be linear to the specific surface area. However, no linear relationship is found in Fig. 2(c). Fig. 2(d) and (e) show the relationship between the capacitance, pore volume and average pore size. The porous structures (pore volume and pore size) could be optimized to enhance the capacitive performance, while the relationships in Fig. 2(d) and (e) are not enough to determine the influence of pore volume and pore size on the capacitance. The intensity ratio of the D-band and G-band (ID/IG) from Raman spectroscopy can present the defect condition and the crystallization degree of carbon materials. Fig. 2(f) displays how the crystallinity of carbon materials affects the capacitance. Apart from optimizing the microstructures, heteroatom doping is a useful strategy to boost the capacitance. The influences of nitrogen and oxygen doping on the capacitance are shown in Fig. 2(g) and (h).
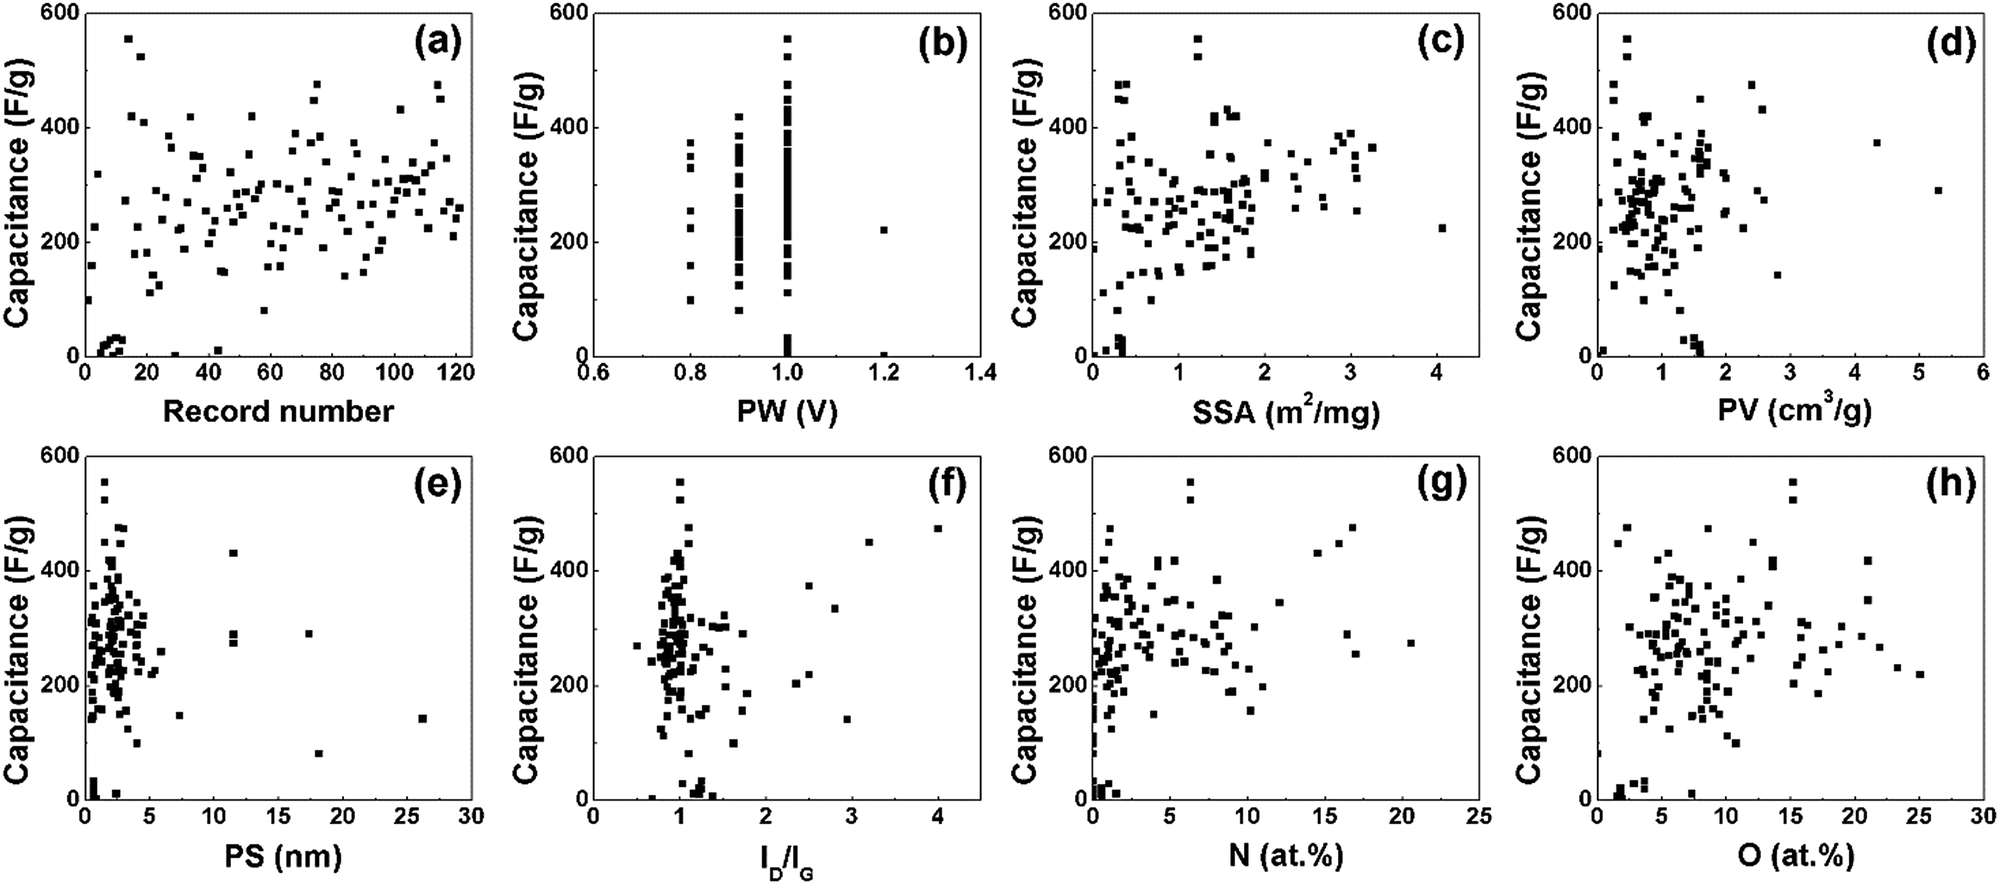 | ||
| Fig. 2 Input data with different variables, 121 sets of capacitances for different carbon-based electrodes (a). The relationship between the capacitance and potential window (b), specific surface area (c), pore volume (d), pore size (e), ratio of ID/IG (f), N-doping percentage (g), and O-doping percentage (h). | ||
| Minimum | Maximum | Mean | SD | |
|---|---|---|---|---|
| a 121 sets of capacitances for different carbon-based electrodes. PW: potential window (V); SSA: specific surface area (m2 mg−1); PV: pore volume (cm3 g−1); PS: pore size (nm); ID/IG: the ratio of ID/IG; N%: N-doping percentage (at%); and O%: O-doping percentage (at%). | ||||
| PW | 0.8 | 1.2 | 0.971 | 0.064 |
| SSA | 0.001 | 4.07 | 1.272 | 0.858 |
| PV | 0.002 | 5.3 | 1.110 | 0.763 |
| PS | 0.48 | 35.34 | 3.169 | 4.578 |
| I D/IG | 0.5 | 4 | 1.13 | 0.508 |
| N% | 0 | 20.55 | 3.756 | 4.33 |
| O% | 0 | 25.07 | 8.589 | 5.216 |
With selected data and variables, four different ML methods were used (linear regression, support vector regression, multilayer perceptron and regression tree models). Linear regression (LR) has predictors that are linear in the model parameters, which is easy to interpret, and fast in making predictions. However, the highly constrained form of LR models means that they often have low predictive accuracy. Support vector regression (SVR) is a regression technique with excellent performances in regression and time series prediction application, allowing categorising the input data using separating lines or planes. Multilayer perceptron (MLP) is a widely used artificial neural network model, which generally includes an input layer, hidden layers and an output layer, and each layer consists of nodes connected with a certain weight to all nodes in the next layer. Except for the input nodes, each node is a processing element with a nonlinear activation function such as a sigmoid function that enables the network to compute complex nonlinear problems. Regression trees (RT) are a way to split the input space into areas (sub-spaces) and build in each of them a local specialized linear regression model, and a RT is easy to interpret, fast for fitting and prediction, and low on memory usage. More details for these four machine learning models could be found in our previous work.25
The algorithms of the four ML models were conducted in the machine learning open source package WEKA. Each method has its own parameters that need to be specified, and parameters for the SVR and MLP were obtained by using the CVParameterSelection module in WEKA. The learning rate and the number of nodes in the hidden layer for MLP are 0.2 and 20, and the complexity parameter in SVR is optimized to be 200. For RT and LR, WEKA could generate parameters itself. A 10-fold cross-validation methodology was used to generate a statistical result which is independent of the data set. Specifically, the datasets were evenly split into 10 folds. The instances from 9 folds were used for training while the remaining fold was used for testing. The calculation process was repeated 10 times using a different fold for testing in each cycle. The performance of each model was given by the average of the accuracies of all the folds. The correlation coefficient (R), mean absolute error (MAE), and root mean square error (RMSE) were used to evaluate the accuracies of different ML models in predicting EDL capacitance.
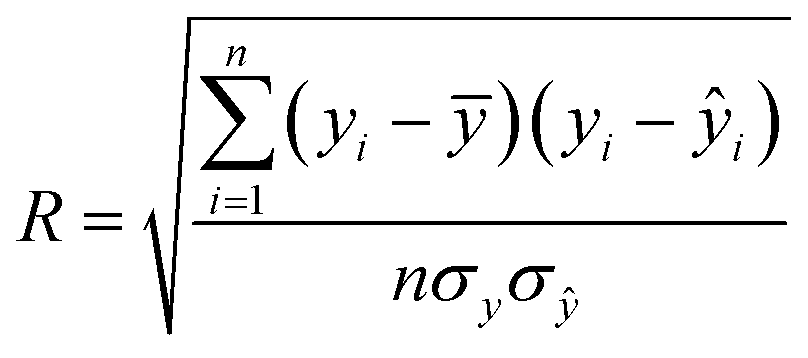 | (1) |
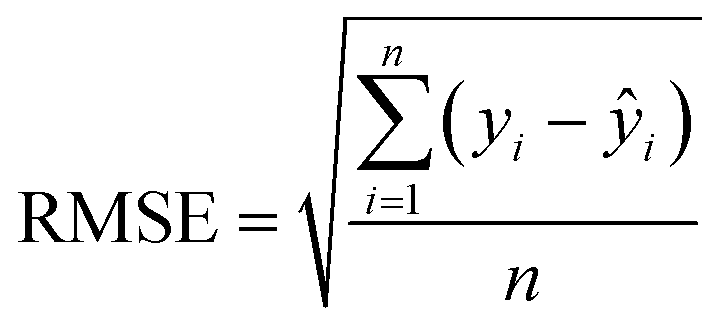 | (2) |
 | (3) |
The predicted EDL capacitance by the ML models is compared with input experimental capacitances, as shown in Fig. 3. The estimated R, MAE and RMSE were also listed in the figures, supporting an accurate prediction of this model. It is easy to find that both MLP and RT have better performance than SVR and LR, with larger R and smaller RMSE. Based on the RMSE, the overall performance of the algorithms for predicting carbon electrode effects on EDL capacitance can be ranked as follows: RT > MLP > SVR > LR.
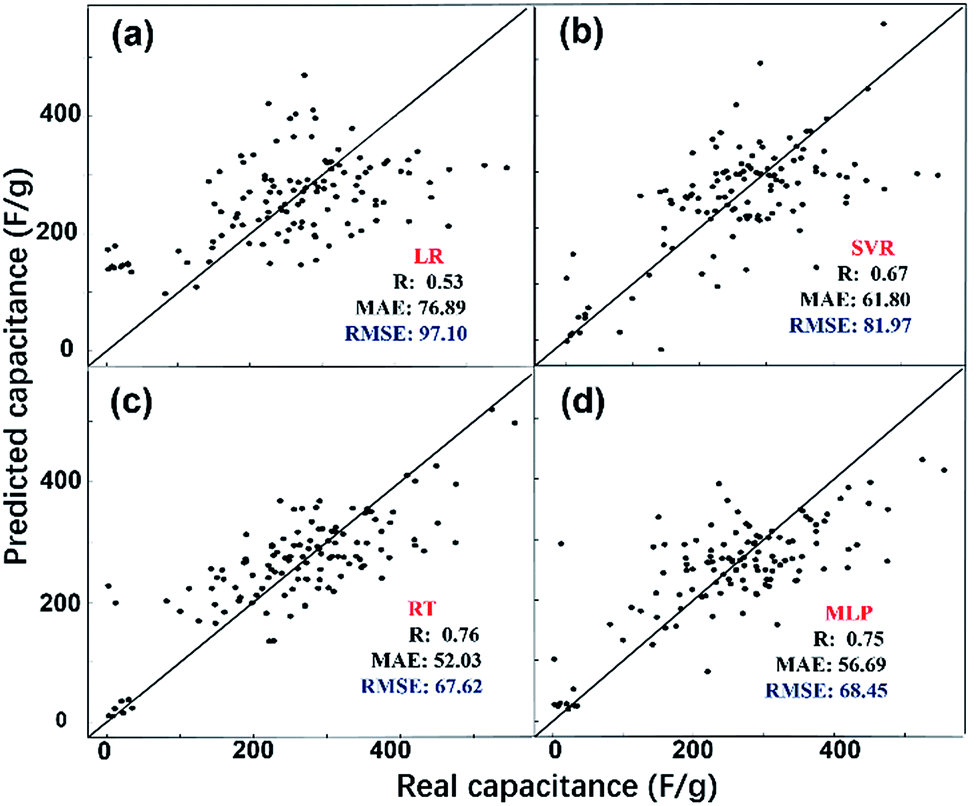 | ||
| Fig. 3 Statistical performance of each ML model by comparing the predicted capacitance from ML models (y-axis) and the real experimental capacitance (x-axis). (a) LR, (b) SVR, (c) RT, and (d) MLP. If the dot for a certain carbon electrode lies on the solid line, it means that the predicted capacitance and input (experimental) capacitance are the same. | ||
From the above discussion, the two better models were MLP and RT with a RMSE of 67.62 and 68.45, respectively. The RT model does not need to find the optimal parameters by trial and error, and it generates easier rules which we could understand easily:
[Rule 1]: If SSA > 0.405, then the capacitance = 241.8616 × PW + 43.5775 × SSA − 34.8074 × ID/IG + 6.0818 × N% + 2.8217 × O% − 34.3229.
[Rule 2]: Else the capacitance = 99.7593 × PW + 22.6152 × SSA + 74.6316 × ID/IG + 20.7572 × N% + 13.5279 × O% − 152.8567.
Based on the rules generated by RT, we find that 96 of the 121 sets of data meet Rule 1 and 25 sets of data meet Rule 2. The variables of the specific surface area, operating potential window, carbon crystallization degree and heteroatom doping are all shown in both of the rules, indicating that the EDL capacitance could easily be changed/enhanced by changing these parameters. Although the specific surface area seems to be the most important parameters to the EDL performance, the pore volume and pore size were not covered in the rules. Since the specific surface area, pore volume and pore size are always related to each other, a more specific study may be needed to verify the contributions. Anyway, this simple RT model still could be used for a quick material screening.
The MLP model only shows a little bit lower accuracy than the RT mode, but the relative contribution of different variables to the EDL capacitance could be obtained. As shown in Fig. 4, the weight of the seven variables is clearly described in a pie graph. The specific surface area (SSA) and the pore volume (PV) are the two most important variables, with a weight of 30.1% and 24.1%, respectively. The pore size (PS), potential window (PW) and ratio of ID/IG contribute with lower weights (11.4%, 11.2% and 9.9%, respectively). The N-doping percentage (N%) and O-doping percentage (O%) with a weight of 7.6% and 5.7% show the smallest contribution to the capacitive performances.
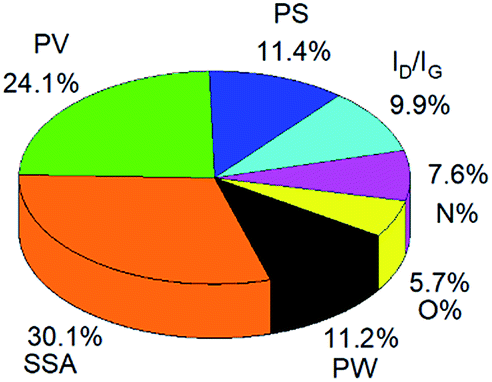 | ||
| Fig. 4 The relative contribution of seven variables to the predictive EDL capacitance of MLP. | ||
Conclusions
In summary, we investigate the influence of porous carbon materials and potential windows on the electric double layer (EDL) capacitance by using four machine learning (ML) models. Experimental data for different carbon-based supercapacitors are collected as the input of different ML models. The performance of the different ML models is ranked as follows: RT > MLP > SVR > LR. Among these models, the MLP model shows the best performance and could generate the relative contribution of all the variables to the EDL capacitance. We hope that this method could inspire further efforts toward application of machine learning in electrochemistry and chemical engineering.Conflicts of interest
There are no conflicts to declare.Acknowledgements
This work was sponsored by the National Natural Science Foundation of China (No. 91834301 and 21808055), the Shanghai Sailing Program (18YF1405400 and 19YF1411700).Notes and references
- P. Simon and Y. Gogotsi, Acc. Chem. Res., 2012, 46, 1094–1103 CrossRef PubMed.
- Q. Dou, L. Liu, B. Yang, J. Lang and X. Yan, Nat. Commun., 2017, 8, 2188 CrossRef PubMed.
- Z. Bo, C. Li, H. Yang, K. Ostrikov, J. Yan and K. Cen, Nano-Micro Lett., 2018, 10, 33 CrossRef PubMed.
- R. Burt, G. Birkett and X. Zhao, Phys. Chem. Chem. Phys., 2014, 16, 6519–6538 RSC.
- C. Zhong, Y. Deng, W. Hu, J. Qiao, L. Zhang and J. Zhang, Chem. Soc. Rev., 2015, 44, 7484–7539 RSC.
- Y. Shao, M. F. El-Kady, L. J. Wang, Q. Zhang, Y. Li, H. Wang, M. F. Mousavi and R. B. Kaner, Chem. Soc. Rev., 2015, 44, 3639–3665 RSC.
- M. V. Fedorov and A. A. Kornyshev, Chem. Rev., 2014, 114, 2978–3036 CrossRef CAS PubMed.
- E. Frackowiak, Q. Abbas and F. Béguin, J. Energy Chem., 2013, 22, 226–240 CrossRef CAS.
- K. Ma, C. Zhang, C. E. Woodward and X. Wang, Electrochim. Acta, 2018, 289, 29–38 CrossRef CAS.
- G. Feng, S. Li, W. Zhao and P. T. Cummings, AlChE J., 2015, 61, 3022–3028 CrossRef CAS.
- C. Lian, H. Liu, C. Li and J. Wu, AlChE J., 2019, 65, 804–810 CrossRef CAS.
- E. Frackowiak, Q. Abbas and F. Beguin, J. Energy Chem., 2013, 22, 226–240 CrossRef CAS.
- J. Chmiola, G. Yushin, Y. Gogotsi, C. Portet, P. Simon and P.-L. Taberna, Science, 2006, 313, 1760–1763 CrossRef CAS PubMed.
- C. Largeot, C. Portet, J. Chmiola, P.-L. Taberna, Y. Gogotsi and P. Simon, J. Am. Chem. Soc., 2008, 130, 2730–2731 CrossRef CAS PubMed.
- D.-e. Jiang, Z. Jin and J. Wu, Nano Lett., 2011, 11, 5373–5377 CrossRef CAS PubMed.
- G. Feng, S. Li, V. Presser and P. T. Cummings, J. Phys. Chem. Lett., 2013, 4, 3367–3376 CrossRef CAS.
- P. Wu, J. Huang, V. Meunier, B. G. Sumpter and R. Qiao, ACS Nano, 2011, 5, 9044–9051 CrossRef CAS PubMed.
- W. Yang, M. Ni, X. Ren, Y. Tian, N. Li, Y. Su and X. Zhang, Curr. Opin. Colloid Interface Sci., 2015, 20, 416–428 CrossRef CAS.
- D. Pech, M. Brunet, H. Durou, P. Huang, V. Mochalin, Y. Gogotsi, P.-L. Taberna and P. Simon, Nat. Nanotechnol., 2010, 5, 651–654 CrossRef CAS PubMed.
- J. K. McDonough, A. I. Frolov, V. Presser, J. Niu, C. H. Miller, T. Ubieto, M. V. Fedorov and Y. Gogotsi, Carbon, 2012, 50, 3298–3309 CrossRef CAS.
- X. Gao, A. Omosebi, J. Landon and K. Liu, Energy Environ. Sci., 2015, 8, 897–909 RSC.
- M. C. Hatzell, M. Raju, V. J. Watson, A. G. Stack, A. C. van Duin and B. E. Logan, Environ. Sci. Technol., 2014, 48, 14041–14048 CrossRef CAS PubMed.
- Y. J. Oh, J. J. Yoo, Y. I. Kim, J. K. Yoon, H. N. Yoon, J.-H. Kim and S. B. Park, Electrochim. Acta, 2014, 116, 118–128 CrossRef CAS.
- H. Sui, L. Li, X. Zhu, D. Chen and G. Wu, Chemosphere, 2016, 144, 1950–1959 CrossRef CAS PubMed.
- H. Su, C. Lian, J. Liu and H. Liu, Chem. Eng. Sci., 2019, 202, 186–193 CrossRef CAS.
- S. Zhu, J. Li, L. Ma, C. He, E. Liu, F. He, C. Shi and N. Zhao, Mater. Lett., 2018, 233, 294–297 CrossRef CAS.
- J. H. Lee, J. Shin and M. J. Realff, Comput. Chem. Eng., 2018, 114, 111–121 CrossRef CAS.
Footnotes |
| † Electronic supplementary information (ESI) available. See DOI: 10.1039/c9na00105k |
| ‡ These authors made equal contribution to this work. |
| This journal is © The Royal Society of Chemistry 2019 |