
 Open Access Article
 This Open Access Article is licensed under a Creative Commons Attribution-Non Commercial 3.0 Unported Licence
Copper chaperone ATOX1 is required for MAPK signaling and growth in BRAF mutation-positive melanoma†
Ye-Jin
Kim
 a,
Gavin J.
Bond
b,
Tiffany
Tsang
c,
Jessica M.
Posimo
a,
Luca
Busino
ad and
Donita C.
Brady
*ad
a,
Gavin J.
Bond
b,
Tiffany
Tsang
c,
Jessica M.
Posimo
a,
Luca
Busino
ad and
Donita C.
Brady
*ad
aDepartment of Cancer Biology, Perelman School of Medicine, University of Pennsylvania, Philadelphia, PA 19104, USA. E-mail: bradyd@pennmedicine.upenn.edu
bBiochemistry Major Program, Department of Chemistry, College of Arts and Sciences, University of Pennsylvania, Philadelphia, PA 19104, USA
cCell and Molecular Biology Graduate Group, Perelman School of Medicine, University of Pennsylvania, Philadelphia, PA 19104, USA
dAbramson Family Cancer Research Institute, Perelman School of Medicine, University of Pennsylvania, Philadelphia, PA 19104, USA
First published on 18th July 2019
Abstract
Copper (Cu) is a tightly regulated micronutrient that functions as a structural or catalytic cofactor for specific proteins essential for a diverse array of biological processes. While the study of the extremely rare genetic diseases, Menkes and Wilson, has highlighted the requirement for proper Cu acquisition and elimination in biological systems for cellular growth and proliferation, the importance of dedicated Cu transport systems, like the Cu chaperones ATOX1 and CCS, in the pathophysiology of cancer is not well defined. We found that ATOX1 was significantly overexpressed in human blood, breast, and skin cancer samples, while CCS was significantly altered in human brain, liver, ovarian, and prostate cancer when compared to normal tissue. Further analysis of genetic expression data in Cancer Cell Line Encyclopedia (CCLE) revealed that ATOX1 is highly expressed in melanoma cell lines over other cancer cell lines. We previously found that Cu is required for BRAFV600E-driven MAPK signaling and melanomagenesis. Here we show that genetic loss of ATOX1 decreased BRAFV600E-dependent growth and signaling in human melanoma cell lines. Pharmacological inhibition of ATOX1 with a small molecule, DCAC50, decreased the phosphorylation of ERK1/2 and reduced the growth of BRAF mutation-positive melanoma cell lines in a dose-dependent manner. Taken together, these results suggest that targeting the Cu chaperone ATOX1 as a novel therapeutic angle in BRAFV600E-driven melanomas.
Significance to metallomicsMaintaining Cu homeostasis is critical for the function of Cu-dependent enzymes that are required for normal physiology and development. While aberrant Cu accumulation is associated with cancer initiation and progression, the Cu homeostasis machinery that contributes to cell intrinsic and extrinsic mechanisms necessary for tumorigenesis remains largely undefined. We present here an analysis of Cu chaperone expression across human cancers that illuminated a novel dependence on ATOX1 for cancer cell growth in the context of BRAF mutation-positive melanoma. Our findings connect intracellular Cu transport via ATOX1 to oncogenic kinase signaling that could be leveraged as a novel therapeutic opportunity in melanoma. |
Introduction
While growth factors and nutrients are well-appreciated regulators of cell proliferation, the contribution of transition metals to pro-proliferative cellular processes is understudied. The transition metal Cu is an essential micronutrient for most living organisms by regulating a diverse array of biological processes, such as cellular respiration, free radical detoxification, pigmentation, kinase signal transduction, lipolysis, and neuropeptide processing.1–3 However, excess Cu accumulation is toxic in all organisms tested due, in large part, to free Cu ions reacting with hydrogen peroxide to form hydroxyl radicals.4 The importance of intact Cu homeostatic mechanisms to cell growth control is underscored by the various growth phenotypes associated with aberrant Cu excretion and absorption in Menkes and Wilson disease, respectively.1,4–9 Therefore, biological systems depend upon dedicated machinery for the proper acquisition, distribution, and elimination of Cu.10In mammals, the majority of Cu acquisition is achieved through the high affinity Cu1+ transport function of the transmembrane protein CTR1.11,12 Evolutionarily conserved Cu chaperones, ATOX1, CCS, and COX17, facilitate the efficient delivery of Cu to cuproenzymes located in the trans-Golgi network, cytosol, or mitochondria,13–19 while the large quantities of molecules like glutathione (GSH) and metallothionein limit cellular toxicity from free Cu ions.20 Specifically, the redox sensitive Cu chaperone ATOX1 delivers Cu to the P-type ATPases ATP7A or ATP7B, depending on the cell type, which facilitate the transport of Cu into the lumen of the trans-Golgi network where Cu loading of Cu-dependent enzymes, like tyrosinase, lysyl oxidase, and ceruloplasmin, occurs.21–23 Within the cytosol, CCS activates Cu,Zn-superoxide dismutase (SOD1) through direct insertion of the Cu cofactor required for catalyzing the disproportionation of superoxide to hydrogen peroxide and dioxygen.24,25 Finally, COX17 shuttles Cu within the inner membrane space of the mitochondria and utilizes two accessory proteins, COX11 and SCO1, to metallate the CuA and CuB sites of cytochrome c oxidase.13,26–28 While the physiological relevance of these Cu chaperones has been elucidated through the study of Menkes and Wilson disease, the contribution of dedicated Cu delivery systems in the context of additional pathophysiologies such as cancer, neurodegeneration, fatty liver disease, impaired wound healing, and cardiovascular disease remains to be explored.
Within the context of tumor initiation and tumor progression, some cancers may increase serum Cu levels several years prior to its diagnosis and enhanced mortality in cancer patients is associated with higher levels of Cu,29,30 but the biological significance of these observations is not well-established. Molecularly, the expression of the Cu chaperones ATOX1, CCS, and COX17 is elevated in non-small cell lung carcinoma (NSCLC) when compared to normal lung tissue.31 However, ATOX1 may play a more significant role in tumorigenesis and progression than other Cu chaperones.32 Specifically, functional studies revealed that genetic knockdown of ATOX1 reduced the Cu-stimulated growth of NSCLC cell lines.31 Further supporting a role for ATOX1 in tumorigenesis, it was recently demonstrated that ATOX is highly overexpressed in breast cancer patients at both the mRNA and protein level and is functionally required for breast cancer cell migration.33 In an effort to disrupt intracellular Cu transport to block cancer cell proliferation, Wang et al. developed a small molecular inhibitor, DCAC50, targeting the Cu chaperones ATOX1 and CCS.34 Treatment with DCAC50 selectively reduced cell viability by promoting redox stress and reducing ATP levels of both human breast and lung cancer cell lines.34 Together, these studies establish ATOX1 as an integral Cu chaperone necessary for various tumorigenic properties and support further investigation of the molecular mechanisms by which ATOX1 contributes to tumorigenesis.
In the present study, we assessed the expression of the Cu chaperones ATOX1 and CCS across multiple tumor subtypes and found that ATOX1 was significantly upregulated in both melanoma patient samples and cell lines and ATOX1 overexpression correlated with poor survival. Given that our previous work demonstrated that genetic ablation of CTR1 or treatment with Cu chelators reduced the growth BRAFV600E-driven melanoma by dampening MAPK pathway activation,35,36 we interrogated the importance of ATOX1 in BRAF mutation-positive melanoma. Here we demonstrate that targeting ATOX1 is a novel vulnerability in BRAF mutation-positive melanoma by influencing oncogene addicted kinase signaling.
Methods
Data mining
ATOX1 or CCS mRNA expression in tumor and normal tissue samples was obtained from the Gene Expression across Normal and Tumor tissue (GENT) web-based genome database GENT (Gene Expression across Normal and Tumors; http://medicalgenome.kribb.re.kr/GENT/reference.php, Korea Research Institute of Bioscience and Biotechnology). ATOX1 and CCS mRNA expression in 1036 cancer cell lines was obtained from the Cancer Cell Line Encyclopedia (CCLE) database (https://portals.broadinstitute.org/ccle at The Broad Institute). Cancer cell lines in which mRNA expression was greater than two standard deviations from the mean were defined as low or high expression. The Cancer Genome Atlas (TCGA) skin cutaneous melanoma dataset was queried from cBioPortal for ATOX1 mRNA expression and patient survival data was stratified into top or bottom five percent of ATOX1 mRNA expression.Cell culture
A375, HPAC, SW48, and WM88 cell lines were obtained from the American Type Culture Collection and Rockland Immunochemicals, respectively. HEK-HT cells were described previously.37 Parental cell lines were cultured in Dulbecco's Modified Eagle Media (DMEM, Gibco) supplemented with 10% v/v fetal bovine serum (FBS, GE Lifesciences) and 100 U mL−1 penicillin and streptomycin (P/S) antibiotics (Gibco). A375 and WM88 melanoma cells stably expressing pLenti-CRISPRV2puro constructs were maintained as above supplemented with 2 μg mL−1 puromycin (Invitrogen). A375 and WM88 melanoma cell lines were stably infected with lentiviruses derived from pLentiCRISPRV2 (see plasmids below) using established protocols.Plasmids
pLenti-CRISPRV2puro (Addgene plasmid #52961) was previously described. pLenti-CRISPRV2puro-Rosa26-sgRNA was created to express the mouse Rosa26 target sequence 5’-CCCGATCCCCTACCTAGCCG. pLentiCRISPRV2puro-ATOX1-sgRNA #2 was created to express the human ATOX1 target sequence 5′-TCAGAAGCACGAGTTCTCTG. pLentiCRISPRV2puro-ATOX1-sgRNA #4 was created to express the human ATOX1 target sequence 5′-TCAATGCAGACCTTCTTGTT.Colony formation assay
A375 and WM88 cells stably expressing pLenti-CRISPRV2puro constructs were seeded at 5.0 × 10³ cells per well in 6-well plates. After seven days cells were washed once with 1× phosphate buffered saline (PBS) and stained with 1 mL of crystal violet staining solution (0.5% w/v crystal violet in 25% v/v methanol) for 15 minutes. After 15 minutes all wells were washed in distilled water until background staining was minimal. Crystal violet stained colonies were imaged on the ChemiDoc Touch Imaging System (Bio-Rad) imager prior to dissolving in 10% acetic acid for 15 minutes and subsequent measurement of absorbance at 590 nm (Synergy, BioTek). For DCAC50 treatments, A375 (5.0 × 10³), HEK-HT (1.0 × 10³), HPAC (5.0 × 10³), SW48 (2.0 × 10⁴), and WM88 (5.0 × 10³) cells were seeded at the indicated densities per well in 6-well plates and treated 24 hours after with vehicle or a final concentration of 1, 2.5, 5, 10, or 25 μM DCAC50 (Sigma) for seven days. After 7 days, colonies were processed as above.Immunoblot analysis
A375 and WM88 parental cells or those stably expressing pLentiCRISPRv2 constructs were treated as indicated and washed with cold PBS and lysed with cold RIPA buffer containing 1× EDTA-free HaltTM protease and phosphatase inhibitor cocktail halt protease and phosphatase inhibitors (Thermo Scientific). Protein concentration was determined by BCA Protein Assay (Pierce) using BSA as a standard. Equal amount of lysates were resolved by SDS-PAGE using standard techniques, and protein was detected with the following primary antibodies: mouse anti-ATOX (1![[thin space (1/6-em)]](https://www.rsc.org/images/entities/char_2009.gif) :1000; WH0000475M1, Sigma Aldrich), mouse anti-β-ACTIN (1:10000; 3700, Cell Signaling), rabbit anti-phospho (Thr202/Tyr204)-ERK1/2 (1:1000; 9101, Cell Signaling), mouse anti-ERK1/2 (1:1000; 9107, Cell Signaling), rabbit anti-phospho (Ser217/221)-MEK1/2 (1:1000; 9154S, Cell Signaling), anti-mouse MEK1/2 (1:1000; 4694S, Cell Signaling), rabbit anti-phospho (Thr180/Tyr182)-p38 (1:1000; 9211S, Cell Signaling), rabbit anti-p38 (1:1000; 9212S, Cell Signaling), rabbit anti-phospho (Thr183/Tyr185)-JNK (1:1000; 9251S, Cell Signaling), rabbit anti-JNK (1:1000; 9252S, Cell Signaling), rabbit anti-LAMIN A/C (1:1000; 2032S, Cell Signaling), or mouse anti-α-TUBULIN (1:1000; 3873S, Cell Signaling) followed by detection with one of the horseradish peroxidase conjugated secondary antibodies: goat anti-rabbit IgG (1:2000; 7074, Cell Signaling) or goat anti-mouse (1:2000; 7076, Cell Signaling) using SignalFire (Cell Signaling) or SignalFire Elite ECL (Cell Signaling) detection reagents. The fold change in the ratio of phosphorylated protein to total protein was measured in Image Studio Lite (LI-COR Biosciences) software by boxing each band using the rectangular selection tool and calculating the signal of the band in pixels. The signal of the phosphorylated protein band in pixels was normalized to the signal of the total protein band in pixels. The average fold change is shown in figures. For nuclear and cytosolic fractionations, cells were plated in 10 cm dish (Genesee Scientific, 25-202), washed with cold 1× PBS, and nuclear and cytosolic fractions were separated using nuclear/cytosol fractionation kit (BioVision K266) according to manufacturer's protocols.
:1000; WH0000475M1, Sigma Aldrich), mouse anti-β-ACTIN (1:10000; 3700, Cell Signaling), rabbit anti-phospho (Thr202/Tyr204)-ERK1/2 (1:1000; 9101, Cell Signaling), mouse anti-ERK1/2 (1:1000; 9107, Cell Signaling), rabbit anti-phospho (Ser217/221)-MEK1/2 (1:1000; 9154S, Cell Signaling), anti-mouse MEK1/2 (1:1000; 4694S, Cell Signaling), rabbit anti-phospho (Thr180/Tyr182)-p38 (1:1000; 9211S, Cell Signaling), rabbit anti-p38 (1:1000; 9212S, Cell Signaling), rabbit anti-phospho (Thr183/Tyr185)-JNK (1:1000; 9251S, Cell Signaling), rabbit anti-JNK (1:1000; 9252S, Cell Signaling), rabbit anti-LAMIN A/C (1:1000; 2032S, Cell Signaling), or mouse anti-α-TUBULIN (1:1000; 3873S, Cell Signaling) followed by detection with one of the horseradish peroxidase conjugated secondary antibodies: goat anti-rabbit IgG (1:2000; 7074, Cell Signaling) or goat anti-mouse (1:2000; 7076, Cell Signaling) using SignalFire (Cell Signaling) or SignalFire Elite ECL (Cell Signaling) detection reagents. The fold change in the ratio of phosphorylated protein to total protein was measured in Image Studio Lite (LI-COR Biosciences) software by boxing each band using the rectangular selection tool and calculating the signal of the band in pixels. The signal of the phosphorylated protein band in pixels was normalized to the signal of the total protein band in pixels. The average fold change is shown in figures. For nuclear and cytosolic fractionations, cells were plated in 10 cm dish (Genesee Scientific, 25-202), washed with cold 1× PBS, and nuclear and cytosolic fractions were separated using nuclear/cytosol fractionation kit (BioVision K266) according to manufacturer's protocols.
Statistical analyses
Data are represented as the mean ± SEM. The sample size (n) indicates the experimental replicates or number of samples analyzed. For all experiments, each data point analyzed was from an independent biological sample. Statistical significance was typically determined using a one-way ANOVA followed by a Tukey's multi-comparisons test or Mantel–Cox test, in which significance was determined as P ≤ 0.05. All statistical analyses were performed using GraphPad Prism 7 software.Results
ATOX1 overexpression in melanoma correlates with poor survival
Although the varied expression of the human Cu proteome across cancer subtypes was recently defined,32 the characterization did not include all human cancers, such as melanoma. These gaps leave the involvement of the Cu transport system in various other cancers incompletely annotated and support a need for future investigation. To fill this gap, we examined the expression of Cu transport systems across multiple human cancer and normal tissues utilizing the Gene Expression across Normal and Tumor tissue (GENT) web-accessible database. We found that ATOX1 mRNA expression was significantly higher in blood, breast, and skin cancer when compared to the expression in their respective normal tissues (Fig. 1a). Conversely, CCS mRNA expression was significantly increased in brain and ovarian cancers and reduced in liver and prostate cancers when compared to their respective normal tissue samples (Fig. 1b). To substantiate these findings in human cancer cell lines, we surveyed ATOX1 and CCS transcript levels in the Cancer Cell Line Encyclopedia (CCLE) database, which provides detailed gene expression analysis for over 1000 cancer cell lines. Interestingly, ATOX1 mRNA levels were highest amongst melanoma cell lines when compared to all other cancer cell lines and tended to be several orders of magnitude higher than CCS mRNA levels (Fig. 1c). Since there was significant overexpression of ATOX1 in melanoma within both datasets, we utilized The Cancer Genome Atlas (TCGA) skin cutaneous melanoma patient data to query if altered ATOX1 mRNA expression correlated with survival outcome.38 Patient samples displaying elevated ATOX1 mRNA expression significantly correlated with a shorter median survival (Fig. 1d). These data suggest a genetic link between ATOX1 expression and the development or progression of melanoma.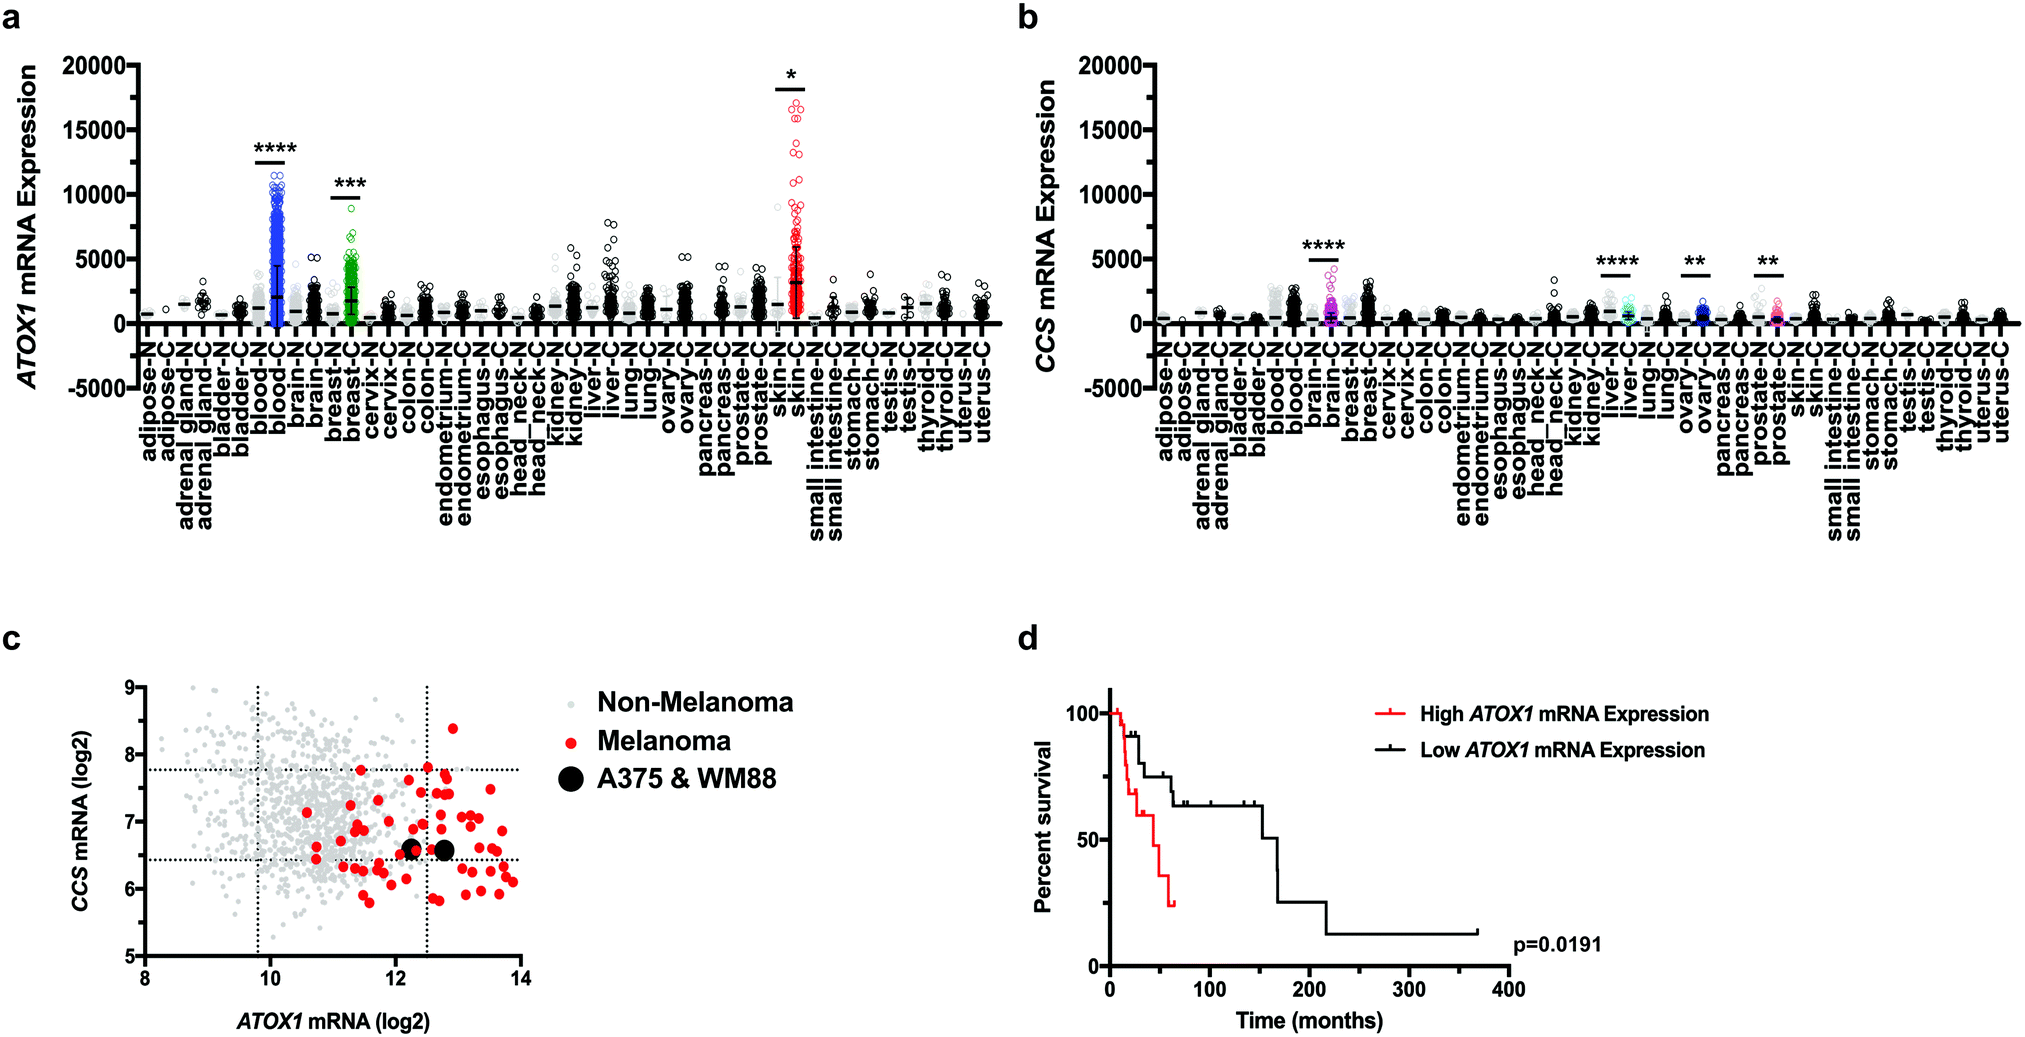 | ||
| Fig. 1
ATOX1 overexpression in melanoma correlates with poor survival. (a and b) mRNA expression of ATOX1 (a) or CCS (b) from tumor or normal tissue samples in the GENT web-based database. Statistical analysis was performed using a one-way ANOVA followed by Tukey's multiple-comparison test. *P < 0.05, **P < 0.01, ***P < 0.001, ****P < 0.0001. (c) log2 mRNA expression of ATOX1 versus CCS in 1036 cancer cell lines from the CCLE database. Non-melanoma cell lines (n = 975), melanoma cell lines (n = 61), or A375 and WM88 are indicated with gray, red, or black dots, respectively. Dashed lines indicate two standard deviations from mean mRNA expression and were used as cut-off values to designate low (left, bottom), normal (middle), or high expression (right, top). (d) Kaplan–Meier survival analysis of TCGA skin cutaneous melanoma patients with high ATOX1 (red line, n = 23) or low ATOX1 (black line, n = 23) mRNA expression. Results were compared using a Mantel–Cox test. **P < 0.01. | ||
Genetic deletion of ATOX1 reduced melanoma growth
To investigate the functional importance of ATOX1 in melanoma, we deleted ATOX1 via CRISPR/Cas9 in human melanoma cell lines, A375 and WM88, which overexpress ATOX1 based on CCLE data analysis (Fig. 2a and b). We choose to investigate A375 and WM88 as they harbor oncogenic mutations in the serine/threonine kinase BRAF, which is the most commonly mutated gene in cutaneous melanoma and underlies therapeutic targeting via the FDA-approved small molecule kinase inhibitors dabrafenib and vemurafenib.38–44 Targeted disruption of ATOX1 with two different sgRNAs significantly reduced the colony formation of A375 and WM88 cells when plated at low density when compared to control (Fig. 2c–f). Thus, our results demonstrate that BRAF mutation-positive melanoma cell lines depend on ATOX1 for growth, suggesting that its overexpression contributes to melanomagenesis.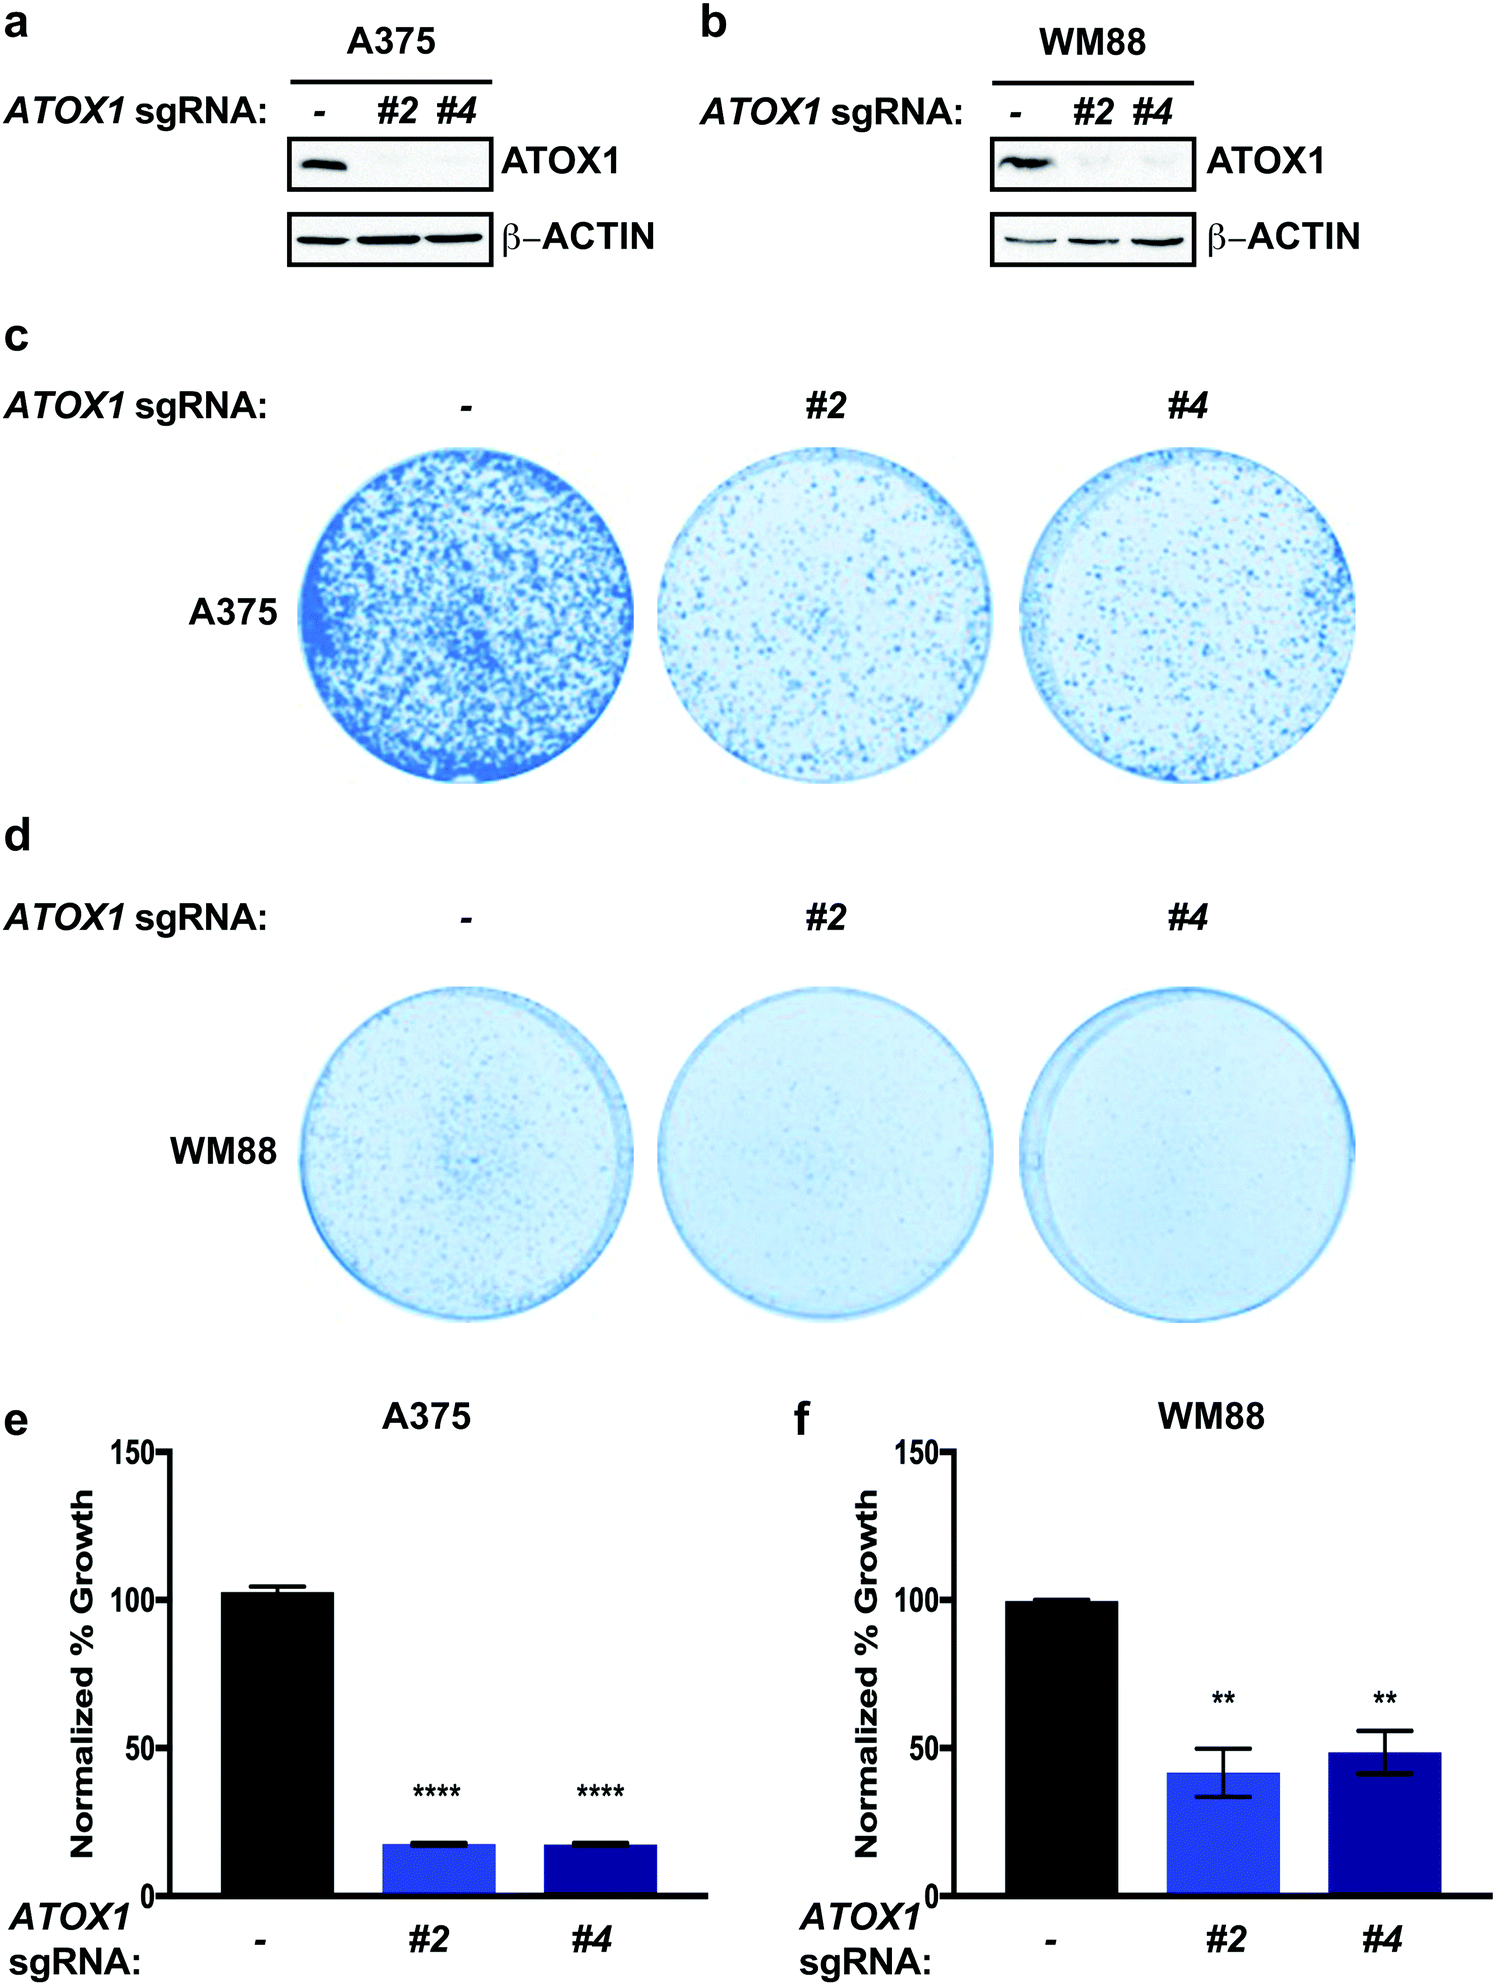 | ||
| Fig. 2 Genetic deletion of ATOX1 reduces colony formation of BRAF mutation-positive melanoma cell lines. (a and b) Immunoblot detection of ATOX1 or β-ACTIN from A375 or WM88 melanoma cells stably expressing sgRNA against ROSA (—) or ATOX1 (#2 or #4). (c and d) Representative images of crystal violet stained colonies from A375 or WM88 melanoma cells stably expressing sgRNA against ROSA (—) or ATOX1 (#2 or #4). (e and f) Quantification of crystal violet staining from three independent experiments plated in triplicate represented as normalized percent growth ± SEM of A375 or WM88 melanoma cells expressing sgRNA against ROSA (—) or ATOX1 (#2 or #4). Statistical analysis was performed using a one-way ANOVA followed by Tukey's multiple-comparisons test. **P < 0.01, ****P < 0.0001. | ||
Genetic deletion of ATOX1 decreased MAPK pathway activation in BRAFV600E mutant melanoma
In the context of melanoma, oncogenic BRAFV600E constitutively phosphorylates and activates the MEK1 and MEK2 kinases, which in turn phosphorylate and activate the ERK1 and ERK2 kinases, hyperactivating the canonical Mitogen Activated Protein Kinase Pathway (MAPK) to promote uncontrolled melanocytes growth and caner initiation and progression.39 Thus, targeting either oncogenic BRAFV600E and the MEK1/2 kinases has proven to be a clinically effective strategy to prolong survival in metastatic melanoma.42,45–48 Our lab previously established Cu as an essential micronutrient for BRAFV600E-driven MAPK signaling, tumor growth of human melanoma cell lines, and melanomagenesis in a genetically engineered mouse model.35,36 Capitalizing on the dependence of oncogenic BRAFV600E for MEK1/2-mediated signaling for growth and survival,49 we investigated whether canonical MAPK pathway activation was altered in response to genetic knockout of ATOX1. We tested and found that stable knockout of endogenous ATOX1 by CRISPR/Cas9 in the human melanoma cell lines A375 and WM888 specifically dampened phosphorylation of ERK1/2 (Fig. 3a–d). Despite hyperactivation of additional MAPK pathway downstream of oncogene induced stress in melanoma,50 phosphorylation of p38 and JNK were unaltered in melanoma cell lines without ATOX1 expression(Fig. 3a–d). These data suggest that canonical MAPK pathway activation is specifically diminished in the absence of ATOX1 and may contribute to the reduced growth of BRAF mutation-positive melanoma cells in the absence of ATOX1. Cu is required for BRAFV600E-driven MEK1/2 kinase activity through a direct Cu-MEK1/2 interaction,36 but it remains to be determined whether well-established Cu transport systems participate in Cu loading of these protein kinases. To determine whether ATOX1 supplies Cu to MEK1/2, we interrogated whether phosphorylation of ERK1/2 could be restored by treating ATOX1 knockout melanoma cell lines with exogenous Cu. Interestingly, acute, excess Cu treatment was sufficient to stimulate the MAPK pathway above baseline, suggesting that MEK1/2 may not be fully occupied with Cu in A375 and WM88 cells (Fig. 3e–f). In the absence of ATOX1, we found that the reduced phosphorylation of ERK1/2 was rescued by exogenous Cu to basal levels. Thus, ATOX1 is required for BRAFV600E-mutant melanoma MAPK pathway activation indirectly of a supporting Cu binding of MEK1/2.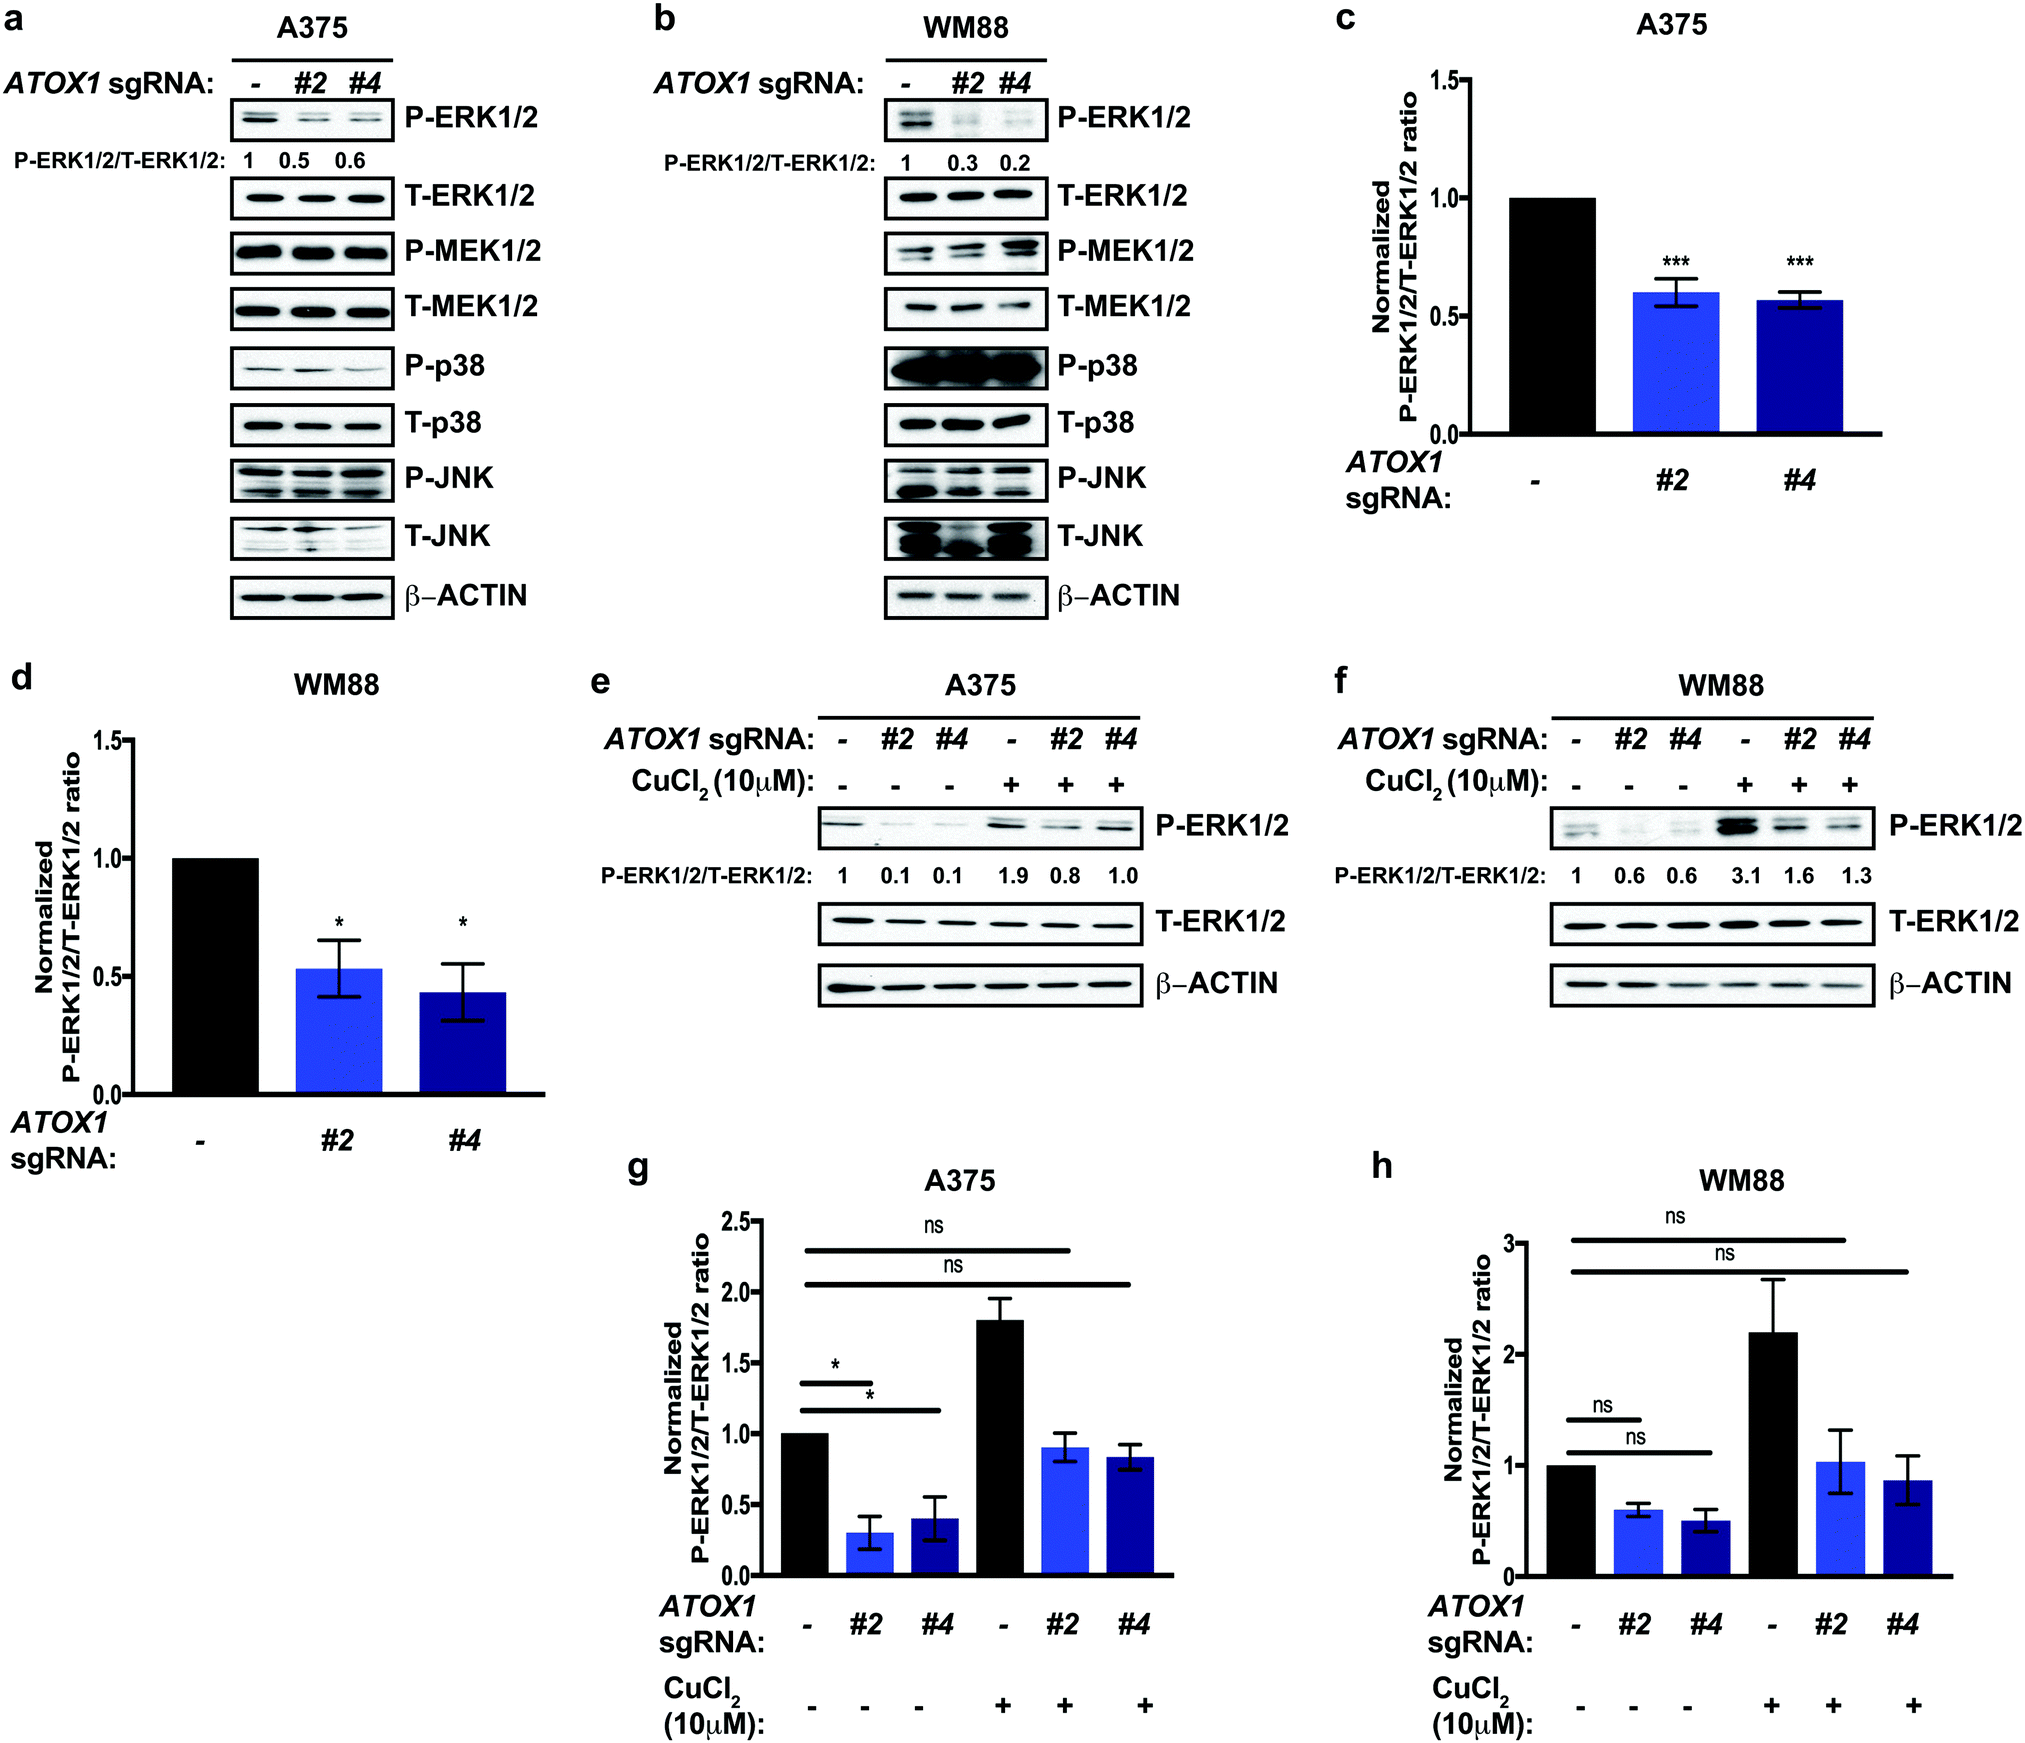 | ||
| Fig. 3 Genetic deletion of ATOX1 decreases MAPK pathway activation. (a and b) Immunoblot detection of P-ERK1/2, T-ERK1/2, P-MEK1/2, T-MEK1/2, P-p38, T-p38, P-JNK, T-JNK, or β-ACTIN from A375 or WM88 melanoma cells stably expressing sgRNA against ROSA (—) or ATOX1 (#2 or #4). Quantification: ΔP-ERK1/2/T-ERK1/2 normalized to ROSA control. (c and d) Quantification of the ratio of P-ERK1/2 to T-ERK1/2 normalized to ROSA control ± SEM in A375 and WM88 melanoma cells stably expressing sgRNA against ROSA (—) or ATOX1 (#2 or #4) from three independent biological replicates. Statistical analysis was performed using a one-way ANOVA followed by Tukey's multiple-comparisons test. *P < 0.05, ***P < 0.001. (e and f) Immunoblot detection of P-ERK1/2, T-ERK1/2, or β-ACTIN from A375 or WM88 melanoma cells stably expressing sgRNA against ROSA (—) or ATOX1 (#2 or #4) treated with vehicle or 10 μM CuCl2 for 20 minutes. Quantification: ΔP-ERK1/2/T-ERK1/2 normalized to ROSA control. (g and h) Quantification of the ratio of P-ERK1/2 to T-ERK1/2 normalized to ROSA control ± SEM in A375 and WM88 melanoma cells stably expressing sgRNA against ROSA (—) or ATOX1 (#2 or #4) treated with vehicle or 10 μM CuCl2 for 20 minutes from three independent biological replicates. Statistical analysis was performed using a one-way ANOVA followed by Tukey's multiple-comparisons test. ns = non-significant, *P < 0.05. | ||
Acute inhibition of ATOX1 reduced melanoma growth
Previous studies have suggested that Cu-chelators used in the treatment of Wilson disease could be exploited in BRAFV600E-driven melanoma as a unique vulnerability by forestalling MAPK signaling.35,36 In agreement, we hypothesized that treatment with the small molecule inhibitor DCAC50, which was previously shown to inhibit ATOX1 and CCS by blocking Cu transfer between these chaperones and downstream interacting target proteins,34 would acutely inhibit ATOX1 and reduce the growth of melanoma cell lines dependent on BRAFV600E-mediated activation of the MAPK pathway. In both A375 and WM88 melanoma cell lines, DCAC50 treatment attenuated colony formation in a dose-dependent fashion (Fig. 4a–d). Thus, inhibition of ATOX1 with concentrations of the small molecule inhibitor DCAC50 that are known to be selective and effective in reducing the proliferation of NSCLC are equally potent in dampening the growth of BRAF mutant melanoma cell lines.34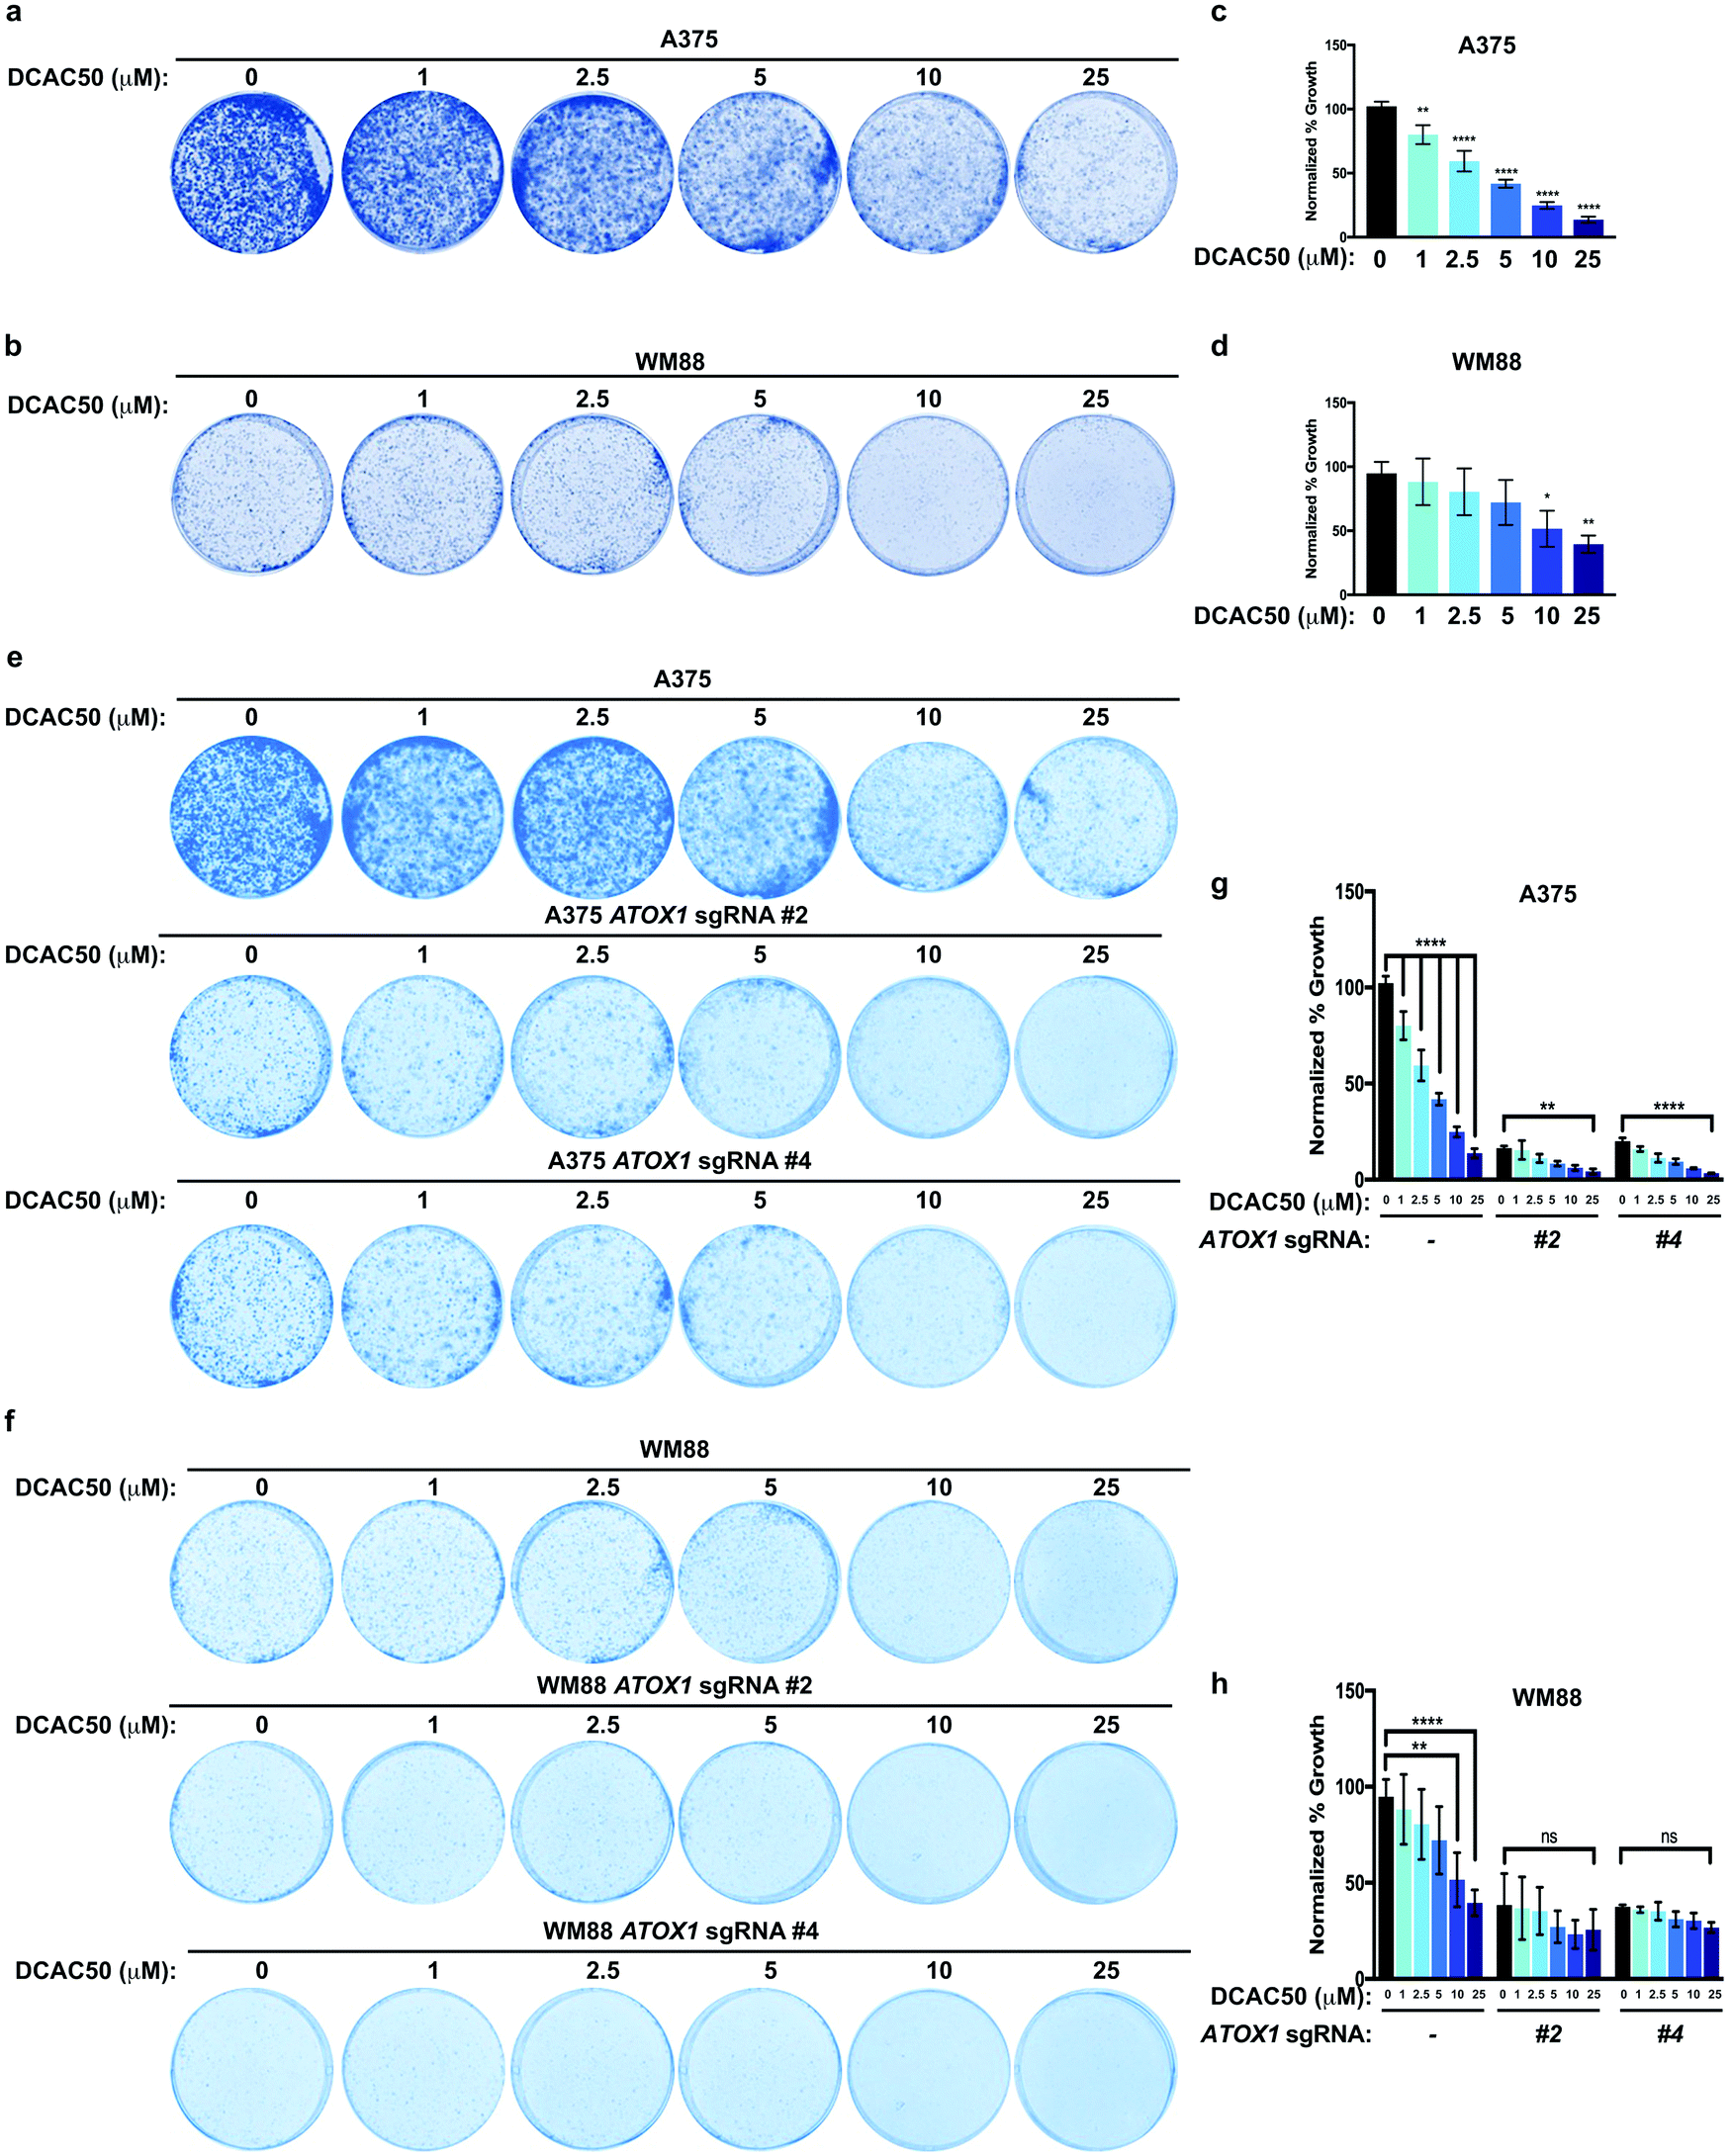 | ||
| Fig. 4 Acute inhibition of ATOX1 reduces melanoma growth. (a and b) Representative images of crystal violet stained colonies from A375 or WM88 melanoma cells treated with vehicle or increasing concentrations of DCAC50. (c and d) Quantification of crystal violet staining from three independent experiments plated in triplicate represented as normalized percent growth ± SEM of A375 or WM88 melanoma cells treated with vehicle or increasing concentrations of DCAC50. Statistical analysis was performed using a one-way ANOVA followed by Tukey's multiple-comparisons test. *P < 0.05, **P < 0.01, ****P < 0.0001. (e and f) Representative images of crystal violet stained colonies from A375 or WM88 melanoma cells stably expressing sgRNA against ROSA (—) or ATOX1 (#2 or #4) treated with vehicle or increasing concentrations of DCAC50. (g and h) Quantification of crystal violet staining from three independent experiments plated in triplicate represented as normalized percent growth ± SEM of A375 or WM88 melanoma cells stably expressing sgRNA against ROSA (—) or ATOX1 (#2 or #4) treated with vehicle or increasing concentrations of DCAC50. Statistical analysis was performed using a one-way ANOVA followed by Tukey's multiple-comparisons test. ns = non-significant, **P < 0.01, ****P < 0.0001. | ||
To address whether DCAC50 mechanistically reduced BRAFV600E-driven melanoma cell line colony formation by solely targeting overexpressed ATOX1, A375 and WM88 melanoma cell lines stably expressing a control sgRNA or two different sgRNAs targeting ATOX1 were treated with increasing concentrations of DCAC50 and growth at low density was evaluated (Fig. 4e–h). While DCAC50 reduced the colony formation of A375 and WM88 cells in a dose-dependent manner when plated at low density when compared to vehicle control, stable knockout of ATOX1 with two different sgRNAs failed to further decrease the antiproliferative activity of DCAC50 at concentrations in which significant reductions in colony growth were observed in the parental lines (Fig. 4e–h). Thus, inhibition of BRAFV600E-mutant melanoma cell growth by the small molecule DCAC50 is due in large part to targeting only one of its molecular targets, ATOX1.
Given these results, we hypothesized that human cancer cell lines with lower ATOX1 expression will be less sensitive to DCAC50. To test this hypothesis, we further analyzed the genetic expression data in CCLE and found that ATOX1 expression is lower in the pancreatic cancer cell line HPAC and the colon cancer cell line SW48 when compared to the melanoma cell lines A375 and WM88 (Fig. S1a, ESI†). In contrast to the hypothesis, HPAC and SW48 colony formation was reduced following treatment with DCAC50 in a dose-dependent manner (Fig. S1b–e, ESI†). However, DCAC50 displayed negligible effects on primary human embryonic kidney cells immortalized with SV40 T-antigen and telomerase (HEK-HT) and is therefore not broadly toxic to normal cell growth (Fig. S1f and g, ESI†). Since ATOX1 is not responsible for directly delivering Cu to MEK1/2 in cells, the mechanism by which DCAC50 reduced the growth of these cancer cells remained to be determined. Several studies have reported that ATOX1 not only functions in the cytosol but also translocates to the nucleus to facilitate the transcription of genes like CCND1 to drive cell growth and proliferation.51–53 We tested and found that ATOX1 is expressed at undetectable levels in several human cancer cell lines (HPAC and SW48) and an immortalized human cell line (HEK-HT) and is exclusively localized to the cytosolic fraction of A375 and WM88 melanoma cells (Fig. S2a, ESI†). Taken together, these findings suggest that ATOX1 expression levels may not be a predictive marker of sensitivity to the small molecule DCAC50, but indicate that the growth of cancer cells is typically selectively inhibited due in part to targeting either Cu chaperone.
DCAC50 treatment attenuated MAPK pathway activation
Finally, to investigate whether acute inhibition of ATOX1 would decrease MAPK pathway activation in an analogous fashion to genetic deletion of ATOX1, A375 and WM88 melanoma cells were treated with increasing concentrations of DCAC50. Similar to loss of ATOX1, phosphorylated ERK1/2 was reduced in response to DCAC50 treatment when compared to vehicle control, while the activation of other MAPKs remained elevated (Fig. 5a–d). These results indicate that ATOX1 is required for MAPK signaling whether directly through a mechanism by which ATOX1 interacts with MAPK proteins themselves or indirectly by disabling Cu-requiring proteins.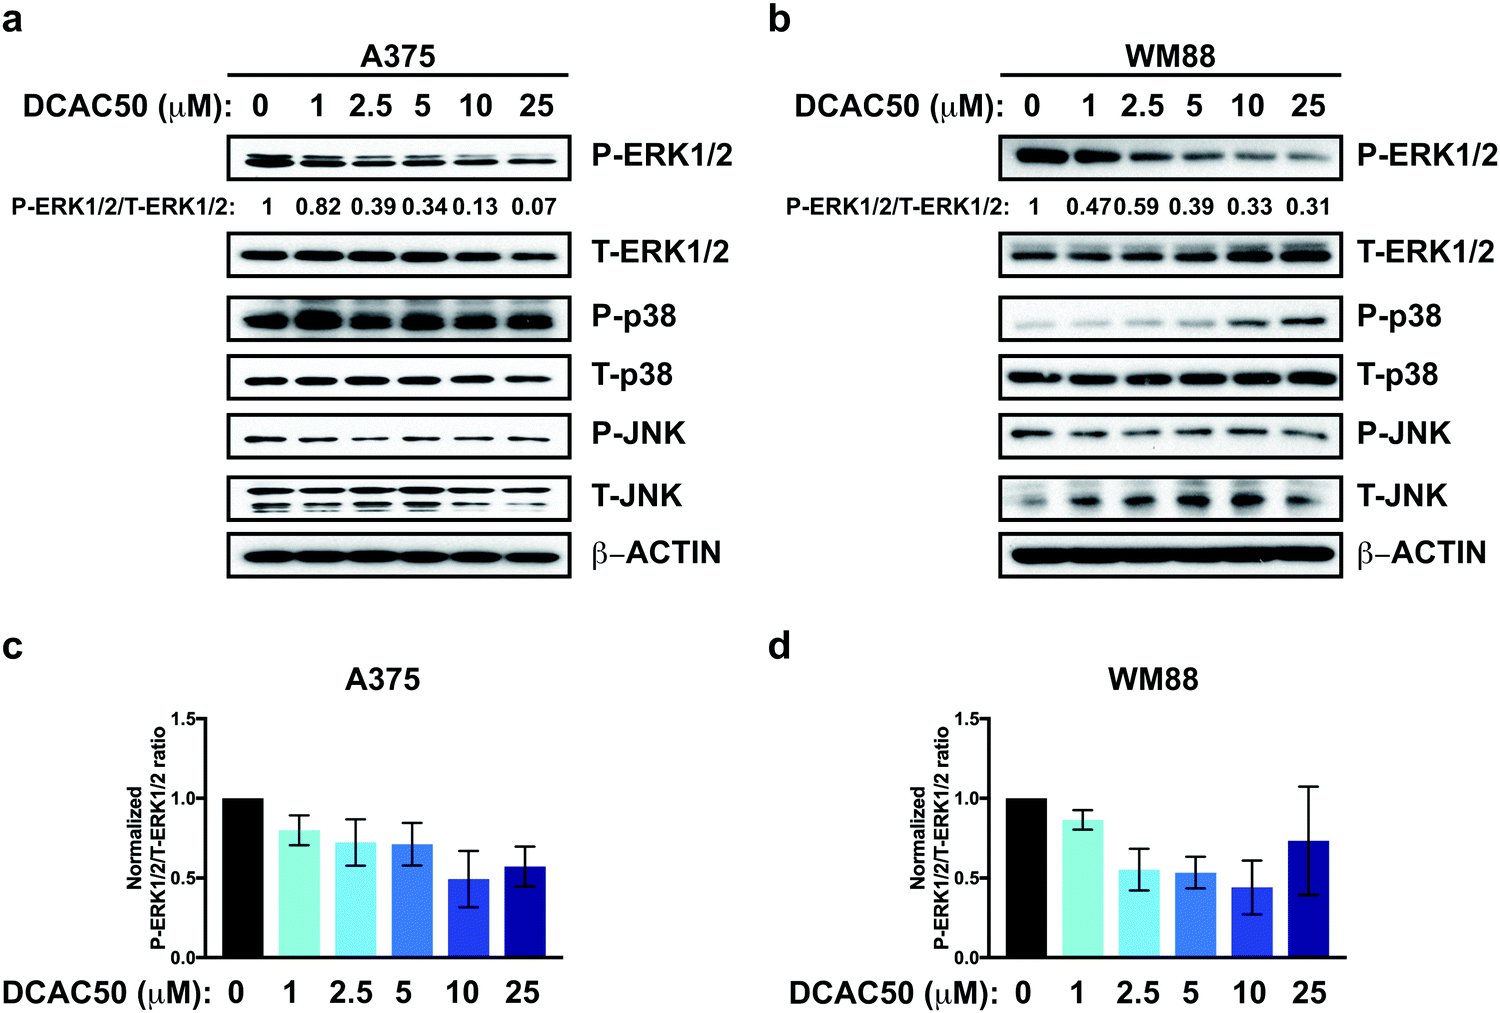 | ||
| Fig. 5 DCAC50 treatment attenuates MAPK pathway activation. (a and b) Immunoblot detection of P-ERK1/2, T-ERK1/2, P-p38, T-p38, P-JNK, T-JNK, or β-ACTIN from A375 or WM88 melanoma cells treated with vehicle or increasing concentrations of DCAC50 (μM) for 24 hours. Quantification: ΔP-ERK1/2/T-ERK1/2 normalized to ROSA control. (c and d) Quantification of the ratio of P-ERK1/2 to T-ERK1/2 normalized to vehicle control ± SEM in A375 and WM88 melanoma cells treated with vehicle or increasing concentration of DCAC50 for 24 hours from three independent biological replicates. | ||
Discussion
We define here for the first time the landscape of differential expression for the Cu chaperones ATOX1 and CCS in human cancer, which revealed selective upregulation of ATOX1 in the context of skin cutaneous melanoma that correlated with poorer survival in patients. These findings agree with a study from Blockhuys et al. that defined the human Cu proteome and uncovered ATOX1 overexpression in all molecular subtypes of breast cancer.32 However, the genetic mechanism(s) driving the elevated expression of ATOX1 in breast cancer or melanoma remains to be elucidated. One intriguing hypothesis is that transcription factor dysregulation in melanoma is causing high expression of ATOX1, which is predicted to be regulated by MTF1 and cMYC-MAX both of which have been implicated in melanoma initiation and progression. Cutaneous melanoma can be classified genetically based on the frequency of mutations in BRAF, RAS, NF1, and triple-WT established and these four subtypes provided a framework for clinical management of the disease.38 While BRAFV600E-driven melanoma is the most prevalent alteration,43ATOX1 overexpression was detected in all four genomic subtypes of cutaneous melanoma, suggesting a potential unifying mechanism for the observed upregulation and dependence across the cancer. Our findings highlight a need for additional exploration of Cu transport systems in cancer by further investigating the molecular players governing their dysregulation in hopes of uncovering news facets of the system that can be targeted therapeutically.Functionally, we established that ATOX1 is required for the growth of BRAF mutation-positive melanoma and its genetic deletion or pharmacologic inhibition is associated with a dampening of oncogenic MAPK pathway activation. However, the extent to which the reduction in oncogenic kinase signaling underlies the requirement for ATOX1 in melanoma cell growth remains to be defined. Based on previous studies, several molecular mechanisms could collectively contribute to our findings. First, our recent work demonstrated that Cu directly binds to MEK1/2 to influence the amplitude of the RAF-MEK-ERK cascade in response to proliferative signals.54 Unlike Mg2+ that is required for ATP coordination and in turn kinase activity, Cu allosterically potentiates the ability of MEK1/2 to phosphorylate ERK1/2 in a dose-dependent manner. Further studies showed either genetically (i.e. CTR1 knockdown) or pharmacologically (i.e. Cu chelators) decreasing Cu levels in the setting of MEK1/2 dependent BRAF mutation-positive melanomas reduced tumor growth.35,36 Thus, an as yet unknown, dedicated cellular delivery mechanism of Cu to MEK1/2 is likely to exist that could be mediated by ATOX1. However, we established here that reduced MAPK pathway activation in the absence of ATOX1 could be rescued by exogenous Cu treatment (Fig. 3e–h), suggesting that ATOX1 is not directly required for Cu-mediated activation of the MAPK pathway. Second, ATOX1 traditionally functions as the Cu chaperone for delivery of Cu to the trans-Golgi network via the P-type ATPase ATP7A in melanocytes to support the Cu-loading into Cu-dependent enzymes like LOX and tyrosinase. Both Zhu et al. and Matsui et al. have provided convincing evidence that loss of ATP7A function either by genetic deletion or pharmacologic inhibition with the gastric proton pump inhibitor omeprazole can reduce oncogenic RAS-mediated transformed cell growth due in large part to elevated ROS levels or block melanomagenesis potentially through tyrosinase degradation.55,56 Therefore, overexpression of ATOX1 in melanoma and other cancers may simply support the metalation of Cu-dependent enzymes localized to the secretory compartment that are essential for tumorigenesis. In support for this hypothesis, a phase II clinical trial in triple negative breast cancer patients treated with the Cu chelator tetrathiomolybdate revealed that tumor microenvironment remodeling mediated through the Cu-dependent activity of LOX was ablated.57,58 Finally, while several reports have suggested that ATOX1 regulates the expression of genes required for cell growth and proliferation by translocating to the nucleus,51–53 ATOX1 is predominately localized to the cytosolic fraction of human melanoma cell lines (Fig. S2a, ESI†). In conclusion, this study highlights the importance of exploring additional Cu homeostasis machinery in the context of cancer and more specifically, suggests that inhibiting ATOX1 with the small molecule DCAC50 may be a promising strategy for the treatment of BRAF mutation-positive cancer in combination with other MAPK pathway inhibitors.
Conflicts of interest
D. C. B. holds ownership in Merlon Inc. D. C. B. is an inventor on the patent application 20150017261 entitled “Methods of treating and preventing cancer by disrupting the binding of copper in the MAP kinase pathway”. No potential conflicts of interest were disclosed by the other authors.Acknowledgements
We thank F. Daldal, A. Dancis, J. M. Davis, and E. S. Witze (University of Pennsylvania) for technical support, discussions, and/or review of the manuscript. This research was funded by the National Institutes of Health (NIH) grants GM124749 (D. C. B.) and CA207513 (L. B.) and the Pew Scholars Program in Biomedical Science Award #50359 (D. C. B.). T. T. is supported by NCI NRSA Fellowship (F31) F31CA243294. J. M. P. is supported by American Cancer Society Postdoctoral Fellowship 131203PF1714701CCG.References
- B.-E. Kim, T. Nevitt and D. J. Thiele, Nat. Chem. Biol., 2008, 4, 176–185 CrossRef CAS.
- D. J. Thiele and J. D. Gitlin, Nat. Chem. Biol., 2008, 4, 145–147 CrossRef CAS.
- R. A. Festa and D. J. Thiele, Curr. Biol., 2011, 21, R877–83 CrossRef CAS.
- A. Ala, A. P. Walker, K. Ashkan and J. S. Dooley, Lancet, 2007, 369, 397–408 CrossRef CAS.
- S. G. Kaler, Ann. N. Y. Acad. Sci., 2014, 1314, 64–68 CrossRef CAS.
- M. L. Graper, D. Huster, S. G. Kaler, S. Lutsenko and D. J. Thiele, Ann. N. Y. Acad. Sci., 2014, 1314, v–vi CrossRef.
- C. Vulpe, B. Levinson, S. Whitney, S. Packman and J. Gitschier, Nat. Genet., 1993, 3, 7–13 CrossRef CAS.
- P. C. Bull, G. R. Thomas, J. M. Rommens, J. R. Forbes and D. W. Cox, Nat. Genet., 1993, 5, 327–337 CrossRef CAS PubMed.
- R. E. Tanzi, K. Petrukhin, I. Chernov, J. L. Pellequer, W. Wasco, B. Ross, D. M. Romano, E. Parano, L. Pavone and L. M. Brzustowicz, Nat. Genet., 1993, 5, 344–350 CrossRef CAS.
- J. H. Kaplan and S. Lutsenko, J. Biol. Chem., 2009, 284, 25461–25465 CrossRef CAS.
- H. Ohrvik and D. J. Thiele, Ann. N. Y. Acad. Sci., 2014, 1314, 32–41 CrossRef CAS.
- J. Lee, J. R. Prohaska and D. J. Thiele, Proc. Natl. Acad. Sci. U. S. A., 2001, 98, 6842–6847 CrossRef CAS.
- D. M. Glerum, A. Shtanko and A. Tzagoloff, J. Biol. Chem., 1996, 271, 14504–14509 CrossRef CAS.
- A. K. Wernimont, D. L. Huffman, A. L. Lamb, T. V. O'Halloran and A. C. Rosenzweig, Nat. Struct. Mol. Biol., 2000, 7, 766–771 CrossRef CAS.
- R. A. Pufahl, C. P. Singer, K. L. Peariso, S. J. Lin, P. J. Schmidt, C. J. Fahrni, V. C. Culotta, J. E. Penner-Hahn and T. V. O’Halloran, Science, 1997, 278, 853–856 CrossRef CAS.
- I. Anastassopoulou, L. Banci, I. Bertini, F. Cantini, A. E. Katsari and A. Rosato, Solution Structure of the Apo and Copper(I)-Loaded Human Metallochaperone HAH1†, American Chemical Society, 2004 Search PubMed.
- Lucia Banci, Ivano Bertini, C. T. Chasapis, A. Rosato and L. Tenori, Biochem. Biophys. Res. Commun., 2007, 364, 645–649 CrossRef CAS.
- N. J. Robinson and D. R. Winge, Annu. Rev. Biochem., 2010, 79, 537–562 CrossRef CAS.
- P. A. Cobine, F. Pierrel and D. R. Winge, Biochim. Biophys. Acta, Mol. Cell Res., 2006, 1763, 759–772 CrossRef CAS.
- L. Banci, I. Bertini, S. Ciofi-Baffoni, T. Kozyreva, K. Zovo and P. Palumaa, Nature, 2010, 465, 645–648 CrossRef CAS.
- Y. Hatori and S. Lutsenko, Antioxid. Redox Signaling, 2013, 19, 945–957 CrossRef CAS.
- S. Lutsenko, Metallomics, 2016, 8, 840–852 RSC.
- Y. Hatori, S. Clasen, N. M. Hasan, A. N. Barry and S. Lutsenko, J. Biol. Chem., 2012, 287, 26678–26687 CrossRef CAS.
- V. C. Culotta, L. W. J. Klomp, J. Strain, R. L. B. Casareno, B. Krems and J. D. Gitlin, J. Biol. Chem., 1997, 272, 23469–23472 CrossRef CAS.
- P. C. Wong, D. Waggoner, J. R. Subramaniam, L. Tessarollo, T. B. Bartnikas, V. C. Culotta, D. L. Price, J. Rothstein and J. D. Gitlin, Proc. Natl. Acad. Sci. U. S. A., 2000, 97, 2886–2891 CrossRef CAS.
- Y.-C. Horng, S. C. Leary, P. A. Cobine, F. B. J. Young, G. N. George, E. A. Shoubridge and D. R. Winge, J. Biol. Chem., 2005, 280, 34113–34122 CrossRef CAS.
- Y.-C. Horng, P. A. Cobine, A. B. Maxfield, H. S. Carr and D. R. Winge, J. Biol. Chem., 2004, 279, 35334–35340 CrossRef CAS.
- S. C. Leary, B. A. Kaufman, G. Pellecchia, G.-H. Guercin, A. Mattman, M. Jaksch and E. A. Shoubridge, Hum. Mol. Genet., 2004, 13, 1839–1848 CrossRef CAS.
- R. J. Coates, N. S. Weiss, J. R. Daling, R. L. Rettmer and G. R. Warnick, Cancer Res., 1989, 49, 4353–4356 CAS.
- G. J. Brewer and S. D. Merajver, Integr. Cancer Ther., 2002, 1, 327–337 CrossRef CAS.
- H. Cai and F. Peng, Oncol. Rep., 2013, 30, 269–275 CrossRef CAS PubMed.
- S. Blockhuys, E. Celauro, C. Hildesjö, A. Feizi, O. Stål, J. C. Fierro-González and P. Wittung-Stafshede, Metallomics, 2017, 9, 112–123 RSC.
- S. Blockhuys and P. Wittung-Stafshede, Biochem. Biophys. Res. Commun., 2017, 483, 301–304 CrossRef CAS.
- J. Wang, C. Luo, C. Shan, Q. You, J. Lu, S. Elf, Y. Zhou, Y. Wen, J. L. Vinkenborg, J. Fan, H. Kang, R. Lin, D. Han, Y. Xie, J. Karpus, S. Chen, S. Ouyang, C. Luan, N. Zhang, H. Ding, M. Merkx, H. Liu, J. Chen, H. Jiang and C. He, Nat. Chem., 2015, 7, 968–979 CrossRef CAS.
- D. C. Brady, M. S. Crowe, D. N. Greenberg and C. M. Counter, Cancer Res., 2017, 77, 6240–6252 CrossRef CAS.
- D. C. Brady, M. S. Crowe, M. L. Turski, G. A. Hobbs, X. Yao, A. Chaikuad, S. Knapp, K. Xiao, S. L. Campbell, D. J. Thiele and C. M. Counter, Nature, 2014, 509, 492–496 CrossRef CAS.
- W. C. Hahn, C. M. Counter, A. S. Lundberg, R. L. Beijersbergen, M. W. Brooks and R. A. Weinberg, Nature, 1999, 400, 464–468 CrossRef CAS.
- The Cancer Genome Atlas Network, Cell, 2015, 161, 1681–1696 CrossRef.
- M. Holderfield, M. M. Deuker, F. McCormick and M. McMahon, Nat. Rev. Cancer, 2014, 14, 455–467 CrossRef CAS.
- K. T. Flaherty, I. Puzanov, K. B. Kim, A. Ribas, G. A. McArthur, J. A. Sosman, P. J. O'Dwyer, R. J. Lee, J. F. Grippo, K. Nolop and P. B. Chapman, N. Engl. J. Med., 2010, 363, 809–819 CrossRef CAS.
- G. S. Falchook, G. V. Long, R. Kurzrock, K. B. Kim, T. H. Arkenau, M. P. Brown, O. Hamid, J. R. Infante, M. Millward, A. C. Pavlick, S. J. O'Day, S. C. Blackman, C. M. Curtis, P. Lebowitz, B. Ma, D. Ouellet and R. F. Kefford, Lancet, 2012, 379, 1893–1901 CrossRef CAS.
- P. B. Chapman, A. Hauschild, C. Robert, J. B. Haanen, P. Ascierto, J. Larkin, R. Dummer, C. Garbe, A. Testori, M. Maio, D. Hogg, P. Lorigan, C. Lebbe, T. Jouary, D. Schadendorf, A. Ribas, S. J. O'Day, J. A. Sosman, J. M. Kirkwood, A. M. M. Eggermont, B. Dreno, K. Nolop, J. Li, B. Nelson, J. Hou, R. J. Lee, K. T. Flaherty, G. A. McArthur and BRIM-3 Study Group, N. Engl. J. Med., 2011, 364, 2507–2516 CrossRef CAS PubMed.
- P. M. Pollock, U. L. Harper, K. S. Hansen, L. M. Yudt, M. Stark, C. M. Robbins, T. Y. Moses, G. Hostetter, U. Wagner, J. Kakareka, G. Salem, T. Pohida, P. Heenan, P. Duray, O. Kallioniemi, N. K. Hayward, J. M. Trent and P. S. Meltzer, Nat. Genet., 2002, 33, 19–20 CrossRef.
- G. Bollag, J. Tsai, J. Zhang, C. Zhang, P. Ibrahim, K. Nolop and P. Hirth, Nat. Rev. Drug Discovery, 2012, 11, 873–886 CrossRef CAS PubMed.
- K. T. Flaherty, J. R. Infante, A. Daud, R. Gonzalez, R. F. Kefford, J. Sosman, O. Hamid, L. Schuchter, J. Cebon, N. Ibrahim, R. Kudchadkar, H. A. Burris, G. Falchook, A. Algazi, K. Lewis, G. V. Long, I. Puzanov, P. Lebowitz, A. Singh, S. Little, P. Sun, A. Allred, D. Ouellet, K. B. Kim, K. Patel and J. Weber, N. Engl. J. Med., 2012, 367, 1694–1703 CrossRef CAS PubMed.
- G. V. Long, D. Stroyakovskiy, H. Gogas, E. Levchenko, F. de Braud, J. Larkin, C. Garbe, T. Jouary, A. Hauschild, J.-J. Grob, V. Chiarion-Sileni, C. Lebbe, M. Mandalà, M. Millward, A. Arance, I. Bondarenko, J. B. A. G. Haanen, J. Hansson, J. Utikal, V. Ferraresi, N. Kovalenko, P. Mohr, V. Probachai, D. Schadendorf, P. Nathan, C. Robert, A. Ribas, D. J. Demarini, J. G. Irani, S. Swann, J. J. Legos, F. Jin, B. Mookerjee and K. Flaherty, Lancet, 2015, 386, 444–451 CrossRef CAS.
- J. R. Infante, L. A. Fecher, G. S. Falchook, S. Nallapareddy, M. S. Gordon, C. Becerra, D. J. Demarini, D. S. Cox, Y. Xu, S. R. Morris, V. G. R. Peddareddigari, N. T. Le, L. Hart, J. C. Bendell, G. Eckhardt, R. Kurzrock, K. Flaherty, H. A. Burris and W. A. Messersmith, Lancet Oncol., 2012, 13, 773–781 CrossRef CAS.
- G. S. Falchook, K. D. Lewis, J. R. Infante, M. S. Gordon, N. J. Vogelzang, D. J. Demarini, P. Sun, C. Moy, S. A. Szabo, L. T. Roadcap, V. G. R. Peddareddigari, P. F. Lebowitz, N. T. Le, H. A. Burris, W. A. Messersmith, P. J. O'Dwyer, K. B. Kim, K. Flaherty, J. C. Bendell, R. Gonzalez, R. Kurzrock and L. A. Fecher, Lancet Oncol., 2012, 13, 782–789 CrossRef CAS.
- D. B. Solit, L. A. Garraway, C. A. Pratilas, A. Sawai, G. Getz, A. Basso, Q. Ye, J. M. Lobo, Y. She, I. Osman, T. R. Golub, J. Sebolt-Leopold, W. R. Sellers and N. Rosen, Nature, 2006, 439, 358–362 CrossRef CAS.
- M. Corazzari, F. Rapino, F. Ciccosanti, P. Giglio, M. Antonioli, B. Conti, G. M. Fimia, P. E. Lovat and M. Piacentini, Cell Death Differ., 2015, 22, 946–958 CrossRef CAS.
- S. Itoh, H. W. Kim, O. Nakagawa, K. Ozumi, S. M. Lessner, H. Aoki, K. Akram, R. D. McKinney, M. Ushio-Fukai and T. Fukai, J. Biol. Chem., 2008, 283, 9157–9167 CrossRef CAS.
- H. Ohrvik and P. Wittung-Stafshede, Int. J. Mol. Sci., 2015, 16, 16728–16739 CrossRef.
- M. Matson Dzebo, S. Blockhuys, S. Valenzuela, E. Celauro, E. K. Esbjörner and P. Wittung-Stafshede, Comput. Struct. Biotechnol. J., 2018, 16, 443–449 CrossRef CAS.
- M. L. Turski, D. C. Brady, H. J. Kim, B.-E. Kim, Y. Nose, C. M. Counter, D. R. Winge and D. J. Thiele, Mol. Cell. Biol., 2012, 32, 1284–1295 CrossRef CAS.
- S. Zhu, V. Shanbhag, Y. Wang, J. Lee and M. Petris, J. Cancer, 2017, 8, 1952–1958 CrossRef.
- M. S. Matsui, M. J. Petris, Y. Niki, N. Karaman-Jurukovska, N. Muizzuddin, M. Ichihashi and D. B. Yarosh, J. Invest. Dermatol., 2015, 135, 834–841 CrossRef CAS.
- N. Chan, A. Willis, N. Kornhauser, M. M. Ward, S. B. Lee, E. Nackos, B. R. Seo, E. Chuang, T. Cigler, A. Moore, D. Donovan, M. V. Cobham, V. Fitzpatrick, S. Schneider, A. Wiener, J. Guillaume-Abraham, E. Aljom, R. Zelkowitz, J. D. Warren, M. E. Lane, C. Fischbach, V. Mittal and L. Vahdat, Clin. Cancer Res., 2016, 23, 666–676 CrossRef.
- S. Jain, J. Cohen, M. M. Ward, N. Kornhauser, E. Chuang, T. Cigler, A. Moore, D. Donovan, C. Lam, M. V. Cobham, S. Schneider, S. M. Hurtado Rúa, S. Benkert, C. Mathijsen Greenwood, R. Zelkowitz, J. D. Warren, M. E. Lane, V. Mittal, S. Rafii and L. T. Vahdat, Ann. Oncol., 2013, 24, 1491–1498 CrossRef CAS.
Footnote |
| † Electronic supplementary information (ESI) available: Fig. S1. DCAC50 treatment inhibits the growth of human cancer cells irrespective of ATOX1 overexpression. (a) log2 mRNA expression of ATOX1 versus CCS in 1036 cancer cell lines from the CCLE database. Non-melanoma cell lines (n = 975), melanoma cell lines (n = 61), or A375, WM88, SW48, or HPAC are indicated with gray, red, black, orange or blue dots, respectively. Dashed lines indicate two standard deviations from mean mRNA expression and were used as cut-off values to designate low (left, bottom), normal (middle), or high expression (right, top). (b–d) Representative images of crystal violet stained colonies from HPAC, SW48, or HEK-HT cells treated with vehicle or increasing concentrations of DCAC50. (e–g) Quantification of crystal violet staining from three independent experiments plated in triplicate represented as normalized percent growth ± SEM of HPAC, SW48, or HEK-HT cells treated with vehicle or increasing concentrations of DCAC50. Statistical analysis was performed using a one-way ANOVA followed by Tukey's multiple-comparisons test. ***P < 0.001, ****P < 0.0001. Fig. S2. ATOX1 exclusively localizes to the cytosol in a panel of normal and human cancer cell lines. (a) Immunoblot detection of ATOX1, LAMIN A/C, and α-TUBULIN of nuclear or cytosolic fractions from HEK-HT, SW48, HPAC, A375, or WM88 cells. See DOI: 10.1039/c9mt00042a |
| This journal is © The Royal Society of Chemistry 2019 |