
 Open Access Article
 This Open Access Article is licensed under a Creative Commons Attribution-Non Commercial 3.0 Unported Licence
Effect of crystal orientation on the segregation of aliovalent dopants at the surface of La0.6Sr0.4CoO3†
Fatih
Pişkin
 abde,
Roland
Bliem
ab and
Bilge
Yildiz
*abc
abde,
Roland
Bliem
ab and
Bilge
Yildiz
*abc
aLaboratory for Electrochemical Interfaces, Massachusetts Institute of Technology, Cambridge, MA, USA. E-mail: byildiz@mit.edu
bDepartment of Nuclear Science and Engineering, Massachusetts Institute of Technology, Cambridge, MA, USA
cDepartment of Materials Science and Engineering, Massachusetts Institute of Technology, Cambridge, MA, USA
dDepartment of Metallurgical and Materials Engineering, Middle East Technical University, Ankara, Turkey
eDepartment of Metallurgical and Materials Engineering, Muğla Sıtkı Koçman University, Muğla, Turkey
First published on 30th May 2018
Abstract
The effect of crystal orientation on aliovalent dopant segregation at the surface of La0.6Sr0.4CoO3 as a model perovskite oxide was investigated. La0.6Sr0.4CoO3 pellets were produced and then annealed in air at 800 °C for 2–5 hours to drive the cation segregation at the surface. To quantify the chemical state of the pellets' surface, including cation composition and secondary phase precipitates rich in Sr, the pellets were characterized by X-ray photoelectron spectroscopy and Auger electron spectroscopy. To systematically assess the correlation between crystal orientation and dopant cation segregation, selected regions at the surface of the annealed pellets were analyzed by scanning electron microscopy and electron backscatter diffraction. Investigation of more than 300 grains revealed that the area coverage of the Sr-rich precipitates on grains having a {001} orientation was more than 3 times higher compared to that on the {101} and {111} orientations. On the other hand, the number density of precipitates was very similar on each grain orientation. This grain orientation dependent behavior indicates that the exposed facet plays an important role in dopant cation segregation, especially in the growth of secondary phases, likely by altering the surface energy and charged defect concentration. The present study provides insights into the importance of atomic arrangements in determining the surface stability and cation segregation tendency on perovskite oxides.
1. Introduction
Perovskite oxides with mixed electronic and ionic conductivity have been studied extensively as catalysts for applications such as oxygen permeation membranes,1–3 metal–air batteries4,5 and solid oxide fuel cells (SOFCs).6–9 Especially in SOFCs, La-based ABO3 perovskite-type oxides, including (La,Sr)CoO3 (LSC),10,11 (La,Sr)FeO3 (LSF),12,13 and (La,Sr)MnO3 (LSM),14,15 are state-of-the-art cathode materials, offering high oxygen reduction activity and oxygen ionic conductivity. Cation chemistry at cathode surfaces mainly governs the reactivity and stability for the oxygen reduction reaction (ORR).16 In order to achieve high energy conversion efficiencies in SOFCs, it is important to have surfaces that are highly active for these reactions and that retain long-term stability. However, the cathodes at hand suffer from surface degradation due to chemical instability under functional conditions.17,18 This degradation dramatically reduces the ORR kinetics by up to two orders of magnitude.19,20 Surface degradation of perovskites often takes place in the form of enrichment of dopant cations at the surface and the formation of dopant-rich insulating phases such as SrO.19,21,22 For example, although La0.6Sr0.4CoO3 (LSC64) is one of the promising cathode materials, having a very low area specific resistance of 0.01 ohm cm2 at 600 °C, it is not stable and undergoes dopant segregation and phase separation at its surface at elevated temperatures.23 Segregation of the dopant Sr and precipitation of SrO-like insulating phases at the cathode surface may result in the complete coverage of the surface.24,25 This surface coverage caused by insulating phases reduces the effective surface area and blocks the electron transfer and oxygen exchange pathways.26 Additionally, it also leaves a dopant-poor subsurface.18,27 As a result, the surface dramatically loses its electrochemical performance.In our recent studies, we have shown that dopant segregation at perovskite oxide cathode surfaces can be driven by both elastic strain energy and electrostatic attraction of aliovalent dopants by surface oxygen vacancies.27 In the case of elastic strain, the size mismatch between the dopant and the host cations drives the dopant to free surfaces or interfaces in order to minimize the elastic energy. At the same time, negatively charged dopants, e.g. , can be attracted by positively charged oxygen vacancies,
  , that accumulate at perovskite surfaces. The existence of oxygen vacancies at the surface is very critical for the ORR;28 however, at the same time they attract aliovalent dopants and degrade the surface. We recently showed that tuning the oxygen vacancy concentration at the cathode surface by modifying the surface with less reducible cations can decrease the amount of Sr segregation and the formation of blocking SrO-like phases.6
It is known that surface energy is dependent on the crystallographic orientation29 and it can be modified with different termination layers. Different crystal orientations would yield dissimilar termination layers and this affects the oxygen vacancy formation energy on the surface as well.30 In this respect, surface energy, affected by the atomic arrangements, alters the oxygen vacancy concentration at the perovskite surface. This is expected also for the interface energy between the perovskite surface and the possible secondary phases. Thus, the crystal orientation might play an important role in dopant cation segregation. In order to test this hypothesis, we examined the surface segregation behavior as a function of crystal orientation on LSC64 as a model system. We assessed both the number density and the area coverage of the phase separated Sr-rich precipitates at the surface, as a measure of the surface segregation tendency. These two quantities are good indicators of how much the surface is covered by blocking precipitates, and how much Sr has come out of the perovskite lattice. We produced LSC64 pellets and subjected them to annealing at 800 °C in stagnant air to drive the surface cation segregation. The chemical state of the pellets' surface was characterized by X-ray photoelectron spectroscopy and Auger electron spectroscopy. Then, we assessed the crystal orientation effect on dopant cation segregation using scanning electron microscopy and electron backscatter diffraction methods. The statistical evaluation of the segregated secondary phase particles indicated very similar secondary phase formation in terms of number density on each grain orientation. On the other hand, grains having orientations close to {001} had more than 3 times higher precipitate surface area coverage compared to the other orientations, {101} and {111}. This orientation dependent behavior indicates that the exposed facet and termination layer have a significant impact on the dopant cation segregation.
2. Experimental methods
Commercially available LSC64 powder (CerPoTech, Norway) was uniaxially pressed into disks with a pressure of 100 MPa, and sintered at 1350 °C in stagnant air for 12 h. A 5 °C min−1 ramp rate was applied for both heating and cooling steps. Four identical pellets having dimensions of ∼25 mm diameter and ∼5 mm thickness were produced following the same procedure. One surface of the sintered pellets was polished using alumina suspensions having a particle size of 1 μm, 0.3 μm, and 0.05 μm, respectively. Thereafter, two of the pellets were annealed at 800 °C in stagnant air for different durations, 2 h and 5 h; one pellet was annealed at 800 °C in synthetic air for 5 h, and one was annealed at 800 °C in pure oxygen for 5 h. The surface morphology of the pellets annealed in synthetic air and pure oxygen is reported in the ESI (see Fig. S1 of the ESI†).X-ray diffraction (XRD) measurements were performed with a Rigaku SmartLab spectrometer using Cu Kα radiation at 45 kV and 200 mA in Bragg–Brentano geometry. The crystal structure of the specimens was determined before and after the annealing procedure.
The near-surface chemistry was studied by X-ray photoelectron spectroscopy (XPS), using monochromated Al Kα (1486.65 eV) X-rays. The cation compositions on the samples were quantified based on the La 4d, Sr 3d, and Co 2p peaks using KolXPD 1.8.0 software. A Physical Electronics Model 700 scanning nanoprobe Auger electron spectroscopy (AES) instrument was also used to measure the chemical content of the pellets' surface with high spatial resolution. 20 keV and 10 nA were used as the beam setting for both imaging and Auger electron excitation. The La MNN, Sr LMM, Co LMM and S LMM Auger emissions were measured for quantifying the surface cation composition of the LSC64 pellets. Quantification of the AES differential spectra was performed using peak-to-peak intensities of the tight-scans of the noted emissions from the survey scans. The probing depths were about 8.0 nm for Sr LMM, 4.0 nm for La MNN, 4.5 nm for Co LMM and 5.5 nm for S LMM emissions. The standard sensitivity factors (Physical Electronics Inc., 2006) were used for the chemical quantification using AES. However, the actual sensitivity factors for these emissions in the LSC64 pellets may vary compared to the standards. Therefore, the quantification of the cations was calculated in a relative manner instead of using the absolute values of the surface chemical content in AES results.
The surface of the pellets was investigated using a Zeiss-Merlin scanning electron microscope (SEM) to survey and compare the cation segregation at each stage of annealing. Secondary electron imaging, using a 3 kV accelerating voltage and 161 nA current, was performed in order to obtain as surface sensitive and high contrast images as possible. A selected region, having a 120 × 140 μm2 area, on the surface of the annealed pellets was analyzed by the electron backscatter diffraction (EBSD) technique to determine the crystal orientation of grains in the related area. EBSD measurements were performed with a Hikari camera integrated SEM using a 20 kV accelerating voltage and 5 nA beam current. A 5 × 5 binning size (128 × 96) and 0.1 μm step size were used in orientation imaging microscopy data collection software (OIM, TexSEM Labs USA) to optimize the analysis. Subsequent to the determination of grain orientations, the selected areas were further investigated by SEM in order to analyze the cation segregation behavior on each grain. Multiple micrographs were taken for each grain to visualize the entire area of the corresponding grain. The micrographs then were processed using ImageJ software in order to determine both the number density of precipitates and the respective area coverage of precipitates within the particular area. This statistical evaluation was applied to more than 300 grains in total.
3. Results and discussion
3.1. Structure of LSC64 pellets
Fig. 1 shows the XRD patterns of the LSC64 powder, the pellets sintered in air at 1350 °C for 12 h, and the pellets annealed in air at 800 °C for 2 h and 5 h following the sintering and polishing steps. The XRD patterns indicated a pseudo-cubic perovskite phase for all specimens. It is clear that more defined peaks, compared to the as-received powder, were observed following the sintering and annealing procedures due to grain growth and possibly a higher degree of crystallinity. The pseudo-cubic out-of-plane lattice parameters were very similar for each specimen, calculated to be 3.832 Å, 3.835 Å, 3.833 Å and 3.831 Å for the as-received powder, sintered pellet and pellets annealed for 2 h and 5 h, respectively. The reference peak positions of cubic LSC64, PDF 01-080-6496, are also included in Fig. 1 for comparison. It exhibits a good fit with the measured diffraction patterns.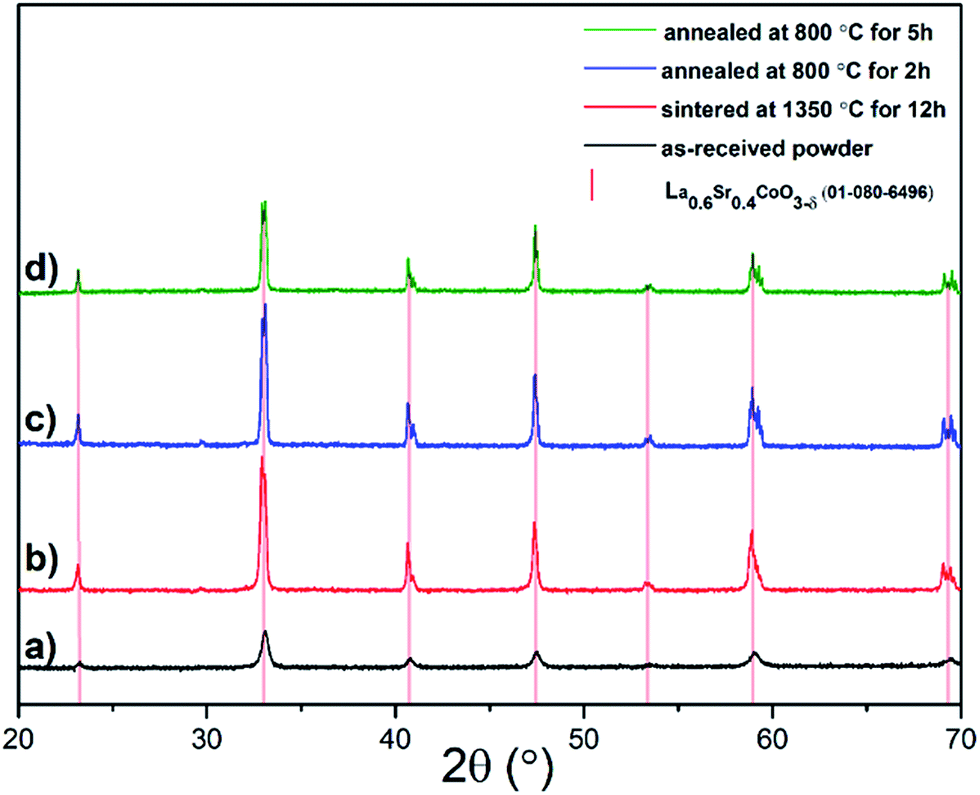 | ||
Fig. 1 XRD patterns of LSC64: (a) the as-received powder, (b) the pellet sintered in air at 1350 °C for 12 h, and the pellet annealed in air at 800 °C for (c) 2 h and (d) 5 h. The stick pattern of cubic R![[3 with combining macron]](https://www.rsc.org/images/entities/char_0033_0304.gif) m LSC64, PDF 01-080-6496, is also added. m LSC64, PDF 01-080-6496, is also added. | ||
3.2. Precipitate formation at the surface of LSC64
The surface of LSC64 pellets was investigated before and after each heat treatment by SEM in secondary electron imaging mode, and the micrographs are given in Fig. 2. An SEM micrograph of commercial LSC64 powder is also shown in Fig. 2. The commercial powder was mostly composed of sub-micron sized particles with some degree of agglomeration. Following the pressing and sintering procedures, the pellets' surfaces exhibited a typically dense, smooth and pore-free structure, having grains on the order of 10 μm in size. However, a small number of pores appeared after removal of a few microns from the top layer of the pellets by polishing. This indicates that the applied pressing and sintering conditions left a partially porous structure within the pellets. Based on the pore area at the surface in these SEM images (in particular the polished pellet after sintering, Fig. 2(c)), we estimate the density of pellets to be 97.25% ± 0.20.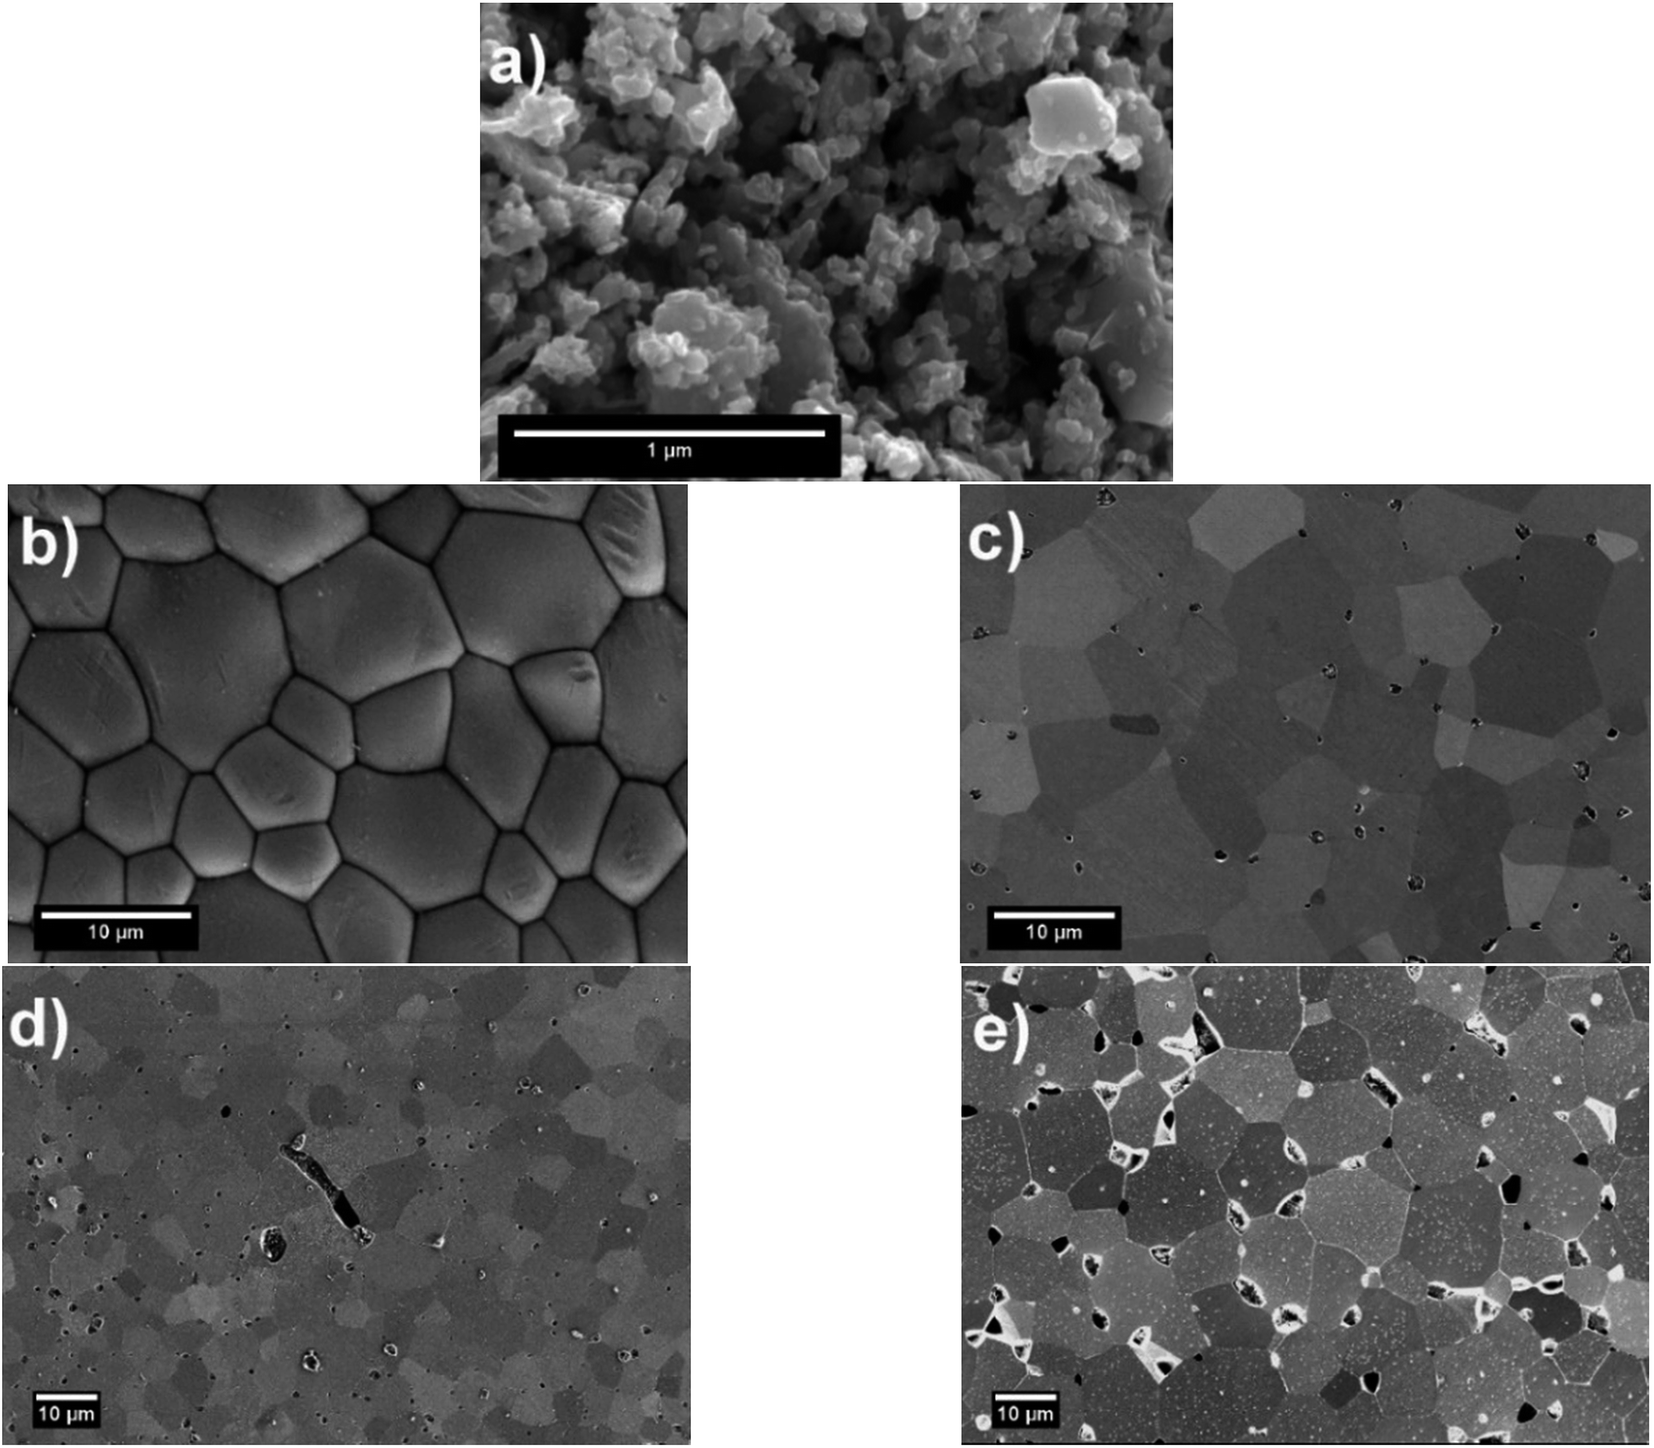 | ||
| Fig. 2 The SEM micrographs (secondary electron image mode) of (a) commercial LSC64 powder, (b) the sintered pellet at 1350 °C, (c) the polished pellet after the sintering, and the pellets annealed at 800 °C for (d) 2 h and (e) 5 h. | ||
The SEM micrographs of the annealed samples display the formation of particles on the pellets' surface upon polishing and annealing at 800 °C. The size of these precipitates varies with annealing time; longer annealing forms larger particles with a lower number density. This indicates that the particles gather and coarsen with time during annealing. More importantly, the precipitates form in a different manner on each grain. Fig. 3 shows that the precipitation behavior was both quantitatively and dimensionally different on each grain. While some grains accommodate many large precipitates on their surface, other grains have a rather limited amount of precipitates. This grain-dependent precipitation behavior is valid for both annealing durations, 2 h and 5 h. This suggests that different crystal orientations play a role in the cation segregation.
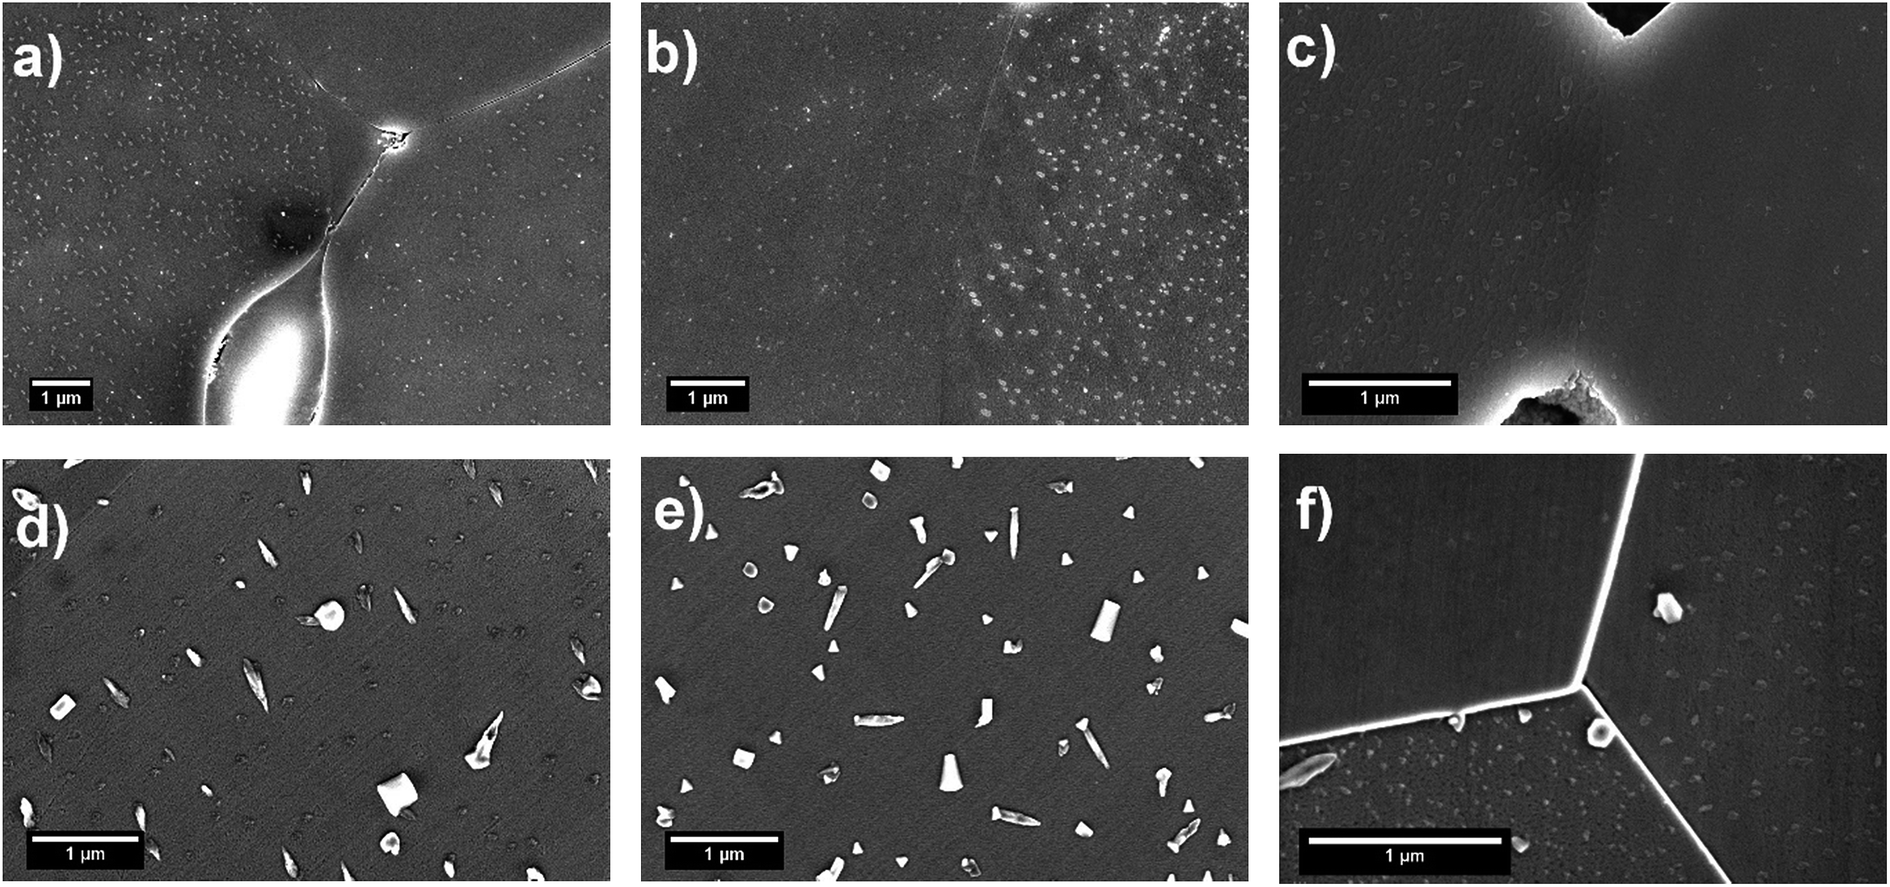 | ||
| Fig. 3 SEM micrographs (secondary electron image mode) showing the grain dependence of secondary phase precipitate formation at the surface of LSC64 pellets annealed at 800 °C in stagnant air for 2 h (a–c) and for 5 h (d–f). | ||
3.3. Surface cation chemistry of the LSC64 pellets
The surface chemistry of the LSC64 pellets after each heat treatment was characterized via nano-probe AES and XPS. The results of these ex situ measurements to determine the change in the Sr/(Sr + La) and (Sr + La)/Co ratios are given in Fig. 4. Here, the chemical information provided by the spatially resolved nano-probe AES represents the bare surface (particle-free) regions only, since the compositions of the particle-free regions and the precipitates are dissimilar on the LSC64 pellet. This is not the case in XPS measurements where the signal simultaneously arises from the particle-free regions and the precipitates at the surface.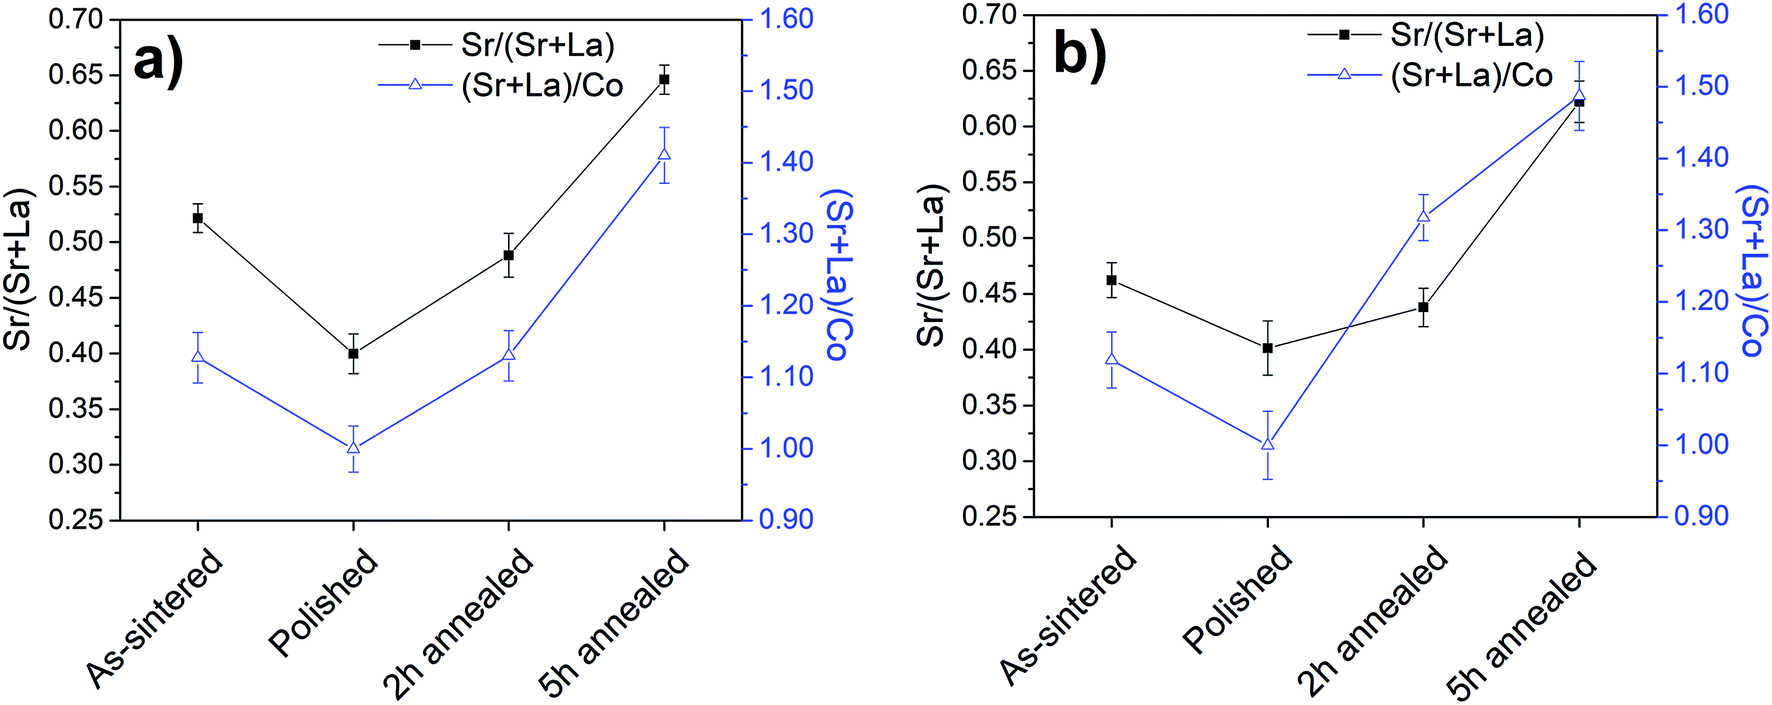 | ||
| Fig. 4 Surface chemistry of LSC64 pellets characterized by (a) nano-probe AES and (b) XPS. The quantification shown from AES refers only to the particle free-regions of the LSC64 pellet surface. | ||
XPS and AES results were in good agreement for each state of the pellets' surface. The Sr/(Sr + La) ratio at the surface of the as-sintered pellet was determined to be 0.52 ± 0.01 and 0.46 ± 0.02 by AES and XPS, respectively. After this step, the polished state should exhibit the stoichiometric cation compositions of Sr/(Sr + La) = 0.4 and (Sr + La)/Co = 1.0. The Sr/(Sr + La) ratio as calculated from the AES and XPS data, respectively, was indeed stoichiometric at the surface of the polished pellet, 0.39 ± 0.01 and 0.40 ± 0.02. However, the (Sr + La)/Co ratio was 2.34 ± 0.07 and 2.36 ± 0.11 as calculated from the AES and XPS data, respectively, when using the standard sensitivity factors included in the analysis software noted in the Experimental methods section. Given the potential uncertainties in the used sensitivity factors, and since this polished surface should expose the stoichiometric composition at the surface, we take the (Sr + La)/Co ratio at this state to be the reference, that is (Sr + La)/Co = 1.0 (and normalize the (Sr + La)/Co ratio at the other states to this value of 2.35). Further annealing of pellets at 800 °C for 2 h and 5 h induced A-site enrichment at the surface and the (Sr + La)/Co ratio increased to 1.41 ± 0.04 and 1.48 ± 0.05 (normalized to the polished state) by AES and XPS, respectively for the 5 h annealed LSC64 pellet. The Sr/(Sr + La) ratio at the pellet surface after annealing for 5 h was 0.65 ± 0.01 and 0.62 ± 0.02 as calculated by AES and XPS, respectively. This indicates that the A-site enrichment at the surface was dominated by the Sr cation. In order to reveal the chemical composition of the precipitates, LSC64 pellets were further characterized by the nano-probe AES. As an example, the analysis of the LSC64 pellet annealed at 800 °C for 2 h, having both small and large size precipitates on its surface, is given in Fig. 5 and Table 1. In the analysis, Point 1 represents a small precipitate, Points 2 and 3 represent large, sharp-edged precipitates and Point 4 represents the precipitate-free zone at the surface of LSC64. Large precipitates are almost completely composed of Sr, where the Sr/(Sr + La) ratio reaches ∼0.9 and the (Sr + La)/Co ratio is higher than 8.0. Additionally, S emission was also detected in the case of large precipitates, at the level of 2–3%.
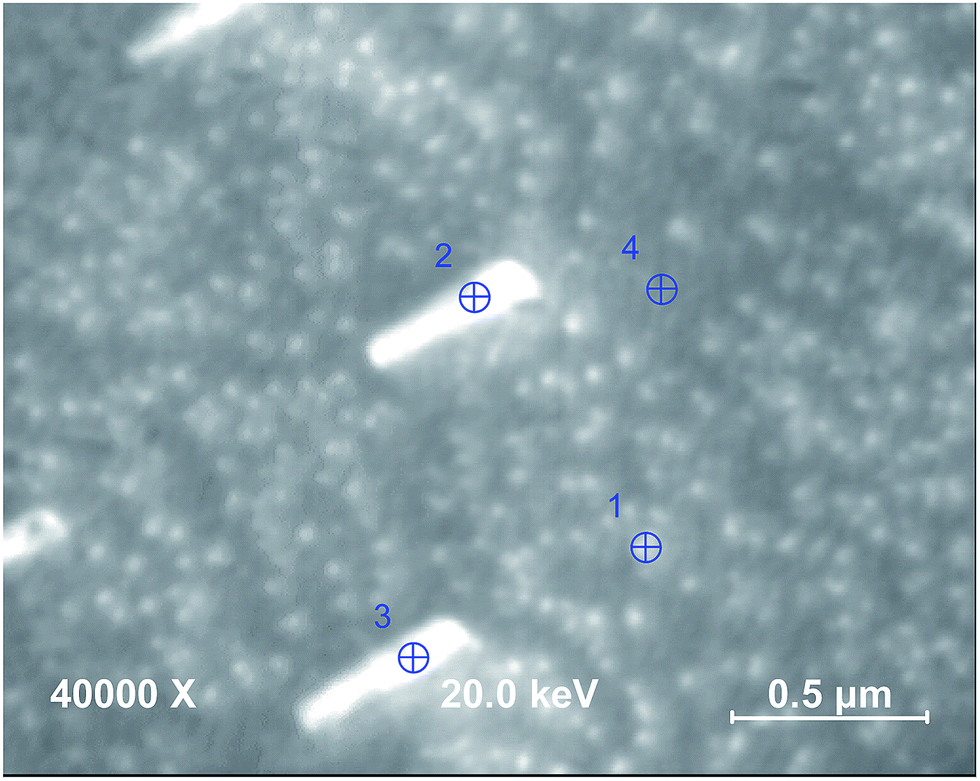 | ||
| Fig. 5 SEM micrograph of the LSC64 pellet annealed at 800 °C in stagnant air for 2 h. Point 1 represents small size precipitates, and Points 2 and 3 represent large size precipitates. Point 4 represents the precipitate-free zone at the surface. | ||
| Sr/(Sr + La) | (Sr + La)/Co | S/(Sr + La + Co + S) | |
|---|---|---|---|
| Point 1 | 0.64 | 3.09 | 0.00 |
| Point 2 | 0.86 | 7.64 | 0.03 |
| Point 3 | 0.88 | 8.10 | 0.03 |
| Point 4 | 0.42 | 1.10 | 0.00 |
The Sr/(Sr + La) and (Sr + La)/Co ratios were ∼0.65 and ∼3.09, respectively, on the small precipitates, less than 40 nm in size. Here, it should be noted that the spatial resolution of AES (<50 nm) may be larger than the actual size of the small precipitates. Thus, the analyzed chemistry includes both the particle and some region of the precipitate-free zone around the particle. Point 4, representing the precipitate-free region of the LS64 pellet surface, has a Sr/(Sr + La) ratio close to the stoichiometric ratio but slightly higher, and the (Sr + La)/Co ratio was ∼1.10. This indicates Sr enrichment on the surface and it is consistent with previous results. Unlike for the large precipitates, S emission couldn't be detected on Points 1 and 4. Either the bare surface and small precipitates don't have S, or the amount of S is below the detection limit of AES. In this respect, it can be deduced that S may contribute to the growth of the Sr-rich precipitates. It has been observed that S, possibly present in the ambient atmosphere during sintering and annealing or as an impurity in the powder, can react with LSC and forms species like SrSO4 and La2O2SO4.31
These findings on the Sr-rich surface layer, and Sr-oxide related precipitates are also consistent with our previous study22 where a Sr-enriched layer at the top surface of a Ruddlesden–Popper type LSC was found upon annealing at 500 °C. In that earlier work, the presence of Sr-rich secondary phase particles was confirmed by STEM/EDS. The quantification had revealed that the particles were composed almost entirely of Sr and O. Depth profiling of compositions by LEIS together with the atomic resolution images obtained by STEM demonstrated the existence of a Sr-poor and Co-enriched layer beneath the surface. Given the similar chemistry of the perovskite studied in this work, we believe that a similar subsurface chemistry may hold here.
3.4. Determination of the crystal orientation of grains at the surface of LSC64
LSC64 pellets, annealed in air at 800 °C for 2 h and 5 h, were analyzed by EBSD to determine the grain orientations. An area of 120 × 140 μm2 was investigated for each sample. Two possible crystal structures, i.e. rhombohedral (Rc) and cubic (Pmm), were both considered in EBSD analyses of pellets. The confidence index (CI) in the range from 0 to 1, revealing the matching between the structure considered and the data collected in the analysis, was used for the determination of the crystal structure.32 CI was determined to be 0.86 and 0.92 using the cubic crystal structure for pellets annealed at 800 °C for 2 h and 5 h. On the other hand, in the case of the rhombohedral structure, CI was less than 0.15 for the same pellets. Therefore, the determination of grain orientations was performed by taking the cubic crystal structure (Pmm).
An example of the inverse pole figure (IPF) map for the 2 h annealed sample is given in Fig. 6. Here, IPF mapping uses a basic red-green-blue (RGB) coloring to assign the grain orientations. In the case of the applied cubic system, full red, green and blue colors represent the grains having (001), (101) and (111) orientations, respectively. Intermediate orientations are colored by mixing of these three basic colors. IPF maps pointed out that grains in the selected area are randomly oriented, as expected for a polycrystalline sample. The grains were mostly composed of intermediate orientations instead of basic crystallographic orientations within the scanned area. In order to analyze the correlation between the crystal orientation and the cation segregation tendency, the orientations were grouped in a way that they are close to the three major crystallographic orientations, {001}, {101} and {111}. In doing so, the grain orientations were grouped into selected cubic orientations with tolerance angles of 10, 15 and 17.5°. The IPF maps processed upon selected tolerance angles are also shown in Fig. 6. Here, it is expected that the grains having similar colors, which are grouped with a smaller tolerance angle, should have similar surface energies. On the other hand, a larger tolerance angle results upon grouping the grain orientations in a wider range, and so the surface energy of the grains can vary more significantly within these groups. That's why only the grouping within the 10° tolerance angle was considered for the statistical quantification of segregation versus grain orientation. The larger tolerance angles are only used for representing the change in the segregation trend with increasing angles.
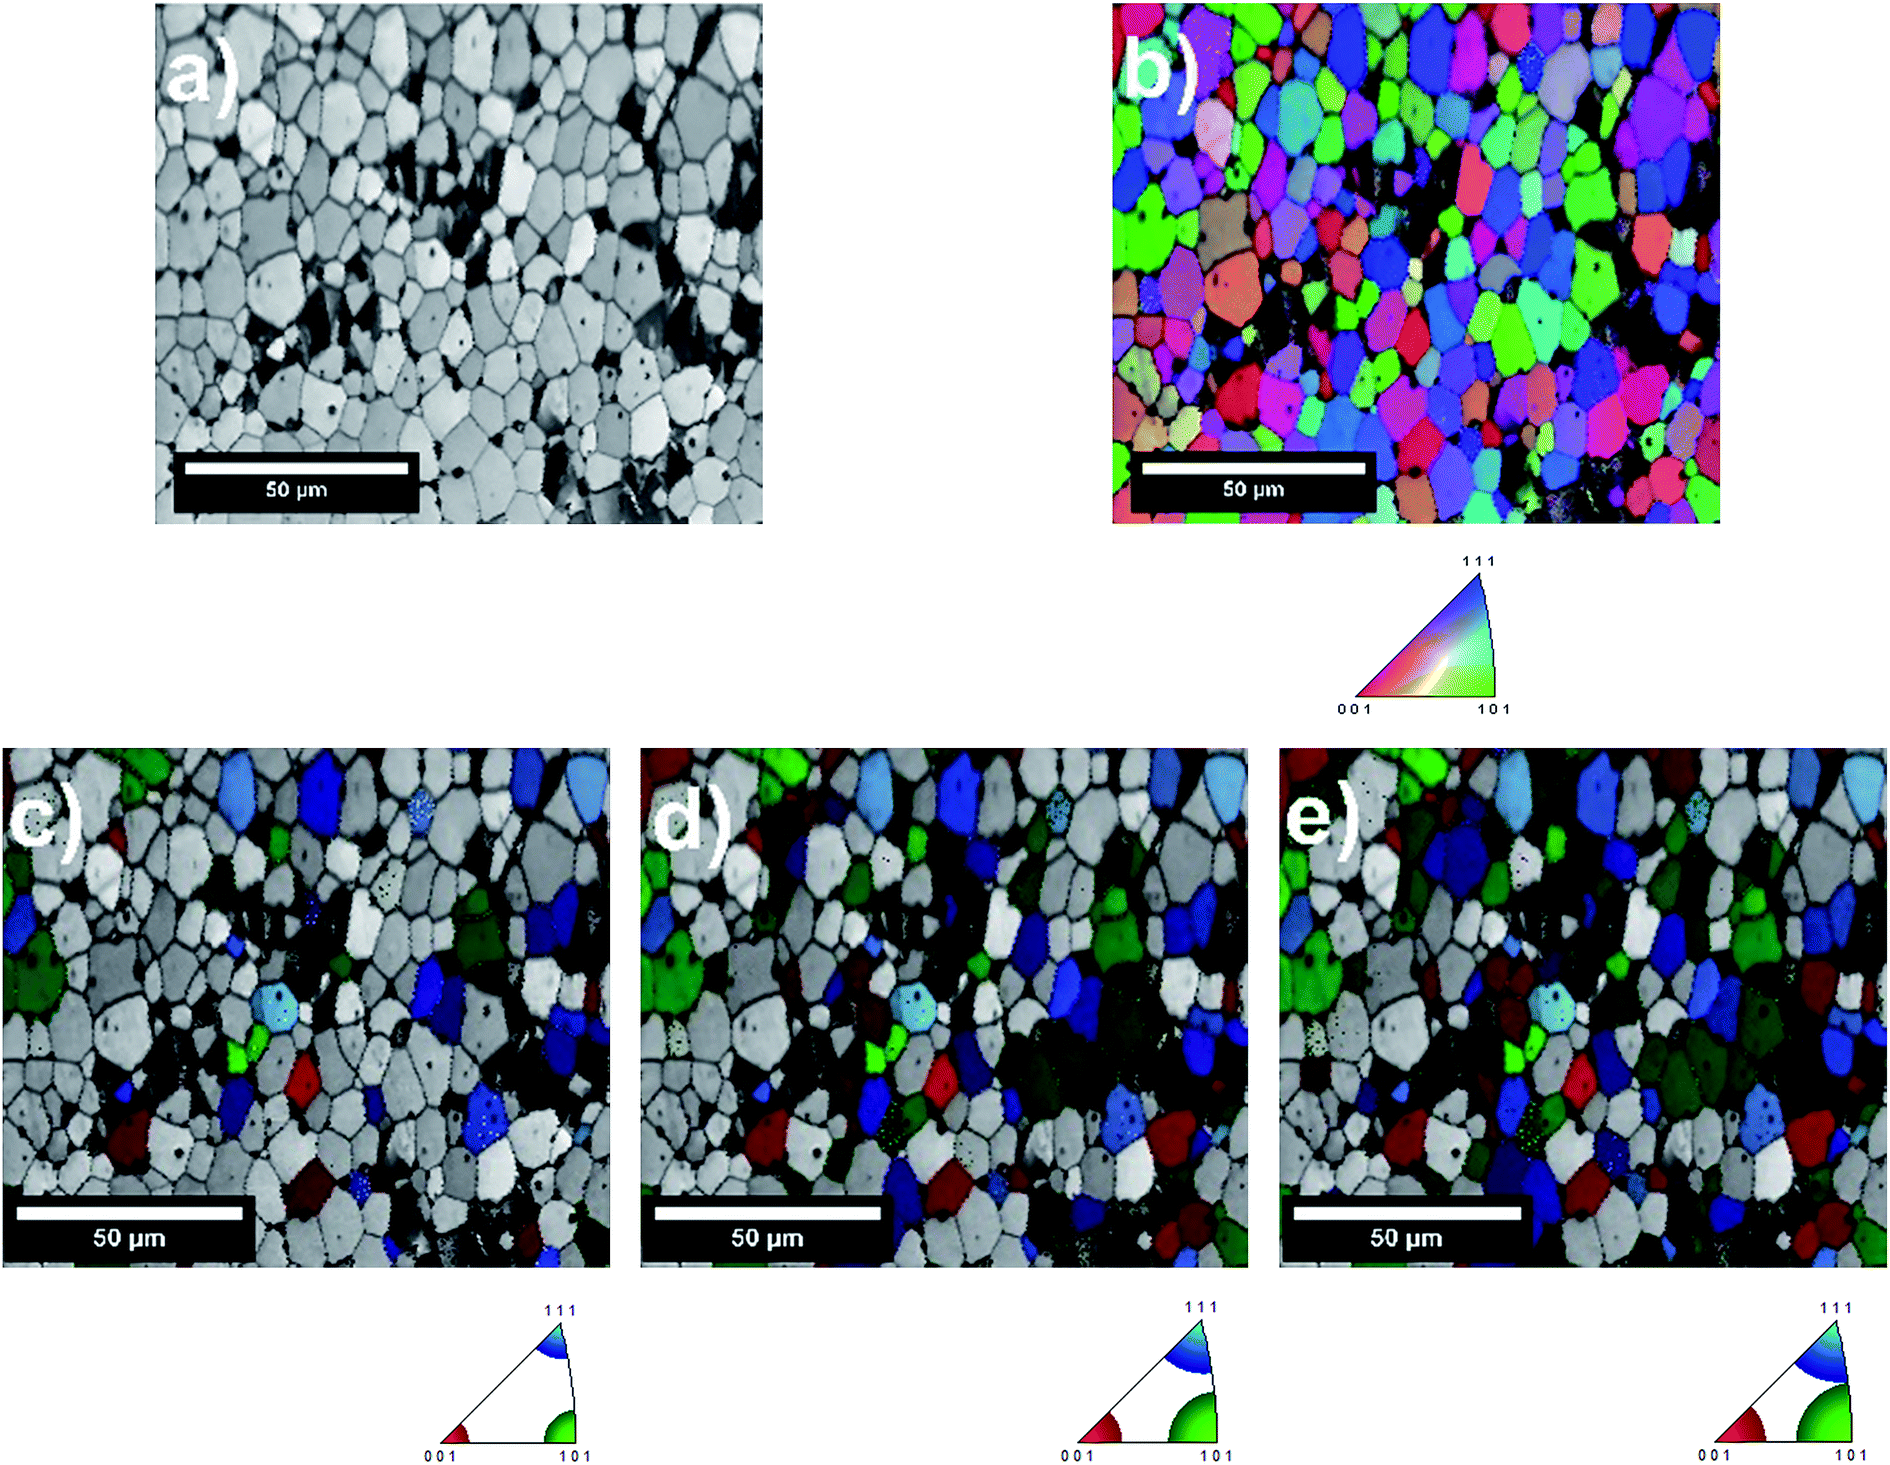 | ||
| Fig. 6 (a) SEM secondary electron image of a scanned area in EBSD. (b) IPF map determined by EBSD analysis and the maps grouped within {001}, {101} and {111} grain orientations with tolerance angles of (c) 10°, (d) 15° and (e) 17.5°. | ||
3.5. Statistical evaluation of the relation between crystal orientation and Sr-rich precipitates on LSC64
The grains located in the EBSD maps were examined in more detail via SEM. Multiple micrographs were taken to visualize the entire area of each grain. The micrographs then were processed using ImageJ software in order to determine both the total number of precipitates and the area coverage of the precipitates within the particular area. This image processing consists of three steps: (i) improvement of the image contrast between the precipitates and the background (precipitate-free surface regions) using a fast Fourier transform (FFT) filter, (ii) setting a threshold value to subtract the background, and (iii) quantification of both the precipitate number density and the area coverage of the precipitates in the chosen area. A graphical representation of the process is given in Fig. 7. All micrographs covering more than 300 grains within the chosen areas on each pellet were processed with the same approach.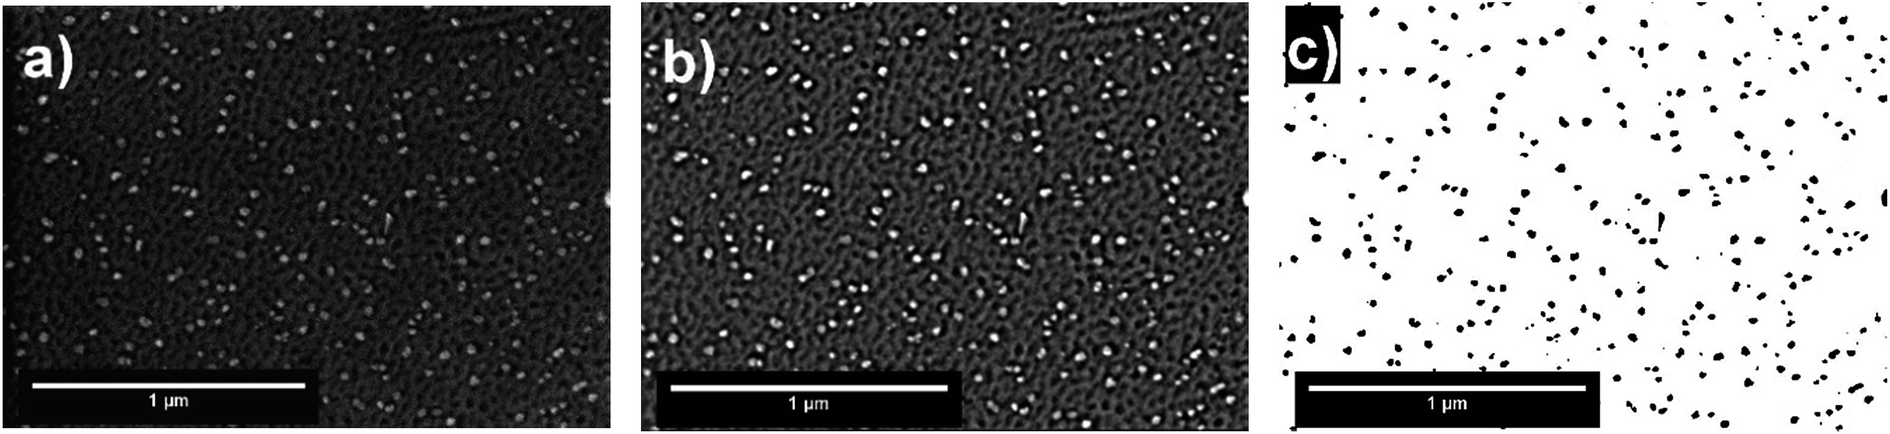 | ||
| Fig. 7 (a) SEM secondary electron image of an area within a grain having some precipitates. (b) The same SEM image as in (a), with improved contrast upon applying the FFT filter. (c) The same SEM image as in (b), after performing background subtraction. The number density and area coverage of precipitates were calculated on the images after background subtraction. | ||
The number density and the area coverage of precipitates were calculated for each grain within selected areas on samples that were annealed at 800 °C for 2 h and for 5 h. The results then were matched with the grain orientations determined by EBSD on each grain as explained above.
This statistical quantification of the grain orientation versus precipitate density and coverage revealed two key results. First, all orientations scanned in the analysis had a very similar number density of Sr-rich precipitates. Second, the area coverage of the Sr-rich precipitates is the highest on the {001} grains. These results are detailed as follows. Using the tolerance angle of 10° (Fig. 8(a)), the majority of the grains (∼45%) had a precipitate number density in the range of 1–5 precipitates per μm2. Considering the average grain diameter in the pellets as 10 μm, it can be deduced that the number of precipitates on a grain is mainly in the range of 75–375 particles. The second major accumulation of the precipitate number density is in the range of 5–10 precipitates per μm2, covering ∼20% of the grains. The precipitate number density of the rest of the grains spread out in a wider range of 10–60 precipitates per μm2. At the maximum, the number of segregated secondary particles on a single grain could reach up to 4750 precipitates, amounting to 60 precipitates per μm2. The distribution of precipitate number density due to the grain orientation was also calculated for the tolerance angles of 15° and 17.5° (Fig. 8(b and c)). The trend is also similar for these higher tolerance angles, indicating that the number density of precipitates is independent of crystal orientation. While Fig. 8 shows a combination of results at the surface of LSC64 pellets annealed for 2 h and 5 h, the separate results show the same trends as seen in Fig. S2.†
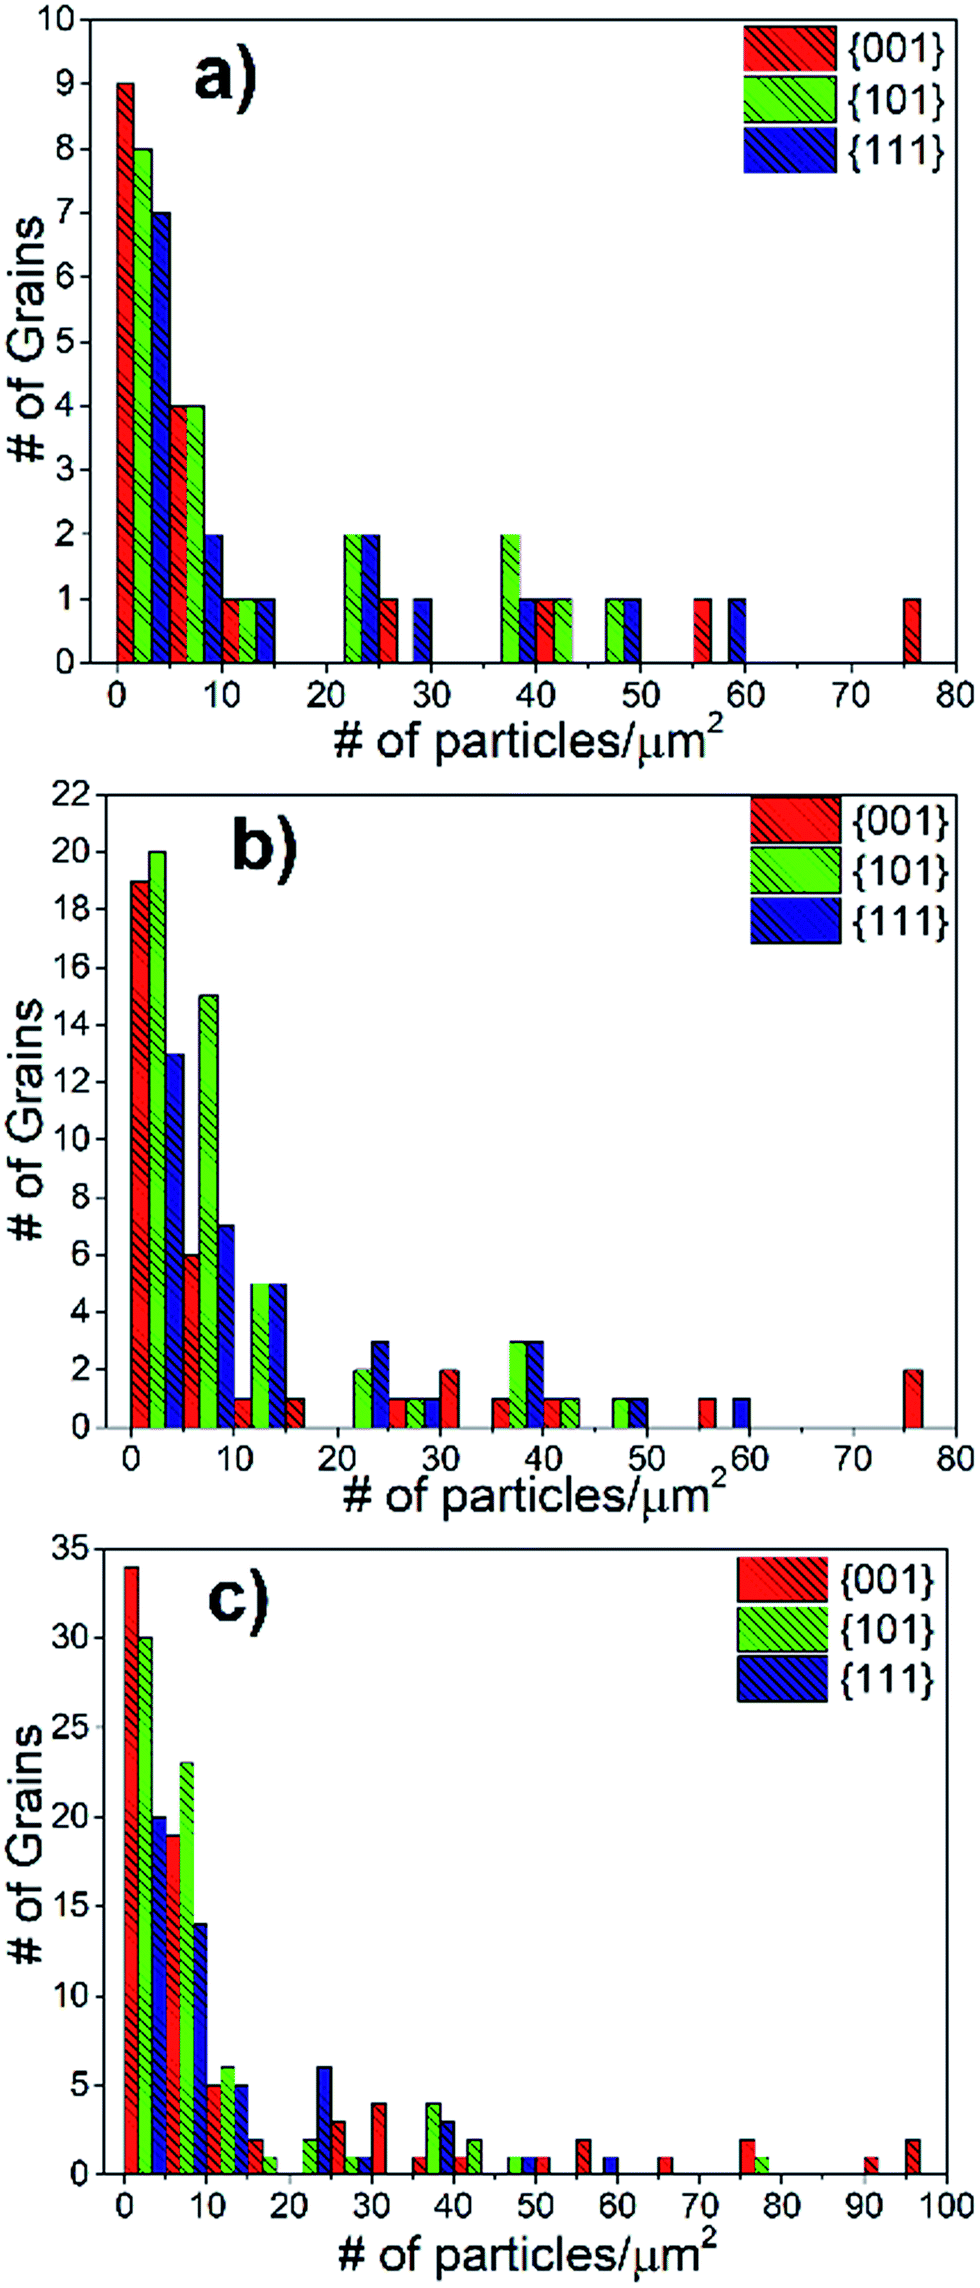 | ||
| Fig. 8 The total distribution of precipitate number density on differently oriented grains at the surface of LSC64 pellets annealed at 800 °C for 2 h and 5 h. The grain orientations were processed with (a) 10°, (b) 15° and (c) 17.5° tolerance angles from the major orientations. | ||
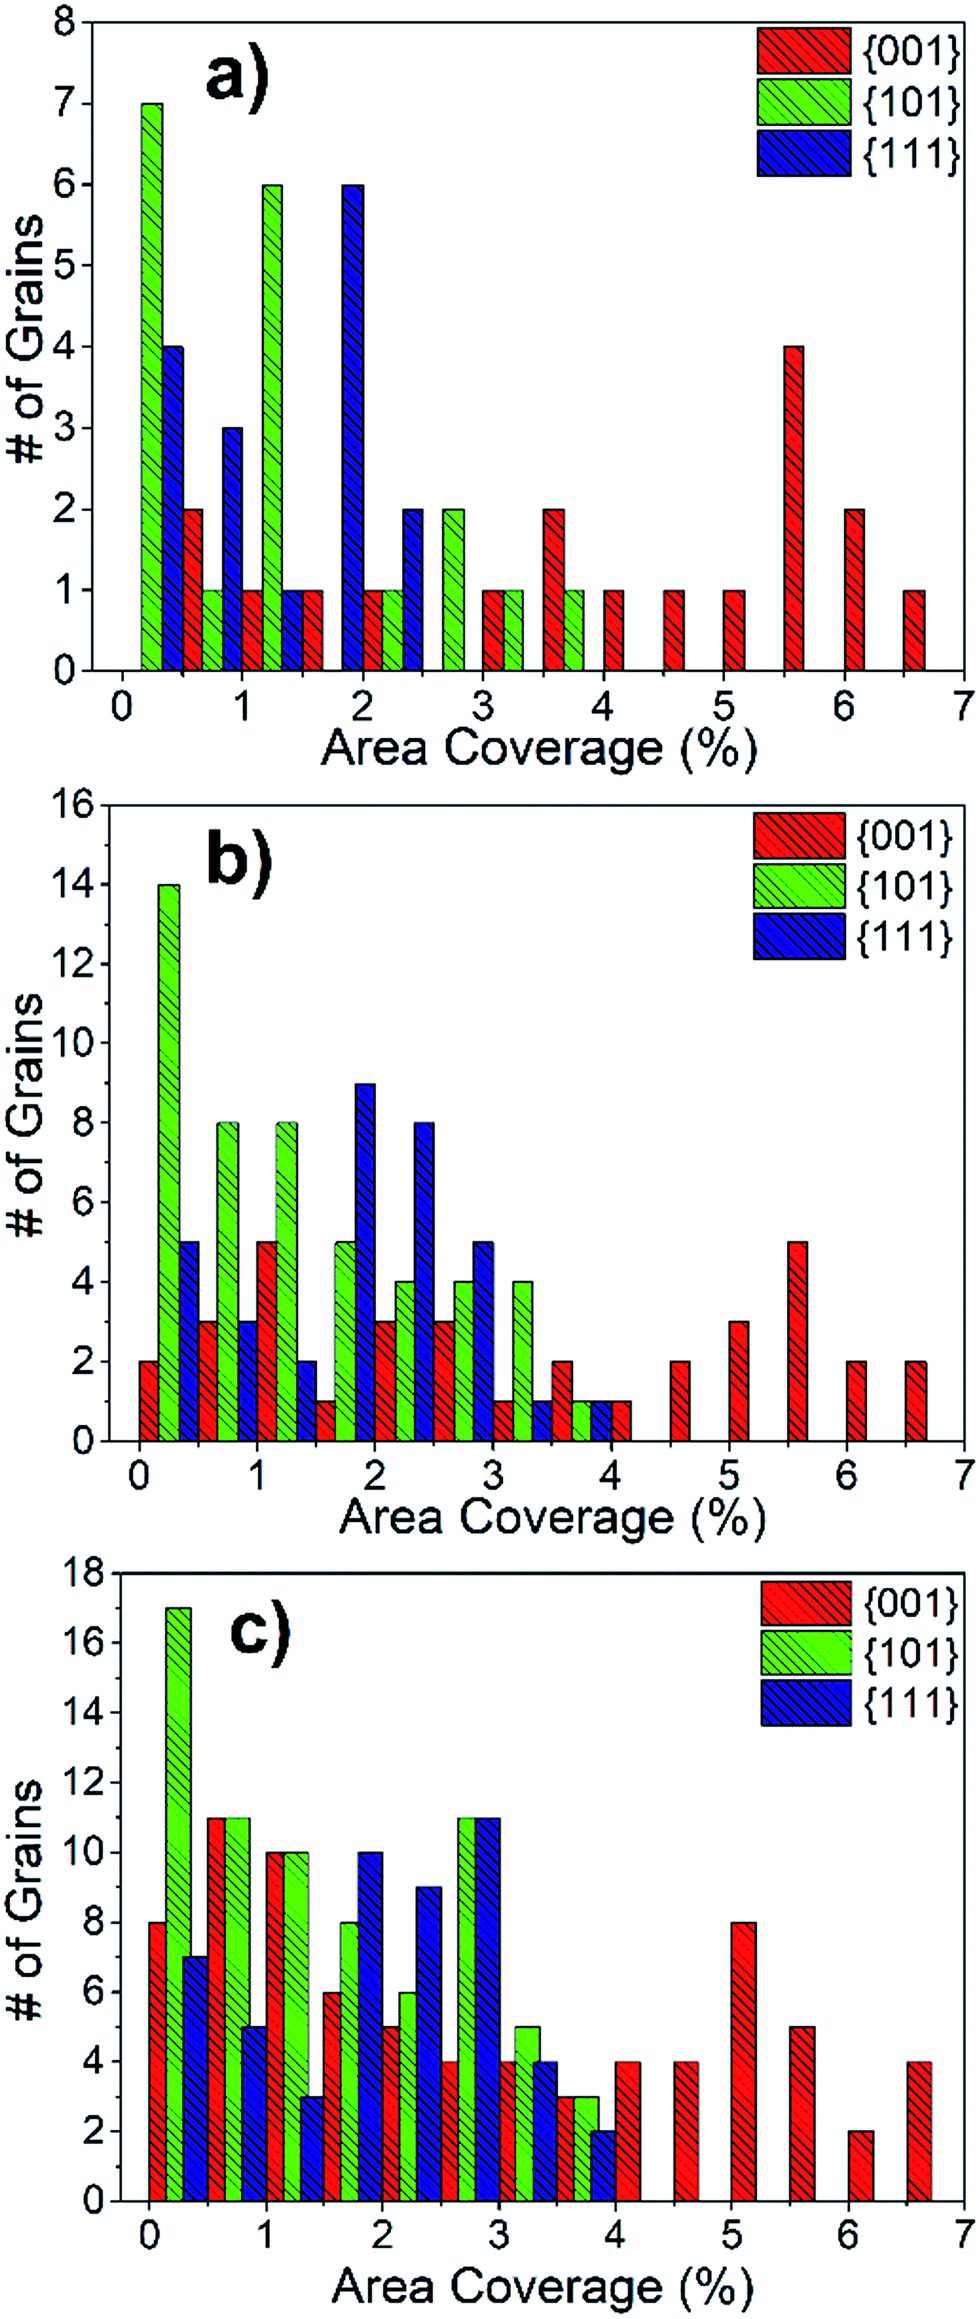
The area coverage of precipitates on each grain was also calculated and correlated to the grain orientations. The statistical evaluation over 300 grains revealed that the orientations that are close to {001} have a much higher precipitate area coverage compared to the {101} and {111} oriented grains. The distribution of precipitate area coverage as a function of grain orientation, using 10° tolerance angle, is given in Fig. 9(a). Importantly, the area coverage of precipitates exhibits a strong dependence on grain orientation, whereas this was not the case for number density. This is because the Sr-rich secondary phases formed on the {001}-oriented grains are relatively larger in size compared to those on the {101} or {111}-oriented grains. The area coverage of precipitates is in the range of 0.5–7%, 0.1–4% and 0.1–2.5% for {001}, {101} and {111}-oriented grains, respectively. The area coverage of precipitates due to grain orientations was also calculated for 15° and 17.5° tolerance angles (Fig. 9(b and c)). The analysis with these larger tolerance angles also demonstrates that the area coverage on the {001} grains is larger, but the distribution on the {101} and {111} grains is more spread, as expected given the larger deviation from the major orientations. While Fig. 9 shows a combination of results at the surface of LSC64 pellets annealed for 2 h and 5 h, the separate results show the same trends as seen in Fig. S2.†
 | ||
| Fig. 9 The total distribution of precipitate area coverage on differently oriented grains at the surface of LSC64 pellets annealed at 800 °C for 2 h and 5 h. The grain orientations were processed with (a) 10°, (b) 15° and (c) 17.5° tolerance angles from the three major orientations. | ||
The average precipitate number density as a function of grain orientation was also calculated and was very similar for the three major grain orientations (Fig. 10(a)). Since the number density of precipitates is very similar for crystal orientations, it can be deduced that the nucleation site density for the Sr-rich secondary phases is also very similar for the differently oriented grains.
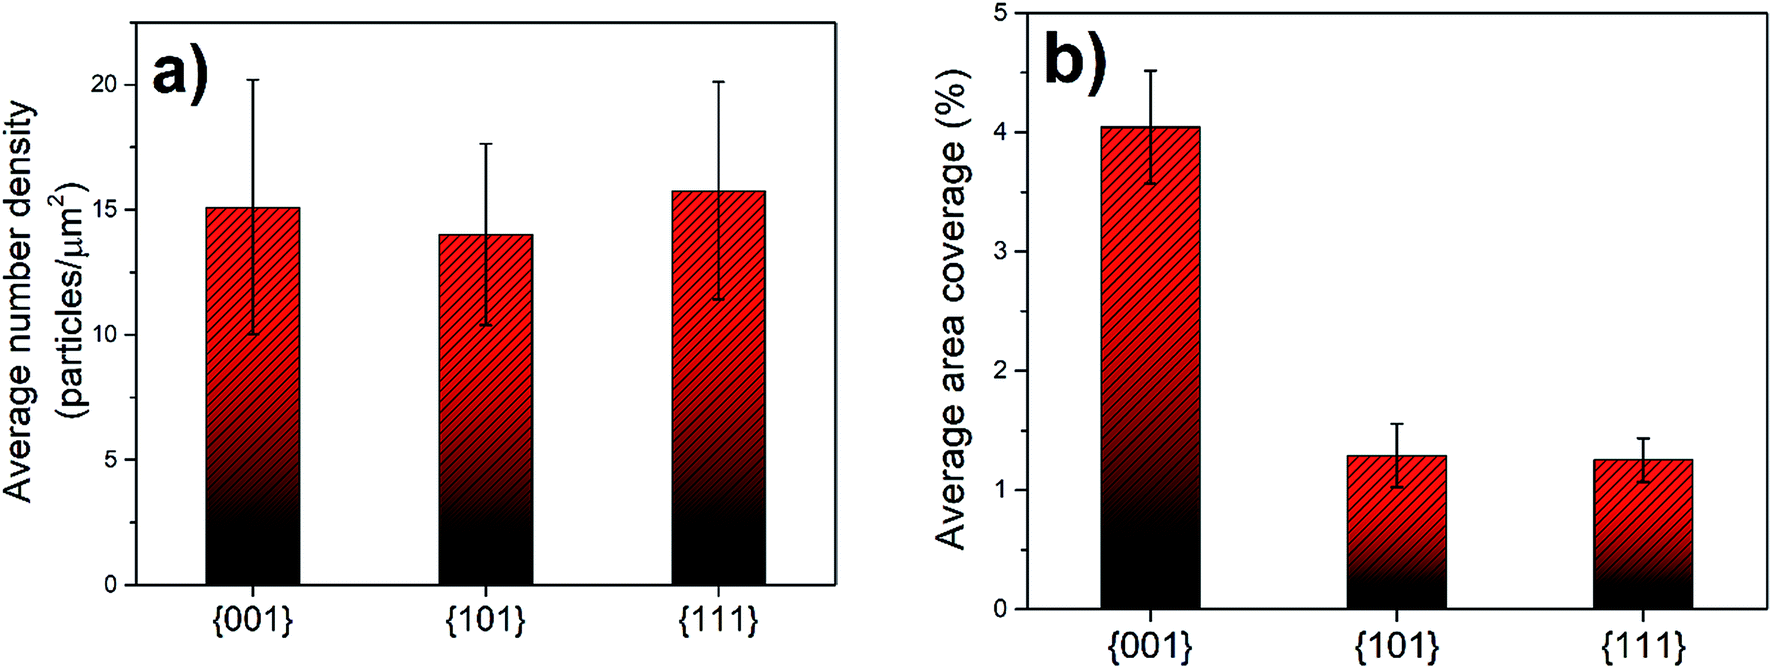 | ||
| Fig. 10 (a) Average of precipitate number density and (b) average of precipitate area coverage on the three selected main orientations, {001}, {101} and {111}, at the surface of LSC64 pellets annealed at 800 °C for 2 h and 5 h. | ||
In order to illustrate the grain orientation effect more clearly, the area coverage of the Sr-rich precipitates was calculated (Fig. 10(b)). The average precipitate area coverage on the {001}-oriented grains is more than 3 times higher than that on the {101} and {111}-oriented grains. The values are very similar for the {101} and {111}-oriented grains. Examining Fig. 10(a) and (b), we can conclude that the {001}-oriented LSC64 grain surfaces are covered more extensively by the insulating Sr-rich secondary phase particles. We note that, while the data shown in Fig. 8, 9, and 10 represent grains cumulatively from the two LSC64 pellets annealed for 2 h and for 5 h, the resulting trends (grain orientation dependence of the segregation area) are valid when the data are analyzed for each separate annealing time (see Fig. S2 of the ESI†).
It is also interesting to note that in a very recent study the coverage of SrOx precipitates was also shown to depend on grain crystal orientation on La0.6Sr0.4Co0.2Fe0.8O3−d (LSCF).33 However, due to the pseudo-symmetry problem, the absolute grain/twin orientation could not be uniquely determined, and so a quantitative relation between grain orientation and precipitate coverage or density was not possible to establish on LSCF. We believe that a similar relationship may hold for the LSCF surface as shown for LSC here, but a more quantitative analysis will be needed to confirm this.
3.6. Discussion on implications
In the literature, there are a large number of studies demonstrating that the formation of Sr-rich oxides or termination layers on perovskite oxides is detrimental and reduces the ORR kinetics.6,10,17,19,22,34 The degradation on LSC at elevated temperatures renders itself in two apparent ways. These are the formation of Sr-rich precipitates at the surface, as in the present study, and the formation of a thin SrO termination layer at the top surface shown by low energy ion scattering and by ICP mass spectroscopy.17,19,24,35 As a result of this surface chemical degradation, LSC loses its reactivity to ORR typically up to two orders of magnitude in the presence of such Sr-rich precipitate formation, as shown in the literature including our own previous reports.17,19 The apparent area coverage by such insulating precipitates is 0.1–7.0% in this work, and at the most up to 30% in our previous work studying thin films.22 These “partial coverages” by insulating precipitates alone cannot be responsible for the orders of magnitude loss in ORR kinetics. Formation of a complete but thin SrO termination layer is likely more detrimental than the few % coverage of insulating Sr-rich precipitates at the surface. Here, by using XPS or AES with a depth resolution of several nm, we cannot conclude whether that's the case. However, both scenarios discussed above result in the depletion of Co at the top surface and the depletion of Sr at the subsurface region. These change the chemistry at the termination layer and causes a reduction in the electron and ion transport properties of the subsurface region, and so degrading the ORR kinetics. Therefore, based on these already published and well-established relations of SrO segregation (precipitate as well as SrO termination) to degraded ORR kinetics, we can reasonably argue that the {001} grains that segregate more SrO on LSC will lose their surface reactivity relatively more than on other grains. We can conclude that the “relative reduction of reactivity to the ORR”, or relative degradation, is more significant on the {001} grains compared to {110} and {111} grains.In this work, we refrain from suggesting an absolute reactivity comparison among different orientations. In order to obtain clear and undebatable relations of grain orientations on ORR kinetics, one needs single crystals of the perovskite catalyst (LSC in this case) to measure the ORR (or oxygen exchange) kinetics on differently cut single crystals. Such single crystals of LSC do not exist yet in the field. Alternatively, thin films of different orientations on different substrates could be used, but this approach introduces potential artefacts related to interface space charge or strain. As a result, showing direct and undebatable data on the relative reactivity to the ORR among the different orientations is out of the reach of our current work.
In summary, our conclusion relating surface chemistry (SrO formation and Sr-enrichment at the surface) to grain orientation is clear and quantitatively shown. Our inference of the effect of such grain-dependent SrO formation on ORR kinetics is indirect but based on clearly demonstrated literature work relating excess SrO at the surface to degradation of ORR kinetics. We believe that this inference may stimulate more work in the field by developing new experimental capabilities that can unequivocally probe ORR kinetics grain by grain.
4. Conclusions
LSC64 pellets were produced and subjected to annealing at 800 °C in stagnant air for 2 h and 5 h to drive the surface cation segregation. The chemical composition of the pellets' surface and the secondary precipitates on their surface was characterized by XPS and AES. Sr enrichment was determined on the pellets' surface upon annealing, where the precipitates are almost completely composed of Sr and oxygen. The effect of crystal orientation on dopant cation segregation on LSC64 pellets was quantified by SEM and EBSD. Statistical evaluation of the SEM-EBSD study revealed that all grain orientations have a very similar precipitation tendency in terms of number density. The number density of the Sr-rich precipitates on grains was determined to be in the range of 1–60 precipitates per μm2. However, the vast majority of the grains had a narrower number density within 1–5 precipitates per μm2. The area coverage of precipitates on grains, on the other hand, showed a clear dependence on grain orientation. Grains having orientations close to {001} have more than 3 times higher area coverage of precipitates at the surface compared to the other orientations, {101} and {111}. In summary, the crystal orientation mainly plays a role in the size and growth of secondary phases (fed by Sr diffusion from the lattice to the surface). The number density of precipitates that can be correlated with nucleation sites for secondary phases is very similar for all orientations on LSC64. It is expected that the degradation and relative loss in electrochemical performance of the {001}-terminated surface would be more severe. This is because more Sr would have come out of the near-surface lattice of {001} grains. The results point out that the different grain orientations, which affect the surface energy and surface oxygen vacancy concentration due to the atomic arrangements, have a strong effect on the secondary phase precipitation.Conflicts of interest
There are no conflicts to declare.Acknowledgements
The authors gratefully acknowledge the financial support of this research from the U.S. Airforce Office of Scientific Research, project #FA9550-16-1-0427. This work used the experimental facilities at the NSF-supported Materials Research Science and Engineering Center DMR-1419807 at MIT. F. Piskin was supported by the TUBITAK 2214-A International Doctoral Research Fellowship Programme, No. 1059B141501191, and the 2211-C Doctoral Scholarship Program Intended for Priority Areas, No. 1649B031501200, which the authors gratefully acknowledge. B. Y. and F. P. acknowledge support also from the MIT International Science and Technology Initiatives Global Seed Funds.References
- L. Ge, R. Ran, K. Zhang, S. Liu and Z. Shao, J. Membr. Sci., 2008, 318, 182–190 CrossRef.
- K. Watanabe, M. Yuasa, T. Kida, K. Shimanoe, Y. Teraoka and N. Yamazoe, Solid State Ionics, 2008, 179, 1377–1381 CrossRef.
- J. Sunarso, S. Baumann, J. M. Serra, W. A. Meulenberg, S. Liu, Y. S. Lin and J. C. Diniz da Costa, J. Membr. Sci., 2008, 320, 13–41 CrossRef.
- Y. Tao, J. Shao, J. Wang and W. G. Wang, J. Power Sources, 2008, 185, 609–614 CrossRef.
- F. Cheng and J. Chen, Chem. Soc. Rev., 2012, 41, 2172–2192 RSC.
- N. Tsvetkov, Q. Lu, L. Sun, E. J. Crumlin and B. Yildiz, Nat. Mater., 2016, 15, 1010–1016 CrossRef PubMed.
- L.-W. Tai, M. M. Nasrallah, H. U. Anderson, D. M. Sparlin and S. R. Sehlin, Solid State Ionics, 1995, 76, 259–271 CrossRef.
- Z. Gao, L. V. Mogni, E. C. Miller, J. G. Railsback and S. A. Barnett, Energy Environ. Sci., 2016, 9, 1602–1644 RSC.
- D. J. L. Brett, A. Atkinson, N. P. Brandon and S. J. Skinner, Chem. Soc. Rev., 2008, 37, 1568–1578 RSC.
- G. M. Rupp, A. K. Opitz, A. Nenning, A. Limbeck and J. Fleig, Nat. Mater., 2017, 16, 640–645 CrossRef PubMed.
- Y. Chen, Z. Cai, Y. Kuru, W. Ma, H. L. Tuller and B. Yildiz, Adv. Energy Mater., 2013, 3, 1221–1229 CrossRef.
- S. P. Simner, J. F. Bonnett, N. L. Canfield, K. D. Meinhardt, J. P. Shelton, V. L. Sprenkle and J. W. Stevenson, J. Power Sources, 2003, 113, 1–10 CrossRef.
- O. A. Marina, L. R. Pederson, M. C. Williams, G. W. Coffey, K. D. Meinhardt, C. D. Nguyen and E. C. Thomsen, J. Electrochem. Soc., 2007, 154, B452–B459 CrossRef.
- S. P. Jiang, J. Mater. Sci., 2008, 43, 6799–6833 CrossRef.
- M. J. Jørgensen and M. Mogensen, J. Electrochem. Soc., 2001, 148, A433–A442 CrossRef.
- Z. Cai, Y. Kuru, J. W. Han, Y. Chen and B. Yildiz, J. Am. Chem. Soc., 2011, 133, 17696–17704 CrossRef PubMed.
- Z. Cai, M. Kubicek, J. Fleig and B. Yildiz, Chem. Mater., 2012, 24, 1116–1127 CrossRef.
- P. Hjalmarsson, M. Søgaard and M. Mogensen, Solid State Ionics, 2008, 179, 1422–1426 CrossRef.
- M. Kubicek, A. Limbeck, T. Frömling, H. Hutter and J. Fleig, J. Electrochem. Soc., 2011, 158, B727–B734 CrossRef.
- Z. Shao and S. M. Haile, Nature, 2004, 431, 170–173 CrossRef PubMed.
- E. A. Fardin, A. S. Holland, K. Ghorbani, E. K. Akdogan, W. K. Simon, A. Safari and J. Y. Wang, Appl. Phys. Lett., 2006, 89, 182907(5) Search PubMed.
- Y. Chen, H. Téllez, M. Burriel, F. Yang, N. Tsvetkov, Z. Cai, D. W. McComb, J. A. Kilner and B. Yildiz, Chem. Mater., 2015, 27, 5436–5450 CrossRef.
- J. Hayd, H. Yokokawa and E. Ivers-Tiffee, J. Electrochem. Soc., 2013, 160, F351–F359 CrossRef.
- J. Druce, T. Ishihara and J. Kilner, Solid State Ionics, 2014, 262, 893–896 CrossRef.
- J. Druce, H. Téllez, M. Burriel, M. D. Sharp, L. J. Fawcett, S. N. Cook, D. S. McPhail, T. Ishihara, H. H. Brongersma and J. A. Kilner, Energy Environ. Sci., 2014, 7, 3593–3599 RSC.
- W. Jung and H. L. Tuller, Energy Environ. Sci., 2012, 5, 5370–5378 RSC.
- W. Lee, J. W. Han, Y. Chen, Z. Cai and B. Yildiz, J. Am. Chem. Soc., 2013, 135, 7909–7925 CrossRef PubMed.
- M. M. Kuklja, E. A. Kotomin, R. Merkle, Y. A. Mastrikov and J. Maier, Phys. Chem. Chem. Phys., 2013, 15, 5443–5471 RSC.
- R. Tran, Z. Xu, B. Radhakrishnan, D. Winston, W. Sun, K. A. Persson and S. P. Ong, Sci. Data, 2016, 3, 160080(13) Search PubMed.
- Y.-L. Lee and D. Morgan, Phys. Rev. B: Condens. Matter Mater. Phys., 2015, 91, 195430(26) Search PubMed.
- E. Bucher, C. Gspan, F. Hofer and W. Sitte, Solid State Ionics, 2013, 238, 15–23 CrossRef.
- D. P. Field, Ultramicroscopy, 1997, 67, 1–9 CrossRef.
- M. Niania, R. Podor, T. Ben Britton, C. Li, S. Cooper, N. Svetkov, S. Skinner and J. Kilner, J. Mater. Chem. A, 2018 10.1039/c8ta01293h.
- G. M. Rupp, H. Téllez, J. Druce, A. Limbeck, T. Ishihara, J. Kilner and J. Fleig, J. Mater. Chem. A, 2015, 3, 22759–22769 RSC.
- H. Téllez, J. Druce, Y.-W. Ju, J. Kilner and T. Ishihara, Int. J. Hydrogen Energy, 2014, 39, 20856–20863 CrossRef.
Footnote |
| † Electronic supplementary information (ESI) available. See DOI: 10.1039/c8ta01293h |
| This journal is © The Royal Society of Chemistry 2018 |